Estimated zip code population in 2022: 45,381 Zip code population in 2010: 42,209 Zip code population in 2000: 41,680
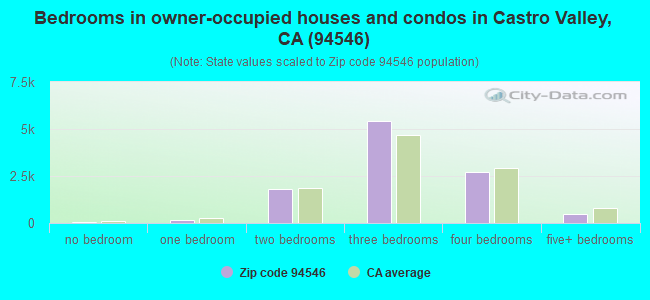
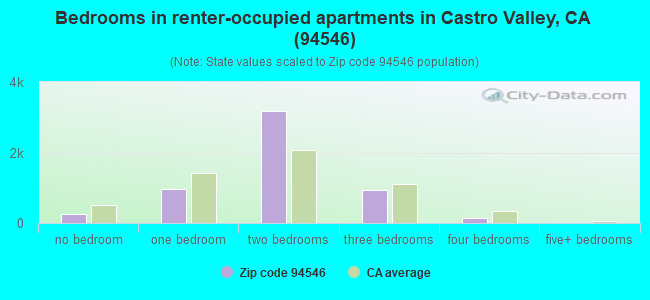
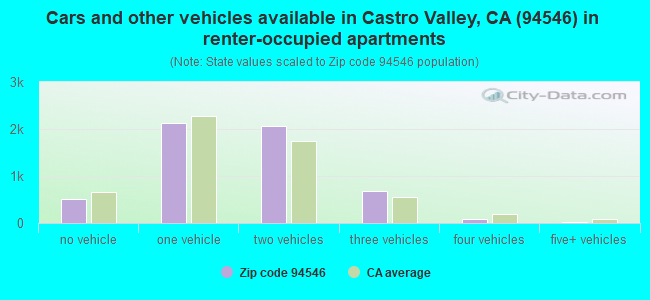
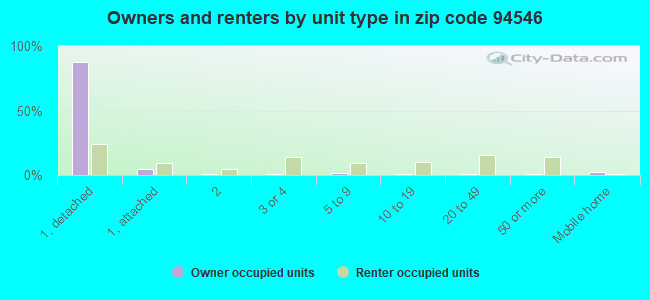
Houses and condos: 16,660 Renter-occupied apartments: 5,520
% of renters here:
34%
State:
44%
March 2022 cost of living index in zip code 94546: 119.9 (more than average, U.S. average is 100)
Land area: 9.4 sq. mi. Water area: 0.3 sq. mi.
Population density: 4,816 people per square mile
(average).
OSM Map
General Map
Google Map
MSN Map
OSM Map
General Map
Google Map
MSN Map
OSM Map
General Map
Google Map
MSN Map
OSM Map
General Map
Google Map
MSN Map
Please wait while loading the map...
Real estate property taxes paid for housing units in 2022:
This zip code:
0.7% ($6,706)
California:
0.7% ($4,831)
Median real estate property taxes paid for housing units with mortgages in 2022: $7,544 (0.7%) Median real estate property taxes paid for housing units with no mortgage in 2022: $4,894 (0.5%)
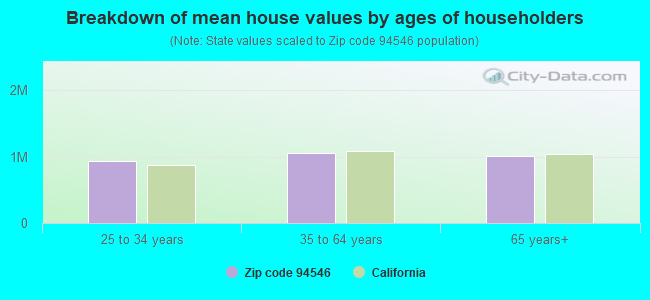
Estimated median house/condo value in 2022: $1,016,029
94546:
$1,016,029
California:
$715,900
According to our research of California and other state lists, there were 25 registered sex offenders living in 94546 zip code as of April 26, 2024. The ratio of all residents to sex offenders in zip code 94546 is 1,764 to 1. The ratio of registered sex offenders to all residents in this zip code is lower than the state average.
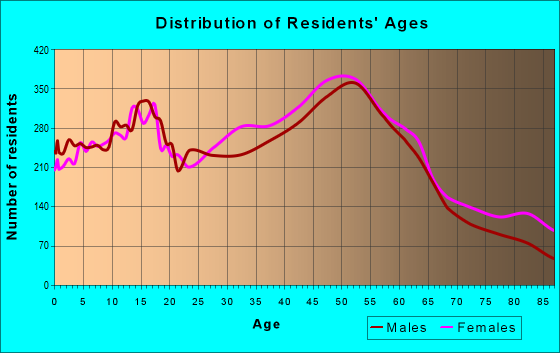
Median resident age:
This zip code:
43.0 years
California median age:
37.9 years
Average household size:
This zip code:
2.8 people
California:
2.8 people
Averages for the 2020 tax year for zip code 94546, filed in 2021:
Average Adjusted Gross Income (AGI) in 2020: $101,223 (Individual Income Tax Returns)
Here:
$101,223
State:
$95,910
Salary/wage: $91,154 (reported on 79.9% of returns)
Here:
$91,154
State:
$77,331
(% of AGI for various income ranges: 1207.4% for AGIs below $25k, 3870.9% for AGIs $25k-50k, 7386.7% for AGIs $50k-75k, 10718.5% for AGIs $75k-100k, 21007.2% for AGIs $100k-200k, 84044.7% for AGIs over 200k)
Taxable interest for individuals: $1,437 (reported on 44.4% of returns)
This zip code:
$1,437
California:
$2,294
(% of AGI for various income ranges: 29.2% for AGIs below $25k, 39.7% for AGIs $25k-50k, 73.5% for AGIs $50k-75k, 97.7% for AGIs $75k-100k, 173.8% for AGIs $100k-200k, 651.0% for AGIs over 200k)
Ordinary dividends: $5,054 (reported on 28.0% of returns)
Here:
$5,054
State:
$10,949
(% of AGI for various income ranges: 43.2% for AGIs below $25k, 69.9% for AGIs $25k-50k, 118.4% for AGIs $50k-75k, 192.7% for AGIs $75k-100k, 354.1% for AGIs $100k-200k, 1836.0% for AGIs over 200k)
Net capital gain/loss in AGI: +$21,397 (reported on 27.1% of returns)
Here:
+$21,397
State:
+$49,306
(% of AGI for various income ranges: 19.9% for AGIs below $25k, 60.8% for AGIs $25k-50k, 119.3% for AGIs $50k-75k, 212.9% for AGIs $75k-100k, 625.2% for AGIs $100k-200k, 13467.7% for AGIs over 200k)
Profit/loss from business: +$16,404 (reported on 17.2% of returns)
Here:
+$16,404
State:
+$15,671
(% of AGI for various income ranges: 167.1% for AGIs below $25k, 292.8% for AGIs $25k-50k, 387.5% for AGIs $50k-75k, 419.6% for AGIs $75k-100k, 685.7% for AGIs $100k-200k, 2462.0% for AGIs over 200k)
Taxable individual retirement arrangement distribution: $19,596 (reported on 8.6% of returns)
94546:
$19,596
California:
$23,505
(% of AGI for various income ranges: 63.1% for AGIs below $25k, 104.3% for AGIs $25k-50k, 211.5% for AGIs $50k-75k, 351.3% for AGIs $75k-100k, 597.2% for AGIs $100k-200k, 1144.2% for AGIs over 200k)
Self-employed (Keogh) retirement plans: $19,214 (reported on 1.0% of returns)
94546:
$19,214
California:
$30,163
(% of AGI for various income ranges: 31.1% for AGIs $50k-75k, 46.6% for AGIs $100k-200k, 295.4% for AGIs over 200k)
Total itemized deductions: $33,917 (reported on 20.9% of returns)
Here:
$33,917
State:
$39,517
(% of AGI for various income ranges: 170.5% for AGIs below $25k, 345.8% for AGIs $25k-50k, 652.7% for AGIs $50k-75k, 1018.1% for AGIs $75k-100k, 2129.4% for AGIs $100k-200k, 8039.0% for AGIs over 200k)
Charity contributions: $5,235 (reported on 16.3% of returns)
Here:
$5,235
State:
$12,598
(% of AGI for various income ranges: 6.2% for AGIs below $25k, 29.3% for AGIs $25k-50k, 60.1% for AGIs $50k-75k, 104.8% for AGIs $75k-100k, 265.5% for AGIs $100k-200k, 1115.9% for AGIs over 200k)
Taxes paid: $9,085 (reported on 20.9% of returns)
94546:
$9,085
State:
$8,807
(% of AGI for various income ranges: 33.1% for AGIs below $25k, 77.9% for AGIs $25k-50k, 175.2% for AGIs $50k-75k, 314.6% for AGIs $75k-100k, 669.5% for AGIs $100k-200k, 1848.9% for AGIs over 200k)
Earned income credit: $1,735 (reported on 7.9% of returns)
Here:
$1,735
State:
$2,074
(% of AGI for various income ranges: 60.8% for AGIs below $25k, 47.1% for AGIs $25k-50k, 0.9% for AGIs $50k-75k)
Percentage of individuals using paid preparers for their 2020 taxes: 91.6%
Here:
92%
State:
92%
(% for various income ranges: 89.2% for AGIs below $25k, 91.1% for AGIs $25k-50k, 92.0% for AGIs $50k-75k, 92.5% for AGIs $75k-100k, 92.2% for AGIs $100k-200k, 94.2% for AGIs over 200k)
Averages for the 2012 tax year for zip code 94546, filed in 2013:
Average Adjusted Gross Income (AGI) in 2012: $68,958 (Individual Income Tax Returns)
Here:
$68,958
State:
$72,726
Salary/wage: $63,078 (reported on 80.1% of returns)
Here:
$63,078
State:
$59,079
(% of AGI for various income ranges: 66.3% for AGIs below $25k, 74.5% for AGIs $25k-50k, 74.8% for AGIs $50k-75k, 74.8% for AGIs $75k-100k, 78.5% for AGIs $100k-200k, 62.3% for AGIs over 200k)
Taxable interest for individuals: $1,212 (reported on 44.3% of returns)
This zip code:
$1,212
California:
$2,146
(% of AGI for various income ranges: 1.8% for AGIs below $25k, 0.8% for AGIs $25k-50k, 0.7% for AGIs $50k-75k, 0.8% for AGIs $75k-100k, 0.6% for AGIs $100k-200k, 0.8% for AGIs over 200k)
Ordinary dividends: $4,177 (reported on 24.8% of returns)
Here:
$4,177
State:
$9,308
(% of AGI for various income ranges: 2.4% for AGIs below $25k, 1.5% for AGIs $25k-50k, 1.4% for AGIs $50k-75k, 1.5% for AGIs $75k-100k, 1.2% for AGIs $100k-200k, 2.0% for AGIs over 200k)
Net capital gain/loss in AGI: +$7,297 (reported on 20.8% of returns)
Here:
+$7,297
State:
+$30,460
(% of AGI for various income ranges: 0.4% for AGIs $50k-75k, 0.4% for AGIs $75k-100k, 1.0% for AGIs $100k-200k, 9.3% for AGIs over 200k)
Profit/loss from business: +$19,634 (reported on 16.9% of returns)
Here:
+$19,634
State:
+$17,064
(% of AGI for various income ranges: 11.3% for AGIs below $25k, 6.4% for AGIs $25k-50k, 5.4% for AGIs $50k-75k, 3.3% for AGIs $75k-100k, 3.7% for AGIs $100k-200k, 5.0% for AGIs over 200k)
Taxable individual retirement arrangement distribution: $15,376 (reported on 10.2% of returns)
94546:
$15,376
California:
$19,557
(% of AGI for various income ranges: 3.3% for AGIs below $25k, 2.4% for AGIs $25k-50k, 2.5% for AGIs $50k-75k, 2.2% for AGIs $75k-100k, 2.1% for AGIs $100k-200k, 2.2% for AGIs over 200k)
Self-employment retirement plans: $14,027 (reported on 1.0% of returns)
94546:
$14,027
California:
$24,530
(% of AGI for various income ranges: 0.2% for AGIs $25k-50k, 0.2% for AGIs $75k-100k, 0.2% for AGIs $100k-200k, 0.4% for AGIs over 200k)
Total itemized deductions: $27,527 (24% of AGI, reported on 42.5% of returns)
Here:
$27,527
State:
$34,004
Here:
24.2% of AGI
State:
22.7% of AGI
(% of AGI for various income ranges: 16.9% for AGIs below $25k, 12.1% for AGIs $25k-50k, 14.7% for AGIs $50k-75k, 17.9% for AGIs $75k-100k, 19.1% for AGIs $100k-200k, 16.8% for AGIs over 200k)
Charity contributions: $2,963 (reported on 35.0% of returns)
Here:
$2,963
State:
$4,659
(% of AGI for various income ranges: 0.8% for AGIs below $25k, 1.1% for AGIs $25k-50k, 1.3% for AGIs $50k-75k, 1.6% for AGIs $75k-100k, 1.8% for AGIs $100k-200k, 1.5% for AGIs over 200k)
Taxes paid: $10,909 (reported on 42.4% of returns)
94546:
$10,909
State:
$14,448
(% of AGI for various income ranges: 3.4% for AGIs below $25k, 3.0% for AGIs $25k-50k, 4.4% for AGIs $50k-75k, 6.1% for AGIs $75k-100k, 8.0% for AGIs $100k-200k, 9.6% for AGIs over 200k)
Earned income credit: $1,835 (reported on 11.1% of returns)
Here:
$1,835
State:
$2,286
(% of AGI for various income ranges: 4.1% for AGIs below $25k, 0.7% for AGIs $25k-50k)
Percentage of individuals using paid preparers for their 2012 taxes: 56.7%
Here:
57%
State:
64%
(% for various income ranges: 50.9% for AGIs below $25k, 56.1% for AGIs $25k-50k, 58.2% for AGIs $50k-75k, 62.1% for AGIs $75k-100k, 60.2% for AGIs $100k-200k, 67.9% for AGIs over 200k)
Averages for the 2004 tax year for zip code 94546, filed in 2005:
Average Adjusted Gross Income (AGI) in 2004: $58,546 (Individual Income Tax Returns)
Here:
$58,546
State:
$58,600
Salary/wage: $54,035 (reported on 78.9% of returns)
Here:
$54,035
State:
$49,455
(% of AGI for various income ranges: 236.8% for AGIs below $10k, 63.0% for AGIs $10k-25k, 75.9% for AGIs $25k-50k, 76.8% for AGIs $50k-75k, 78.8% for AGIs $75k-100k, 67.6% for AGIs over 100k)
Taxable interest for individuals: $1,976 (reported on 57.1% of returns)
This zip code:
$1,976
California:
$2,365
(% of AGI for various income ranges: 25.7% for AGIs below $10k, 4.1% for AGIs $10k-25k, 1.9% for AGIs $25k-50k, 1.8% for AGIs $50k-75k, 1.4% for AGIs $75k-100k, 1.7% for AGIs over 100k)
Taxable dividends: $2,669 (reported on 31.2% of returns)
Here:
$2,669
State:
$4,746
(% of AGI for various income ranges: 17.0% for AGIs below $10k, 2.6% for AGIs $10k-25k, 1.5% for AGIs $25k-50k, 1.3% for AGIs $50k-75k, 1.1% for AGIs $75k-100k, 1.3% for AGIs over 100k)
Net capital gain/loss: +$11,600 (reported on 25.8% of returns)
Here:
+$11,600
State:
+$23,418
(% of AGI for various income ranges: -9.4% for AGIs below $10k, 0.1% for AGIs $10k-25k, 0.4% for AGIs $25k-50k, 0.6% for AGIs $50k-75k, 1.3% for AGIs $75k-100k, 10.7% for AGIs over 100k)
Profit/loss from business: +$19,251 (reported on 16.7% of returns)
Here:
+$19,251
State:
+$16,826
(% of AGI for various income ranges: -3.3% for AGIs below $10k, 9.0% for AGIs $10k-25k, 5.1% for AGIs $25k-50k, 4.5% for AGIs $50k-75k, 4.4% for AGIs $75k-100k, 6.1% for AGIs over 100k)
IRA payment deduction: $3,189 (reported on 3.1% of returns)
94546:
$3,189
California:
$3,192
(% of AGI for various income ranges: 0.6% for AGIs below $10k, 0.2% for AGIs $10k-25k, 0.3% for AGIs $25k-50k, 0.2% for AGIs $50k-75k, 0.2% for AGIs $75k-100k, 0.1% for AGIs over 100k)
Self-employed pension: $12,616 (reported on 1.7% of returns)
Here:
$12,616
California:
$17,688
(% of AGI for various income ranges: 0.1% for AGIs $10k-25k, 0.2% for AGIs $25k-50k, 0.2% for AGIs $50k-75k, 0.3% for AGIs $75k-100k, 0.6% for AGIs over 100k)
Total itemized deductions: $24,912 (27% of AGI, reported on 45.7% of returns)
Here:
$24,912
State:
$28,113
Here:
27.0% of AGI
State:
25.3% of AGI
(% of AGI for various income ranges: 80.2% for AGIs below $10k, 16.9% for AGIs $10k-25k, 15.3% for AGIs $25k-50k, 19.5% for AGIs $50k-75k, 21.9% for AGIs $75k-100k, 19.7% for AGIs over 100k)
Charity contributions deductions: $2,839 (3% of AGI, reported on 39.9% of returns)
Here:
$2,839
State:
$3,923
Here:
3.0% of AGI
State:
3.3% of AGI
(% of AGI for various income ranges: 3.2% for AGIs below $10k, 1.2% for AGIs $10k-25k, 1.4% for AGIs $25k-50k, 1.7% for AGIs $50k-75k, 2.1% for AGIs $75k-100k, 2.2% for AGIs over 100k)
Total tax: $8,435 (reported on 84.2% of returns)
94546:
$8,435
State:
$10,761
(% of AGI for various income ranges: 11.5% for AGIs below $10k, 5.3% for AGIs $10k-25k, 8.1% for AGIs $25k-50k, 9.9% for AGIs $50k-75k, 10.5% for AGIs $75k-100k, 15.8% for AGIs over 100k)
Earned income credit: $1,449 (reported on 7.0% of returns)
Here:
$1,449
State:
$1,763
Percentage of individuals using paid preparers for their 2004 taxes: 61.6%
Here:
62%
State:
66%
(% for various income ranges: 51.8% for AGIs below $10k, 61.6% for AGIs $10k-25k, 60.1% for AGIs $25k-50k, 65.1% for AGIs $50k-75k, 63.4% for AGIs $75k-100k, 67.9% for AGIs over 100k)
Likely homosexual households (counted as self-reported same-sex unmarried-partner households)
Lesbian couples: 0.1% of all households
Gay men: 0.3% of all households
Household received Food Stamps/SNAP in the past 12 months: 1,246 Household did not receive Food Stamps/SNAP in the past 12 months: 14,756
Women who had a birth in the past 12 months: 480 (350 now married, 129 unmarried) Women who did not have a birth in the past 12 months: 10,209 (4,563 now married, 5,625 unmarried)
Housing units in zip code 94546 with a mortgage: 7,221 (767 second mortgage, 33 home equity loan, 628 both second mortgage and home equity loan) Houses without a mortgage: 117
Median monthly owner costs for units with a mortgage: $3,100 Median monthly owner costs for units without a mortgage: $834
Residents with income below the poverty level in 2022:
This zip code:
7.5%
Whole state:
12.2%
Residents with income below 50% of the poverty level in 2022:
This zip code:
3.5%
Whole state:
6.2%
Median number of rooms in houses and condos:
Here:
6.2
State:
6.0
Median number of rooms in apartments:
Here:
4.0
State:
3.9
Notable locations in this zip code not listed on our city pages
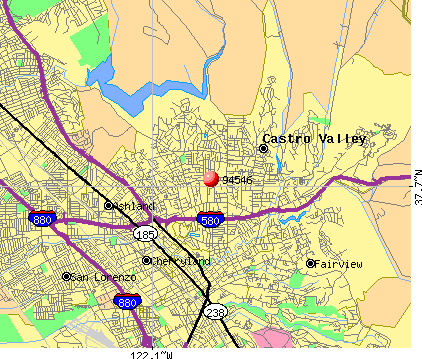
Notable locations in zip code 94546: Willow Park Golf Course (A), Castro Valley Branch Alameda County Library (B), Adobe Art Center (C), NORCAL Ambulance (D), East Bay Regional Park District Station 10 (E), Alameda County Fire Department Station 5 (F), Alameda County Fire Department Station 4 (G). Display/hide their locations on the map
Churches in zip code 94546 include: Crossroads Christian Church (A), Valley Baptist Church (B), Resurrection Greek Orthodox Church (C), Our Lady of Grace Church (D), New Life Christian Fellowship Church (E), First Presbyterian Church (F), First Christian Church (G), First Baptist Church (H), Faith Lutheran Church of Castro Valley (I). Display/hide their locations on the map
Parks in zip code 94546 include: Bay Trees Park (1), Castro Valley Community Park (2), Carlos Bee Park (3), Cull Canyon Regional Recreation Area (4). Display/hide their locations on the map
6,845 married couples with children.
1,794 single-parent households (729 men, 1,065 women).
63.0% of residents of 94546 zip code speak English at home.
10.6% of residents speak Spanish at home (71% very well, 14% well, 12% not well, 2% not at all).
4.9% of residents speak other Indo-European language at home (66% very well, 27% well, 5% not well, 2% not at all).
19.5% of residents speak Asian or Pacific Island language at home (47% very well, 27% well, 19% not well, 8% not at all).
1.8% of residents speak other language at home (59% very well, 24% well, 12% not well, 4% not at all).
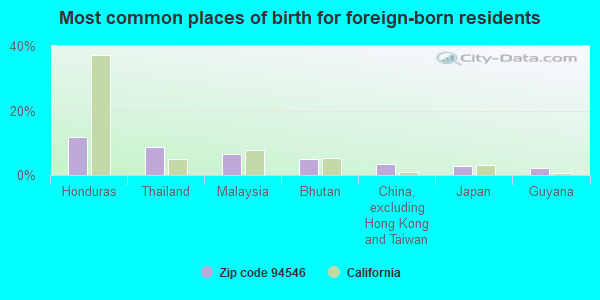
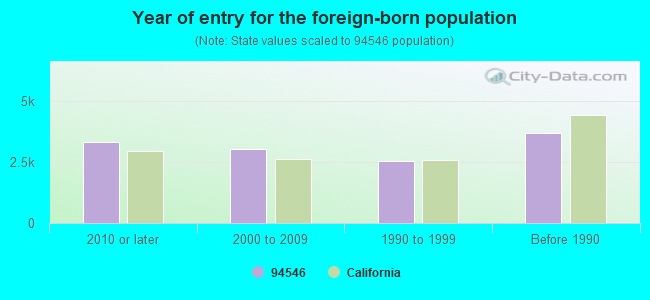
Foreign born population: 11,870 (26.2%) (66.3% of them are naturalized citizens)
Major facilities with environmental interests located in this zip code:
CASTRO VALLEY AUTOHAUS (20697 PARK WAY in CASTRO VALLEY, CA)
STATE MASTER (California - Hazardous Waste Tracking) - HAZARDOU WASTE PROGRAM Small Quantity Generators, between 100 kg and 1000 kg of hazardous waste/month (Resource Conservation and Recovery Act (tracking hazardous waste)) - notification STATE MASTER (California - Used Oil Recycling System ) - USED OIL RECYCLING Business NAICS classification: GENERAL AUTOMOTIVE REPAIR. Organizations: ROBERT BLACKMAN (CONTACT/OWNER)
EQUILON ENTERPRISES (2724 CASTRO VALLEY/LAKE CHABOT in CASTRO VALLEY, CA) . Federal Facility
STATE MASTER (California - Hazardous Waste Tracking) - HAZARDOU WASTE PROGRAM Small Quantity Generators, between 100 kg and 1000 kg of hazardous waste/month (Resource Conservation and Recovery Act (tracking hazardous waste)) - notification Organizations: EQUILON ENTERPRISES, LLC (CONTACT/OWNER)
Alternative names: SHELL OIL CO
EXPRESS PHOTO SVC (3028 CASTRO VALLEY BLVD in CASTRO VALLEY, CA)
STATE MASTER (California - Hazardous Waste Tracking) - HAZARDOU WASTE PROGRAM Small Quantity Generators, between 100 kg and 1000 kg of hazardous waste/month (Resource Conservation and Recovery Act (tracking hazardous waste)) - notification Organizations: VLADIMIR ESCOBAR (CONTACT/OWNER)
CHEVRON STATION NO 93283 (3005 GROVE WAY in CASTRO VALLEY, CA)
STATE MASTER (California - Hazardous Waste Tracking) - HAZARDOU WASTE PROGRAM Small Quantity Generators, between 100 kg and 1000 kg of hazardous waste/month (Resource Conservation and Recovery Act (tracking hazardous waste)) - notification Organizations: CHEVRON PRODUCTS CO (CONTACT/OWNER)
CHEVRON STATION NO 96991 (2920 CASTRO VALLEY BLVD in CASTRO VALLEY, CA)
STATE MASTER (California - Hazardous Waste Tracking) - HAZARDOU WASTE PROGRAM Small Quantity Generators, between 100 kg and 1000 kg of hazardous waste/month (Resource Conservation and Recovery Act (tracking hazardous waste)) - notification Organizations: CHEVRON PRODUCTS CO (CONTACT/OWNER)
JOHNSON (ROY A.) HIGH (SPECIAL ED) (4430 ALMA AVE. in CASTRO VALLEY, CA)
(National Center for Education Statistics) - STATE ID-0130047 Organizations: CASTRO VALLEY UNIFIED (SCHOOL DISTRICT)
MARSHALL ELEMENTARY (20111 MARSHALL ST. in CASTRO VALLEY, CA)
(National Center for Education Statistics) - STATE ID-6090401 Organizations: CASTRO VALLEY UNIFIED (SCHOOL DISTRICT)
CHABOT ELEMENTARY (19104 LAKE CHABOT ROAD in CASTRO VALLEY, CA)
(National Center for Education Statistics) - STATE ID-6090369 Organizations: CASTRO VALLEY UNIFIED (SCHOOL DISTRICT)
CASTRO VALLEY ELEMENTARY (20185 SAN MIGUEL AVE. in CASTRO VALLEY, CA)
(National Center for Education Statistics) - STATE ID-6090351 Organizations: CASTRO VALLEY UNIFIED (SCHOOL DISTRICT)
CASTRO VALLEY HIGH (19400 SANTA MARIA AVE. in CASTRO VALLEY, CA)
(National Center for Education Statistics) - STATE ID-0132225 Organizations: CASTRO VALLEY UNIFIED (SCHOOL DISTRICT)
CALTRANS (21195 CENTER STREET in CASTRO VALLEY, CA)
HAZARDOUS WASTE BIENNIAL REPORTER (Resource Conservation and Recovery Act (tracking hazardous waste)) Large Quantity Generators, more that 1000 kg of hazardous waste/month (Resource Conservation and Recovery Act (tracking hazardous waste)) Organizations: STATE OF CALIFORNIA (CONTACT/OPERATOR)
Alternative names: CALTRANS DISTRICT 4
MIRANDES ONE HOUR CLEANERS (21120 REDWOOD RD in CASTRO VALLEY, CA)
(Resource Conservation and Recovery Act (tracking hazardous waste)) Organizations: MIRANDE GEORGE (CONTACT/OWNER)
CALTRANS DIST 4 (235 AND 185 SEPARATION TO in CASTRO VALLEY, CA)
Large Quantity Generators, more that 1000 kg of hazardous waste/month (Resource Conservation and Recovery Act (tracking hazardous waste)) - notification
Housing units lacking complete plumbing facilities: 0.3% Housing units lacking complete kitchen facilities: 0.5%
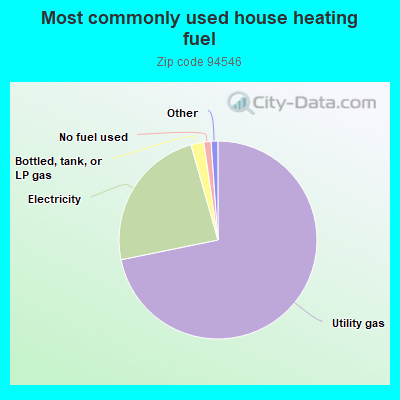
71.8%Utility gas
23.8%Electricity
2.1%Bottled, tank, or LP gas
1.2%No fuel used
Population in 1990: 37,808. Population change in the 1990s: +3,872 (+10.2%).
Place of birth for U.S.-born residents:
This state: 28,024
Northeast: 1,095
Midwest: 1,396
South: 1,515
West: 960
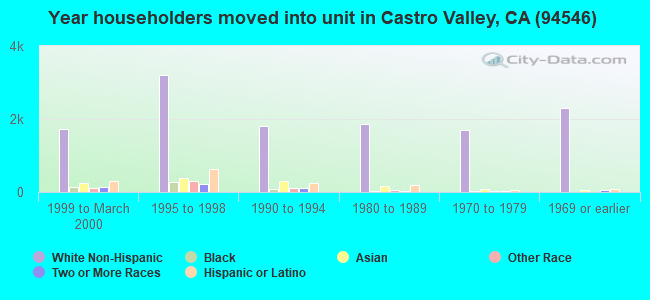
57% of the 94546 zip code residents lived in the same house 5 years ago. Out of people who lived in different houses, 68% lived in this county. Out of people who lived in different counties, 50% lived in California.
91% of the 94546 zip code residents lived in the same house 1 year ago. Out of people who lived in different houses, 60% moved from this county. Out of people who lived in different houses, 29% moved from different county within same state. Out of people who lived in different houses, 9% moved from different state. Out of people who lived in different houses, 2% moved from abroad.
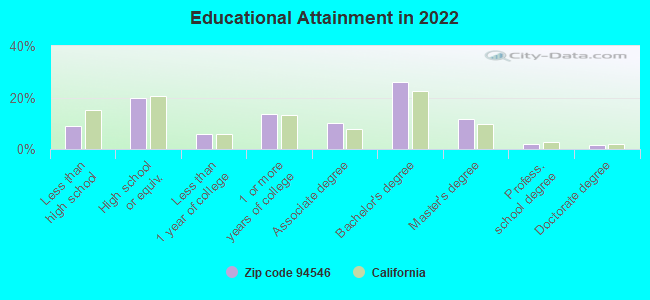
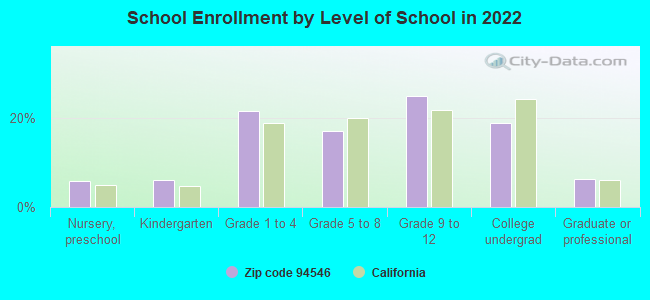
Private vs. public school enrollment:
Students in private schools in grades 1 to 8 (elementary and middle school): 271
Here:
6.9%
California:
10.5%
Students in private schools in grades 9 to 12 (high school): 241
Here:
9.4%
California:
8.5%
Students in private undergraduate colleges: 282
Here:
14.7%
California:
15.9%
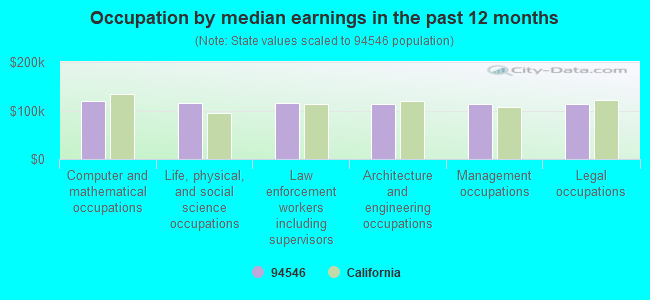
Occupation by median earnings in the past 12 months ($)
119,542Computer and mathematical occupations
116,437Life, physical, and social science occupations
115,613Law enforcement workers including supervisors
113,620Architecture and engineering occupations
113,576Management occupations
113,216Legal occupations
Companies with federal contracts located in this zip code:
TERRA INDUSTRIES INC (21646 REDWOOD RD STE A in CASTRO VALLEY, CA; small business) : $246,620 in 2 contractsin 2004
$148,830 with Forest Service for Other Environmental Services, Studies, and Analytical Support. Signed on 2004-06-07. Completion date: 2005-06-07.
$97,790 with Air Force for Landscaping/Groundskeeping Services. Taking place in WA. Signed on 2004-08-04. Completion date: 2004-11-02.
EDEN TOWNSHIP HOSPITAL (20103 LAKE CHABOT in CASTRO VALLEY, CA) : $137,650 in 5 contractsfrom 2001 to 2004
Contracts for General Health Care Services, Other Medical Services by Bureau of Prisoners/Federal Prison System Signed by year:2000: $0; 2001: $46,000; 2002: $0; 2003: $28,663; 2004: $62,987; 2005: $0; 2006: $0.
Biggest contracts:
$46,000 with Bureau of Prisoners/Federal Prison System for General Health Care Services. Signed on 2001-06-15. Completion date: 2001-06-15.
$32,996 with Bureau of Prisoners/Federal Prison System for Other Medical Services. Signed on 2004-01-28. Effective on 2004-01-24. Completion date: 2004-01-24.
$29,462, same as above.Signed on 2004-09-28. Completion date: 2004-09-30.
$28,663, same as above.Signed on 2003-06-15. Completion date: 2003-07-15.
INTEGRITY SALES, INC (18810 PARSONS AVE in CASTRO VALLEY, CA; small business) : $8,723 in 2 contractsin 2005
$5,445 with Navy for ADP Support Equipment. Signed on 2005-07-25. Completion date: 2005-08-02.
$3,278, same as above.Signed on 2005-12-21. Completion date: 2006-01-13.
Top industries in this zip code by the number of employees in 2005:
Health Care and Social Assistance: General Medical and Surgical Hospitals (over 1000 employees: 1 establishment)
2005 - 2018 National Fire Incident Reporting System (NFIRS) incidents
According to the data from the years 2005 - 2018 the average number of fire incidents per year is 73. The highest number of reported fires - 130 took place in 2005, and the least - 1 in 2014. The data has a declining trend.
When looking into fire subcategories, the most reports belonged to: Structure Fires (37.8%), and Outside Fires (34.9%).
Fire incident types reported to NFIRS in Zip Code 94546
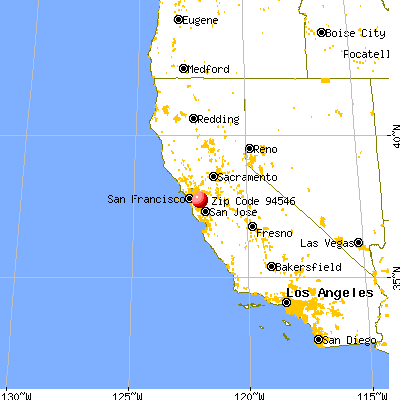


 Nearest zip codes: 94541, 94578, 94552, 94580, 94542, 94579.
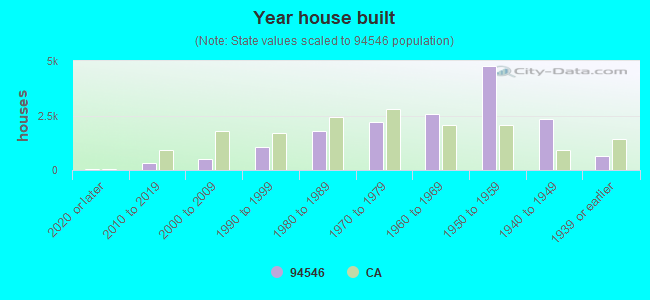


 According to the data from the years 2005 - 2018 the average number of fire incidents per year is 73. The highest number of reported fires - 130 took place in 2005, and the least - 1 in 2014. The data has a declining trend.
 When looking into fire subcategories, the most reports belonged to: Structure Fires (37.8%), and Outside Fires (34.9%).