Estimated zip code population in 2022: 14,823 Zip code population in 2010: 14,454 Zip code population in 2000: 13,202
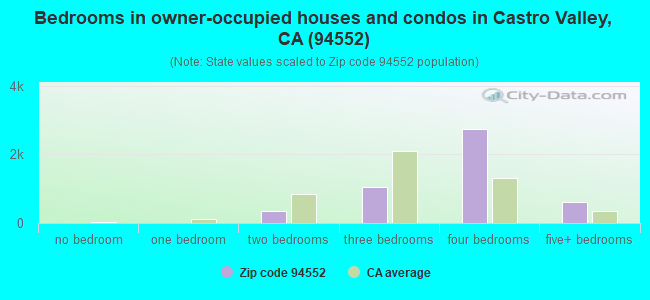
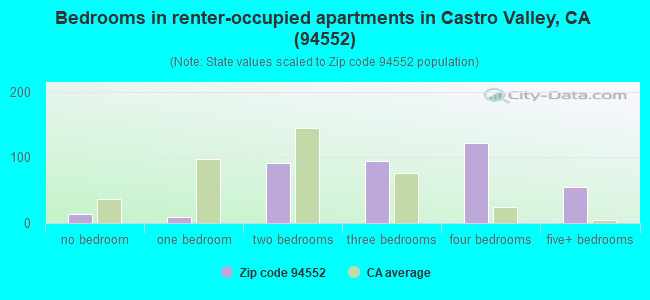
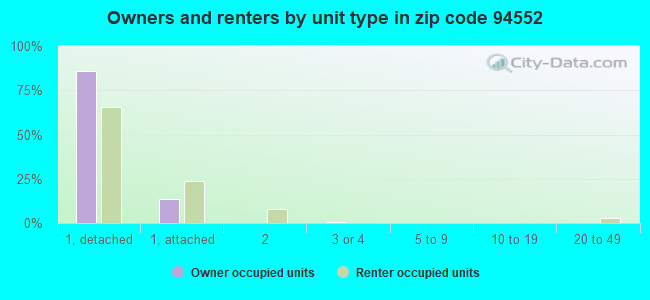
Houses and condos: 5,139 Renter-occupied apartments: 380
% of renters here:
7%
State:
44%
March 2022 cost of living index in zip code 94552: 120.0 (high, U.S. average is 100)
Land area: 44.9 sq. mi. Water area: 0.0 sq. mi.
Population density: 330 people per square mile
(very low).
OSM Map
General Map
Google Map
MSN Map
OSM Map
General Map
Google Map
MSN Map
OSM Map
General Map
Google Map
MSN Map
OSM Map
General Map
Google Map
MSN Map
Please wait while loading the map...
Real estate property taxes paid for housing units in 2022:
This zip code:
0.7% ($9,381)
California:
0.7% ($4,831)
Median real estate property taxes paid for housing units with mortgages in 2022: $9,828 (0.7%) Median real estate property taxes paid for housing units with no mortgage in 2022: $9,033 (0.7%)
Business Search- 14 Million verified businesses
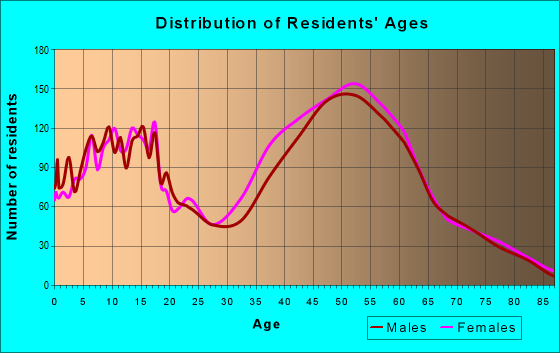
Males: 7,040
(47.5%)
Females: 7,783
(52.5%)
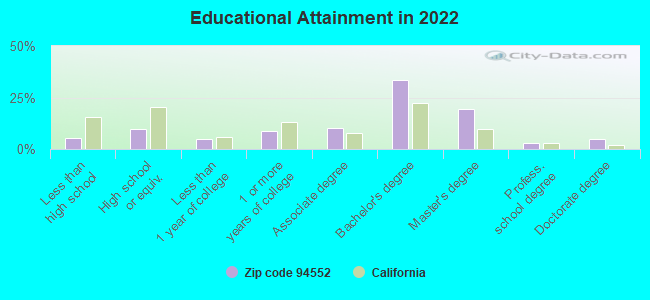
For population 25 years and over in 94552:
High school or higher: 96.1%
Bachelor's degree or higher: 61.8%
Graduate or professional degree: 27.9%
Unemployed: 3.7%
Mean travel time to work (commute): 33.0 minutes
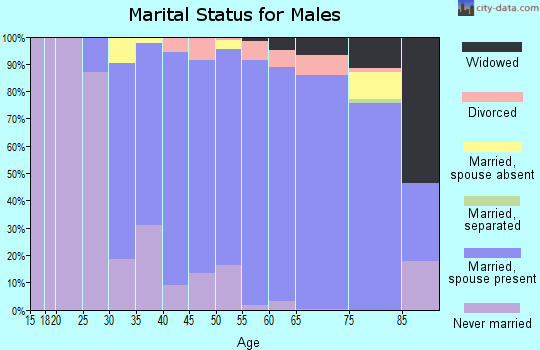
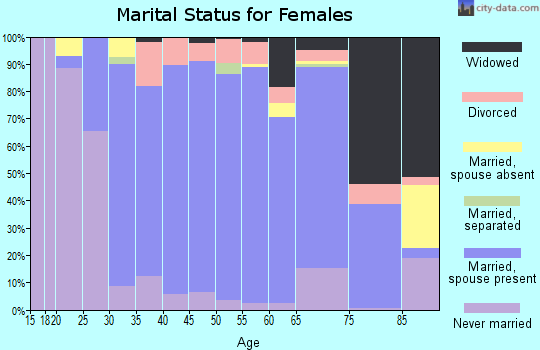
For population 15 years and over in 94552:
Never married: 25.9%
Now married: 62.5%
Separated: 1.6%
Widowed: 6.1%
Divorced: 3.9%
Zip code 94552 compared to state average:
Median household income above state average.
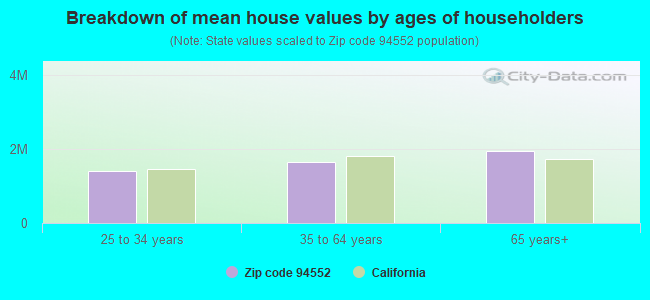
Median house value above state average.
Hispanic race population percentage significantly below state average.
Median age significantly above state average.
Renting percentage significantly below state average.
Length of stay since moving in significantly above state average.
Number of rooms per house above state average.
House age below state average.
Percentage of population with a bachelor's degree or higher above state average.
Estimated median house/condo value in 2022: $1,334,182
94552:
$1,334,182
California:
$715,900
According to our research of California and other state lists, there were 2 registered sex offenders living in 94552 zip code as of April 27, 2024. The ratio of all residents to sex offenders in zip code 94552 is 7,533 to 1. The ratio of registered sex offenders to all residents in this zip code is much lower than the state average.
Median resident age:
This zip code:
49.6 years
California median age:
37.9 years
Average household size:
This zip code:
2.9 people
California:
2.8 people
Averages for the 2020 tax year for zip code 94552, filed in 2021:
Average Adjusted Gross Income (AGI) in 2020: $162,750 (Individual Income Tax Returns)
Here:
$162,750
State:
$95,910
Salary/wage: $142,829 (reported on 78.4% of returns)
Here:
$142,829
State:
$77,331
(% of AGI for various income ranges: 1182.2% for AGIs below $25k, 3877.2% for AGIs $25k-50k, 6758.8% for AGIs $50k-75k, 10644.4% for AGIs $75k-100k, 20326.9% for AGIs $100k-200k, 103583.8% for AGIs over 200k)
Taxable interest for individuals: $2,501 (reported on 60.9% of returns)
This zip code:
$2,501
California:
$2,294
(% of AGI for various income ranges: 48.0% for AGIs below $25k, 103.1% for AGIs $25k-50k, 153.1% for AGIs $50k-75k, 264.7% for AGIs $75k-100k, 318.6% for AGIs $100k-200k, 1124.5% for AGIs over 200k)
Ordinary dividends: $7,174 (reported on 47.6% of returns)
Here:
$7,174
State:
$10,949
(% of AGI for various income ranges: 82.8% for AGIs below $25k, 150.4% for AGIs $25k-50k, 279.0% for AGIs $50k-75k, 406.2% for AGIs $75k-100k, 601.8% for AGIs $100k-200k, 2978.7% for AGIs over 200k)
Net capital gain/loss in AGI: +$29,425 (reported on 45.2% of returns)
Here:
+$29,425
State:
+$49,306
(% of AGI for various income ranges: 63.9% for AGIs below $25k, 108.5% for AGIs $25k-50k, 285.5% for AGIs $50k-75k, 363.1% for AGIs $75k-100k, 975.1% for AGIs $100k-200k, 15982.5% for AGIs over 200k)
Profit/loss from business: +$29,862 (reported on 17.7% of returns)
Here:
+$29,862
State:
+$15,671
(% of AGI for various income ranges: 151.9% for AGIs below $25k, 328.1% for AGIs $25k-50k, 281.4% for AGIs $50k-75k, 617.2% for AGIs $75k-100k, 885.1% for AGIs $100k-200k, 4684.0% for AGIs over 200k)
Taxable individual retirement arrangement distribution: $25,799 (reported on 12.4% of returns)
94552:
$25,799
California:
$23,505
(% of AGI for various income ranges: 98.0% for AGIs below $25k, 211.1% for AGIs $25k-50k, 395.2% for AGIs $50k-75k, 725.0% for AGIs $75k-100k, 996.5% for AGIs $100k-200k, 1717.5% for AGIs over 200k)
Self-employed (Keogh) retirement plans: $23,994 (reported on 2.2% of returns)
94552:
$23,994
California:
$30,163
(% of AGI for various income ranges: 55.5% for AGIs $50k-75k, 71.2% for AGIs $100k-200k, 568.9% for AGIs over 200k)
Total itemized deductions: $36,860 (reported on 29.2% of returns)
Here:
$36,860
State:
$39,517
(% of AGI for various income ranges: 214.9% for AGIs below $25k, 569.4% for AGIs $25k-50k, 900.2% for AGIs $50k-75k, 1348.1% for AGIs $75k-100k, 2661.2% for AGIs $100k-200k, 8099.4% for AGIs over 200k)
Charity contributions: $8,017 (reported on 24.1% of returns)
Here:
$8,017
State:
$12,598
(% of AGI for various income ranges: 8.1% for AGIs below $25k, 45.6% for AGIs $25k-50k, 79.0% for AGIs $50k-75k, 163.4% for AGIs $75k-100k, 371.8% for AGIs $100k-200k, 1830.8% for AGIs over 200k)
Taxes paid: $9,550 (reported on 29.2% of returns)
94552:
$9,550
State:
$8,807
(% of AGI for various income ranges: 49.7% for AGIs below $25k, 135.2% for AGIs $25k-50k, 221.4% for AGIs $50k-75k, 422.5% for AGIs $75k-100k, 744.5% for AGIs $100k-200k, 1998.3% for AGIs over 200k)
Earned income credit: $1,469 (reported on 4.0% of returns)
Here:
$1,469
State:
$2,074
(% of AGI for various income ranges: 35.8% for AGIs below $25k, 29.8% for AGIs $25k-50k)
Percentage of individuals using paid preparers for their 2020 taxes: 90.5%
Here:
90%
State:
92%
(% for various income ranges: 89.4% for AGIs below $25k, 86.8% for AGIs $25k-50k, 89.9% for AGIs $50k-75k, 90.5% for AGIs $75k-100k, 90.8% for AGIs $100k-200k, 92.8% for AGIs over 200k)
Averages for the 2012 tax year for zip code 94552, filed in 2013:
Average Adjusted Gross Income (AGI) in 2012: $118,418 (Individual Income Tax Returns)
Here:
$118,418
State:
$72,726
Salary/wage: $105,818 (reported on 82.4% of returns)
Here:
$105,818
State:
$59,079
(% of AGI for various income ranges: 73.7% for AGIs below $25k, 65.0% for AGIs $25k-50k, 71.8% for AGIs $50k-75k, 66.2% for AGIs $75k-100k, 79.1% for AGIs $100k-200k, 71.7% for AGIs over 200k)
Taxable interest for individuals: $1,914 (reported on 61.6% of returns)
This zip code:
$1,914
California:
$2,146
(% of AGI for various income ranges: 2.7% for AGIs below $25k, 1.8% for AGIs $25k-50k, 1.3% for AGIs $50k-75k, 1.4% for AGIs $75k-100k, 0.7% for AGIs $100k-200k, 1.0% for AGIs over 200k)
Ordinary dividends: $5,323 (reported on 43.1% of returns)
Here:
$5,323
State:
$9,308
(% of AGI for various income ranges: 4.2% for AGIs below $25k, 2.3% for AGIs $25k-50k, 1.9% for AGIs $50k-75k, 2.5% for AGIs $75k-100k, 1.5% for AGIs $100k-200k, 2.0% for AGIs over 200k)
Net capital gain/loss in AGI: +$6,465 (reported on 36.5% of returns)
Here:
+$6,465
State:
+$30,460
(% of AGI for various income ranges: 1.2% for AGIs below $25k, 0.6% for AGIs $100k-200k, 3.8% for AGIs over 200k)
Profit/loss from business: +$28,771 (reported on 19.6% of returns)
Here:
+$28,771
State:
+$17,064
(% of AGI for various income ranges: 9.1% for AGIs below $25k, 11.3% for AGIs $25k-50k, 6.0% for AGIs $50k-75k, 6.3% for AGIs $75k-100k, 4.1% for AGIs $100k-200k, 4.2% for AGIs over 200k)
Taxable individual retirement arrangement distribution: $19,816 (reported on 10.9% of returns)
94552:
$19,816
California:
$19,557
(% of AGI for various income ranges: 3.2% for AGIs below $25k, 4.4% for AGIs $25k-50k, 3.1% for AGIs $50k-75k, 3.2% for AGIs $75k-100k, 2.2% for AGIs $100k-200k, 0.9% for AGIs over 200k)
Self-employment retirement plans: $20,688 (reported on 2.5% of returns)
94552:
$20,688
California:
$24,530
(% of AGI for various income ranges: 1.1% for AGIs below $25k, 1.0% for AGIs $50k-75k, 0.4% for AGIs $100k-200k, 0.5% for AGIs over 200k)
Total itemized deductions: $37,201 (22% of AGI, reported on 62.2% of returns)
Here:
$37,201
State:
$34,004
Here:
22.0% of AGI
State:
22.7% of AGI
(% of AGI for various income ranges: 23.5% for AGIs below $25k, 21.2% for AGIs $25k-50k, 21.4% for AGIs $50k-75k, 22.7% for AGIs $75k-100k, 21.2% for AGIs $100k-200k, 17.2% for AGIs over 200k)
Charity contributions: $4,386 (reported on 54.1% of returns)
Here:
$4,386
State:
$4,659
(% of AGI for various income ranges: 0.9% for AGIs below $25k, 1.7% for AGIs $25k-50k, 1.8% for AGIs $50k-75k, 2.0% for AGIs $75k-100k, 2.0% for AGIs $100k-200k, 2.1% for AGIs over 200k)
Taxes paid: $17,232 (reported on 62.2% of returns)
94552:
$17,232
State:
$14,448
(% of AGI for various income ranges: 4.7% for AGIs below $25k, 5.7% for AGIs $25k-50k, 7.5% for AGIs $50k-75k, 8.3% for AGIs $75k-100k, 9.3% for AGIs $100k-200k, 9.6% for AGIs over 200k)
Earned income credit: $1,421 (reported on 4.9% of returns)
Here:
$1,421
State:
$2,286
(% of AGI for various income ranges: 2.0% for AGIs below $25k, 0.5% for AGIs $25k-50k)
Percentage of individuals using paid preparers for their 2012 taxes: 54.1%
Here:
54%
State:
64%
(% for various income ranges: 45.5% for AGIs below $25k, 51.8% for AGIs $25k-50k, 61.1% for AGIs $50k-75k, 55.9% for AGIs $75k-100k, 55.6% for AGIs $100k-200k, 59.8% for AGIs over 200k)
Averages for the 2004 tax year for zip code 94552, filed in 2005:
Average Adjusted Gross Income (AGI) in 2004: $92,631 (Individual Income Tax Returns)
Here:
$92,631
State:
$58,600
Salary/wage: $85,557 (reported on 82.8% of returns)
Here:
$85,557
State:
$49,455
(% of AGI for various income ranges: 165.0% for AGIs below $10k, 68.5% for AGIs $10k-25k, 71.5% for AGIs $25k-50k, 72.5% for AGIs $50k-75k, 78.3% for AGIs $75k-100k, 76.8% for AGIs over 100k)
Taxable interest for individuals: $2,020 (reported on 71.7% of returns)
This zip code:
$2,020
California:
$2,365
(% of AGI for various income ranges: 11.9% for AGIs below $10k, 5.0% for AGIs $10k-25k, 2.6% for AGIs $25k-50k, 1.9% for AGIs $50k-75k, 1.7% for AGIs $75k-100k, 1.3% for AGIs over 100k)
Taxable dividends: $2,665 (reported on 47.2% of returns)
Here:
$2,665
State:
$4,746
(% of AGI for various income ranges: 10.7% for AGIs below $10k, 3.2% for AGIs $10k-25k, 2.1% for AGIs $25k-50k, 1.9% for AGIs $50k-75k, 1.3% for AGIs $75k-100k, 1.2% for AGIs over 100k)
Net capital gain/loss: +$7,943 (reported on 43.0% of returns)
Here:
+$7,943
State:
+$23,418
(% of AGI for various income ranges: -0.8% for AGIs below $10k, 0.8% for AGIs $10k-25k, 0.6% for AGIs $25k-50k, 0.1% for AGIs $50k-75k, 0.7% for AGIs $75k-100k, 4.9% for AGIs over 100k)
Profit/loss from business: +$28,088 (reported on 20.6% of returns)
Here:
+$28,088
State:
+$16,826
(% of AGI for various income ranges: -8.8% for AGIs below $10k, 8.9% for AGIs $10k-25k, 9.8% for AGIs $25k-50k, 8.5% for AGIs $50k-75k, 5.7% for AGIs $75k-100k, 5.8% for AGIs over 100k)
IRA payment deduction: $3,613 (reported on 4.5% of returns)
94552:
$3,613
California:
$3,192
(% of AGI for various income ranges: 1.0% for AGIs below $10k, 0.6% for AGIs $10k-25k, 0.5% for AGIs $25k-50k, 0.4% for AGIs $50k-75k, 0.3% for AGIs $75k-100k, 0.1% for AGIs over 100k)
Self-employed pension: $17,801 (reported on 3.9% of returns)
Here:
$17,801
California:
$17,688
(% of AGI for various income ranges: 0.6% for AGIs $25k-50k, 0.4% for AGIs $50k-75k, 0.5% for AGIs $75k-100k, 0.9% for AGIs over 100k)
Total itemized deductions: $32,081 (25% of AGI, reported on 65.1% of returns)
Here:
$32,081
State:
$28,113
Here:
24.7% of AGI
State:
25.3% of AGI
(% of AGI for various income ranges: 52.9% for AGIs below $10k, 27.5% for AGIs $10k-25k, 24.0% for AGIs $25k-50k, 28.6% for AGIs $50k-75k, 27.6% for AGIs $75k-100k, 20.7% for AGIs over 100k)
Charity contributions deductions: $3,197 (2% of AGI, reported on 59.6% of returns)
Here:
$3,197
State:
$3,923
Here:
2.4% of AGI
State:
3.3% of AGI
(% of AGI for various income ranges: 1.8% for AGIs below $10k, 1.5% for AGIs $10k-25k, 1.7% for AGIs $25k-50k, 2.3% for AGIs $50k-75k, 2.2% for AGIs $75k-100k, 2.1% for AGIs over 100k)
Total tax: $16,037 (reported on 85.9% of returns)
94552:
$16,037
State:
$10,761
(% of AGI for various income ranges: 6.0% for AGIs below $10k, 5.5% for AGIs $10k-25k, 8.5% for AGIs $25k-50k, 9.7% for AGIs $50k-75k, 9.8% for AGIs $75k-100k, 17.0% for AGIs over 100k)
Earned income credit: $1,333 (reported on 3.1% of returns)
Here:
$1,333
State:
$1,763
Percentage of individuals using paid preparers for their 2004 taxes: 56.5%
Here:
56%
State:
66%
(% for various income ranges: 46.7% for AGIs below $10k, 51.6% for AGIs $10k-25k, 58.4% for AGIs $25k-50k, 60.2% for AGIs $50k-75k, 60.6% for AGIs $75k-100k, 58.8% for AGIs over 100k)
Likely homosexual households (counted as self-reported same-sex unmarried-partner households)
Lesbian couples: 0.1% of all households
Gay men: 0.3% of all households
Household received Food Stamps/SNAP in the past 12 months: 104 Household did not receive Food Stamps/SNAP in the past 12 months: 4,860
Women who had a birth in the past 12 months: 127 (97 now married, 29 unmarried) Women who did not have a birth in the past 12 months: 2,798 (1,189 now married, 1,605 unmarried)
Housing units in zip code 94552 with a mortgage: 2,749 (436 second mortgage, 10 home equity loan, 404 both second mortgage and home equity loan) Houses without a mortgage: 24
Median monthly owner costs for units with a mortgage: $3,753 Median monthly owner costs for units without a mortgage: $1,154
Residents with income below the poverty level in 2022:
This zip code:
5.2%
Whole state:
12.2%
Residents with income below 50% of the poverty level in 2022:
This zip code:
1.7%
Whole state:
6.2%
Median number of rooms in houses and condos:
Here:
7.1
State:
6.0
Median number of rooms in apartments:
Here:
6.3
State:
3.9
Notable locations in this zip code not listed on our city pages
Notable locations in zip code 94552: Alameda County Fire Department Station 7 (A), Hayward Fire Department Station 8 (B), Alameda County Fire Department Station 6 (C). Display/hide their locations on the map
Creeks: Bolinas Creek (A), Cull Creek (B), Miller Creek (C), Norris Creek (D), Pacheco Creek (E), Eden Creek (F), Hollis Creek (G), Palomares Creek (H). Display/hide their locations on the map
In group quarters: 74 (-1 institutionalized population)
Size of family households: 1,437 2-persons, 1,166 3-persons, 998 4-persons, 415 5-persons, 91 6-persons, 43 7-or-more-persons
Size of nonfamily households: 757 1-person, 131 2-persons, 8 3-persons
2,239 married couples with children.
460 single-parent households (171 men, 289 women).
58.3% of residents of 94552 zip code speak English at home.
4.6% of residents speak Spanish at home (86% very well, 10% well, 3% not well).
12.0% of residents speak other Indo-European language at home (86% very well, 10% well, 3% not well, 1% not at all).
24.2% of residents speak Asian or Pacific Island language at home (62% very well, 24% well, 9% not well, 5% not at all).
1.2% of residents speak other language at home (52% very well, 47% well, 1% not at all).
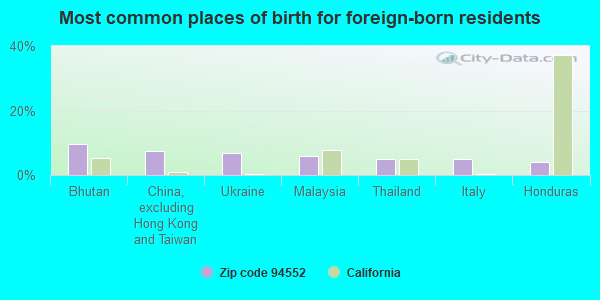
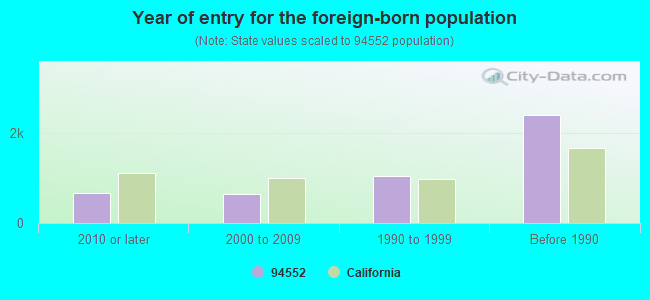
Foreign born population: 4,646 (31.3%) (84.4% of them are naturalized citizens)
Facilities with environmental interests located in this zip code:
CHEVRON 95607 (5269 CROW CANYON RD in CASTRO VALLEY, CA)
Small Quantity Generators, between 100 kg and 1000 kg of hazardous waste/month (Resource Conservation and Recovery Act (tracking hazardous waste)) STATE MASTER (California - Used Oil Recycling System ) - USED OIL RECYCLING Organizations: CHEVRON PRODUCTS CO. (CONTACT/OPERATOR)
Alternative names: KEVIN HINKLEY AUTO TECH
INDEPENDENT ELEMENTARY (21201 INDEPENDENT SCHOOL ROAD in CASTRO VALLEY, CA)
(National Center for Education Statistics) - STATE ID-6090393 Organizations: CASTRO VALLEY UNIFIED (SCHOOL DISTRICT)
JENSEN RANCH (ELEM) (20001 CARSON LANE in CASTRO VALLEY, CA)
(National Center for Education Statistics) - STATE ID-6113005 Organizations: CASTRO VALLEY UNIFIED (SCHOOL DISTRICT)
CANYON MIDDLE (19600 CULL CANYON ROAD in CASTRO VALLEY, CA)
(National Center for Education Statistics) - STATE ID-6097653 Organizations: CASTRO VALLEY UNIFIED (SCHOOL DISTRICT)
Housing units lacking complete kitchen facilities: 0.1%
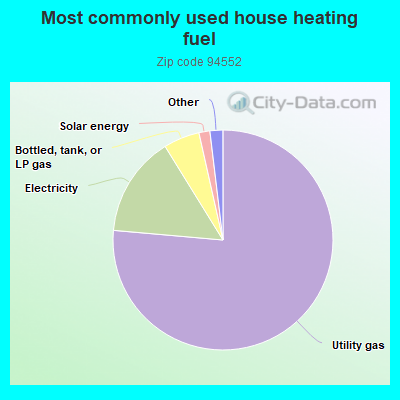
76.4%Utility gas
14.8%Electricity
5.3%Bottled, tank, or LP gas
1.6%Solar energy
0.7%Other fuel
0.6%Coal or coke
Population in 1990: 7,936. Population change in the 1990s: +5,266 (+66.4%).
Place of birth for U.S.-born residents:
This state: 7,703
Northeast: 474
Midwest: 631
South: 529
West: 593
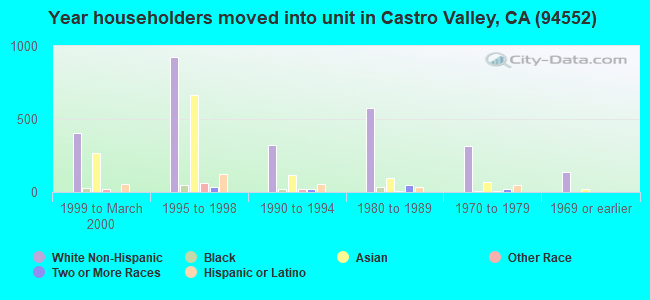
47% of the 94552 zip code residents lived in the same house 5 years ago. Out of people who lived in different houses, 62% lived in this county. Out of people who lived in different counties, 50% lived in California.
94% of the 94552 zip code residents lived in the same house 1 year ago. Out of people who lived in different houses, 52% moved from this county. Out of people who lived in different houses, 20% moved from different county within same state. Out of people who lived in different houses, 22% moved from different state. Out of people who lived in different houses, 12% moved from abroad.
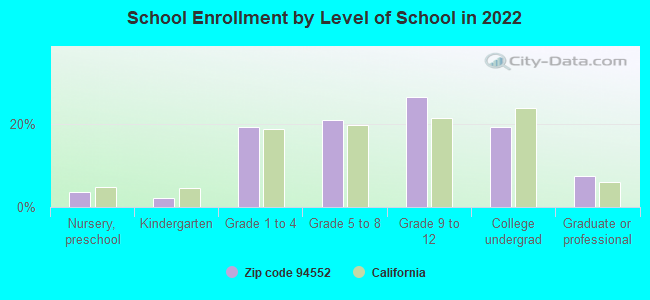
Private vs. public school enrollment:
Students in private schools in grades 1 to 8 (elementary and middle school): 97
Here:
6.7%
California:
10.5%
Students in private schools in grades 9 to 12 (high school): 121
Here:
12.6%
California:
8.5%
Students in private undergraduate colleges: 125
Here:
17.8%
California:
15.9%
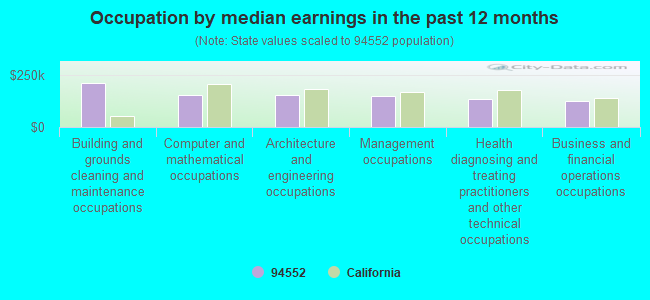
Occupation by median earnings in the past 12 months ($)
210,298Building and grounds cleaning and maintenance occupations
154,459Computer and mathematical occupations
152,620Architecture and engineering occupations
147,124Management occupations
133,118Health diagnosing and treating practitioners and other technical occupations
126,603Business and financial operations occupations
Companies with federal contracts located in this zip code:
GYM DOCTORS (22739 RANCHO PALOMARES PL in CASTRO VALLEY, CA; small business) : $22,000 in 2 contractsfrom 2005 to 2006
$11,000 with Air Force for Maintenance, Repair and Rebuilding of Equipment -- Recreational and Athletic Equipment. Signed on 2006-03-01. Completion date: 2007-02-28.
$11,000, same as above.Signed on 2005-03-01. Completion date: 2006-02-28.
Top industries in this zip code by the number of employees in 2005:
Administrative and Support and Waste Management and Remediation Services: Janitorial Services (100-249 employees: 1 establishment, 20-49 employees: 1 establishment)
2005 - 2018 National Fire Incident Reporting System (NFIRS) incidents
According to the data from the years 2005 - 2018 the average number of fire incidents per year is 9. The highest number of reported fire incidents - 15 took place in 2017, and the least - 4 in 2013. The data has a decreasing trend.
When looking into fire subcategories, the most reports belonged to: Outside Fires (45.0%), and Mobile Property/Vehicle Fires (34.1%).
Fire incident types reported to NFIRS in Zip Code 94552
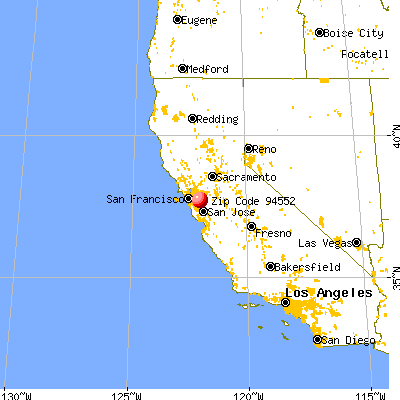


 Nearest zip codes: 94546, 94583, 94542, 94541, 94544, 94526.
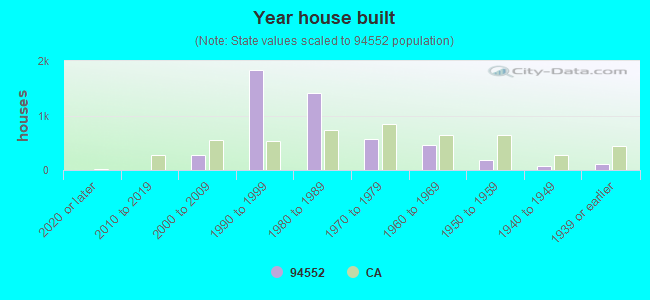


 According to the data from the years 2005 - 2018 the average number of fire incidents per year is 9. The highest number of reported fire incidents - 15 took place in 2017, and the least - 4 in 2013. The data has a decreasing trend.
 When looking into fire subcategories, the most reports belonged to: Outside Fires (45.0%), and Mobile Property/Vehicle Fires (34.1%).