Estimated zip code population in 2022: 39,427 Zip code population in 2010: 34,859 Zip code population in 2000: 44,076
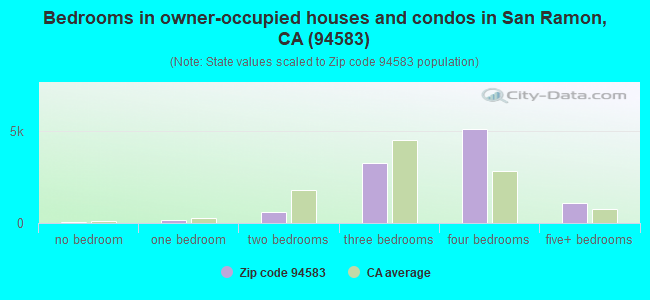
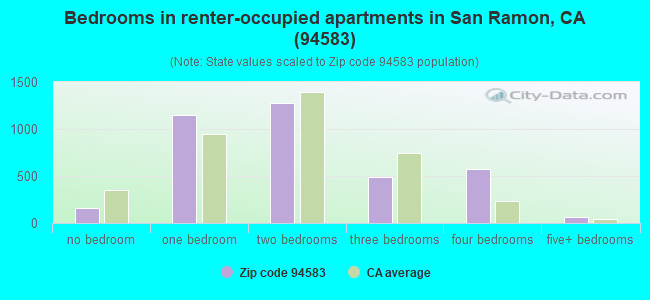
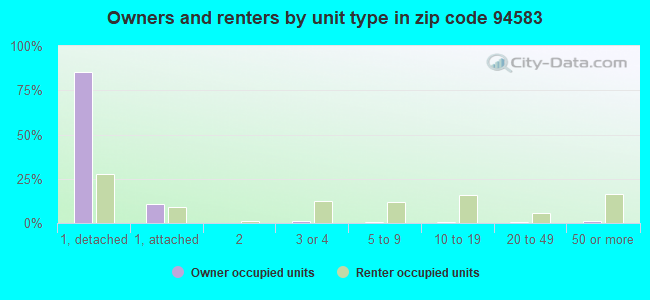
Houses and condos: 14,300 Renter-occupied apartments: 3,728
% of renters here:
27%
State:
44%
March 2022 cost of living index in zip code 94583: 119.2 (more than average, U.S. average is 100)
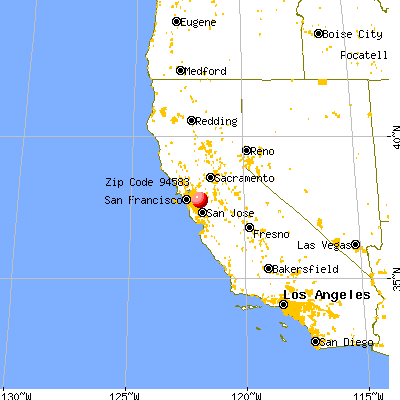
Land area: 15.0 sq. mi. Water area: 0.0 sq. mi.
Population density: 2,637 people per square mile
(average).
OSM Map
General Map
Google Map
MSN Map
OSM Map
General Map
Google Map
MSN Map
OSM Map
General Map
Google Map
MSN Map
OSM Map
General Map
Google Map
MSN Map
Please wait while loading the map...
Real estate property taxes paid for housing units in 2022:
This zip code:
0.7% ($9,247)
California:
0.7% ($4,831)
Median real estate property taxes paid for housing units with mortgages in 2022: $9,859 (0.8%) Median real estate property taxes paid for housing units with no mortgage in 2022: $7,000 (0.5%)
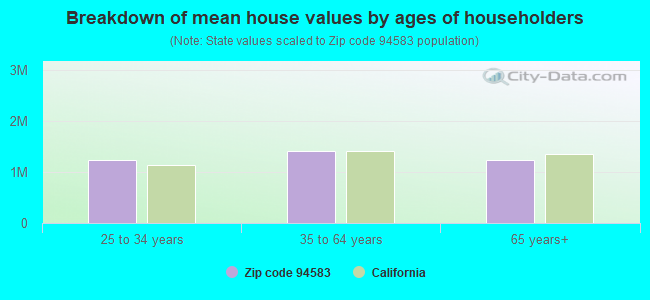
Estimated median house/condo value in 2022: $1,281,084
94583:
$1,281,084
California:
$715,900
According to our research of California and other state lists, there were 2 registered sex offenders living in 94583 zip code as of April 27, 2024. The ratio of all residents to sex offenders in zip code 94583 is 17,839 to 1. The ratio of registered sex offenders to all residents in this zip code is much lower than the state average.
Median resident age:
This zip code:
41.2 years
California median age:
37.9 years
Average household size:
This zip code:
2.8 people
California:
2.8 people
Averages for the 2020 tax year for zip code 94583, filed in 2021:
Average Adjusted Gross Income (AGI) in 2020: $205,903 (Individual Income Tax Returns)
Here:
$205,903
State:
$95,910
Salary/wage: $193,322 (reported on 84.5% of returns)
Here:
$193,322
State:
$77,331
(% of AGI for various income ranges: 1185.5% for AGIs below $25k, 3778.5% for AGIs $25k-50k, 7050.3% for AGIs $50k-75k, 10559.2% for AGIs $75k-100k, 21516.6% for AGIs $100k-200k, 179006.0% for AGIs over 200k)
Taxable interest for individuals: $2,314 (reported on 59.2% of returns)
This zip code:
$2,314
California:
$2,294
(% of AGI for various income ranges: 34.7% for AGIs below $25k, 72.0% for AGIs $25k-50k, 94.9% for AGIs $50k-75k, 109.9% for AGIs $75k-100k, 227.4% for AGIs $100k-200k, 1316.1% for AGIs over 200k)
Ordinary dividends: $7,084 (reported on 45.8% of returns)
Here:
$7,084
State:
$10,949
(% of AGI for various income ranges: 55.0% for AGIs below $25k, 123.5% for AGIs $25k-50k, 192.6% for AGIs $50k-75k, 220.1% for AGIs $75k-100k, 457.1% for AGIs $100k-200k, 3377.5% for AGIs over 200k)
Net capital gain/loss in AGI: +$34,033 (reported on 44.1% of returns)
Here:
+$34,033
State:
+$49,306
(% of AGI for various income ranges: 43.7% for AGIs below $25k, 105.4% for AGIs $25k-50k, 223.6% for AGIs $50k-75k, 210.1% for AGIs $75k-100k, 682.1% for AGIs $100k-200k, 19651.8% for AGIs over 200k)
Profit/loss from business: +$24,282 (reported on 16.7% of returns)
Here:
+$24,282
State:
+$15,671
(% of AGI for various income ranges: 156.7% for AGIs below $25k, 395.0% for AGIs $25k-50k, 400.4% for AGIs $50k-75k, 557.9% for AGIs $75k-100k, 770.5% for AGIs $100k-200k, 3260.5% for AGIs over 200k)
Taxable individual retirement arrangement distribution: $33,324 (reported on 10.5% of returns)
94583:
$33,324
California:
$23,505
(% of AGI for various income ranges: 87.6% for AGIs below $25k, 248.4% for AGIs $25k-50k, 399.1% for AGIs $50k-75k, 627.8% for AGIs $75k-100k, 987.0% for AGIs $100k-200k, 2284.5% for AGIs over 200k)
Self-employed (Keogh) retirement plans: $23,836 (reported on 1.7% of returns)
94583:
$23,836
California:
$30,163
(% of AGI for various income ranges: 43.7% for AGIs $50k-75k, 27.8% for AGIs $75k-100k, 73.7% for AGIs $100k-200k, 417.3% for AGIs over 200k)
Total itemized deductions: $38,405 (reported on 30.3% of returns)
Here:
$38,405
State:
$39,517
(% of AGI for various income ranges: 178.7% for AGIs below $25k, 393.2% for AGIs $25k-50k, 743.5% for AGIs $50k-75k, 1162.1% for AGIs $75k-100k, 2331.9% for AGIs $100k-200k, 10788.6% for AGIs over 200k)
Charity contributions: $10,320 (reported on 25.0% of returns)
Here:
$10,320
State:
$12,598
(% of AGI for various income ranges: 5.7% for AGIs below $25k, 29.0% for AGIs $25k-50k, 62.0% for AGIs $50k-75k, 123.5% for AGIs $75k-100k, 269.8% for AGIs $100k-200k, 3051.5% for AGIs over 200k)
Taxes paid: $9,459 (reported on 30.3% of returns)
94583:
$9,459
State:
$8,807
(% of AGI for various income ranges: 39.0% for AGIs below $25k, 88.0% for AGIs $25k-50k, 192.5% for AGIs $50k-75k, 342.3% for AGIs $75k-100k, 691.1% for AGIs $100k-200k, 2433.8% for AGIs over 200k)
Earned income credit: $1,542 (reported on 3.5% of returns)
Here:
$1,542
State:
$2,074
(% of AGI for various income ranges: 35.6% for AGIs below $25k, 31.6% for AGIs $25k-50k)
Percentage of individuals using paid preparers for their 2020 taxes: 92.7%
Here:
93%
State:
92%
(% for various income ranges: 88.3% for AGIs below $25k, 91.6% for AGIs $25k-50k, 91.8% for AGIs $50k-75k, 92.6% for AGIs $75k-100k, 92.6% for AGIs $100k-200k, 95.6% for AGIs over 200k)
Averages for the 2012 tax year for zip code 94583, filed in 2013:
Average Adjusted Gross Income (AGI) in 2012: $174,279 (Individual Income Tax Returns)
Here:
$174,279
State:
$72,726
Salary/wage: $178,450 (reported on 87.4% of returns)
Here:
$178,450
State:
$59,079
(% of AGI for various income ranges: 73.3% for AGIs below $25k, 73.8% for AGIs $25k-50k, 74.0% for AGIs $50k-75k, 76.0% for AGIs $75k-100k, 84.9% for AGIs $100k-200k, 93.5% for AGIs over 200k)
Taxable interest for individuals: $1,820 (reported on 60.1% of returns)
This zip code:
$1,820
California:
$2,146
(% of AGI for various income ranges: 1.7% for AGIs below $25k, 1.1% for AGIs $25k-50k, 0.8% for AGIs $50k-75k, 0.7% for AGIs $75k-100k, 0.5% for AGIs $100k-200k, 0.6% for AGIs over 200k)
Ordinary dividends: $5,488 (reported on 39.9% of returns)
Here:
$5,488
State:
$9,308
(% of AGI for various income ranges: 3.2% for AGIs below $25k, 1.9% for AGIs $25k-50k, 1.7% for AGIs $50k-75k, 1.2% for AGIs $75k-100k, 1.0% for AGIs $100k-200k, 1.3% for AGIs over 200k)
Net capital gain/loss in AGI: +$9,810 (reported on 34.7% of returns)
Here:
+$9,810
State:
+$30,460
(% of AGI for various income ranges: 0.2% for AGIs $25k-50k, 0.6% for AGIs $50k-75k, 0.4% for AGIs $75k-100k, 0.7% for AGIs $100k-200k, 2.6% for AGIs over 200k)
Profit/loss from business: +$23,540 (reported on 15.4% of returns)
Here:
+$23,540
State:
+$17,064
(% of AGI for various income ranges: 10.2% for AGIs below $25k, 7.8% for AGIs $25k-50k, 5.6% for AGIs $50k-75k, 5.0% for AGIs $75k-100k, 3.1% for AGIs $100k-200k, 1.1% for AGIs over 200k)
Taxable individual retirement arrangement distribution: $23,185 (reported on 9.9% of returns)
94583:
$23,185
California:
$19,557
(% of AGI for various income ranges: 4.7% for AGIs below $25k, 3.1% for AGIs $25k-50k, 4.1% for AGIs $50k-75k, 3.4% for AGIs $75k-100k, 2.2% for AGIs $100k-200k, 0.6% for AGIs over 200k)
Self-employment retirement plans: $20,014 (reported on 1.7% of returns)
94583:
$20,014
California:
$24,530
(% of AGI for various income ranges: 0.5% for AGIs below $25k, 0.2% for AGIs $50k-75k, 0.2% for AGIs $75k-100k, 0.3% for AGIs $100k-200k, 0.2% for AGIs over 200k)
Total itemized deductions: $36,995 (16% of AGI, reported on 58.7% of returns)
Here:
$36,995
State:
$34,004
Here:
16.1% of AGI
State:
22.7% of AGI
(% of AGI for various income ranges: 19.6% for AGIs below $25k, 15.6% for AGIs $25k-50k, 16.8% for AGIs $50k-75k, 18.8% for AGIs $75k-100k, 19.4% for AGIs $100k-200k, 9.5% for AGIs over 200k)
Charity contributions: $3,939 (reported on 48.2% of returns)
Here:
$3,939
State:
$4,659
(% of AGI for various income ranges: 1.0% for AGIs below $25k, 1.1% for AGIs $25k-50k, 1.4% for AGIs $50k-75k, 1.5% for AGIs $75k-100k, 1.5% for AGIs $100k-200k, 0.9% for AGIs over 200k)
Taxes paid: $17,031 (reported on 58.4% of returns)
94583:
$17,031
State:
$14,448
(% of AGI for various income ranges: 3.8% for AGIs below $25k, 3.8% for AGIs $25k-50k, 4.9% for AGIs $50k-75k, 6.5% for AGIs $75k-100k, 8.2% for AGIs $100k-200k, 5.0% for AGIs over 200k)
Earned income credit: $1,581 (reported on 3.9% of returns)
Here:
$1,581
State:
$2,286
(% of AGI for various income ranges: 2.2% for AGIs below $25k, 0.4% for AGIs $25k-50k)
Percentage of individuals using paid preparers for their 2012 taxes: 60.7%
Here:
61%
State:
64%
(% for various income ranges: 44.2% for AGIs below $25k, 50.9% for AGIs $25k-50k, 53.4% for AGIs $50k-75k, 56.6% for AGIs $75k-100k, 57.9% for AGIs $100k-200k, 83.5% for AGIs over 200k)
Averages for the 2004 tax year for zip code 94583, filed in 2005:
Average Adjusted Gross Income (AGI) in 2004: $99,507 (Individual Income Tax Returns)
Here:
$99,507
State:
$58,600
Salary/wage: $99,869 (reported on 87.1% of returns)
Here:
$99,869
State:
$49,455
(% of AGI for various income ranges: 221.7% for AGIs below $10k, 73.7% for AGIs $10k-25k, 79.4% for AGIs $25k-50k, 81.5% for AGIs $50k-75k, 84.9% for AGIs $75k-100k, 88.8% for AGIs over 100k)
Taxable interest for individuals: $1,625 (reported on 65.6% of returns)
This zip code:
$1,625
California:
$2,365
(% of AGI for various income ranges: 13.9% for AGIs below $10k, 2.8% for AGIs $10k-25k, 1.6% for AGIs $25k-50k, 1.3% for AGIs $50k-75k, 0.9% for AGIs $75k-100k, 0.9% for AGIs over 100k)
Taxable dividends: $2,436 (reported on 43.1% of returns)
Here:
$2,436
State:
$4,746
(% of AGI for various income ranges: 16.8% for AGIs below $10k, 2.8% for AGIs $10k-25k, 1.5% for AGIs $25k-50k, 1.1% for AGIs $50k-75k, 0.9% for AGIs $75k-100k, 0.9% for AGIs over 100k)
Net capital gain/loss: +$9,160 (reported on 38.1% of returns)
Here:
+$9,160
State:
+$23,418
(% of AGI for various income ranges: -8.9% for AGIs below $10k, 0.2% for AGIs $10k-25k, 0.4% for AGIs $25k-50k, 0.7% for AGIs $50k-75k, 0.3% for AGIs $75k-100k, 4.6% for AGIs over 100k)
Profit/loss from business: +$26,298 (reported on 17.1% of returns)
Here:
+$26,298
State:
+$16,826
(% of AGI for various income ranges: 1.9% for AGIs below $10k, 9.9% for AGIs $10k-25k, 7.9% for AGIs $25k-50k, 5.8% for AGIs $50k-75k, 5.6% for AGIs $75k-100k, 3.8% for AGIs over 100k)
IRA payment deduction: $3,340 (reported on 3.7% of returns)
94583:
$3,340
California:
$3,192
(% of AGI for various income ranges: 0.8% for AGIs below $10k, 0.3% for AGIs $10k-25k, 0.3% for AGIs $25k-50k, 0.3% for AGIs $50k-75k, 0.2% for AGIs $75k-100k, 0.1% for AGIs over 100k)
Self-employed pension: $15,986 (reported on 2.6% of returns)
Here:
$15,986
California:
$17,688
(% of AGI for various income ranges: 0.3% for AGIs $25k-50k, 0.3% for AGIs $50k-75k, 0.5% for AGIs $75k-100k, 0.4% for AGIs over 100k)
Total itemized deductions: $30,595 (22% of AGI, reported on 60.1% of returns)
Here:
$30,595
State:
$28,113
Here:
22.3% of AGI
State:
25.3% of AGI
(% of AGI for various income ranges: 55.7% for AGIs below $10k, 23.8% for AGIs $10k-25k, 20.2% for AGIs $25k-50k, 22.0% for AGIs $50k-75k, 24.8% for AGIs $75k-100k, 16.8% for AGIs over 100k)
Charity contributions deductions: $2,968 (2% of AGI, reported on 53.3% of returns)
Here:
$2,968
State:
$3,923
Here:
2.1% of AGI
State:
3.3% of AGI
(% of AGI for various income ranges: 1.7% for AGIs below $10k, 1.3% for AGIs $10k-25k, 1.7% for AGIs $25k-50k, 1.8% for AGIs $50k-75k, 1.9% for AGIs $75k-100k, 1.5% for AGIs over 100k)
Total tax: $15,570 (reported on 87.7% of returns)
94583:
$15,570
State:
$10,761
(% of AGI for various income ranges: 7.4% for AGIs below $10k, 5.7% for AGIs $10k-25k, 8.7% for AGIs $25k-50k, 10.3% for AGIs $50k-75k, 10.4% for AGIs $75k-100k, 15.1% for AGIs over 100k)
Earned income credit: $1,289 (reported on 3.3% of returns)
Here:
$1,289
State:
$1,763
Percentage of individuals using paid preparers for their 2004 taxes: 58.0%
Here:
58%
State:
66%
(% for various income ranges: 41.1% for AGIs below $10k, 49.1% for AGIs $10k-25k, 52.3% for AGIs $25k-50k, 57.7% for AGIs $50k-75k, 58.6% for AGIs $75k-100k, 68.7% for AGIs over 100k)
Household received Food Stamps/SNAP in the past 12 months: 337 Household did not receive Food Stamps/SNAP in the past 12 months: 13,304
Women who had a birth in the past 12 months: 404 (392 now married, 9 unmarried) Women who did not have a birth in the past 12 months: 7,635 (4,481 now married, 3,093 unmarried)
Housing units in zip code 94583 with a mortgage: 7,358 (1,191 second mortgage, 84 home equity loan, 1,004 both second mortgage and home equity loan) Houses without a mortgage: 49
Median monthly owner costs for units with a mortgage: $3,876 Median monthly owner costs for units without a mortgage: $1,074
Residents with income below the poverty level in 2022:
This zip code:
3.2%
Whole state:
12.2%
Residents with income below 50% of the poverty level in 2022:
This zip code:
1.3%
Whole state:
6.2%
Median number of rooms in houses and condos:
Here:
6.8
State:
6.0
Median number of rooms in apartments:
Here:
4.1
State:
3.9
Notable locations in this zip code not listed on our city pages
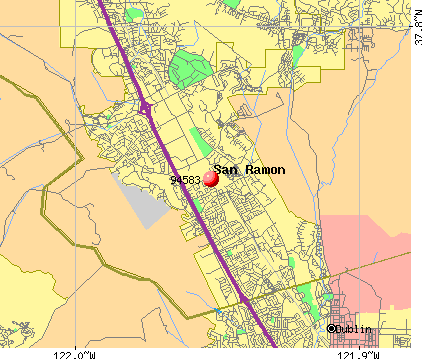
Notable locations in zip code 94583: San Ramon Siding (A), San Ramon National Golf Club (B), San Ramon Library (C), San Ramon Valley Fire Protection District Station 34 (D), San Ramon Valley Fire Protection District Station 39 (E), San Ramon Valley Fire Protection District Station 38 (F). Display/hide their locations on the map
Shopping Centers: Alcosta Mall Shopping Center (1), Crow Canyon Commons Shopping Center (2), Diablo Plaza Shopping Center (3), San Ramon Village Shopping Center (4), The Marketplace Shopping Center (5). Display/hide their locations on the map
8,406 married couples with children.
863 single-parent households (392 men, 471 women).
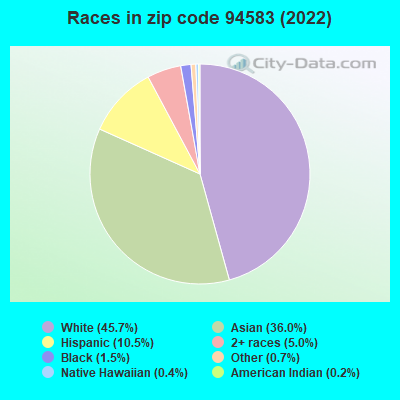
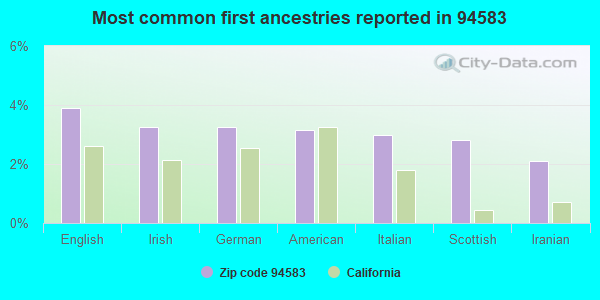
63.9% of residents of 94583 zip code speak English at home.
4.2% of residents speak Spanish at home (90% very well, 7% well, 2% not well, 1% not at all).
10.3% of residents speak other Indo-European language at home (79% very well, 15% well, 5% not well).
20.4% of residents speak Asian or Pacific Island language at home (71% very well, 18% well, 9% not well, 2% not at all).
1.2% of residents speak other language at home (65% very well, 32% well, 3% not at all).
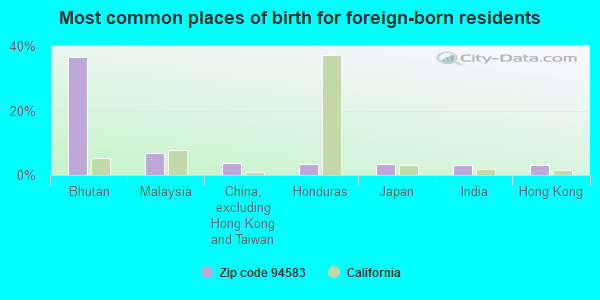
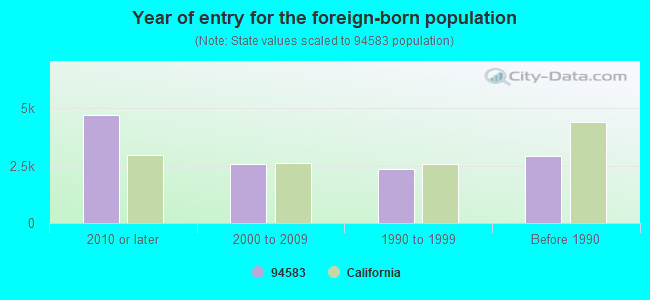
Foreign born population: 11,582 (29.4%) (54.7% of them are naturalized citizens)
Major facilities with environmental interests located in this zip code:
CHEVRON PARK GEOTECHNICAL CTR (6001 BOLINGER CANYON RD in SAN RAMON, CA)
(Integrated Compliance Information System) - ICIS-09-1993-0042, FORMAL ENFORCEMENT ACTION COMPLIANCE ACTIVITY (Tracking inspections of insecticide, fungicide, and rodenticide, and toxic substances) (Resource Conservation and Recovery Act (tracking hazardous waste)) Business NAICS classification: PLASTICS MATERIAL AND RESIN MANUFACTURING. Organizations: CHEVEON USA INC (CONTACT/OWNER)
Alternative names: CHEVRON CHEMICAL, CHEVRON CHEMICAL ORONITE DIVISION, CHEVRON REAL ESTATE MGMT
MENDELSON AUTOBODY (38 BETA COURT UNIT A 5 in SAN RAMON, CA)
STATE MASTER (California - Hazardous Waste Tracking) - HAZARDOU WASTE PROGRAM CRITERIA AND HAZARDOUS AIR POLLUTANT INVENTORY (Inventory of air pollution sources) Small Quantity Generators, between 100 kg and 1000 kg of hazardous waste/month (Resource Conservation and Recovery Act (tracking hazardous waste)) - notification Business SIC classification: TOP, BODY, AND UPHOLSTERY REPAIR SHOPS AND PAINT SHOPS Business NAICS classification: AUTOMOTIVE BODY, PAINT, AND INTERIOR REPAIR AND MAINTENANCE. Organizations: TED MENDELSON (CONTACT/OWNER)
Alternative names: MENDELSON AUTO BODY
CHEVRON BUSINESS REAL ESTATE SERVICES (6001 BOLLINGER CANYON RD in SAN RAMON, CA) . Federal Facility
STATE MASTER (California - Hazardous Waste Tracking) - HAZARDOU WASTE PROGRAM HAZARDOUS WASTE BIENNIAL REPORTER (Resource Conservation and Recovery Act (tracking hazardous waste)) Small Quantity Generators, between 100 kg and 1000 kg of hazardous waste/month (Resource Conservation and Recovery Act (tracking hazardous waste)) Business NAICS classification: CORPORATE, SUBSIDIARY, AND REGIONAL MANAGING OFFICES. Organizations: CHEVRONTEXACO CORPORATION (CONTACT/OPERATOR)
Alternative names: CHEVRONTEXACO PARK SAN RAMON
IRON HORSE MIDDLE SCHOOL (12601 ALCOSTA BLVD in SAN RAMON, CA)
(National Center for Education Statistics) - STATE ID-6113336 Small Quantity Generators, between 100 kg and 1000 kg of hazardous waste/month (Resource Conservation and Recovery Act (tracking hazardous waste)) - notification Organizations: SAN RAMON UNIFIED SCHOOL DIST (CONTACT/OWNER)
, SAN RAMON VALLEY UNIFIED (SCHOOL DISTRICT)
CALIFORNIA HIGH SCHOOL (9870 BROADMOOR DR in SAN RAMON, CA)
(National Center for Education Statistics) - STATE ID-0730051 Small Quantity Generators, between 100 kg and 1000 kg of hazardous waste/month (Resource Conservation and Recovery Act (tracking hazardous waste)) - notification Organizations: SAN RAMON UNIFIED SCHOOL DIST (CONTACT/OWNER)
, SAN RAMON VALLEY UNIFIED (SCHOOL DISTRICT)
CHEVRON STATION NO 96956 (2860 CROW CANYON RD in SAN RAMON, CA)
STATE MASTER (California - Hazardous Waste Tracking) - HAZARDOU WASTE PROGRAM Small Quantity Generators, between 100 kg and 1000 kg of hazardous waste/month (Resource Conservation and Recovery Act (tracking hazardous waste)) - notification Organizations: CHEVRON PRODUCTS CO (CONTACT/OWNER)
Alternative names: CHEVRON 96956, NELSON CHEVRON
AMADOR RESERVOIR (ALCOSTA BLVD S OF ESTERO DR in SAN RAMON, CA)
STATE MASTER (California - Hazardous Waste Tracking) - HAZARDOU WASTE PROGRAM Small Quantity Generators, between 100 kg and 1000 kg of hazardous waste/month (Resource Conservation and Recovery Act (tracking hazardous waste)) - notification Organizations: EAST BAY MUNICIPAL UTILITY D (CONTACT/OWNER)
CHEVRON STATION NO 206541 (18060 SAN RAMON VLY BLVD in SAN RAMON, CA)
STATE MASTER (California - Hazardous Waste Tracking) - HAZARDOU WASTE PROGRAM Small Quantity Generators, between 100 kg and 1000 kg of hazardous waste/month (Resource Conservation and Recovery Act (tracking hazardous waste)) - notification Organizations: CHEVRON PRODUCTS CO (CONTACT/OWNER)
CHEVRON STATION NO 93831 (21320 SAN RAMON VLY BLVD in SAN RAMON, CA)
STATE MASTER (California - Hazardous Waste Tracking) - HAZARDOU WASTE PROGRAM Small Quantity Generators, between 100 kg and 1000 kg of hazardous waste/month (Resource Conservation and Recovery Act (tracking hazardous waste)) - notification Organizations: CHEVRON PRODUCTS CO (CONTACT/OWNER)
GOLDEN VIEW ELEMENTARY (5025 CANYON CREST DR. in SAN RAMON, CA)
(National Center for Education Statistics) - STATE ID-6108161 Organizations: SAN RAMON VALLEY UNIFIED (SCHOOL DISTRICT)
HORIZONS COMMUNITY DAY (3280 E CROW CANYON ROAD in SAN RAMON, CA)
(National Center for Education Statistics) - STATE ID-0730515 Organizations: SAN RAMON VALLEY UNIFIED (SCHOOL DISTRICT)
MONTEVIDEO ELEMENTARY (13000 BROADMOOR DR. in SAN RAMON, CA)
(National Center for Education Statistics) - STATE ID-6097158 Organizations: SAN RAMON VALLEY UNIFIED (SCHOOL DISTRICT)
LABORERS TRNG & RE TRNG TRUST-NOR CAL (1001 WESTSIDE DR. in SAN RAMON, CA)
COMPLIANCE ACTIVITY (Tracking inspections of insecticide, fungicide, and rodenticide, and toxic substances) Alternative names: LABORERS TRAINING & RETRAINING FOR NO-CA, LABORERS TRAINING & RETRAINING--NO CA, LABORERS TRAINING & RETRAINING TR NO CAL, LABORERS TRAINING & RETRAINING TRUST
Housing units lacking complete plumbing facilities: 0.9% Housing units lacking complete kitchen facilities: 1.0%
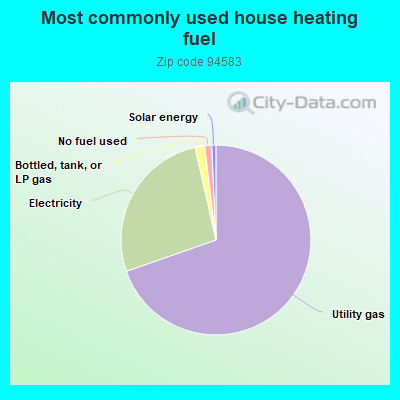
69.1%Utility gas
26.6%Electricity
1.6%Bottled, tank, or LP gas
1.2%No fuel used
0.7%Solar energy
Population in 1990: 35,449. Population change in the 1990s: +8,627 (+24.3%).
Place of birth for U.S.-born residents:
This state: 20,494
Northeast: 1,567
Midwest: 2,729
South: 1,198
West: 1,208
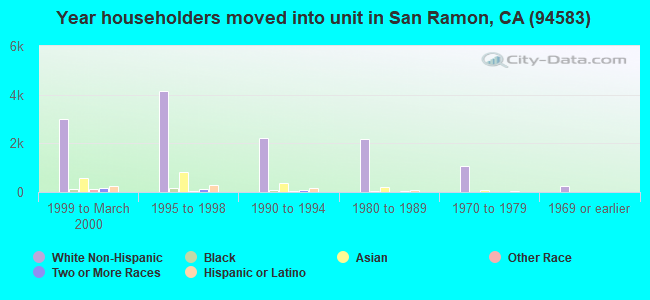
48% of the 94583 zip code residents lived in the same house 5 years ago. Out of people who lived in different houses, 35% lived in this county. Out of people who lived in different counties, 50% lived in California.
89% of the 94583 zip code residents lived in the same house 1 year ago. Out of people who lived in different houses, 33% moved from this county. Out of people who lived in different houses, 42% moved from different county within same state. Out of people who lived in different houses, 12% moved from different state. Out of people who lived in different houses, 17% moved from abroad.
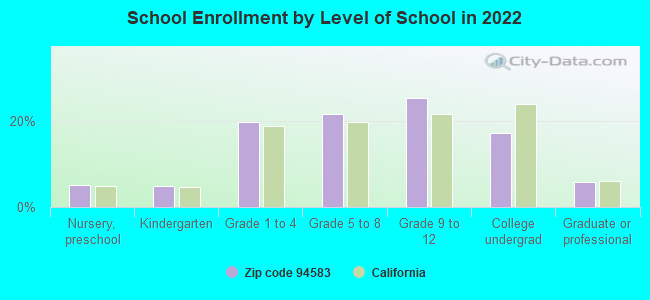
Private vs. public school enrollment:
Students in private schools in grades 1 to 8 (elementary and middle school): 320
Here:
7.0%
California:
10.5%
Students in private schools in grades 9 to 12 (high school): 82
Here:
2.9%
California:
8.5%
Students in private undergraduate colleges: 125
Here:
6.6%
California:
15.9%
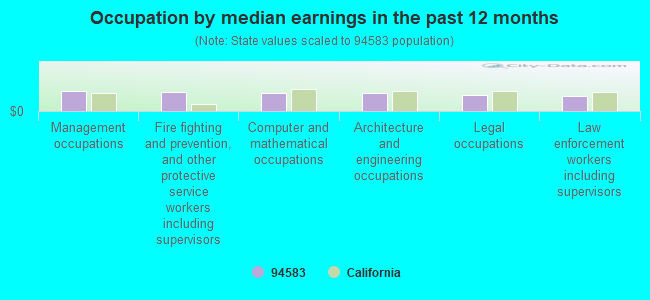
Occupation by median earnings in the past 12 months ($)
169,837Management occupations
168,278Fire fighting and prevention, and other protective service workers including supervisors
154,609Computer and mathematical occupations
153,999Architecture and engineering occupations
141,372Legal occupations
127,463Law enforcement workers including supervisors
Companies with biggest federal contracts located in this zip code (SAN RAMON, CA):
CHEVRON U S A INC (6001 BOLLINGER CANYON RD) : $204,413,521 in 14 contractsfrom 2001 to 2005
Contracts for Liquid Propellants and Fuels, Petroleum Base, Oils and Greases: Cutting, Lubricating, and Hydraulic, Lease or Rental of Facilities -- Fuel Storage Buildings by Defense Logistics Agency Signed by year:2000: $0; 2001: $3,054,810; 2002: $27,060,705; 2003: $0; 2004: $108,481,342; 2005: $65,816,664; 2006: $0.
Biggest contracts:
$108,443,577 with Defense Logistics Agency for Liquid Propellants and Fuels, Petroleum Base. Signed on 2004-09-03. Completion date: 2005-10-30.
$61,764,570 with Defense Logistics Agency for Liquid Propellants and Fuels, Petroleum Base. Taking place in UT. Signed on 2005-09-13. Completion date: 2006-10-30.
$28,398,825, same as above.Signed on 2002-09-06. Completion date: 2003-09-30.
$2,766,300 with Defense Logistics Agency for Oils and Greases: Cutting, Lubricating, and Hydraulic. Taking place in OR. Signed on 2005-03-08. Completion date: 2006-04-30.
SMF SYSTEMS TECHNOLOGY CORP (12657 ALCOSTA BLVD; small business) : $11,698,741 in 147 contractsfrom 2001 to 2005
Contracts for ADP Backup and Security Services, ADP Systems Development Services, ADP Systems Analysis Services, ADP System Acquisition Support Services. Includes preparation of statement of work, benchmarks, specifications, etc., and moreby Army, Office of Assistant Secretary for Management and Budget, Navy, Federal Technology Service, and others Signed by year:2000: $0; 2001: $3,372,613; 2002: $4,661,733; 2003: $611,934; 2004: $5,037,660; 2005: -$1,985,199; 2006: $0.
Biggest contracts:
$2,090,000 with Army for ADP Backup and Security Services. Taking place in HI. Signed on 2004-09-01. Completion date: 2004-09-16.
$1,417,000 with Office of Assistant Secretary for Management and Budget for ADP Systems Development Services. Taking place in DC. Signed on 2001-04-15. Completion date: 2002-04-15.
$1,064,560 with Army for ADP Backup and Security Services. Taking place in HI. Signed on 2004-01-29. Completion date: 2004-06-30.
$920,512, same as above.Signed on 2004-01-29. Completion date: 2004-06-30.
GLOBAL INTERMODAL SYSTEMS, INC (2000 CROW CANYON PLACE, SU) : $10,242,384 in 172 contractsfrom 2000 to 2006
Contracts for Specialized Shipping and Storage Containers, Miscellaneous Materials Handling Equipment, Boxes, Cartons, and Crates, Ammunition and Nuclear Ordnance Boxes, Packages and Special Containers, and moreby Defense Logistics Agency, Army, Air Force, Navy, and others Signed by year:2000: $1,261,800; 2001: $150,600; 2002: $2,770,558; 2003: $2,626,229; 2004: $2,876,272; 2005: $468,363; 2006: $88,562.
Biggest contracts:
$1,026,250 with Defense Logistics Agency for Specialized Shipping and Storage Containers. Signed on 2002-04-11. Completion date: 2002-05-31.
$627,300, same as above.Signed on 2002-04-30. Completion date: 2002-05-15.
$626,400 with Army for Miscellaneous Materials Handling Equipment. Signed on 2004-05-18. Completion date: 2004-05-31.
$625,300 with Army for Boxes, Cartons, and Crates. Signed on 2000-09-18. Completion date: 2000-11-06.
AZTEC CONSULTANTS, INC (2021 OMEGA ROAD, SUITE; small business) : $6,421,331 in 30 contractsfrom 2000 to 2005
Contracts for Maintenance, Repair or Alteration of Real Property -- Other Educational Buildings, Maintenance, Repair and Rebuilding of Equipment -- Construction, Mining, Excavating, and Highway Maintenance Equipment, Maintenance, Repair or Alteration of Real Property -- Office Buildings, Maintenance, Repair or Alteration of Real Property -- Other Non-Building Facilities, and moreby Navy, Public Buildings Service, U.S. Army Corps of Engineers - civil program financing only, Army, and others Signed by year:2000: $268,596; 2001: $348,200; 2002: $3,492,353; 2003: $2,291,954; 2004: $3,920; 2005: $16,308; 2006: $0.
Biggest contracts:
$2,892,500 with Navy for Maintenance, Repair or Alteration of Real Property -- Other Educational Buildings. Signed on 2002-09-18. Completion date: 2003-07-15.
$1,394,275 with Navy for Maintenance, Repair and Rebuilding of Equipment -- Construction, Mining, Excavating, and Highway Maintenance Equipment. Signed on 2003-07-31. Completion date: 2003-12-01.
$456,000 with Public Buildings Service for Maintenance, Repair or Alteration of Real Property -- Office Buildings. Signed on 2003-08-15. Completion date: 2003-08-15.
$319,000 with U.S. Army Corps of Engineers - civil program financing only for Maintenance, Repair or Alteration of Real Property -- Other Non-Building Facilities. Signed on 2001-04-05. Completion date: 2001-07-16.
GIGA-TRONICS INCORPORATED (4650 NORRIS CANYON RD; small business) : $5,603,333 in 87 contractsfrom 1999 to 2006
Contracts for Electrical and Electronic Properties Measuring and Testing Instruments, Cable, Cord, and Wire Assemblies: Communications Equipment, Electrical and Electronic assemblies, Boards, Cards, and Associated Hardware, Miscellaneous Aircraft Accessories and Components, and moreby Navy, Air Force, Army, Federal Supply Service, and others Signed by year:2000: $1,450,058; 2001: $1,479,777; 2002: $470,241; 2003: $807,522; 2004: $415,277; 2005: $510,479; 2006: $65,354.
Biggest contracts:
$593,450 with Navy for Electrical and Electronic Properties Measuring and Testing Instruments. Signed on 2000-04-10. Completion date: 2000-11-21.
$459,900 with Air Force for Electrical and Electronic Properties Measuring and Testing Instruments. Signed on 2003-05-21. Completion date: 2003-07-31.
$458,575 with Navy for Electrical and Electronic Properties Measuring and Testing Instruments. Signed on 2000-12-12. Completion date: 2001-07-12.
$428,571 with Army for Electrical and Electronic Properties Measuring and Testing Instruments. Signed on 2001-06-04. Completion date: 2001-10-15.
CHEVRON USA INC (6001 BOLLINGER CANYON ROAD)
$3,187,007 with Defense Logistics Agency for Lease or Rental of Facilities -- Fuel Storage Buildings. Taking place in AK. Signed on 2004-06-15. Completion date: 2016-08-19.
ADAM CLINGERMAN (2411 OLD CROW CANYON RD #; small business) : $2,790,944 in 39 contractsfrom 2003 to 2006
Contracts for Jams, Jellies, and Preserves, Condiments and Related Products, Food Services, Special Dietary Foods and Food Specialty Preparations by Defense Logistics Agency, Bureau of Immigration and Customs Enforcement, Bureau of Prisoners/Federal Prison System Signed by year:2000: $0; 2001: $0; 2002: $0; 2003: $471,684; 2004: $869,230; 2005: $983,633; 2006: $466,397.
Biggest contracts:
$441,528 with Defense Logistics Agency for Jams, Jellies, and Preserves. Taking place in GA. Signed on 2003-10-01. Completion date: 2004-12-30.
$317,194, same as above.Signed on 2005-09-06. Completion date: 2005-12-15.
$250,139, same as above.Signed on 2004-11-01. Completion date: 2005-01-18.
$236,115 with Defense Logistics Agency for Condiments and Related Products. Signed on 2006-05-19. Completion date: 2006-11-15.
BAE SYSTEMS INTEGRATED DEFENSE (BOLLINGER CANYON RD) : $2,443,050 in 6 contractsfrom 2000 to 2001
Contracts for Ammunition -- Engineering Development (R&D) by Air Force Signed by year:2000: $563,050; 2001: $1,880,000; 2002: $0; 2003: $0; 2004: $0; 2005: $0; 2006: $0.
Biggest contracts:
$665,000 with Air Force for Ammunition -- Engineering Development (R&D). Signed on 2001-04-10. Completion date: 2001-05-31.
$563,050, same as above.Signed on 2000-09-26. Completion date: 2001-05-31.
$480,000, same as above.Signed on 2001-07-12. Completion date: 2001-05-31.
$385,000, same as above.Signed on 2001-06-18. Completion date: 2001-05-31.
CONTAINER-CARE INTERNATIONAL, (2000 CROW CANYON PLACE #42) : $1,478,992 in 26 contractsfrom 2002 to 2006
Contracts for Specialized Shipping and Storage Containers, Miscellaneous Prefabricated Structures, Trailers, Miscellaneous Items, and moreby Air Force, Navy, Army, Bureau of Prisoners/Federal Prison System, and others Signed by year:2000: $0; 2001: $0; 2002: $587,750; 2003: $803,407; 2004: $17,765; 2005: $60,710; 2006: $9,360.
Biggest contracts:
$255,000 with Air Force for Specialized Shipping and Storage Containers. Taking place in TX. Signed on 2003-02-18. Completion date: 2003-03-28.
$255,000, same as above.Signed on 2002-02-01. Completion date: 2002-02-15.
$253,400 with Navy for Miscellaneous Prefabricated Structures. Taking place in TX. Signed on 2003-09-16. Completion date: 2004-01-14.
$170,000 with Air Force for Specialized Shipping and Storage Containers. Taking place in TX. Signed on 2002-07-17. Completion date: 2002-08-02.
S M F SYSTEMS ACQUISITION INC (16257 ALCOSTA BLVD 430; small business) : $940,144 in 7 contractsfrom 2002 to 2003
Contracts for Miscellaneous Alarm, Signal and Security Detection Systems by Bureau of Prisoners/Federal Prison System, Public Buildings Service Signed by year:2000: $0; 2001: $0; 2002: $901,215; 2003: $38,929; 2004: $0; 2005: $0; 2006: $0.
Biggest contracts:
$898,215 with Bureau of Prisoners/Federal Prison System for Miscellaneous Alarm, Signal and Security Detection Systems. Signed on 2002-12-15. Completion date: 2003-02-15.
$38,928 with Public Buildings Service for Miscellaneous Alarm, Signal and Security Detection Systems. Signed on 2003-04-15. Completion date: 2003-07-15.
$3,000 with Bureau of Prisoners/Federal Prison System for Miscellaneous Alarm, Signal and Security Detection Systems. Signed on 2002-08-15. Completion date: 2003-01-15.
$1 with Public Buildings Service for Miscellaneous Alarm, Signal and Security Detection Systems. Signed on 2003-04-15. Completion date: 2003-07-15.
Top industries in this zip code by the number of employees in 2005:
2008 - 2018 National Fire Incident Reporting System (NFIRS) incidents
Based on the data from the years 2008 - 2018 the average number of fire incidents per year is 55. The highest number of fire incidents - 85 took place in 2013, and the least - 21 in 2008. The data has a rising trend.
When looking into fire subcategories, the most reports belonged to: Outside Fires (40.2%), and Structure Fires (38.0%).
Fire incident types reported to NFIRS in Zip Code 94583


 Nearest zip codes: 94582, 94552, 94526, 94568, 94506, 94528.


 Based on the data from the years 2008 - 2018 the average number of fire incidents per year is 55. The highest number of fire incidents - 85 took place in 2013, and the least - 21 in 2008. The data has a rising trend.
 When looking into fire subcategories, the most reports belonged to: Outside Fires (40.2%), and Structure Fires (38.0%).