Danville, California Submit your own pictures of this town and show them to the world
OSM Map
General Map
Google Map
MSN Map
OSM Map
General Map
Google Map
MSN Map
OSM Map
General Map
Google Map
MSN Map
OSM Map
General Map
Google Map
MSN Map
Please wait while loading the map...
Population in 2022: 42,732 (100% urban, 0% rural). Population change since 2000: +2.4%Males: 21,417 Females: 21,315
March 2022 cost of living index in Danville: 123.7 (high, U.S. average is 100) Percentage of residents living in poverty in 2022: 3.7%for White Non-Hispanic residents , 5.1% for Black residents , 7.2% for Hispanic or Latino residents , 100.0% for Native Hawaiian and other Pacific Islander residents , 24.5% for other race residents , 6.8% for two or more races residents )
Profiles of local businesses
Business Search - 14 Million verified businesses
Data:
Median household income ($)
Median household income (% change since 2000)
Household income diversity
Ratio of average income to average house value (%)
Ratio of average income to average rent
Median household income ($) - White
Median household income ($) - Black or African American
Median household income ($) - Asian
Median household income ($) - Hispanic or Latino
Median household income ($) - American Indian and Alaska Native
Median household income ($) - Multirace
Median household income ($) - Other Race
Median household income for houses/condos with a mortgage ($)
Median household income for apartments without a mortgage ($)
Races - White alone (%)
Races - White alone (% change since 2000)
Races - Black alone (%)
Races - Black alone (% change since 2000)
Races - American Indian alone (%)
Races - American Indian alone (% change since 2000)
Races - Asian alone (%)
Races - Asian alone (% change since 2000)
Races - Hispanic (%)
Races - Hispanic (% change since 2000)
Races - Native Hawaiian and Other Pacific Islander alone (%)
Races - Native Hawaiian and Other Pacific Islander alone (% change since 2000)
Races - Two or more races (%)
Races - Two or more races (% change since 2000)
Races - Other race alone (%)
Races - Other race alone (% change since 2000)
Racial diversity
Unemployment (%)
Unemployment (% change since 2000)
Unemployment (%) - White
Unemployment (%) - Black or African American
Unemployment (%) - Asian
Unemployment (%) - Hispanic or Latino
Unemployment (%) - American Indian and Alaska Native
Unemployment (%) - Multirace
Unemployment (%) - Other Race
Population density (people per square mile)
Population - Males (%)
Population - Females (%)
Population - Males (%) - White
Population - Males (%) - Black or African American
Population - Males (%) - Asian
Population - Males (%) - Hispanic or Latino
Population - Males (%) - American Indian and Alaska Native
Population - Males (%) - Multirace
Population - Males (%) - Other Race
Population - Females (%) - White
Population - Females (%) - Black or African American
Population - Females (%) - Asian
Population - Females (%) - Hispanic or Latino
Population - Females (%) - American Indian and Alaska Native
Population - Females (%) - Multirace
Population - Females (%) - Other Race
Coronavirus confirmed cases (Apr 27, 2024)
Deaths caused by coronavirus (Apr 27, 2024)
Coronavirus confirmed cases (per 100k population) (Apr 27, 2024)
Deaths caused by coronavirus (per 100k population) (Apr 27, 2024)
Daily increase in number of cases (Apr 27, 2024)
Weekly increase in number of cases (Apr 27, 2024)
Cases doubled (in days) (Apr 27, 2024)
Hospitalized patients (Apr 18, 2022)
Negative test results (Apr 18, 2022)
Total test results (Apr 18, 2022)
COVID Vaccine doses distributed (per 100k population) (Sep 19, 2023)
COVID Vaccine doses administered (per 100k population) (Sep 19, 2023)
COVID Vaccine doses distributed (Sep 19, 2023)
COVID Vaccine doses administered (Sep 19, 2023)
Likely homosexual households (%)
Likely homosexual households (% change since 2000)
Likely homosexual households - Lesbian couples (%)
Likely homosexual households - Lesbian couples (% change since 2000)
Likely homosexual households - Gay men (%)
Likely homosexual households - Gay men (% change since 2000)
Cost of living index
Median gross rent ($)
Median contract rent ($)
Median monthly housing costs ($)
Median house or condo value ($)
Median house or condo value ($ change since 2000)
Mean house or condo value by units in structure - 1, detached ($)
Mean house or condo value by units in structure - 1, attached ($)
Mean house or condo value by units in structure - 2 ($)
Mean house or condo value by units in structure by units in structure - 3 or 4 ($)
Mean house or condo value by units in structure - 5 or more ($)
Mean house or condo value by units in structure - Boat, RV, van, etc. ($)
Mean house or condo value by units in structure - Mobile home ($)
Median house or condo value ($) - White
Median house or condo value ($) - Black or African American
Median house or condo value ($) - Asian
Median house or condo value ($) - Hispanic or Latino
Median house or condo value ($) - American Indian and Alaska Native
Median house or condo value ($) - Multirace
Median house or condo value ($) - Other Race
Median resident age
Resident age diversity
Median resident age - Males
Median resident age - Females
Median resident age - White
Median resident age - Black or African American
Median resident age - Asian
Median resident age - Hispanic or Latino
Median resident age - American Indian and Alaska Native
Median resident age - Multirace
Median resident age - Other Race
Median resident age - Males - White
Median resident age - Males - Black or African American
Median resident age - Males - Asian
Median resident age - Males - Hispanic or Latino
Median resident age - Males - American Indian and Alaska Native
Median resident age - Males - Multirace
Median resident age - Males - Other Race
Median resident age - Females - White
Median resident age - Females - Black or African American
Median resident age - Females - Asian
Median resident age - Females - Hispanic or Latino
Median resident age - Females - American Indian and Alaska Native
Median resident age - Females - Multirace
Median resident age - Females - Other Race
Commute - mean travel time to work (minutes)
Travel time to work - Less than 5 minutes (%)
Travel time to work - Less than 5 minutes (% change since 2000)
Travel time to work - 5 to 9 minutes (%)
Travel time to work - 5 to 9 minutes (% change since 2000)
Travel time to work - 10 to 19 minutes (%)
Travel time to work - 10 to 19 minutes (% change since 2000)
Travel time to work - 20 to 29 minutes (%)
Travel time to work - 20 to 29 minutes (% change since 2000)
Travel time to work - 30 to 39 minutes (%)
Travel time to work - 30 to 39 minutes (% change since 2000)
Travel time to work - 40 to 59 minutes (%)
Travel time to work - 40 to 59 minutes (% change since 2000)
Travel time to work - 60 to 89 minutes (%)
Travel time to work - 60 to 89 minutes (% change since 2000)
Travel time to work - 90 or more minutes (%)
Travel time to work - 90 or more minutes (% change since 2000)
Marital status - Never married (%)
Marital status - Now married (%)
Marital status - Separated (%)
Marital status - Widowed (%)
Marital status - Divorced (%)
Median family income ($)
Median family income (% change since 2000)
Median non-family income ($)
Median non-family income (% change since 2000)
Median per capita income ($)
Median per capita income (% change since 2000)
Median family income ($) - White
Median family income ($) - Black or African American
Median family income ($) - Asian
Median family income ($) - Hispanic or Latino
Median family income ($) - American Indian and Alaska Native
Median family income ($) - Multirace
Median family income ($) - Other Race
Median year house/condo built
Median year apartment built
Year house built - Built 2005 or later (%)
Year house built - Built 2000 to 2004 (%)
Year house built - Built 1990 to 1999 (%)
Year house built - Built 1980 to 1989 (%)
Year house built - Built 1970 to 1979 (%)
Year house built - Built 1960 to 1969 (%)
Year house built - Built 1950 to 1959 (%)
Year house built - Built 1940 to 1949 (%)
Year house built - Built 1939 or earlier (%)
Average household size
Household density (households per square mile)
Average household size - White
Average household size - Black or African American
Average household size - Asian
Average household size - Hispanic or Latino
Average household size - American Indian and Alaska Native
Average household size - Multirace
Average household size - Other Race
Occupied housing units (%)
Vacant housing units (%)
Owner occupied housing units (%)
Renter occupied housing units (%)
Vacancy status - For rent (%)
Vacancy status - For sale only (%)
Vacancy status - Rented or sold, not occupied (%)
Vacancy status - For seasonal, recreational, or occasional use (%)
Vacancy status - For migrant workers (%)
Vacancy status - Other vacant (%)
Residents with income below the poverty level (%)
Residents with income below 50% of the poverty level (%)
Children below poverty level (%)
Poor families by family type - Married-couple family (%)
Poor families by family type - Male, no wife present (%)
Poor families by family type - Female, no husband present (%)
Poverty status for native-born residents (%)
Poverty status for foreign-born residents (%)
Poverty among high school graduates not in families (%)
Poverty among people who did not graduate high school not in families (%)
Residents with income below the poverty level (%) - White
Residents with income below the poverty level (%) - Black or African American
Residents with income below the poverty level (%) - Asian
Residents with income below the poverty level (%) - Hispanic or Latino
Residents with income below the poverty level (%) - American Indian and Alaska Native
Residents with income below the poverty level (%) - Multirace
Residents with income below the poverty level (%) - Other Race
Air pollution - Air Quality Index (AQI)
Air pollution - CO
Air pollution - NO2
Air pollution - SO2
Air pollution - Ozone
Air pollution - PM10
Air pollution - PM25
Air pollution - Pb
Crime - Murders per 100,000 population
Crime - Rapes per 100,000 population
Crime - Robberies per 100,000 population
Crime - Assaults per 100,000 population
Crime - Burglaries per 100,000 population
Crime - Thefts per 100,000 population
Crime - Auto thefts per 100,000 population
Crime - Arson per 100,000 population
Crime - City-data.com crime index
Crime - Violent crime index
Crime - Property crime index
Crime - Murders per 100,000 population (5 year average)
Crime - Rapes per 100,000 population (5 year average)
Crime - Robberies per 100,000 population (5 year average)
Crime - Assaults per 100,000 population (5 year average)
Crime - Burglaries per 100,000 population (5 year average)
Crime - Thefts per 100,000 population (5 year average)
Crime - Auto thefts per 100,000 population (5 year average)
Crime - Arson per 100,000 population (5 year average)
Crime - City-data.com crime index (5 year average)
Crime - Violent crime index (5 year average)
Crime - Property crime index (5 year average)
1996 Presidential Elections Results (%) - Democratic Party (Clinton)
1996 Presidential Elections Results (%) - Republican Party (Dole)
1996 Presidential Elections Results (%) - Other
2000 Presidential Elections Results (%) - Democratic Party (Gore)
2000 Presidential Elections Results (%) - Republican Party (Bush)
2000 Presidential Elections Results (%) - Other
2004 Presidential Elections Results (%) - Democratic Party (Kerry)
2004 Presidential Elections Results (%) - Republican Party (Bush)
2004 Presidential Elections Results (%) - Other
2008 Presidential Elections Results (%) - Democratic Party (Obama)
2008 Presidential Elections Results (%) - Republican Party (McCain)
2008 Presidential Elections Results (%) - Other
2012 Presidential Elections Results (%) - Democratic Party (Obama)
2012 Presidential Elections Results (%) - Republican Party (Romney)
2012 Presidential Elections Results (%) - Other
2016 Presidential Elections Results (%) - Democratic Party (Clinton)
2016 Presidential Elections Results (%) - Republican Party (Trump)
2016 Presidential Elections Results (%) - Other
2020 Presidential Elections Results (%) - Democratic Party (Biden)
2020 Presidential Elections Results (%) - Republican Party (Trump)
2020 Presidential Elections Results (%) - Other
Ancestries Reported - Arab (%)
Ancestries Reported - Czech (%)
Ancestries Reported - Danish (%)
Ancestries Reported - Dutch (%)
Ancestries Reported - English (%)
Ancestries Reported - French (%)
Ancestries Reported - French Canadian (%)
Ancestries Reported - German (%)
Ancestries Reported - Greek (%)
Ancestries Reported - Hungarian (%)
Ancestries Reported - Irish (%)
Ancestries Reported - Italian (%)
Ancestries Reported - Lithuanian (%)
Ancestries Reported - Norwegian (%)
Ancestries Reported - Polish (%)
Ancestries Reported - Portuguese (%)
Ancestries Reported - Russian (%)
Ancestries Reported - Scotch-Irish (%)
Ancestries Reported - Scottish (%)
Ancestries Reported - Slovak (%)
Ancestries Reported - Subsaharan African (%)
Ancestries Reported - Swedish (%)
Ancestries Reported - Swiss (%)
Ancestries Reported - Ukrainian (%)
Ancestries Reported - United States (%)
Ancestries Reported - Welsh (%)
Ancestries Reported - West Indian (%)
Ancestries Reported - Other (%)
Educational Attainment - No schooling completed (%)
Educational Attainment - Less than high school (%)
Educational Attainment - High school or equivalent (%)
Educational Attainment - Less than 1 year of college (%)
Educational Attainment - 1 or more years of college (%)
Educational Attainment - Associate degree (%)
Educational Attainment - Bachelor's degree (%)
Educational Attainment - Master's degree (%)
Educational Attainment - Professional school degree (%)
Educational Attainment - Doctorate degree (%)
School Enrollment - Nursery, preschool (%)
School Enrollment - Kindergarten (%)
School Enrollment - Grade 1 to 4 (%)
School Enrollment - Grade 5 to 8 (%)
School Enrollment - Grade 9 to 12 (%)
School Enrollment - College undergrad (%)
School Enrollment - Graduate or professional (%)
School Enrollment - Not enrolled in school (%)
School enrollment - Public schools (%)
School enrollment - Private schools (%)
School enrollment - Not enrolled (%)
Median number of rooms in houses and condos
Median number of rooms in apartments
Housing units lacking complete plumbing facilities (%)
Housing units lacking complete kitchen facilities (%)
Density of houses
Urban houses (%)
Rural houses (%)
Households with people 60 years and over (%)
Households with people 65 years and over (%)
Households with people 75 years and over (%)
Households with one or more nonrelatives (%)
Households with no nonrelatives (%)
Population in households (%)
Family households (%)
Nonfamily households (%)
Population in families (%)
Family households with own children (%)
Median number of bedrooms in owner occupied houses
Mean number of bedrooms in owner occupied houses
Median number of bedrooms in renter occupied houses
Mean number of bedrooms in renter occupied houses
Median number of vehichles in owner occupied houses
Mean number of vehichles in owner occupied houses
Median number of vehichles in renter occupied houses
Mean number of vehichles in renter occupied houses
Mortgage status - with mortgage (%)
Mortgage status - with second mortgage (%)
Mortgage status - with home equity loan (%)
Mortgage status - with both second mortgage and home equity loan (%)
Mortgage status - without a mortgage (%)
Average family size
Average family size - White
Average family size - Black or African American
Average family size - Asian
Average family size - Hispanic or Latino
Average family size - American Indian and Alaska Native
Average family size - Multirace
Average family size - Other Race
Geographical mobility - Same house 1 year ago (%)
Geographical mobility - Moved within same county (%)
Geographical mobility - Moved from different county within same state (%)
Geographical mobility - Moved from different state (%)
Geographical mobility - Moved from abroad (%)
Place of birth - Born in state of residence (%)
Place of birth - Born in other state (%)
Place of birth - Native, outside of US (%)
Place of birth - Foreign born (%)
Housing units in structures - 1, detached (%)
Housing units in structures - 1, attached (%)
Housing units in structures - 2 (%)
Housing units in structures - 3 or 4 (%)
Housing units in structures - 5 to 9 (%)
Housing units in structures - 10 to 19 (%)
Housing units in structures - 20 to 49 (%)
Housing units in structures - 50 or more (%)
Housing units in structures - Mobile home (%)
Housing units in structures - Boat, RV, van, etc. (%)
House/condo owner moved in on average (years ago)
Renter moved in on average (years ago)
Year householder moved into unit - Moved in 1999 to March 2000 (%)
Year householder moved into unit - Moved in 1995 to 1998 (%)
Year householder moved into unit - Moved in 1990 to 1994 (%)
Year householder moved into unit - Moved in 1980 to 1989 (%)
Year householder moved into unit - Moved in 1970 to 1979 (%)
Year householder moved into unit - Moved in 1969 or earlier (%)
Means of transportation to work - Drove car alone (%)
Means of transportation to work - Carpooled (%)
Means of transportation to work - Public transportation (%)
Means of transportation to work - Bus or trolley bus (%)
Means of transportation to work - Streetcar or trolley car (%)
Means of transportation to work - Subway or elevated (%)
Means of transportation to work - Railroad (%)
Means of transportation to work - Ferryboat (%)
Means of transportation to work - Taxicab (%)
Means of transportation to work - Motorcycle (%)
Means of transportation to work - Bicycle (%)
Means of transportation to work - Walked (%)
Means of transportation to work - Other means (%)
Working at home (%)
Industry diversity
Most Common Industries - Agriculture, forestry, fishing and hunting, and mining (%)
Most Common Industries - Agriculture, forestry, fishing and hunting (%)
Most Common Industries - Mining, quarrying, and oil and gas extraction (%)
Most Common Industries - Construction (%)
Most Common Industries - Manufacturing (%)
Most Common Industries - Wholesale trade (%)
Most Common Industries - Retail trade (%)
Most Common Industries - Transportation and warehousing, and utilities (%)
Most Common Industries - Transportation and warehousing (%)
Most Common Industries - Utilities (%)
Most Common Industries - Information (%)
Most Common Industries - Finance and insurance, and real estate and rental and leasing (%)
Most Common Industries - Finance and insurance (%)
Most Common Industries - Real estate and rental and leasing (%)
Most Common Industries - Professional, scientific, and management, and administrative and waste management services (%)
Most Common Industries - Professional, scientific, and technical services (%)
Most Common Industries - Management of companies and enterprises (%)
Most Common Industries - Administrative and support and waste management services (%)
Most Common Industries - Educational services, and health care and social assistance (%)
Most Common Industries - Educational services (%)
Most Common Industries - Health care and social assistance (%)
Most Common Industries - Arts, entertainment, and recreation, and accommodation and food services (%)
Most Common Industries - Arts, entertainment, and recreation (%)
Most Common Industries - Accommodation and food services (%)
Most Common Industries - Other services, except public administration (%)
Most Common Industries - Public administration (%)
Occupation diversity
Most Common Occupations - Management, business, science, and arts occupations (%)
Most Common Occupations - Management, business, and financial occupations (%)
Most Common Occupations - Management occupations (%)
Most Common Occupations - Business and financial operations occupations (%)
Most Common Occupations - Computer, engineering, and science occupations (%)
Most Common Occupations - Computer and mathematical occupations (%)
Most Common Occupations - Architecture and engineering occupations (%)
Most Common Occupations - Life, physical, and social science occupations (%)
Most Common Occupations - Education, legal, community service, arts, and media occupations (%)
Most Common Occupations - Community and social service occupations (%)
Most Common Occupations - Legal occupations (%)
Most Common Occupations - Education, training, and library occupations (%)
Most Common Occupations - Arts, design, entertainment, sports, and media occupations (%)
Most Common Occupations - Healthcare practitioners and technical occupations (%)
Most Common Occupations - Health diagnosing and treating practitioners and other technical occupations (%)
Most Common Occupations - Health technologists and technicians (%)
Most Common Occupations - Service occupations (%)
Most Common Occupations - Healthcare support occupations (%)
Most Common Occupations - Protective service occupations (%)
Most Common Occupations - Fire fighting and prevention, and other protective service workers including supervisors (%)
Most Common Occupations - Law enforcement workers including supervisors (%)
Most Common Occupations - Food preparation and serving related occupations (%)
Most Common Occupations - Building and grounds cleaning and maintenance occupations (%)
Most Common Occupations - Personal care and service occupations (%)
Most Common Occupations - Sales and office occupations (%)
Most Common Occupations - Sales and related occupations (%)
Most Common Occupations - Office and administrative support occupations (%)
Most Common Occupations - Natural resources, construction, and maintenance occupations (%)
Most Common Occupations - Farming, fishing, and forestry occupations (%)
Most Common Occupations - Construction and extraction occupations (%)
Most Common Occupations - Installation, maintenance, and repair occupations (%)
Most Common Occupations - Production, transportation, and material moving occupations (%)
Most Common Occupations - Production occupations (%)
Most Common Occupations - Transportation occupations (%)
Most Common Occupations - Material moving occupations (%)
People in Group quarters - Institutionalized population (%)
People in Group quarters - Correctional institutions (%)
People in Group quarters - Federal prisons and detention centers (%)
People in Group quarters - Halfway houses (%)
People in Group quarters - Local jails and other confinement facilities (including police lockups) (%)
People in Group quarters - Military disciplinary barracks (%)
People in Group quarters - State prisons (%)
People in Group quarters - Other types of correctional institutions (%)
People in Group quarters - Nursing homes (%)
People in Group quarters - Hospitals/wards, hospices, and schools for the handicapped (%)
People in Group quarters - Hospitals/wards and hospices for chronically ill (%)
People in Group quarters - Hospices or homes for chronically ill (%)
People in Group quarters - Military hospitals or wards for chronically ill (%)
People in Group quarters - Other hospitals or wards for chronically ill (%)
People in Group quarters - Hospitals or wards for drug/alcohol abuse (%)
People in Group quarters - Mental (Psychiatric) hospitals or wards (%)
People in Group quarters - Schools, hospitals, or wards for the mentally retarded (%)
People in Group quarters - Schools, hospitals, or wards for the physically handicapped (%)
People in Group quarters - Institutions for the deaf (%)
People in Group quarters - Institutions for the blind (%)
People in Group quarters - Orthopedic wards and institutions for the physically handicapped (%)
People in Group quarters - Wards in general hospitals for patients who have no usual home elsewhere (%)
People in Group quarters - Wards in military hospitals for patients who have no usual home elsewhere (%)
People in Group quarters - Juvenile institutions (%)
People in Group quarters - Long-term care (%)
People in Group quarters - Homes for abused, dependent, and neglected children (%)
People in Group quarters - Residential treatment centers for emotionally disturbed children (%)
People in Group quarters - Training schools for juvenile delinquents (%)
People in Group quarters - Short-term care, detention or diagnostic centers for delinquent children (%)
People in Group quarters - Type of juvenile institution unknown (%)
People in Group quarters - Noninstitutionalized population (%)
People in Group quarters - College dormitories (includes college quarters off campus) (%)
People in Group quarters - Military quarters (%)
People in Group quarters - On base (%)
People in Group quarters - Barracks, unaccompanied personnel housing (UPH), (Enlisted/Officer), ;and similar group living quarters for military personnel (%)
People in Group quarters - Transient quarters for temporary residents (%)
People in Group quarters - Military ships (%)
People in Group quarters - Group homes (%)
People in Group quarters - Homes or halfway houses for drug/alcohol abuse (%)
People in Group quarters - Homes for the mentally ill (%)
People in Group quarters - Homes for the mentally retarded (%)
People in Group quarters - Homes for the physically handicapped (%)
People in Group quarters - Other group homes (%)
People in Group quarters - Religious group quarters (%)
People in Group quarters - Dormitories (%)
People in Group quarters - Agriculture workers' dormitories on farms (%)
People in Group quarters - Job Corps and vocational training facilities (%)
People in Group quarters - Other workers' dormitories (%)
People in Group quarters - Crews of maritime vessels (%)
People in Group quarters - Other nonhousehold living situations (%)
People in Group quarters - Other noninstitutional group quarters (%)
Residents speaking English at home (%)
Residents speaking English at home - Born in the United States (%)
Residents speaking English at home - Native, born elsewhere (%)
Residents speaking English at home - Foreign born (%)
Residents speaking Spanish at home (%)
Residents speaking Spanish at home - Born in the United States (%)
Residents speaking Spanish at home - Native, born elsewhere (%)
Residents speaking Spanish at home - Foreign born (%)
Residents speaking other language at home (%)
Residents speaking other language at home - Born in the United States (%)
Residents speaking other language at home - Native, born elsewhere (%)
Residents speaking other language at home - Foreign born (%)
Class of Workers - Employee of private company (%)
Class of Workers - Self-employed in own incorporated business (%)
Class of Workers - Private not-for-profit wage and salary workers (%)
Class of Workers - Local government workers (%)
Class of Workers - State government workers (%)
Class of Workers - Federal government workers (%)
Class of Workers - Self-employed workers in own not incorporated business and Unpaid family workers (%)
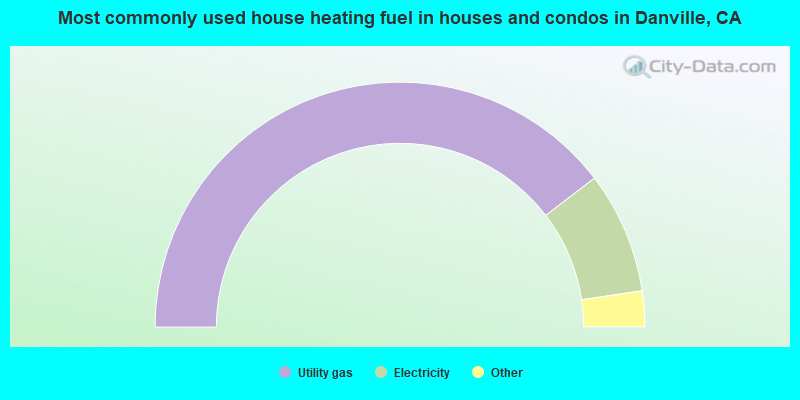
House heating fuel used in houses and condos - Utility gas (%)
House heating fuel used in houses and condos - Bottled, tank, or LP gas (%)
House heating fuel used in houses and condos - Electricity (%)
House heating fuel used in houses and condos - Fuel oil, kerosene, etc. (%)
House heating fuel used in houses and condos - Coal or coke (%)
House heating fuel used in houses and condos - Wood (%)
House heating fuel used in houses and condos - Solar energy (%)
House heating fuel used in houses and condos - Other fuel (%)
House heating fuel used in houses and condos - No fuel used (%)
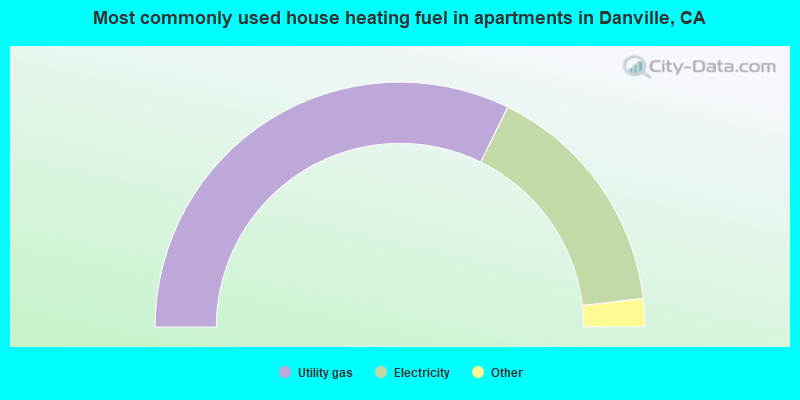
House heating fuel used in apartments - Utility gas (%)
House heating fuel used in apartments - Bottled, tank, or LP gas (%)
House heating fuel used in apartments - Electricity (%)
House heating fuel used in apartments - Fuel oil, kerosene, etc. (%)
House heating fuel used in apartments - Coal or coke (%)
House heating fuel used in apartments - Wood (%)
House heating fuel used in apartments - Solar energy (%)
House heating fuel used in apartments - Other fuel (%)
House heating fuel used in apartments - No fuel used (%)
Armed forces status - In Armed Forces (%)
Armed forces status - Civilian (%)
Armed forces status - Civilian - Veteran (%)
Armed forces status - Civilian - Nonveteran (%)
Fatal accidents locations in years 2005-2021
Fatal accidents locations in 2005
Fatal accidents locations in 2006
Fatal accidents locations in 2007
Fatal accidents locations in 2008
Fatal accidents locations in 2009
Fatal accidents locations in 2010
Fatal accidents locations in 2011
Fatal accidents locations in 2012
Fatal accidents locations in 2013
Fatal accidents locations in 2014
Fatal accidents locations in 2015
Fatal accidents locations in 2016
Fatal accidents locations in 2017
Fatal accidents locations in 2018
Fatal accidents locations in 2019
Fatal accidents locations in 2020
Fatal accidents locations in 2021
Alcohol use - People drinking some alcohol every month (%)
Alcohol use - People not drinking at all (%)
Alcohol use - Average days/month drinking alcohol
Alcohol use - Average drinks/week
Alcohol use - Average days/year people drink much
Audiometry - Average condition of hearing (%)
Audiometry - People that can hear a whisper from across a quiet room (%)
Audiometry - People that can hear normal voice from across a quiet room (%)
Audiometry - Ears ringing, roaring, buzzing (%)
Audiometry - Had a job exposure to loud noise (%)
Audiometry - Had off-work exposure to loud noise (%)
Blood Pressure & Cholesterol - Has high blood pressure (%)
Blood Pressure & Cholesterol - Checking blood pressure at home (%)
Blood Pressure & Cholesterol - Frequently checking blood cholesterol (%)
Blood Pressure & Cholesterol - Has high cholesterol level (%)
Consumer Behavior - Money monthly spent on food at supermarket/grocery store
Consumer Behavior - Money monthly spent on food at other stores
Consumer Behavior - Money monthly spent on eating out
Consumer Behavior - Money monthly spent on carryout/delivered foods
Consumer Behavior - Income spent on food at supermarket/grocery store (%)
Consumer Behavior - Income spent on food at other stores (%)
Consumer Behavior - Income spent on eating out (%)
Consumer Behavior - Income spent on carryout/delivered foods (%)
Current Health Status - General health condition (%)
Current Health Status - Blood donors (%)
Current Health Status - Has blood ever tested for HIV virus (%)
Current Health Status - Left-handed people (%)
Dermatology - People using sunscreen (%)
Diabetes - Diabetics (%)
Diabetes - Had a blood test for high blood sugar (%)
Diabetes - People taking insulin (%)
Diet Behavior & Nutrition - Diet health (%)
Diet Behavior & Nutrition - Milk product consumption (# of products/month)
Diet Behavior & Nutrition - Meals not home prepared (#/week)
Diet Behavior & Nutrition - Meals from fast food or pizza place (#/week)
Diet Behavior & Nutrition - Ready-to-eat foods (#/month)
Diet Behavior & Nutrition - Frozen meals/pizza (#/month)
Drug Use - People that ever used marijuana or hashish (%)
Drug Use - Ever used hard drugs (%)
Drug Use - Ever used any form of cocaine (%)
Drug Use - Ever used heroin (%)
Drug Use - Ever used methamphetamine (%)
Health Insurance - People covered by health insurance (%)
Kidney Conditions-Urology - Avg. # of times urinating at night
Medical Conditions - People with asthma (%)
Medical Conditions - People with anemia (%)
Medical Conditions - People with psoriasis (%)
Medical Conditions - People with overweight (%)
Medical Conditions - Elderly people having difficulties in thinking or remembering (%)
Medical Conditions - People who ever received blood transfusion (%)
Medical Conditions - People having trouble seeing even with glass/contacts (%)
Medical Conditions - People with arthritis (%)
Medical Conditions - People with gout (%)
Medical Conditions - People with congestive heart failure (%)
Medical Conditions - People with coronary heart disease (%)
Medical Conditions - People with angina pectoris (%)
Medical Conditions - People who ever had heart attack (%)
Medical Conditions - People who ever had stroke (%)
Medical Conditions - People with emphysema (%)
Medical Conditions - People with thyroid problem (%)
Medical Conditions - People with chronic bronchitis (%)
Medical Conditions - People with any liver condition (%)
Medical Conditions - People who ever had cancer or malignancy (%)
Mental Health - People who have little interest in doing things (%)
Mental Health - People feeling down, depressed, or hopeless (%)
Mental Health - People who have trouble sleeping or sleeping too much (%)
Mental Health - People feeling tired or having little energy (%)
Mental Health - People with poor appetite or overeating (%)
Mental Health - People feeling bad about themself (%)
Mental Health - People who have trouble concentrating on things (%)
Mental Health - People moving or speaking slowly or too fast (%)
Mental Health - People having thoughts they would be better off dead (%)
Oral Health - Average years since last visit a dentist
Oral Health - People embarrassed because of mouth (%)
Oral Health - People with gum disease (%)
Oral Health - General health of teeth and gums (%)
Oral Health - Average days a week using dental floss/device
Oral Health - Average days a week using mouthwash for dental problem
Oral Health - Average number of teeth
Pesticide Use - Households using pesticides to control insects (%)
Pesticide Use - Households using pesticides to kill weeds (%)
Physical Activity - People doing vigorous-intensity work activities (%)
Physical Activity - People doing moderate-intensity work activities (%)
Physical Activity - People walking or bicycling (%)
Physical Activity - People doing vigorous-intensity recreational activities (%)
Physical Activity - People doing moderate-intensity recreational activities (%)
Physical Activity - Average hours a day doing sedentary activities
Physical Activity - Average hours a day watching TV or videos
Physical Activity - Average hours a day using computer
Physical Functioning - People having limitations keeping them from working (%)
Physical Functioning - People limited in amount of work they can do (%)
Physical Functioning - People that need special equipment to walk (%)
Physical Functioning - People experiencing confusion/memory problems (%)
Physical Functioning - People requiring special healthcare equipment (%)
Prescription Medications - Average number of prescription medicines taking
Preventive Aspirin Use - Adults 40+ taking low-dose aspirin (%)
Reproductive Health - Vaginal deliveries (%)
Reproductive Health - Cesarean deliveries (%)
Reproductive Health - Deliveries resulted in a live birth (%)
Reproductive Health - Pregnancies resulted in a delivery (%)
Reproductive Health - Women breastfeeding newborns (%)
Reproductive Health - Women that had a hysterectomy (%)
Reproductive Health - Women that had both ovaries removed (%)
Reproductive Health - Women that have ever taken birth control pills (%)
Reproductive Health - Women taking birth control pills (%)
Reproductive Health - Women that have ever used Depo-Provera or injectables (%)
Reproductive Health - Women that have ever used female hormones (%)
Sexual Behavior - People 18+ that ever had sex (vaginal, anal, or oral) (%)
Sexual Behavior - Males 18+ that ever had vaginal sex with a woman (%)
Sexual Behavior - Males 18+ that ever performed oral sex on a woman (%)
Sexual Behavior - Males 18+ that ever had anal sex with a woman (%)
Sexual Behavior - Males 18+ that ever had any sex with a man (%)
Sexual Behavior - Females 18+ that ever had vaginal sex with a man (%)
Sexual Behavior - Females 18+ that ever performed oral sex on a man (%)
Sexual Behavior - Females 18+ that ever had anal sex with a man (%)
Sexual Behavior - Females 18+ that ever had any kind of sex with a woman (%)
Sexual Behavior - Average age people first had sex
Sexual Behavior - Average number of female sex partners in lifetime (males 18+)
Sexual Behavior - Average number of female vaginal sex partners in lifetime (males 18+)
Sexual Behavior - Average age people first performed oral sex on a woman (18+)
Sexual Behavior - Average number of woman performed oral sex on in lifetime (18+)
Sexual Behavior - Average number of male sex partners in lifetime (males 18+)
Sexual Behavior - Average number of male anal sex partners in lifetime (males 18+)
Sexual Behavior - Average age people first performed oral sex on a man (18+)
Sexual Behavior - Average number of male oral sex partners in lifetime (18+)
Sexual Behavior - People using protection when performing oral sex (%)
Sexual Behavior - Average number of times people have vaginal or anal sex a year
Sexual Behavior - People having sex without condom (%)
Sexual Behavior - Average number of male sex partners in lifetime (females 18+)
Sexual Behavior - Average number of male vaginal sex partners in lifetime (females 18+)
Sexual Behavior - Average number of female sex partners in lifetime (females 18+)
Sexual Behavior - Circumcised males 18+ (%)
Sleep Disorders - Average hours sleeping at night
Sleep Disorders - People that has trouble sleeping (%)
Smoking-Cigarette Use - People smoking cigarettes (%)
Taste & Smell - People 40+ having problems with smell (%)
Taste & Smell - People 40+ having problems with taste (%)
Taste & Smell - People 40+ that ever had wisdom teeth removed (%)
Taste & Smell - People 40+ that ever had tonsils teeth removed (%)
Taste & Smell - People 40+ that ever had a loss of consciousness because of a head injury (%)
Taste & Smell - People 40+ that ever had a broken nose or other serious injury to face or skull (%)
Taste & Smell - People 40+ that ever had two or more sinus infections (%)
Weight - Average height (inches)
Weight - Average weight (pounds)
Weight - Average BMI
Weight - People that are obese (%)
Weight - People that ever were obese (%)
Weight - People trying to lose weight (%)
28,416 65.7% White alone 8,237 19.1% Asian alone 3,069 7.1% Hispanic 2,224 5.1% Two or more races 237 0.5% Black alone 80 0.2% Other race alone 15 0.03% Native Hawaiian and Other 6 0.01% American Indian alone
According to our research of California and other state lists, there were 8 registered sex offenders living in Danville, California as of April 27, 2024 . The ratio of all residents to sex offenders in Danville is 5,604 to 1.The ratio of registered sex offenders to all residents in this city is much lower than the state average.
Officers per 1,000 residents here:
0.02California average:
1.98
Latest news from Danville, CA collected exclusively by city-data.com from local newspapers, TV, and radio stations
Ancestries: Italian (7.1%), American (6.5%), German (6.2%), English (5.9%), Irish (5.8%), European (4.6%).
Current Local Time:
Incorporated on 07/1/1982
Land area: 18.1 square miles.
Population density: 2,362 people per square mile (low).
7,458 residents are foreign born (10.8% Asia , 3.8% Europe ).
This town:
17.2%California:
26.5%
Median real estate property taxes paid for housing units with mortgages in 2022: $10,187 (0.6%)Median real estate property taxes paid for housing units with no mortgage in 2022: $6,971 (0.5%)
Nearest city with pop. 50,000+: Walnut Creek, CA
Nearest city with pop. 200,000+: Central Contra Costa, CA (8.4 miles
Nearest city with pop. 1,000,000+: Los Angeles, CA
Nearest cities:
Latitude: 37.81 N, Longitude: 121.97 W
Daytime population change due to commuting: -1,731 (-4.0%)Workers who live and work in this town: 10,421 (52.0%)
Danville tourist attractions:
Single-family new house construction building permits:
2022: 49 buildings , average cost: $482,8002021: 38 buildings , average cost: $256,5002020: 32 buildings , average cost: $636,5002019: 40 buildings , average cost: $603,8002018: 24 buildings , average cost: $750,8002017: 16 buildings , average cost: $767,5002016: 17 buildings , average cost: $806,7002015: 63 buildings , average cost: $738,0002014: 29 buildings , average cost: $638,0002013: 63 buildings , average cost: $474,8002012: 28 buildings , average cost: $800,3002011: 13 buildings , average cost: $627,4002010: 20 buildings , average cost: $719,9002009: 6 buildings , average cost: $663,1002008: 35 buildings , average cost: $208,5002007: 20 buildings , average cost: $713,0002006: 15 buildings , average cost: $999,9002005: 40 buildings , average cost: $179,6002004: 36 buildings , average cost: $167,9002003: 22 buildings , average cost: $164,7002002: 34 buildings , average cost: $157,3002001: 72 buildings , average cost: $152,0002000: 55 buildings , average cost: $169,5001999: 217 buildings , average cost: $269,6001998: 210 buildings , average cost: $308,8001997: 168 buildings , average cost: $297,200Unemployment in December 2023: Population change in the 1990s: +10,255 (+32.6%).
Most common occupations in Danville, CA (%)
Both Males Females
Other management occupations, except farmers and farm managers (8.0%)
Other sales and related occupations, including supervisors (7.2%)
Top executives (6.8%)
Sales representatives, services, wholesale and manufacturing (6.3%)
Advertising, marketing, promotions, public relations, and sales managers (4.6%)
Computer specialists (4.6%)
Preschool, kindergarten, elementary, and middle school teachers (3.5%)
Top executives (10.5%)
Other management occupations, except farmers and farm managers (9.5%)
Sales representatives, services, wholesale and manufacturing (8.1%)
Other sales and related occupations, including supervisors (7.5%)
Advertising, marketing, promotions, public relations, and sales managers (5.5%)
Computer specialists (5.3%)
Engineers (4.4%)
Preschool, kindergarten, elementary, and middle school teachers (7.1%)
Other sales and related occupations, including supervisors (6.9%)
Other management occupations, except farmers and farm managers (6.2%)
Secretaries and administrative assistants (5.9%)
Retail sales workers, except cashiers (4.9%)
Sales representatives, services, wholesale and manufacturing (4.0%)
Other office and administrative support workers, including supervisors (3.9%)
Earthquake activity:
Danville-area historical earthquake activity is significantly above California state average. It is 7719% greater than the overall U.S. average. On 4/18/1906 at 13:12:21, a magnitude 7.9 (7.9 UK, Class: Major, Intensity: VIII - XII) earthquake occurred 57.5 miles away from the city center, causing $524,000,000 total damage On 10/18/1989 at 00:04:15, a magnitude 7.1 (6.5 MB, 7.1 MS, 6.9 MW, 7.0 ML) earthquake occurred 49.8 miles away from the city center, causing 62 deaths ( 62 shaking deaths) and 3757 injuries, causing $1,305,032,704 total damage On 11/4/1927 at 13:51:53, a magnitude 7.5 (7.5 UK) earthquake occurred 207.1 miles away from Danville center On 7/21/1952 at 11:52:14, a magnitude 7.7 (7.7 UK) earthquake occurred 255.4 miles away from the city center, causing $50,000,000 total damage On 1/31/1922 at 13:17:28, a magnitude 7.6 (7.6 UK) earthquake occurred 276.8 miles away from Danville center On 4/25/1992 at 18:06:04, a magnitude 7.2 (6.3 MB, 7.1 MS, 7.2 MW, 7.1 MW, Depth: 9.4 mi) earthquake occurred 208.5 miles away from the city center, causing $75,000,000 total damage Magnitude types: body-wave magnitude (MB), local magnitude (ML), surface-wave magnitude (MS), moment magnitude (MW) Natural disasters: The number of natural disasters in Contra Costa County (18) is near the US average (15).Major Disasters (Presidential) Declared: 11Emergencies Declared: 3Floods: 13, Storms: 7, Winter Storms: 7, Mudslides: 5, Landslides: 4, Drought: 1, Earthquake: 1, Hurricane: 1, Tornado: 1, Wind: 1, Other: 1 (Note: some incidents may be assigned to more than one category). Hospitals and medical centers in Danville: DANVILLE REHABILITATION (336 DIABLO ROAD)
DIABLO CONVALESCENT HOSPITAL (336 DIABLO RD)
HOME FOR JEWISH PARENTS (4000 CAMINO TASSAJARA)
Amtrak stations near Danville: 9 miles: EAST DUBLIN-PLEASANTON (PLEASANTON, OWENS DR. AT BART WAY) - Bus Station 13 miles: HAYWARD (22555 MEEKLAND AVE.) Services: fully wheelchair accessible, public payphones, free short-term parking.
15 miles: LIVERMORE (720 LAS FLORES DR.) - Bus Station Services: fully wheelchair accessible, enclosed waiting area, public restrooms, public payphones, full-service food facilities, free short-term parking, free long-term parking, call for taxi service, intercity bus service, public transit connection.
College/University in Danville: W Academy of Salon and Spa Full-time enrollment: 40; Location: 520 San Ramon Valley Blvd; Private, for-profit; Website: wacademyofsalonandspa.com/)
Colleges/universities with over 2000 students nearest to Danville:
Saint Mary's College of California (about 8 miles; Moraga, CA ; Full-time enrollment: 4,200)
Merritt College (about 11 miles; Oakland, CA ; FT enrollment: 2,842)
California State University-East Bay (about 12 miles; Hayward, CA ; FT enrollment: 12,956)
Las Positas College (about 12 miles; Livermore, CA ; FT enrollment: 5,112)
Diablo Valley College (about 13 miles; Pleasant Hill, CA ; FT enrollment: 13,015)
Chabot College (about 14 miles; Hayward, CA ; FT enrollment: 7,610)
Los Medanos College (about 15 miles; Pittsburg, CA ; FT enrollment: 5,289)
Public high schools in Danville: MONTE VISTA HIGH Students: 1,515, Location: 3131 STONE VALLEY RD., Grades: 9-12)DEL AMIGO HIGH (CONTINUATION) Students: 21, Location: 189 DEL AMIGO RD., Grades: 7-12)SAN RAMON VALLEY HIGH Location: 501 DANVILLE BLVD., Grades: 9-12)
Private high school in Danville: THE ATHENIAN SCHOOL Students: 472, Location: 2100 MOUNT DIABLO SCENIC BLVD, Grades: 6-12)
Biggest public elementary/middle schools in Danville: CHARLOTTE WOOD MIDDLE Students: 940, Location: 600 EL CAPITAN DR., Grades: 6-8)DIABLO VISTA MIDDLE Students: 661, Location: 4100 CAMINO TASSAJARA, Grades: 6-8)LOS CERROS MIDDLE Students: 607, Location: 968 BLEMER RD., Grades: 6-8)GREEN VALLEY ELEMENTARY Students: 464, Location: 1001 DIABLO RD., Grades: KG-5)TASSAJARA HILLS ELEMENTARY Students: 437, Location: 4675 CAMINO TASSAJARA RD., Grades: KG-5)SYCAMORE VALLEY ELEMENTARY Students: 422, Location: 2200 HOLBROOK DR., Grades: KG-5)GREENBROOK ELEMENTARY Students: 408, Location: 1475 HARLAN DR., Grades: KG-5)VISTA GRANDE ELEMENTARY Students: 382, Location: 667 DIABLO RD., Grades: KG-5)JOHN BALDWIN ELEMENTARY Students: 379, Location: 741 BROOKSIDE DR., Grades: KG-5)CREEKSIDE ELEMENTARY Students: 303, Location: 6011 MASSARA ST., Grades: KG-5)Private elementary/middle schools in Danville: ST ISIDORE SCHOOL Students: 640, Location: 435 LA GONDA WAY, Grades: KG-8)
SAN RAMON VALLEY CHRISTIAN ACADEMY Students: 342, Location: 220 W EL PINTADO, Grades: KG-8)
See full list of schools located in Danville User-submitted facts and corrections:
Private High School: Athenian School, Danville, CA
Notable locations in Danville: (A) , San Damiano Retreat (B) , Crow Canyon Country Club (C) , Danville Library (D) , San Ramon Valley Fire Protection District Station 35 (E) , San Ramon Valley Fire Protection District Station 33 (F) , San Ramon Valley Fire Protection District Station 31 (G) , Danville City Hall (H) . Display/hide their locations on the map
Shopping Centers: (1) , Danville Town and Country Shopping Center (2) , Sycamore Square Shopping Center (3) , Tassajara Crossing Shopping Center (4) , The Livery Shopping Center (5) . Display/hide their locations on the map
Creeks: (A) , Sycamore Creek (B) . Display/hide their locations on the map
Parks in Danville include: (1) , La Vista Park (2) , Osage Park (3) , Sycamore Valley Park (4) . Display/hide their locations on the map
Tourist attractions: (1) , Blackhawk Automotive Museum (3700 Blackhawk Plaza Circle) (2) . Display/hide their approximate locations on the map
Hotels: (1) , All Occasion Travel- An Independent Agent For America Travel's Compa (123 Zephyr Place) (2) . Display/hide their approximate locations on the map
Birthplace of: Kyle Davies (soccer) - Soccer player, Kyle Wright - Football quarterback, Nancy Tellem - Television executive, Sam Keller - Football player, David Zuckerman - Tv producer, Chris Wondolowski - Major League Soccer player (San Jose, born : Jul 28, 1983), Cory Higgins - Basketball player, Jeff Kopp - Football player.
Contra Costa County has a predicted average indoor radon screening level between 2 and 4 pCi/L (pico curies per liter) - Moderate Potential Drinking water stations with addresses in Danville that have no violations reported:
BIG WHEEL MOBILE HOME PARK (Population served: 120, Primary Water Source Type: Groundwater)
MARK TWAIN MOTEL (Population served: 25, Primary Water Source Type: Groundwater)
Average household size: This town:
2.7 peopleCalifornia:
2.9 people
Percentage of family households: This town:
77.7%Whole state:
68.7%
Percentage of households with unmarried partners: This town:
3.5%Whole state:
7.2%
Likely homosexual households (counted as self-reported same-sex unmarried-partner households)
Lesbian couples: 0.3% of all households Gay men: 0.3% of all households
People in group quarters in Danville in 2010:
183 people in nursing facilities/skilled-nursing facilities
24 people in workers' group living quarters and job corps centers
22 people in group homes intended for adults
10 people in other noninstitutional facilities
4 people in group homes for juveniles (non-correctional)
People in group quarters in Danville in 2000:
337 people in other noninstitutional group quarters
94 people in nursing homes
11 people in homes for the physically handicapped
8 people in homes for the mentally retarded
8 people in other group homes
5 people in religious group quarters
Banks with most branches in Danville (2011 data):
Wells Fargo Bank, National Association: Danville Branch, Blackhawk Branch, Diablo Branch. Info updated 2011/04/05: Bank assets: $1,161,490.0 mil, Deposits: $905,653.0 mil, headquarters in Sioux Falls, SD, positive income , 6395 total offices , Holding Company: Wells Fargo & Company
Heritage Bank of Commerce: Alameda/Contra Costa County Courier at 387 Diablo Road, branch established on 2003/10/27; Danville Branch at 387 Diablo Road, branch established on 2003/10/20. Info updated 2007/07/02: Bank assets: $1,303.2 mil, Deposits: $1,073.8 mil, headquarters in San Jose, CA, positive income , Commercial Lending Specialization, 12 total offices , Holding Company: Heritage Commerce Corp
Bank of America, National Association: Danville Branch at 620 San Ramon Valley Boulevard, branch established on 1904/10/17; Blackhawk Branch at 4195 Blackhawk Plaza Circle, branch established on 1988/09/19. Info updated 2009/11/18: Bank assets: $1,451,969.3 mil, Deposits: $1,077,176.8 mil, headquarters in Charlotte, NC, positive income , 5782 total offices , Holding Company: Bank Of America Corporation
U.S. Bank National Association: Danville Safeway Branch at 3496 Camino Tassajara, branch established on 2010/06/21; Danville Branch at 720 San Ramon Valley Blvd, branch established on 1890/01/01. Info updated 2012/01/30: Bank assets: $330,470.8 mil, Deposits: $236,091.5 mil, headquarters in Cincinnati, OH, positive income , 3121 total offices , Holding Company: U.S. Bancorp
Mechanics Bank: Danville Branch at 345 Railroad Avenue, branch established on 2000/02/22. Info updated 2011/03/24: Bank assets: $2,991.7 mil, Deposits: $2,573.6 mil, headquarters in Richmond, CA, positive income , Commercial Lending Specialization, 31 total offices
Citibank, National Association: Danville Branch at 3400 Camino Tassajara Road, branch established on 1992/01/29. Info updated 2012/01/10: Bank assets: $1,288,658.0 mil, Deposits: $882,541.0 mil, headquarters in Sioux Falls, SD, positive income , International Specialization, 1048 total offices , Holding Company: Citigroup Inc.
Union Bank, National Association: Danville Branch at 651 San Ramon Valley Boulevard, branch established on 1961/05/01. Info updated 2011/09/01: Bank assets: $88,967.5 mil, Deposits: $65,286.4 mil, headquarters in San Francisco, CA, positive income , Commercial Lending Specialization, 403 total offices , Holding Company: Mitsubishi Ufj Financial Group, Inc.
Fremont Bank: Downtown Danville Branch at 210 Railroad Avenue, branch established on 1999/02/08. Info updated 2006/11/03: Bank assets: $2,367.9 mil, Deposits: $1,975.1 mil, headquarters in Fremont, CA, positive income , Commercial Lending Specialization, 19 total offices , Holding Company: Fremont Bancorporation
Comerica Bank: Danville Branch at 318 Diablo Road Suite 100, branch established on 2005/12/16. Info updated 2011/07/29: Bank assets: $60,970.5 mil, Deposits: $48,300.9 mil, headquarters in Dallas, TX, positive income , Commercial Lending Specialization, 497 total offices , Holding Company: Comerica Incorporated
3 other banks with 3 local branches
For population 15 years and over in Danville:
Never married: 22.7%Now married: 63.7%Separated: 1.7%Widowed: 4.3%Divorced: 7.6% For population 25 years and over in Danville:
High school or higher: 98.5%Bachelor's degree or higher: 72.7%Graduate or professional degree: 28.5%Unemployed: 3.2%Mean travel time to work (commute): 18.9 minutes
Education Gini index (Inequality in education) Here:
7.9California average:
15.5
Religion statistics for Danville, CA (based on Contra Costa County data)
Religion Adherents Congregations Catholic 228,400 34 Evangelical Protestant 81,120 352 Other 48,553 123 Mainline Protestant 32,693 101 Black Protestant 10,395 34 Orthodox 2,435 8 None 645,429 -
Source: Clifford Grammich, Kirk Hadaway, Richard Houseal, Dale E.Jones, Alexei Krindatch, Richie Stanley and Richard H.Taylor. 2012. 2010 U.S.Religion Census: Religious Congregations & Membership Study. Association of Statisticians of American Religious Bodies. Jones, Dale E., et al. 2002. Congregations and Membership in the United States 2000. Nashville, TN: Glenmary Research Center. Graphs represent county-level data
Food Environment Statistics: Number of grocery stores : 181Contra Costa County :
1.78 / 10,000 pop.California :
2.14 / 10,000 pop.
Number of supercenters and club stores : 5Contra Costa County :
0.05 / 10,000 pop.State :
0.04 / 10,000 pop.
Number of convenience stores (no gas) : 52Contra Costa County :
0.51 / 10,000 pop.State :
0.62 / 10,000 pop.
Number of convenience stores (with gas) : 178Contra Costa County :
1.75 / 10,000 pop.California :
1.49 / 10,000 pop.
Number of full-service restaurants : 683Here :
6.73 / 10,000 pop.State :
7.42 / 10,000 pop.
Adult diabetes rate : Contra Costa County :
7.1%California :
7.3%
Adult obesity rate : This county :
22.2%California :
21.3%
Low-income preschool obesity rate : Contra Costa County :
16.8%State :
17.9%
Health and Nutrition: Healthy diet rate : This city:
56.2%California:
49.4%
Average overall health of teeth and gums : Here:
55.9%California:
48.0%
People feeling badly about themselves : People not drinking alcohol at all : Here:
8.9%California:
11.2%
Average hours sleeping at night : Overweight people : This city:
34.4%California:
31.5%
General health condition : Danville:
62.0%California:
56.4%
Average condition of hearing : This city:
81.2%State:
80.9%
More about Health and Nutrition of Danville, CA Residents
Local government employment and payroll (March 2022)
Function
Full-time employees
Monthly full-time payroll
Average yearly full-time wage
Part-time employees
Monthly part-time payroll
Streets and Highways
28 $202,014 $86,577 2 $3,366 Parks and Recreation
23 $142,430 $74,311 24 $23,750 Other Government Administration
18 $156,904 $104,603 5 $5,861 Financial Administration
9 $68,282 $91,043 0 $0 Other and Unallocable
7 $50,397 $86,395 1 $1,769 Police - Other
2 $12,987 $77,922 7 $11,280 Judicial and Legal
1 $18,744 $224,928 0 $0
Totals for Government
88 $651,757 $88,876 39 $46,026
Danville government finances - Expenditure in 2017 (per resident):
Construction - Parks and Recreation: $5,088,000 ($119.07)
Central Staff Services: $5,021,000 ($117.50)Regular Highways: $712,000 ($16.66)Police Protection: $225,000 ($5.27)Current Operations - Central Staff Services: $8,764,000 ($205.09)
Police Protection: $7,365,000 ($172.35)Regular Highways: $6,342,000 ($148.41)Parks and Recreation: $3,553,000 ($83.15)Financial Administration: $804,000 ($18.81)Protective Inspection and Regulation - Other: $511,000 ($11.96)Health - Other: $491,000 ($11.49)Housing and Community Development: $2,000 ($0.05)General - Interest on Debt: $607,000 ($14.20)
Intergovernmental to Local - Other - Regular Highways: $258,000 ($6.04)
Other - Health - Other: $251,000 ($5.87)Other - Police Protection: $109,000 ($2.55)Other Capital Outlay - Central Staff Services: $17,000 ($0.40)
General - Other: $4,000 ($0.09)Protective Inspection and Regulation - Other: $3,000 ($0.07)Libraries: $1,000 ($0.02)
Danville government finances - Revenue in 2017 (per resident):
Charges - Other: $4,755,000 ($111.27)
Parks and Recreation: $2,086,000 ($48.82)Housing and Community Development: $1,000 ($0.02)Miscellaneous - Special Assessments: $916,000 ($21.44)
Rents: $691,000 ($16.17)Interest Earnings: $562,000 ($13.15)General Revenue - Other: $461,000 ($10.79)Fines and Forfeits: $164,000 ($3.84)Donations From Private Sources: $119,000 ($2.78)State Intergovernmental - Other: $1,147,000 ($26.84)
Highways: $826,000 ($19.33)General Local Government Support: $67,000 ($1.57)Tax - Property: $13,325,000 ($311.83)
General Sales and Gross Receipts: $6,166,000 ($144.29)Public Utilities Sales: $2,330,000 ($54.53)Other License: $2,178,000 ($50.97)Documentary and Stock Transfer: $586,000 ($13.71)Occupation and Business License - Other: $371,000 ($8.68)Other Selective Sales: $160,000 ($3.74)Other: $90,000 ($2.11)
Danville government finances - Debt in 2017 (per resident):
Long Term Debt - Beginning Outstanding - Unspecified Public Purpose: $10,930,000 ($255.78)
Outstanding Unspecified Public Purpose: $10,380,000 ($242.91)Retired Unspecified Public Purpose: $550,000 ($12.87)
Danville government finances - Cash and Securities in 2017 (per resident):
Bond Funds - Cash and Securities: $43,841,000 ($1025.95)
Other Funds - Cash and Securities: $57,513,000 ($1345.90)
6.37% of this county's 2021 resident taxpayers lived in other counties in 2020 ($134,084 average adjusted gross income )
Here:
6.37%California average:
5.19%
0.01% of residents moved from foreign countries ($98 average AGI )Contra Costa County:
0.01%California average:
0.03%
Top counties from which taxpayers relocated into this county between 2020 and 2021:
7.09% of this county's 2020 resident taxpayers moved to other counties in 2021 ($123,334 average adjusted gross income )
Here:
7.09%California average:
6.14%
0.01% of residents moved to foreign countries ($92 average AGI )Contra Costa County:
0.01%California average:
0.02%
Top counties to which taxpayers relocated from this county between 2020 and 2021:
Businesses in Danville, CA
Name Count Name Count
Baja Fresh Mexican Grill 1 Kincaid 1 Bally Total Fitness 1 Marshalls 1 Baskin-Robbins 2 MasterBrand Cabinets 3 Best Western 1 McDonald's 1 Big O Tires 1 New Balance 3 Blockbuster 1 Nike 8 Burger King 1 Panda Express 1 CVS 2 Quiznos 1 Chico's 1 RadioShack 1 Cold Stone Creamery 1 SAS Shoes 1 Costco 1 Starbucks 5 Decora Cabinetry 3 T-Mobile 2 Dennys 1 Trader Joe's 1 Domino's Pizza 1 UPS 9 FedEx 8 Vans 3 GameStop 1 Vons 1 H&R Block 1 Walgreens 2
Strongest AM radio stations in Danville:
KTCT (1050 AM; 50 kW; SAN MATEO, CA; Owner: SUSQUEHANNA RADIO CORP.)
KFAX (1100 AM; 50 kW; SAN FRANCISCO, CA; Owner: GOLDEN GATE BROADCASTING CO, INC.)
KTRB (860 AM; 50 kW; MODESTO, CA; Owner: PAPPAS RADIO OF CALIFORNIA, A CALIFORNIA LIMITED PARTNERSHIP)
KGO (810 AM; 50 kW; SAN FRANCISCO, CA; Owner: KGO-AM RADIO, INC.)
KNBR (680 AM; 50 kW; SAN FRANCISCO, CA; Owner: KNBR LICO, INC.)
KIQI (1010 AM; 35 kW; SAN FRANCISCO, CA; Owner: RADIO UNICA OF SAN FRANCISCO LICENSE CORP.)
KNEW (910 AM; 20 kW; OAKLAND, CA; Owner: AMFM RADIO LICENSES, L.L.C.)
KYCY (1550 AM; 50 kW; SAN FRANCISCO, CA; Owner: INFINITY BROADCASTING OPERATIONS, INC.)
KCBS (740 AM; 50 kW; SAN FRANCISCO, CA; Owner: INFINITY BROADCASTING OPERATIONS, INC.)
KLOK (1170 AM; 50 kW; SAN JOSE, CA; Owner: ENTRAVISION HOLDINGS, LLC)
KATD (990 AM; 10 kW; PITTSBURG, CA; Owner: RADIO UNICA OF SACRAMENTO LICENSE CORP.)
KFRC (610 AM; 5 kW; SAN FRANCISCO, CA; Owner: INFINITY BROADCASTING CORPORATION OF LOS ANGELES)
KMZT (1510 AM; 8 kW; SAN RAFAEL, CA; Owner: MOUNT WILSON FM BROADCASTERS, INC.)
Strongest FM radio stations in Danville:
KKSF-FM1 (103.7 FM; PLEASANTON, ETC., CA; Owner: AMFM RADIO LICENSES, L.L.C.)
KFRC-FM3 (99.7 FM; WALNUT CREEK, CA; Owner: INFINITY KFRC-FM, INC.)
KZBR-FM1 (95.7 FM; WALNUT CREEK, CA; Owner: BONNEVILLE HOLDING COMPANY)
KBLX-FM2 (102.9 FM; PLEASANTON, CA; Owner: ICBC BROADCAST HOLDINGS -CA, INC.)
KSOL-FM3 (98.9 FM; PLEASANTON, CA; Owner: TMS LICENSE CALIFORNIA, INC)
KISQ-FM3 (98.1 FM; CONCORD, CA; Owner: AMFM RADIO LICENSES, L.L.C.)
KMEL-FM1 (106.1 FM; CONCORD, CA; Owner: AMFM RADIO LICENSES, L.L.C.)
KFJO (92.1 FM; WALNUT CREEK, CA; Owner: CHASE RADIO PROPERTIES, L.L.C.)
KZBR-FM2 (95.7 FM; LIVERMORE, ETC., CA; Owner: BONNEVILLE HOLDING COMPANY)
KDFC-FM1 (102.1 FM; LAFAYETTE, CA; Owner: BONNEVILLE HOLDING COMPANY)
KOIT-FM2 (96.5 FM; MARTINEZ, ETC., CA; Owner: BONNEVILLE HOLDING CO. C/O KOIT(FM))
KIOI-FM1 (101.3 FM; WALNUT CREEK, CA; Owner: AMFM RADIO LICENSES, L.L.C.)
KLLC (97.3 FM; SAN FRANCISCO, CA; Owner: INFINITY BROADCASTING OPERATIONS, INC.)
K238AC (95.5 FM; SALIDA, CA; Owner: FAMILY STATIONS, INC.)
KALX (90.7 FM; BERKELEY, CA; Owner: UNIVERSITY OF CALIFORNIA)
KOIT-FM (96.5 FM; SAN FRANCISCO, CA; Owner: BONNEVILLE HOLDING COMPANY)
KSFB-FM (100.7 FM; SAN RAFAEL, CA; Owner: GOLDEN GATE BROADCASTING COMPANY, INC.)
KKSF (103.7 FM; SAN FRANCISCO, CA; Owner: AMFM RADIO LICENSES, L.L.C.)
KFOG (104.5 FM; SAN FRANCISCO, CA; Owner: KFFG LICO, INC)
KSOL (98.9 FM; SAN FRANCISCO, CA; Owner: TMS LICENSE CALIFORNIA, INC)
TV broadcast stations around Danville:
KQED (Channel 9; SAN FRANCISCO, CA; Owner: KQED, INC.)
KFTL (Channel 64; STOCKTON, CA; Owner: FAMILY STATIONS, INC.)
KGO-TV (Channel 7; SAN FRANCISCO, CA; Owner: KGO TELEVISION, INC.)
KPIX-TV (Channel 5; SAN FRANCISCO, CA; Owner: CBS BROADCASTING INC.)
KOVR (Channel 13; STOCKTON, CA; Owner: SCI - SACRAMENTO LICENSEE, LLC)
KXTV (Channel 10; SACRAMENTO, CA; Owner: KXTV, INC.)
KCRA-TV (Channel 3; SACRAMENTO, CA; Owner: KCRA HEARST-ARGYLE TELEVISION, INC.)
KTNC-TV (Channel 42; CONCORD, CA; Owner: KTNC LICENSE, LLC)
KSPX (Channel 29; SACRAMENTO, CA; Owner: PAXSON SACRAMENTO LICENSE, INC.)
KUVS (Channel 19; MODESTO, CA; Owner: KUVS LICENSE PARTNERSHIP, G.P.)
KTVU (Channel 2; OAKLAND, CA; Owner: KTVU PARTNERSHIP)
KTXL (Channel 40; SACRAMENTO, CA; Owner: CHANNEL 40, INC.)
KQCA (Channel 58; STOCKTON, CA; Owner: KCRA HEARST-ARGYLE TELEVISION, INC.)
KVIE (Channel 6; SACRAMENTO, CA; Owner: KVIE, INC.)
KMAX-TV (Channel 31; SACRAMENTO, CA; Owner: UPN STATIONS GROUP INC.)
KRON-TV (Channel 4; SAN FRANCISCO, CA; Owner: YOUNG BROADCASTING OF SAN FRANCISCO, INC.)
KMTP-TV (Channel 32; SAN FRANCISCO, CA; Owner: MINORITY TELEVISION PROJECT)
KBHK-TV (Channel 44; SAN FRANCISCO, CA; Owner: VIACOM TELEVISION STATIONS GROUP OF SAN FRANCISCO INC.)
KBWB (Channel 20; SAN FRANCISCO, CA; Owner: KBWB LICENSE, INC.)
KFSF (Channel 66; VALLEJO, CA; Owner: TELEFUTURA SAN FRANCISCO LLC)
KBIT-CA (Channel 28; SAN FRANCISCO, ETC., CA; Owner: POLAR BROADCASTING, INC.)
KCNS (Channel 38; SAN FRANCISCO, CA; Owner: WRAY, INC.)
KICU-TV (Channel 36; SAN JOSE, CA; Owner: KTVU PARTNERSHIP)
KCSM-TV (Channel 60; SAN MATEO, CA; Owner: SAN MATEO COUNTY COMMUNITY COLLEGE DISTRICT)
KTEH (Channel 54; SAN JOSE, CA; Owner: KTEH FOUNDATION)
National Bridge Inventory (NBI) Statistics 33 Number of bridges374ft / 114m Total length $7,097,000 Total costs2,235,588 Total average daily traffic119,845 Total average daily truck traffic
New bridges - historical statistics
3 1950-1959 19 1960-1969 8 1970-1979 1 1980-1989 2 1990-1999
See full National Bridge Inventory statistics for Danville, CA
FCC Registered Cell Phone Towers: 1
Eagle Ridge Lane (Lat: 37.824361 Lon: -121.904944), Type: Pole, Structure height: 5.2 m, Call Sign: KNKA228Assigned Frequencies: 880.020 MHz, 835.020 MHz, 891.510 MHz, 846.510 MHzGrant Date: 04/14/2015, Expiration Date: 05/15/2025Registrant: Verizon Wireless, 5055 North Point Pkwy, Np2ne Network Engineering, Alpharetta, GA 30022, Phone: (770) 797-1070, Fax: (770) 797-1036, Email:
FCC Registered Antenna Towers: 3
Jenny Knopf, 1000 Tassajara Ranch Drive (Ba21813b) (Lat: 37.791417 Lon: -121.922278), Type: 22.9, Structure height: 06013 m, Overall height: 22.9 m, Registrant: T-Mobile West LLC, Fccregulatorycompliancecontact@t-Mobile.Com, , Belle-vue, Phone: (425) 383-8401 Jenny Knopf, 1000 Tassajara Ranch Drive (Ba21813b) (Lat: 37.791417 Lon: -121.922278), Type: 22.9, Structure height: 06013 m, Overall height: 22.9 m, Registrant: T-Mobile West LLC, Fccregulatorycompliancecontact@t-Mobile.Com, , Belle-vue, Phone: (425) 383-8401 2498 Tassajara Ln (Lat: 37.803056 Lon: -121.957500), Type: 8.5, Overall height: 8.5 m, Registrant: Gte Mobilnet Of California Limited Partnership, Jrobbins@mobilnet.Gte.Com, , Atlan-ta, Phone: (770) 391-1732 FCC Registered Private Land Mobile Towers: 2 (
See the full list of FCC Registered Private Land Mobile Towers in Danville, CA )
FCC Registered Broadcast Land Mobile Towers: 31 (
See the full list of FCC Registered Broadcast Land Mobile Towers )
FCC Registered Microwave Towers: 25 (
See the full list of FCC Registered Microwave Towers in this town )
FCC Registered Paging Towers: 18 (
See the full list of FCC Registered Paging Towers )
FCC Registered Maritime Coast & Aviation Ground Towers: 4 (
See the full list of FCC Registered Maritime Coast & Aviation Ground Towers )
FCC Registered Amateur Radio Licenses: 384 (
See the full list of FCC Registered Amateur Radio Licenses in Danville )
FAA Registered Aircraft Manufacturers and Dealers: 5 (
See the full list of FAA Registered Manufacturers and Dealers in Danville )
FAA Registered Aircraft: 67 (
See the full list of FAA Registered Aircraft )
Home Mortgage Disclosure Act Aggregated Statistics For Year 2009(Based on 1 full and 5 partial tracts) A) FHA, FSA/RHS & VA B) Conventional C) Refinancings D) Home Improvement Loans E) Loans on Dwellings For 5+ Families F) Non-occupant Loans on Number Average Value Number Average Value Number Average Value Number Average Value Number Average Value Number Average Value
LOANS ORIGINATED 66 $524,925 301 $558,473 2,158 $409,725 89 $292,264 1 $7,466,400 51 $347,243 APPLICATIONS APPROVED, NOT ACCEPTED 3 $433,850 35 $524,592 203 $440,564 3 $408,127 0 $0 6 $357,807 APPLICATIONS DENIED 8 $403,934 31 $565,145 346 $514,979 13 $243,853 0 $0 9 $304,084 APPLICATIONS WITHDRAWN 9 $569,194 31 $576,292 248 $465,147 9 $139,192 0 $0 10 $286,722 FILES CLOSED FOR INCOMPLETENESS 2 $594,650 9 $550,003 90 $476,937 6 $250,882 0 $0 5 $324,144
Aggregated Statistics For Year 2008(Based on 1 full and 5 partial tracts) A) FHA, FSA/RHS & VA B) Conventional C) Refinancings D) Home Improvement Loans F) Non-occupant Loans on G) Loans On Manufactured Number Average Value Number Average Value Number Average Value Number Average Value Number Average Value Number Average Value
LOANS ORIGINATED 17 $601,859 258 $584,718 669 $473,237 49 $248,321 41 $423,447 1 $43,150 APPLICATIONS APPROVED, NOT ACCEPTED 2 $589,415 50 $642,056 123 $467,767 5 $317,838 6 $278,673 0 $0 APPLICATIONS DENIED 10 $532,365 51 $678,665 197 $588,745 23 $314,106 17 $407,311 1 $47,460 APPLICATIONS WITHDRAWN 1 $526,700 32 $759,888 127 $541,986 6 $532,518 6 $307,412 0 $0 FILES CLOSED FOR INCOMPLETENESS 1 $865,020 11 $706,424 49 $581,699 12 $222,717 3 $235,947 0 $0
Aggregated Statistics For Year 2007(Based on 1 full and 5 partial tracts) B) Conventional C) Refinancings D) Home Improvement Loans F) Non-occupant Loans on Number Average Value Number Average Value Number Average Value Number Average Value
LOANS ORIGINATED 446 $659,366 944 $571,002 115 $376,663 72 $491,208 APPLICATIONS APPROVED, NOT ACCEPTED 77 $595,887 162 $595,308 19 $282,037 12 $415,272 APPLICATIONS DENIED 86 $629,806 264 $588,222 33 $366,022 23 $513,067 APPLICATIONS WITHDRAWN 50 $649,652 118 $611,607 18 $344,190 6 $399,295 FILES CLOSED FOR INCOMPLETENESS 13 $534,454 45 $491,663 5 $375,594 8 $408,961
Aggregated Statistics For Year 2006(Based on 1 full and 5 partial tracts) B) Conventional C) Refinancings D) Home Improvement Loans F) Non-occupant Loans on G) Loans On Manufactured Number Average Value Number Average Value Number Average Value Number Average Value Number Average Value
LOANS ORIGINATED 547 $616,331 1,041 $563,163 119 $367,347 83 $478,984 0 $0 APPLICATIONS APPROVED, NOT ACCEPTED 105 $603,280 152 $570,403 26 $396,583 15 $473,538 0 $0 APPLICATIONS DENIED 91 $648,162 256 $610,020 49 $374,046 20 $477,312 2 $86,970 APPLICATIONS WITHDRAWN 63 $657,150 185 $598,669 19 $342,108 14 $457,621 0 $0 FILES CLOSED FOR INCOMPLETENESS 8 $747,896 36 $588,538 3 $338,930 5 $420,014 0 $0
Aggregated Statistics For Year 2005(Based on 1 full and 5 partial tracts) B) Conventional C) Refinancings D) Home Improvement Loans F) Non-occupant Loans on G) Loans On Manufactured Number Average Value Number Average Value Number Average Value Number Average Value Number Average Value
LOANS ORIGINATED 816 $639,740 1,603 $546,157 169 $403,348 134 $469,767 0 $0 APPLICATIONS APPROVED, NOT ACCEPTED 115 $661,968 184 $510,512 13 $393,562 14 $427,629 1 $199,100 APPLICATIONS DENIED 140 $656,863 266 $591,900 49 $278,787 24 $502,151 1 $141,450 APPLICATIONS WITHDRAWN 89 $637,035 237 $512,518 44 $394,179 17 $447,206 0 $0 FILES CLOSED FOR INCOMPLETENESS 20 $579,330 69 $517,821 6 $304,260 4 $540,958 0 $0
Aggregated Statistics For Year 2004(Based on 1 full and 5 partial tracts) B) Conventional C) Refinancings D) Home Improvement Loans F) Non-occupant Loans on Number Average Value Number Average Value Number Average Value Number Average Value
LOANS ORIGINATED 915 $548,251 2,114 $454,870 144 $323,711 148 $383,432 APPLICATIONS APPROVED, NOT ACCEPTED 123 $505,878 272 $440,036 21 $231,451 14 $370,956 APPLICATIONS DENIED 139 $515,933 313 $521,873 52 $406,765 31 $402,657 APPLICATIONS WITHDRAWN 92 $518,465 308 $447,089 32 $328,504 15 $333,933 FILES CLOSED FOR INCOMPLETENESS 18 $540,884 65 $479,605 4 $378,515 4 $319,985
Aggregated Statistics For Year 2003(Based on 1 full and 5 partial tracts) B) Conventional C) Refinancings D) Home Improvement Loans E) Loans on Dwellings For 5+ Families F) Non-occupant Loans on Number Average Value Number Average Value Number Average Value Number Average Value Number Average Value
LOANS ORIGINATED 868 $459,892 5,420 $373,634 51 $106,655 1 $2,232,000 204 $266,645 APPLICATIONS APPROVED, NOT ACCEPTED 96 $487,191 660 $391,727 11 $55,630 0 $0 17 $301,976 APPLICATIONS DENIED 91 $517,888 493 $443,241 23 $92,842 0 $0 19 $360,843 APPLICATIONS WITHDRAWN 98 $482,685 533 $370,321 13 $255,952 0 $0 18 $305,128 FILES CLOSED FOR INCOMPLETENESS 20 $512,258 139 $419,547 5 $84,814 0 $0 8 $267,382
Aggregated Statistics For Year 2002(Based on 1 full and 5 partial tracts) A) FHA, FSA/RHS & VA B) Conventional C) Refinancings D) Home Improvement Loans F) Non-occupant Loans on Number Average Value Number Average Value Number Average Value Number Average Value Number Average Value
LOANS ORIGINATED 1 $202,440 856 $450,952 4,457 $373,980 41 $131,546 148 $282,777 APPLICATIONS APPROVED, NOT ACCEPTED 1 $47,920 100 $464,162 572 $383,181 20 $54,938 11 $278,602 APPLICATIONS DENIED 1 $66,130 69 $435,231 318 $398,319 14 $102,804 16 $260,995 APPLICATIONS WITHDRAWN 0 $0 106 $399,135 429 $369,613 7 $119,263 11 $228,053 FILES CLOSED FOR INCOMPLETENESS 0 $0 25 $486,986 135 $404,608 0 $0 8 $361,768
Aggregated Statistics For Year 2001(Based on 1 full and 5 partial tracts) A) FHA, FSA/RHS & VA B) Conventional C) Refinancings D) Home Improvement Loans F) Non-occupant Loans on Number Average Value Number Average Value Number Average Value Number Average Value Number Average Value
LOANS ORIGINATED 6 $303,065 663 $396,637 2,662 $366,058 125 $76,311 83 $246,780 APPLICATIONS APPROVED, NOT ACCEPTED 0 $0 81 $405,357 304 $347,710 32 $77,185 6 $339,323 APPLICATIONS DENIED 0 $0 51 $406,258 319 $399,125 36 $69,469 9 $409,893 APPLICATIONS WITHDRAWN 1 $160,050 80 $367,722 370 $334,136 22 $74,075 11 $242,053 FILES CLOSED FOR INCOMPLETENESS 0 $0 16 $406,957 120 $373,997 6 $61,905 3 $264,747
Aggregated Statistics For Year 2000(Based on 1 full and 5 partial tracts) A) FHA, FSA/RHS & VA B) Conventional C) Refinancings D) Home Improvement Loans F) Non-occupant Loans on Number Average Value Number Average Value Number Average Value Number Average Value Number Average Value
LOANS ORIGINATED 1 $254,250 938 $384,953 599 $298,689 151 $61,488 66 $237,200 APPLICATIONS APPROVED, NOT ACCEPTED 0 $0 105 $410,335 77 $297,507 25 $67,354 7 $297,291 APPLICATIONS DENIED 1 $36,420 109 $348,857 162 $313,053 31 $56,450 9 $294,830 APPLICATIONS WITHDRAWN 0 $0 99 $336,600 114 $234,716 21 $63,680 3 $148,243 FILES CLOSED FOR INCOMPLETENESS 0 $0 22 $355,064 61 $359,309 2 $88,060 2 $138,680
Aggregated Statistics For Year 1999(Based on 6 partial tracts) A) FHA, FSA/RHS & VA B) Conventional C) Refinancings D) Home Improvement Loans E) Loans on Dwellings For 5+ Families F) Non-occupant Loans on Number Average Value Number Average Value Number Average Value Number Average Value Number Average Value Number Average Value
LOANS ORIGINATED 6 $168,010 1,108 $314,816 1,461 $283,840 143 $47,540 1 $2,750,710 90 $214,728 APPLICATIONS APPROVED, NOT ACCEPTED 1 $178,490 111 $330,825 223 $279,331 32 $47,595 0 $0 13 $199,788 APPLICATIONS DENIED 2 $166,990 112 $332,259 233 $295,887 37 $65,134 0 $0 14 $331,721 APPLICATIONS WITHDRAWN 0 $0 116 $289,069 213 $261,663 6 $59,145 0 $0 12 $201,192 FILES CLOSED FOR INCOMPLETENESS 0 $0 28 $350,100 83 $318,330 3 $101,583 0 $0 5 $397,868
Detailed HMDA statistics for the following Tracts:
3451.05
, 3451.07 , 3452.01 , 3452.02 , 3462.01 , 3462.02
Private Mortgage Insurance Companies Aggregated Statistics For Year 2009(Based on 1 full and 5 partial tracts) A) Conventional B) Refinancings Number Average Value Number Average Value
LOANS ORIGINATED 10 $478,997 0 $0 APPLICATIONS APPROVED, NOT ACCEPTED 3 $624,597 0 $0 APPLICATIONS DENIED 2 $531,715 2 $438,045 APPLICATIONS WITHDRAWN 3 $517,537 0 $0 FILES CLOSED FOR INCOMPLETENESS 2 $699,630 0 $0
Aggregated Statistics For Year 2008(Based on 1 full and 5 partial tracts) A) Conventional B) Refinancings Number Average Value Number Average Value
LOANS ORIGINATED 9 $597,476 1 $643,990 APPLICATIONS APPROVED, NOT ACCEPTED 6 $672,928 3 $565,493 APPLICATIONS DENIED 3 $617,923 0 $0 APPLICATIONS WITHDRAWN 1 $519,470 0 $0 FILES CLOSED FOR INCOMPLETENESS 0 $0 0 $0
Aggregated Statistics For Year 2007(Based on 1 full and 5 partial tracts) A) Conventional B) Refinancings C) Non-occupant Loans on Number Average Value Number Average Value Number Average Value
LOANS ORIGINATED 5 $578,614 1 $954,010 1 $313,590 APPLICATIONS APPROVED, NOT ACCEPTED 0 $0 0 $0 0 $0 APPLICATIONS DENIED 0 $0 0 $0 0 $0 APPLICATIONS WITHDRAWN 0 $0 0 $0 0 $0 FILES CLOSED FOR INCOMPLETENESS 0 $0 1 $820,620 0 $0
Aggregated Statistics For Year 2006(Based on 1 full and 2 partial tracts) A) Conventional B) Refinancings Number Average Value Number Average Value
LOANS ORIGINATED 2 $521,430 0 $0 APPLICATIONS APPROVED, NOT ACCEPTED 0 $0 1 $295,370 APPLICATIONS DENIED 0 $0 0 $0 APPLICATIONS WITHDRAWN 0 $0 0 $0 FILES CLOSED FOR INCOMPLETENESS 0 $0 0 $0
Aggregated Statistics For Year 2005(Based on 3 partial tracts) A) Conventional Number Average Value
LOANS ORIGINATED 2 $673,785 APPLICATIONS APPROVED, NOT ACCEPTED 0 $0 APPLICATIONS DENIED 0 $0 APPLICATIONS WITHDRAWN 0 $0 FILES CLOSED FOR INCOMPLETENESS 0 $0
Aggregated Statistics For Year 2004(Based on 5 partial tracts) A) Conventional B) Refinancings C) Non-occupant Loans on Number Average Value Number Average Value Number Average Value
LOANS ORIGINATED 7 $397,567 3 $448,937 3 $308,300 APPLICATIONS APPROVED, NOT ACCEPTED 0 $0 1 $425,210 0 $0 APPLICATIONS DENIED 0 $0 0 $0 0 $0 APPLICATIONS WITHDRAWN 0 $0 2 $269,255 0 $0 FILES CLOSED FOR INCOMPLETENESS 0 $0 0 $0 0 $0
Aggregated Statistics For Year 2003(Based on 1 full and 5 partial tracts) A) Conventional B) Refinancings Number Average Value Number Average Value
LOANS ORIGINATED 13 $385,006 5 $354,062 APPLICATIONS APPROVED, NOT ACCEPTED 3 $433,123 5 $248,614 APPLICATIONS DENIED 0 $0 0 $0 APPLICATIONS WITHDRAWN 0 $0 0 $0 FILES CLOSED FOR INCOMPLETENESS 0 $0 0 $0
Aggregated Statistics For Year 2002(Based on 1 full and 4 partial tracts) A) Conventional B) Refinancings C) Non-occupant Loans on Number Average Value Number Average Value Number Average Value
LOANS ORIGINATED 19 $408,043 5 $394,562 1 $281,310 APPLICATIONS APPROVED, NOT ACCEPTED 5 $389,414 2 $362,285 0 $0 APPLICATIONS DENIED 2 $407,995 0 $0 0 $0 APPLICATIONS WITHDRAWN 4 $296,320 0 $0 0 $0 FILES CLOSED FOR INCOMPLETENESS 0 $0 0 $0 0 $0
Aggregated Statistics For Year 2001(Based on 1 full and 4 partial tracts) A) Conventional B) Refinancings Number Average Value Number Average Value
LOANS ORIGINATED 12 $416,361 6 $390,002 APPLICATIONS APPROVED, NOT ACCEPTED 3 $372,730 0 $0 APPLICATIONS DENIED 0 $0 2 $357,690 APPLICATIONS WITHDRAWN 0 $0 1 $108,260 FILES CLOSED FOR INCOMPLETENESS 0 $0 0 $0
Aggregated Statistics For Year 2000(Based on 1 full and 5 partial tracts) A) Conventional B) Refinancings C) Non-occupant Loans on Number Average Value Number Average Value Number Average Value
LOANS ORIGINATED 35 $318,937 8 $300,239 1 $282,430 APPLICATIONS APPROVED, NOT ACCEPTED 13 $274,438 2 $284,810 0 $0 APPLICATIONS DENIED 2 $309,180 0 $0 0 $0 APPLICATIONS WITHDRAWN 2 $273,905 0 $0 0 $0 FILES CLOSED FOR INCOMPLETENESS 0 $0 0 $0 0 $0
Aggregated Statistics For Year 1999(Based on 6 partial tracts) A) Conventional B) Refinancings C) Non-occupant Loans on Number Average Value Number Average Value Number Average Value
LOANS ORIGINATED 45 $280,380 9 $249,029 1 $299,040 APPLICATIONS APPROVED, NOT ACCEPTED 9 $340,592 4 $280,505 0 $0 APPLICATIONS DENIED 3 $272,017 2 $391,790 0 $0 APPLICATIONS WITHDRAWN 1 $278,960 0 $0 0 $0 FILES CLOSED FOR INCOMPLETENESS 0 $0 0 $0 0 $0
Detailed PMIC statistics for the following Tracts:
3451.05
, 3451.07 , 3452.01 , 3452.02 , 3462.01 , 3462.02
Most common first names in Danville, CA among deceased individuals Name Count Lived (average)
John 148 75.9 years Mary 146 83.9 years William 115 76.7 years Robert 103 73.1 years James 87 72.9 years Dorothy 81 80.4 years Helen 80 82.9 years George 78 79.0 years Margaret 69 81.5 years Charles 65 78.2 years
Most common last names in Danville, CA among deceased individuals Last name Count Lived (average)
Smith 41 81.3 years Johnson 37 81.9 years Miller 35 83.4 years Anderson 28 80.8 years Nelson 26 80.6 years Davis 23 81.4 years Williams 21 80.3 years Wilson 21 83.8 years Jones 19 85.5 years Brown 19 82.5 years
Danville compared to California state average:
Median household income above state average. Median house value significantly above state average. Unemployed percentage significantly below state average. Black race population percentage significantly below state average. Hispanic race population percentage significantly below state average. Median age significantly above state average. Renting percentage significantly below state average. Length of stay since moving in above state average. Number of rooms per house above state average. Percentage of population with a bachelor's degree or higher significantly above state average.
#37 on the list of "Top 101 cities with largest percentage of males in occupations: management occupations (population 5,000+)"
#64 on the list of "Top 101 cities where residents moved in more then 10 years ago (10,000+ households)"
#65 on the list of "Top 101 cities with the highest cost per building permit(population 5,000+)"
#78 on the list of "Top 101 cities with largest percentage of males in occupations: business and financial operations occupations (population 5,000+)"
#90 on the list of "Top 101 cities with the most people taking subway or elevated to work (population 5,000+)"
#90 on the list of "Top 100 cities with highest median house value (pop. 5,000+)"
#99 on the list of "Top 101 cities with largest percentage of females in industries: real estate and rental and leasing (population 5,000+)"
#99 on the list of "Top 100 cities with highest median household income (pop. 5,000+)"
#69 (94583) on the list of "Top 101 zip codes with the most finance and insurance companies in 2005"
#10 on the list of "Top 101 counties with the largest increase in the number of infant deaths per 1000 residents 2000-2006 to 2007-2013 (pop. 50,000+)"
#15 on the list of "Top 101 counties with the lowest Sulfur Oxides Annual air pollution readings in 2012 (µg/m3 )"
#17 on the list of "Top 101 counties with the highest Nitrogen Dioxide air pollution readings in 2012 (ppm)"
#31 on the list of "Top 101 counties with the highest percentage of residents that drank alcohol in the past 30 days"
#34 on the list of "Top 101 counties with the highest surface withdrawal of fresh water for public supply (pop. 50,000+)"
Top Patent Applicants
Yi-Qun Li (115)
Mehdi Asnaashari (69)
Yevgeniy S. Nimon (59)
Benjamin N. Eldridge (44)
Steven R. Rados (44)
Arthur Back (31)
Namvar Kiaie (29)
Wei Xu (28)
John M. Nuss (28)
David A. Weber (27)
Total of 3338 patent applications in 2008-2024.
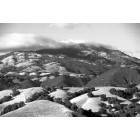
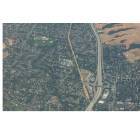
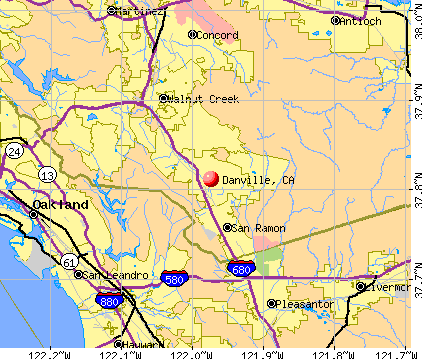


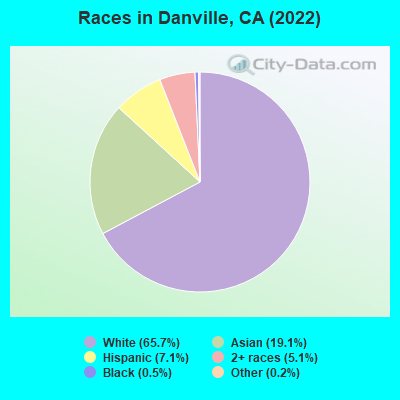
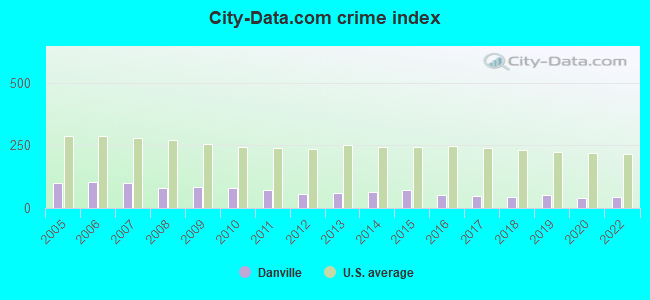
 Recent articles from our blog. Our writers, many of them Ph.D. graduates or candidates, create easy-to-read articles on a wide variety of topics.

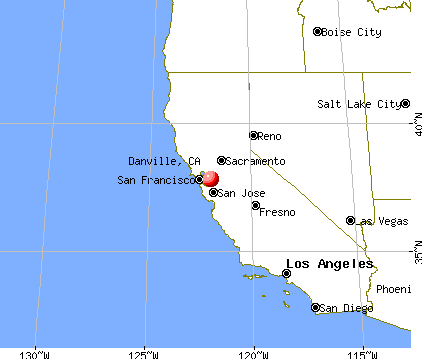
 (7.9 miles
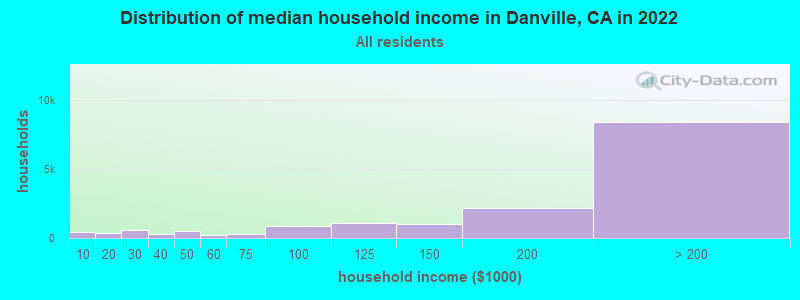
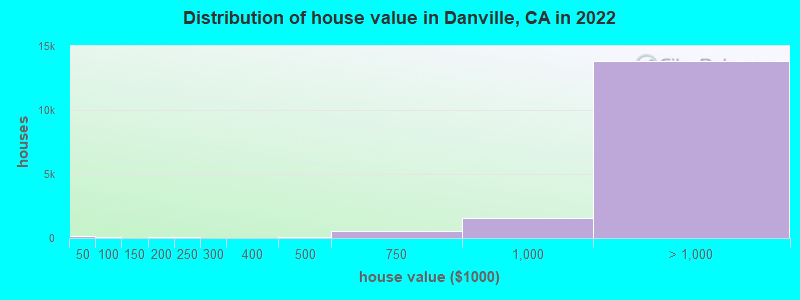
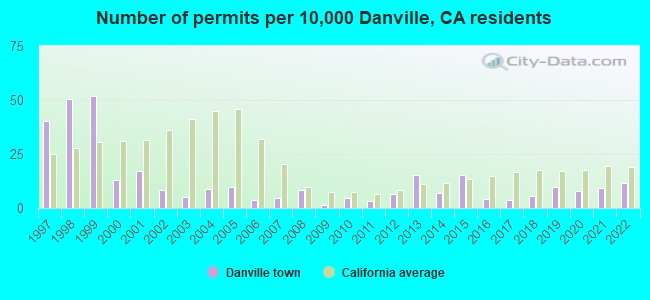
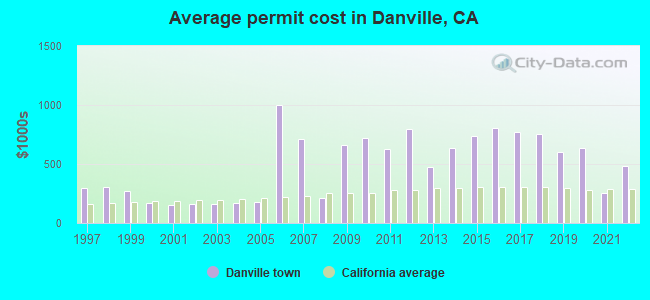
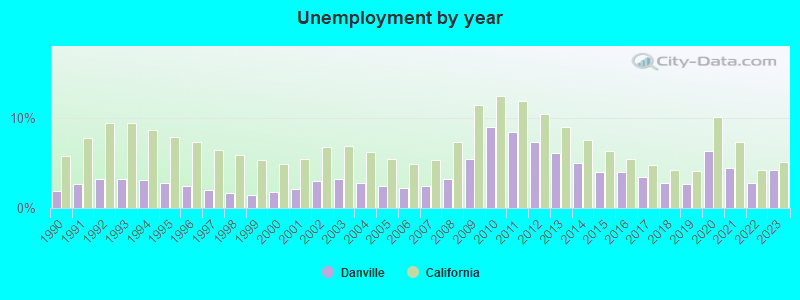
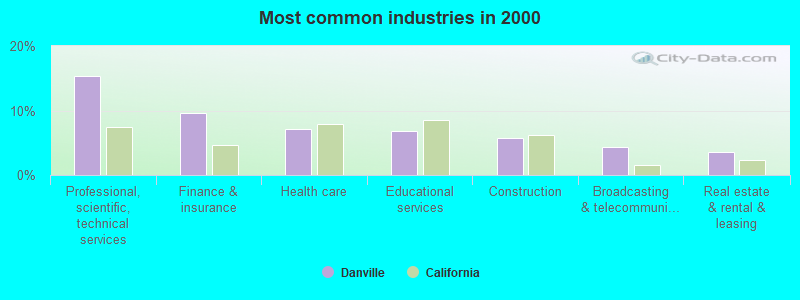
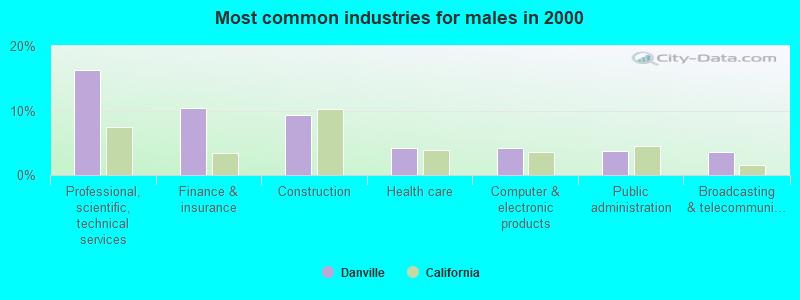
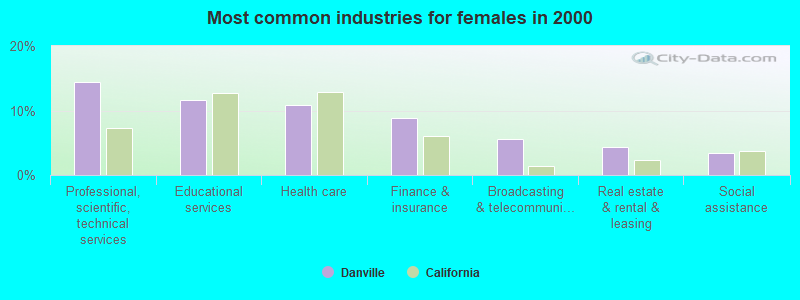
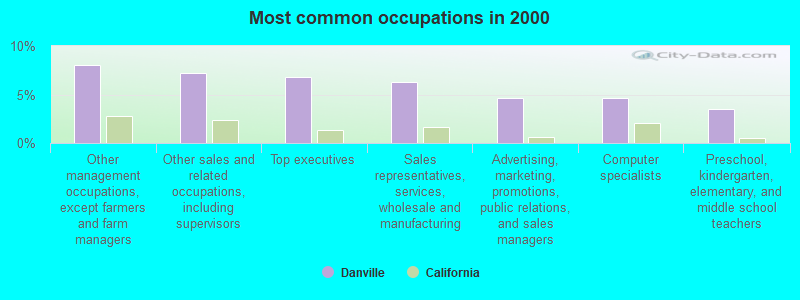
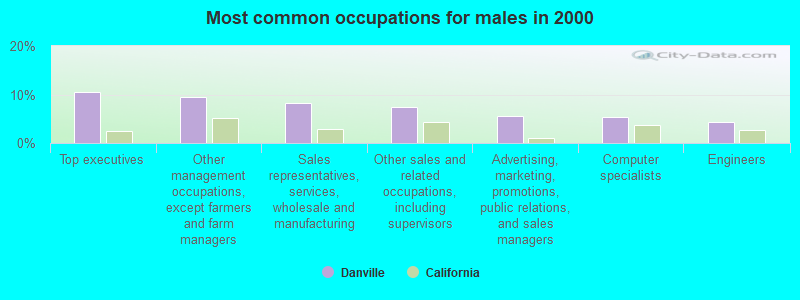
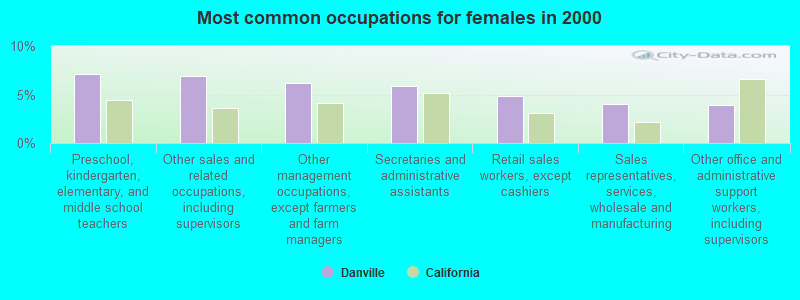
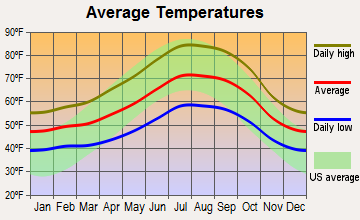
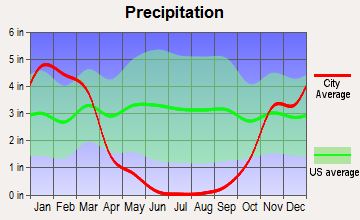
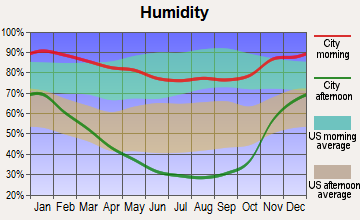
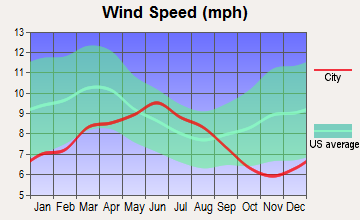
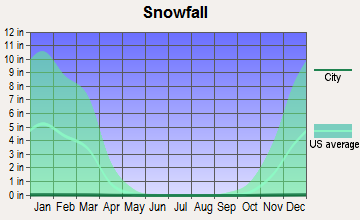
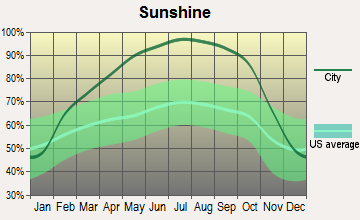
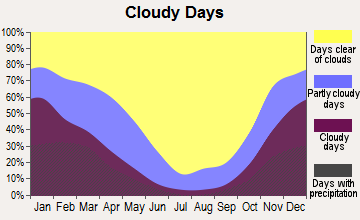
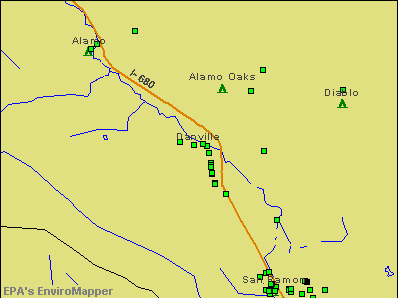

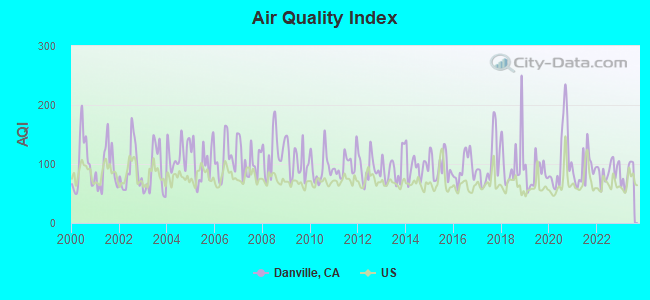
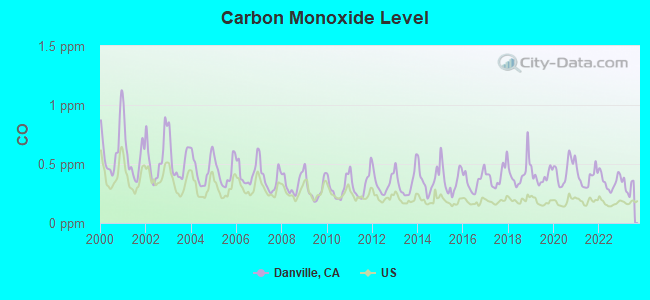
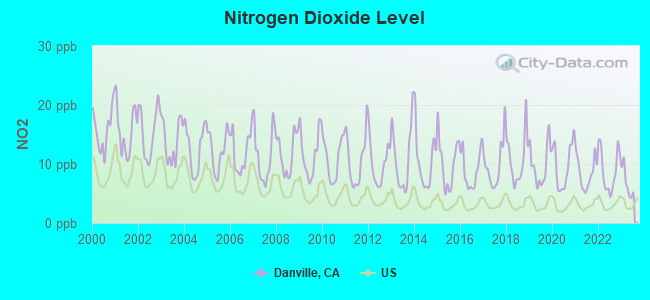
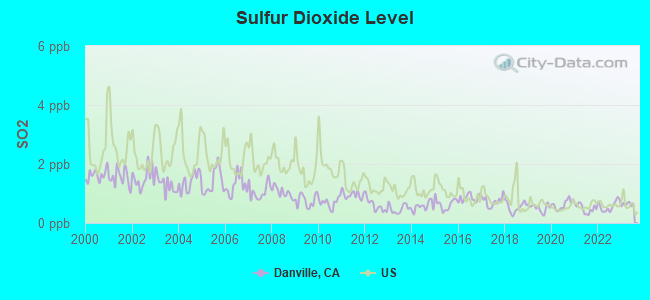
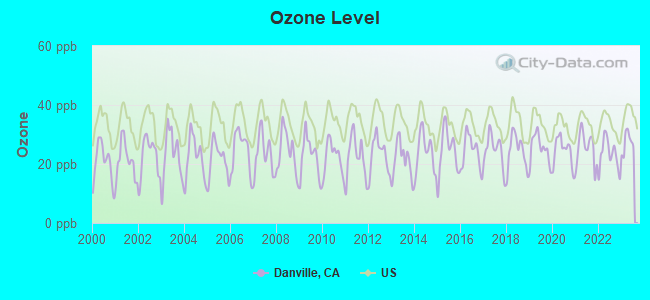
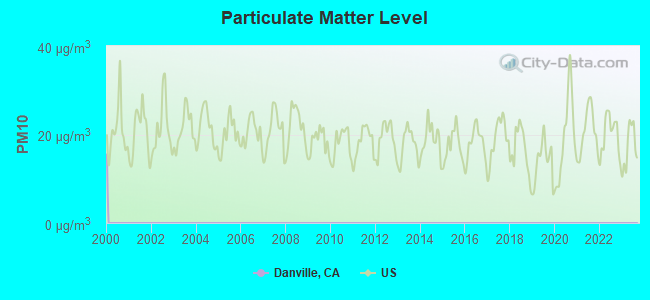
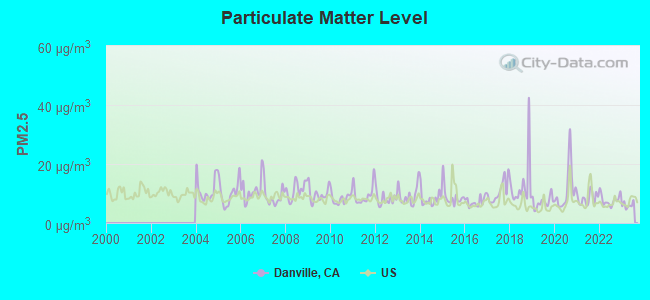
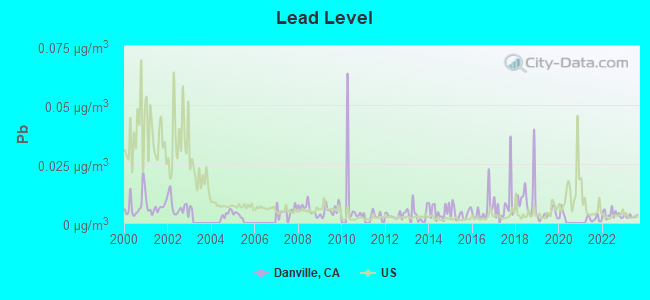
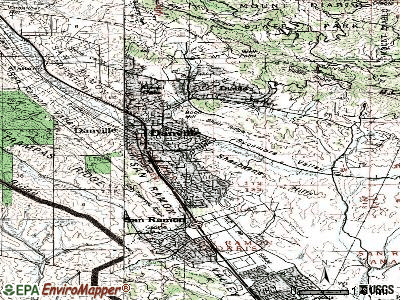
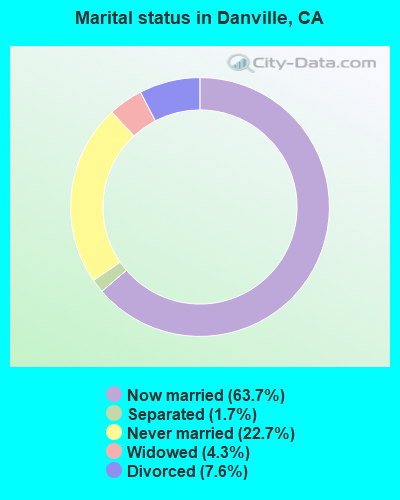
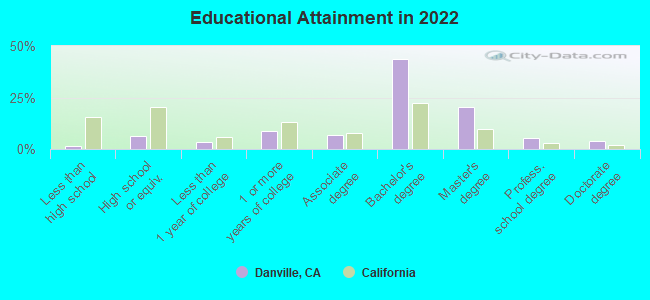
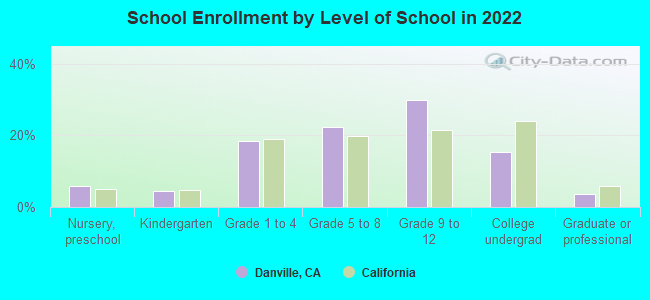
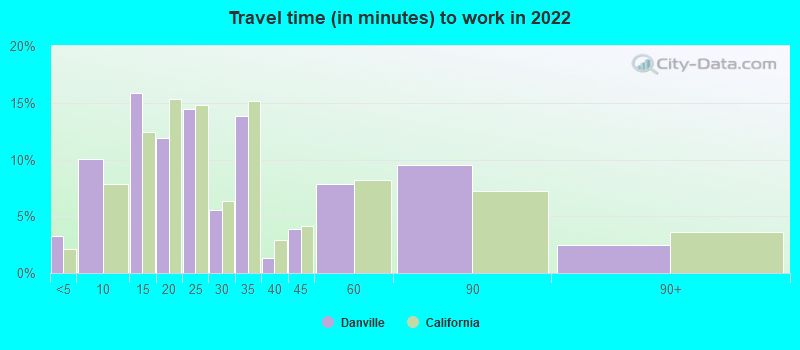
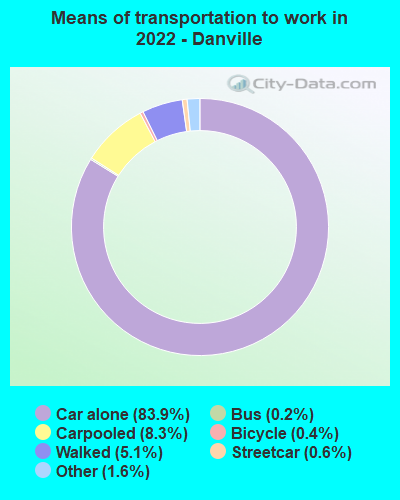


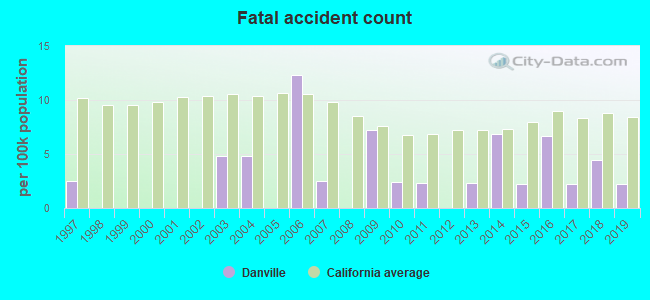
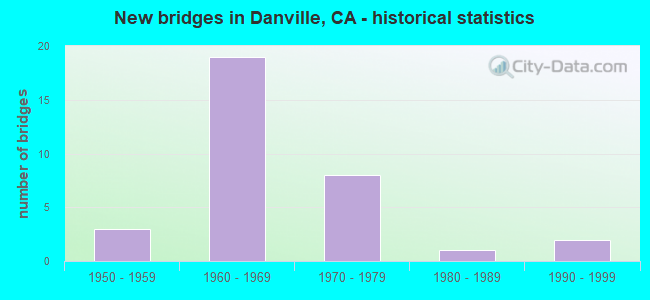
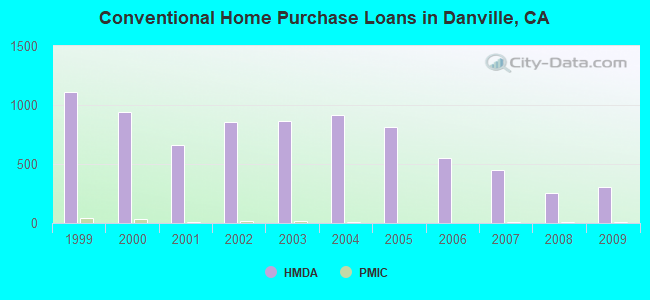
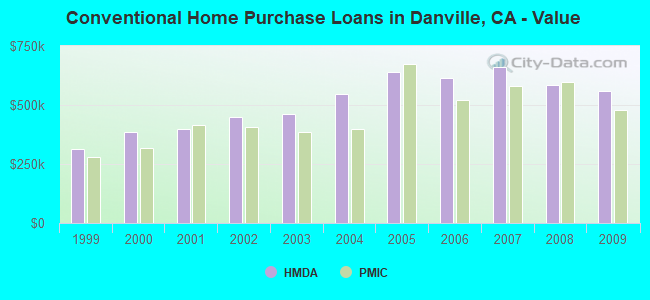
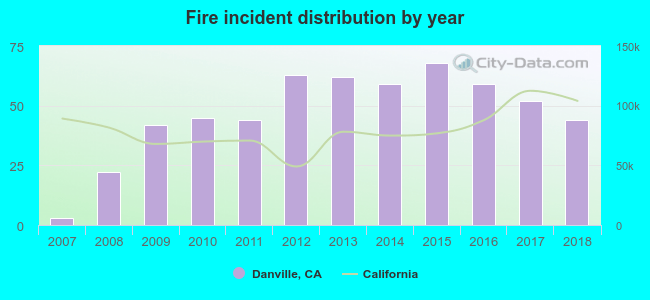 Based on the data from the years 2007 - 2018 the average number of fires per year is 47. The highest number of fire incidents - 68 took place in 2015, and the least - 3 in 2007. The data has a growing trend.
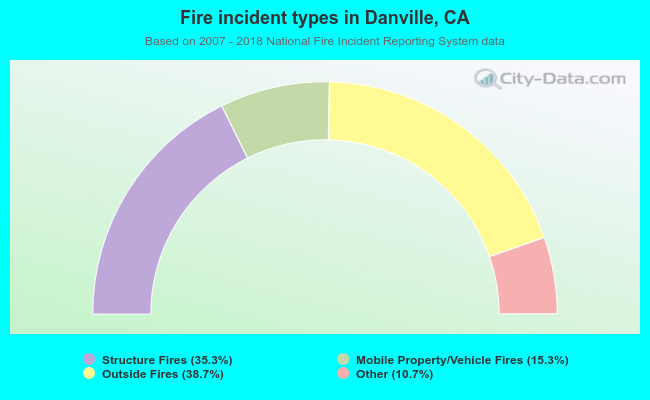 When looking into fire subcategories, the most reports belonged to: Outside Fires (38.7%), and Structure Fires (35.3%).