Estimated zip code population in 2022: 47,538 Zip code population in 2010: 45,560 Zip code population in 2000: 41,867
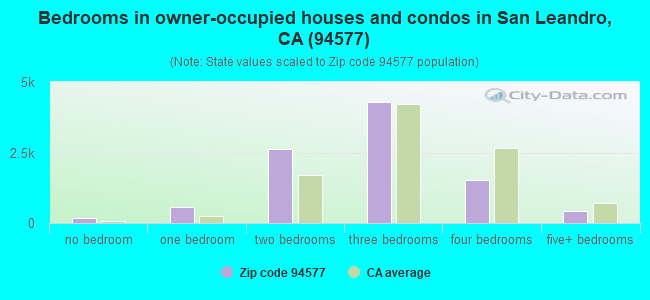
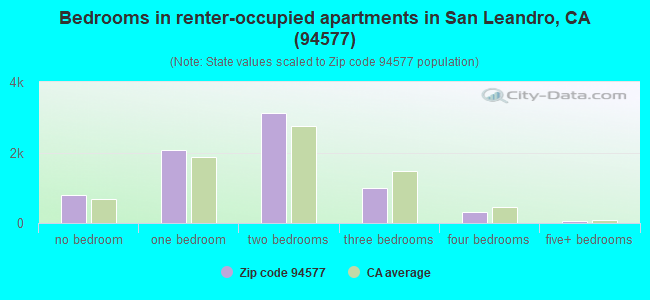
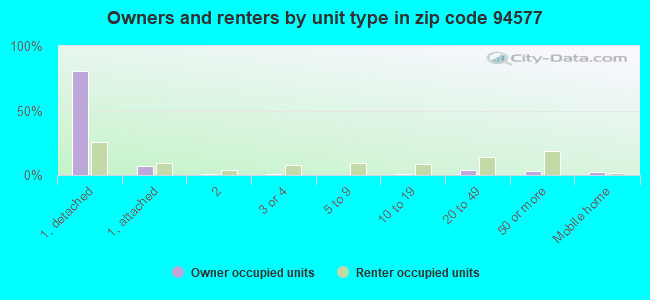
Houses and condos: 17,680 Renter-occupied apartments: 7,350
% of renters here:
43%
State:
44%
March 2022 cost of living index in zip code 94577: 118.5 (more than average, U.S. average is 100)
Land area: 8.1 sq. mi. Water area: 1.4 sq. mi.
Population density: 5,833 people per square mile
(average).
OSM Map
General Map
Google Map
MSN Map
OSM Map
General Map
Google Map
MSN Map
OSM Map
General Map
Google Map
MSN Map
OSM Map
General Map
Google Map
MSN Map
Please wait while loading the map...
Real estate property taxes paid for housing units in 2022:
This zip code:
0.7% ($5,891)
California:
0.7% ($4,831)
Median real estate property taxes paid for housing units with mortgages in 2022: $6,463 (0.7%) Median real estate property taxes paid for housing units with no mortgage in 2022: $5,070 (0.6%)
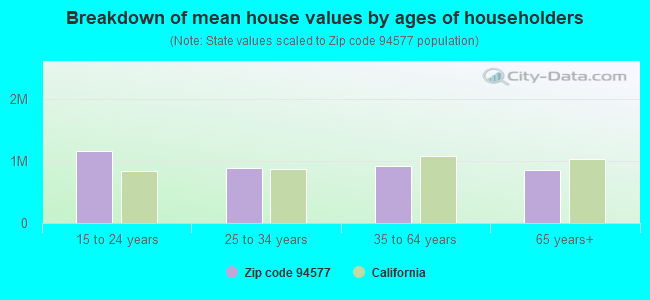
Estimated median house/condo value in 2022: $855,757
94577:
$855,757
California:
$715,900
According to our research of California and other state lists, there were 63 registered sex offenders living in 94577 zip code as of April 27, 2024. The ratio of all residents to sex offenders in zip code 94577 is 758 to 1. The ratio of registered sex offenders to all residents in this zip code is near the state average.
Median resident age:
This zip code:
41.3 years
California median age:
37.9 years
Average household size:
This zip code:
2.8 people
California:
2.8 people
Averages for the 2020 tax year for zip code 94577, filed in 2021:
Average Adjusted Gross Income (AGI) in 2020: $79,207 (Individual Income Tax Returns)
Here:
$79,207
State:
$95,910
Salary/wage: $71,637 (reported on 81.4% of returns)
Here:
$71,637
State:
$77,331
(% of AGI for various income ranges: 1241.6% for AGIs below $25k, 4039.9% for AGIs $25k-50k, 7664.9% for AGIs $50k-75k, 11106.1% for AGIs $75k-100k, 21088.8% for AGIs $100k-200k, 85862.7% for AGIs over 200k)
Taxable interest for individuals: $1,534 (reported on 34.4% of returns)
This zip code:
$1,534
California:
$2,294
(% of AGI for various income ranges: 23.1% for AGIs below $25k, 20.1% for AGIs $25k-50k, 33.5% for AGIs $50k-75k, 58.4% for AGIs $75k-100k, 143.3% for AGIs $100k-200k, 1357.1% for AGIs over 200k)
Ordinary dividends: $5,135 (reported on 18.9% of returns)
Here:
$5,135
State:
$10,949
(% of AGI for various income ranges: 23.6% for AGIs below $25k, 34.8% for AGIs $25k-50k, 71.7% for AGIs $50k-75k, 111.2% for AGIs $75k-100k, 308.3% for AGIs $100k-200k, 2400.4% for AGIs over 200k)
Net capital gain/loss in AGI: +$17,096 (reported on 18.6% of returns)
Here:
+$17,096
State:
+$49,306
(% of AGI for various income ranges: 11.3% for AGIs below $25k, 35.5% for AGIs $25k-50k, 74.7% for AGIs $50k-75k, 146.5% for AGIs $75k-100k, 551.0% for AGIs $100k-200k, 12598.8% for AGIs over 200k)
Profit/loss from business: +$13,661 (reported on 17.6% of returns)
Here:
+$13,661
State:
+$15,671
(% of AGI for various income ranges: 173.8% for AGIs below $25k, 275.0% for AGIs $25k-50k, 237.0% for AGIs $50k-75k, 402.5% for AGIs $75k-100k, 630.4% for AGIs $100k-200k, 3388.4% for AGIs over 200k)
Taxable individual retirement arrangement distribution: $19,557 (reported on 6.2% of returns)
94577:
$19,557
California:
$23,505
(% of AGI for various income ranges: 48.3% for AGIs below $25k, 68.1% for AGIs $25k-50k, 124.7% for AGIs $50k-75k, 196.3% for AGIs $75k-100k, 504.0% for AGIs $100k-200k, 1734.7% for AGIs over 200k)
Self-employed (Keogh) retirement plans: $17,912 (reported on 0.6% of returns)
94577:
$17,912
California:
$30,163
(% of AGI for various income ranges: 18.8% for AGIs $50k-75k, 39.8% for AGIs $100k-200k, 308.4% for AGIs over 200k)
Total itemized deductions: $32,521 (reported on 15.8% of returns)
Here:
$32,521
State:
$39,517
(% of AGI for various income ranges: 120.7% for AGIs below $25k, 264.7% for AGIs $25k-50k, 502.8% for AGIs $50k-75k, 1007.5% for AGIs $75k-100k, 2016.4% for AGIs $100k-200k, 8342.0% for AGIs over 200k)
Charity contributions: $8,136 (reported on 12.1% of returns)
Here:
$8,136
State:
$12,598
(% of AGI for various income ranges: 5.0% for AGIs below $25k, 18.5% for AGIs $25k-50k, 57.9% for AGIs $50k-75k, 123.1% for AGIs $75k-100k, 295.9% for AGIs $100k-200k, 2830.0% for AGIs over 200k)
Taxes paid: $9,044 (reported on 15.7% of returns)
94577:
$9,044
State:
$8,807
(% of AGI for various income ranges: 27.3% for AGIs below $25k, 70.5% for AGIs $25k-50k, 151.7% for AGIs $50k-75k, 320.4% for AGIs $75k-100k, 632.1% for AGIs $100k-200k, 1828.6% for AGIs over 200k)
Earned income credit: $1,816 (reported on 11.2% of returns)
Here:
$1,816
State:
$2,074
(% of AGI for various income ranges: 76.1% for AGIs below $25k, 55.1% for AGIs $25k-50k, 0.6% for AGIs $50k-75k)
Percentage of individuals using paid preparers for their 2020 taxes: 90.5%
Here:
90%
State:
92%
(% for various income ranges: 88.5% for AGIs below $25k, 90.7% for AGIs $25k-50k, 90.8% for AGIs $50k-75k, 90.2% for AGIs $75k-100k, 91.6% for AGIs $100k-200k, 94.0% for AGIs over 200k)
Averages for the 2012 tax year for zip code 94577, filed in 2013:
Average Adjusted Gross Income (AGI) in 2012: $58,891 (Individual Income Tax Returns)
Here:
$58,891
State:
$72,726
Salary/wage: $52,462 (reported on 82.1% of returns)
Here:
$52,462
State:
$59,079
(% of AGI for various income ranges: 70.9% for AGIs below $25k, 81.6% for AGIs $25k-50k, 79.4% for AGIs $50k-75k, 78.1% for AGIs $75k-100k, 78.7% for AGIs $100k-200k, 47.7% for AGIs over 200k)
Taxable interest for individuals: $1,115 (reported on 35.9% of returns)
This zip code:
$1,115
California:
$2,146
(% of AGI for various income ranges: 1.0% for AGIs below $25k, 0.5% for AGIs $25k-50k, 0.6% for AGIs $50k-75k, 0.6% for AGIs $75k-100k, 0.6% for AGIs $100k-200k, 0.9% for AGIs over 200k)
Ordinary dividends: $4,771 (reported on 17.0% of returns)
Here:
$4,771
State:
$9,308
(% of AGI for various income ranges: 1.4% for AGIs below $25k, 0.7% for AGIs $25k-50k, 1.3% for AGIs $50k-75k, 1.1% for AGIs $75k-100k, 1.1% for AGIs $100k-200k, 2.7% for AGIs over 200k)
Net capital gain/loss in AGI: +$6,535 (reported on 14.3% of returns)
Here:
+$6,535
State:
+$30,460
(% of AGI for various income ranges: 0.2% for AGIs $75k-100k, 1.0% for AGIs $100k-200k, 7.2% for AGIs over 200k)
Profit/loss from business: +$14,766 (reported on 15.7% of returns)
Here:
+$14,766
State:
+$17,064
(% of AGI for various income ranges: 12.4% for AGIs below $25k, 4.4% for AGIs $25k-50k, 3.0% for AGIs $50k-75k, 3.2% for AGIs $75k-100k, 3.0% for AGIs $100k-200k, 3.0% for AGIs over 200k)
Taxable individual retirement arrangement distribution: $16,070 (reported on 7.6% of returns)
94577:
$16,070
California:
$19,557
(% of AGI for various income ranges: 2.1% for AGIs below $25k, 1.7% for AGIs $25k-50k, 1.7% for AGIs $50k-75k, 2.0% for AGIs $75k-100k, 2.4% for AGIs $100k-200k, 2.4% for AGIs over 200k)
Self-employment retirement plans: $16,547 (reported on 0.8% of returns)
94577:
$16,547
California:
$24,530
(% of AGI for various income ranges: 0.1% for AGIs $25k-50k, 0.1% for AGIs $50k-75k, 0.2% for AGIs $75k-100k, 0.2% for AGIs $100k-200k, 0.6% for AGIs over 200k)
Total itemized deductions: $28,261 (27% of AGI, reported on 35.2% of returns)
Here:
$28,261
State:
$34,004
Here:
26.6% of AGI
State:
22.7% of AGI
(% of AGI for various income ranges: 12.8% for AGIs below $25k, 11.3% for AGIs $25k-50k, 13.7% for AGIs $50k-75k, 17.8% for AGIs $75k-100k, 21.0% for AGIs $100k-200k, 19.5% for AGIs over 200k)
Charity contributions: $2,990 (reported on 27.6% of returns)
Here:
$2,990
State:
$4,659
(% of AGI for various income ranges: 0.7% for AGIs below $25k, 0.8% for AGIs $25k-50k, 1.2% for AGIs $50k-75k, 1.6% for AGIs $75k-100k, 1.8% for AGIs $100k-200k, 1.6% for AGIs over 200k)
Taxes paid: $9,468 (reported on 35.0% of returns)
94577:
$9,468
State:
$14,448
(% of AGI for various income ranges: 2.5% for AGIs below $25k, 2.7% for AGIs $25k-50k, 4.1% for AGIs $50k-75k, 6.0% for AGIs $75k-100k, 7.8% for AGIs $100k-200k, 7.3% for AGIs over 200k)
Earned income credit: $1,983 (reported on 15.3% of returns)
Here:
$1,983
State:
$2,286
(% of AGI for various income ranges: 5.2% for AGIs below $25k, 0.8% for AGIs $25k-50k)
Percentage of individuals using paid preparers for their 2012 taxes: 58.4%
Here:
58%
State:
64%
(% for various income ranges: 54.9% for AGIs below $25k, 59.1% for AGIs $25k-50k, 60.3% for AGIs $50k-75k, 62.0% for AGIs $75k-100k, 59.6% for AGIs $100k-200k, 66.7% for AGIs over 200k)
Averages for the 2004 tax year for zip code 94577, filed in 2005:
Average Adjusted Gross Income (AGI) in 2004: $50,322 (Individual Income Tax Returns)
Here:
$50,322
State:
$58,600
Salary/wage: $46,982 (reported on 82.2% of returns)
Here:
$46,982
State:
$49,455
(% of AGI for various income ranges: 144.5% for AGIs below $10k, 71.0% for AGIs $10k-25k, 82.6% for AGIs $25k-50k, 82.5% for AGIs $50k-75k, 80.5% for AGIs $75k-100k, 67.8% for AGIs over 100k)
Taxable interest for individuals: $2,009 (reported on 48.9% of returns)
This zip code:
$2,009
California:
$2,365
(% of AGI for various income ranges: 11.7% for AGIs below $10k, 2.9% for AGIs $10k-25k, 1.4% for AGIs $25k-50k, 1.5% for AGIs $50k-75k, 1.6% for AGIs $75k-100k, 2.3% for AGIs over 100k)
Taxable dividends: $2,734 (reported on 23.2% of returns)
Here:
$2,734
State:
$4,746
(% of AGI for various income ranges: 7.9% for AGIs below $10k, 1.7% for AGIs $10k-25k, 0.9% for AGIs $25k-50k, 1.1% for AGIs $50k-75k, 1.1% for AGIs $75k-100k, 1.5% for AGIs over 100k)
Net capital gain/loss: +$7,711 (reported on 19.1% of returns)
Here:
+$7,711
State:
+$23,418
(% of AGI for various income ranges: -1.7% for AGIs below $10k, -0.2% for AGIs $10k-25k, 0.3% for AGIs $25k-50k, 0.6% for AGIs $50k-75k, 1.1% for AGIs $75k-100k, 7.5% for AGIs over 100k)
Profit/loss from business: +$14,607 (reported on 14.6% of returns)
Here:
+$14,607
State:
+$16,826
(% of AGI for various income ranges: 10.7% for AGIs below $10k, 7.6% for AGIs $10k-25k, 4.2% for AGIs $25k-50k, 3.0% for AGIs $50k-75k, 3.7% for AGIs $75k-100k, 4.5% for AGIs over 100k)
Profit/loss from farming: +$167 (reported on 0.1% of returns)
Here:
+$167
State:
-$7,562
IRA payment deduction: $3,090 (reported on 2.7% of returns)
94577:
$3,090
California:
$3,192
(% of AGI for various income ranges: 0.4% for AGIs below $10k, 0.2% for AGIs $10k-25k, 0.3% for AGIs $25k-50k, 0.2% for AGIs $50k-75k, 0.2% for AGIs $75k-100k, 0.1% for AGIs over 100k)
Self-employed pension: $13,526 (reported on 1.1% of returns)
Here:
$13,526
California:
$17,688
(% of AGI for various income ranges: 0.1% for AGIs $10k-25k, 0.2% for AGIs $25k-50k, 0.1% for AGIs $50k-75k, 0.2% for AGIs $75k-100k, 0.6% for AGIs over 100k)
Total itemized deductions: $24,371 (29% of AGI, reported on 40.0% of returns)
Here:
$24,371
State:
$28,113
Here:
29.4% of AGI
State:
25.3% of AGI
(% of AGI for various income ranges: 40.2% for AGIs below $10k, 13.0% for AGIs $10k-25k, 15.1% for AGIs $25k-50k, 20.5% for AGIs $50k-75k, 22.0% for AGIs $75k-100k, 21.0% for AGIs over 100k)
Charity contributions deductions: $2,547 (3% of AGI, reported on 34.5% of returns)
Here:
$2,547
State:
$3,923
Here:
3.0% of AGI
State:
3.3% of AGI
(% of AGI for various income ranges: 1.3% for AGIs below $10k, 0.9% for AGIs $10k-25k, 1.3% for AGIs $25k-50k, 1.8% for AGIs $50k-75k, 2.0% for AGIs $75k-100k, 2.1% for AGIs over 100k)
Total tax: $6,890 (reported on 80.0% of returns)
94577:
$6,890
State:
$10,761
(% of AGI for various income ranges: 6.3% for AGIs below $10k, 4.6% for AGIs $10k-25k, 7.4% for AGIs $25k-50k, 9.3% for AGIs $50k-75k, 10.4% for AGIs $75k-100k, 15.8% for AGIs over 100k)
Earned income credit: $1,521 (reported on 10.6% of returns)
Here:
$1,521
State:
$1,763
Percentage of individuals using paid preparers for their 2004 taxes: 62.7%
Here:
63%
State:
66%
(% for various income ranges: 54.7% for AGIs below $10k, 65.5% for AGIs $10k-25k, 63.2% for AGIs $25k-50k, 63.4% for AGIs $50k-75k, 63.4% for AGIs $75k-100k, 65.2% for AGIs over 100k)
Likely homosexual households (counted as self-reported same-sex unmarried-partner households)
Lesbian couples: 0.3% of all households
Gay men: 0.1% of all households
Household received Food Stamps/SNAP in the past 12 months: 1,670 Household did not receive Food Stamps/SNAP in the past 12 months: 15,202
Women who had a birth in the past 12 months: 811 (482 now married, 330 unmarried) Women who did not have a birth in the past 12 months: 10,571 (4,131 now married, 6,442 unmarried)
Housing units in zip code 94577 with a mortgage: 6,294 (757 second mortgage, 9 home equity loan, 585 both second mortgage and home equity loan) Houses without a mortgage: 206
Median monthly owner costs for units with a mortgage: $2,841 Median monthly owner costs for units without a mortgage: $784
Residents with income below the poverty level in 2022:
This zip code:
7.2%
Whole state:
12.2%
Residents with income below 50% of the poverty level in 2022:
This zip code:
4.1%
Whole state:
6.2%
Median number of rooms in houses and condos:
Here:
5.7
State:
6.0
Median number of rooms in apartments:
Here:
3.8
State:
3.9
Notable locations in this zip code not listed on our city pages
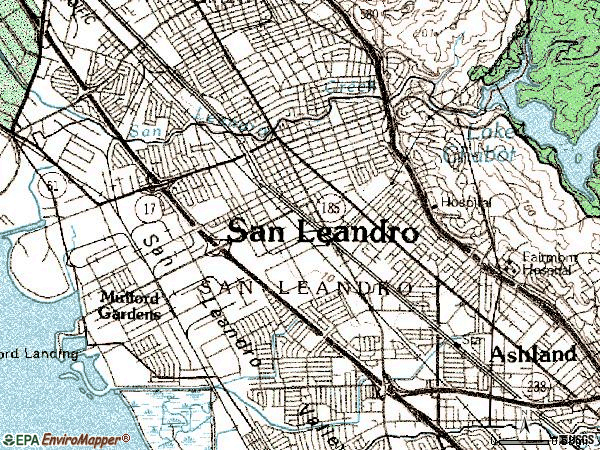
Notable locations in zip code 94577: Tony Lema Golf Course (A), Spinnaker Yacht Club (B), San Leandro Yacht Club (C), Pelican Picnic Area (D), Mallard Picnic Area (E), San Leandro Marina (F), Mulford Landing (G), Marina Golf Course (H), San Leandro Community Library (I), San Leandro City Hall (J), Mulford-Marina Branch San Leandro Community Library (K), J A Freitas Library (L), Farrelly Community Center (M), Veterans War Memorial Building (N), Pro Transport 1 Ambulance (O), Royal Ambulance (P), Alameda County Fire Department Station 10 (Q), Alameda County Fire Department Station 11 (R), Alameda County Fire Department Training Facility (S), Alameda County Fire Department Station 9 (T). Display/hide their locations on the map
Churches in zip code 94577 include: All Saints Episcopal Church (A), Bancroft Avenue Baptist Church (B), Broadmoor Community Church (C), Church of Christ (D), Fairhaven Bible Chapel (E), First Christian Church (F), First Church of Christ Scientist (G), First Presbyterian Church (H), Prayer Chapel (I). Display/hide their locations on the map
Parks in zip code 94577 include: Plaza Park (1), Root Park (2), Siempre Verde Park (3), Thrasher Park (4), Victoria Park (5), Cherry Grove Park (6), Marina Park (7), Mulford Park (8), Oyster Bay Regional Shoreline (9). Display/hide their locations on the map
5,248 married couples with children.
1,640 single-parent households (516 men, 1,124 women).
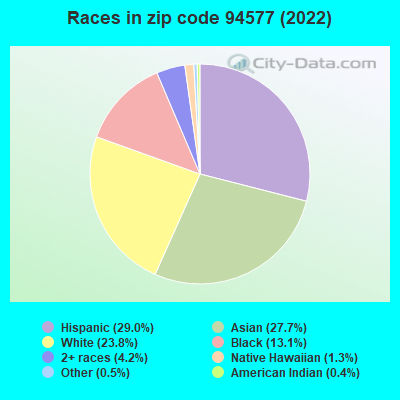
51.0% of residents of 94577 zip code speak English at home.
21.6% of residents speak Spanish at home (65% very well, 20% well, 9% not well, 6% not at all).
3.7% of residents speak other Indo-European language at home (63% very well, 30% well, 6% not well, 1% not at all).
21.1% of residents speak Asian or Pacific Island language at home (48% very well, 28% well, 19% not well, 5% not at all).
2.6% of residents speak other language at home (70% very well, 23% well, 7% not well).
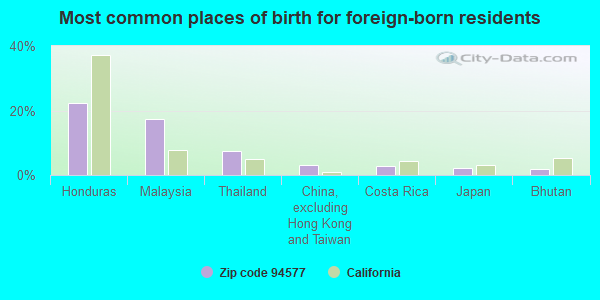
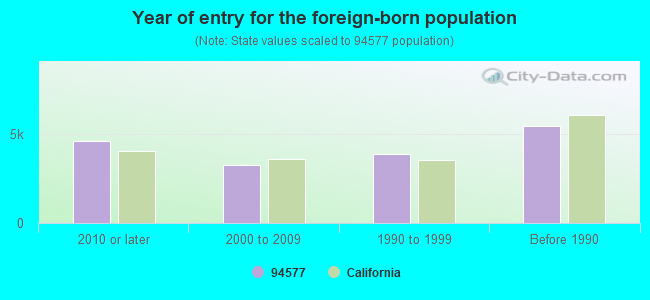
Foreign born population: 16,210 (34.1%) (58.4% of them are naturalized citizens)
Major facilities with environmental interests located in this zip code:
JPS PACKAGING COMPANY (2450 ALVARADO ST. in SAN LEANDRO, CA)
AIR SYNTHETIC MINOR (AIRS/AFS) STATE MASTER (California - Hazardous Waste Tracking) - HAZARDOU WASTE PROGRAM COMPLIANCE ACTIVITY (Tracking inspections of insecticide, fungicide, and rodenticide, and toxic substances) CRITERIA AND HAZARDOUS AIR POLLUTANT INVENTORY (Inventory of air pollution sources) HAZARDOUS WASTE BIENNIAL REPORTER (Resource Conservation and Recovery Act (tracking hazardous waste)) Large Quantity Generators, more that 1000 kg of hazardous waste/month (Resource Conservation and Recovery Act (tracking hazardous waste)) - notification TRI REPORTER (Tracking of toxic chemicals releasing facilities) Business SIC classification: PACKAGING PAPER AND PLASTICS FILM, COATED AND LAMINATED; COMMERCIAL PRINTING; UNSUPPORTED PLASTICS FILM AND SHEET Business NAICS classification: COATED AND LAMINATED PACKAGING PAPER AND PLASTICS FILM MANUFACTURING. Organizations: PECHINEY PLASTIC PACKAGING (CONTACT/OPERATOR)
Alternative names: PECHINEY PLASTIC PACKAGING INC, PECHINLEY PACKAGING INC, PACKAGING INDUSTRIES INC, SEALRIGHT, SEALRIGHT FLEXIBLE PACKAGING G
CALTRANS EQUIPMENT SHOP 4 (1993 MARINA BLVD in SAN LEANDRO, CA)
STATE MASTER (California - Hazardous Waste Tracking) - HAZARDOU WASTE PROGRAM Small Quantity Generators, between 100 kg and 1000 kg of hazardous waste/month (Resource Conservation and Recovery Act (tracking hazardous waste)) - notification - ICIS-, ENFORCEMENT/COMPLIANCE ACTIVITY Organizations: CALIF DEPT OF TRANS (CONTACT/OWNER)
Alternative names: CALTRANS DISTRICT 4 - SHOP
FOAMEX L P (2451 POLVOROSA DRIVE in SAN LEANDRO, CA)
STATE MASTER (California - Hazardous Waste Tracking) - HAZARDOU WASTE PROGRAM HAZARDOUS WASTE BIENNIAL REPORTER (Resource Conservation and Recovery Act (tracking hazardous waste)) Small Quantity Generators, between 100 kg and 1000 kg of hazardous waste/month (Resource Conservation and Recovery Act (tracking hazardous waste)) - notification TRI REPORTER (Tracking of toxic chemicals releasing facilities) Business SIC classification: PLASTICS FOAM PRODUCTS Business NAICS classification: PLASTICS MATERIAL AND RESIN MANUFACTURING. Organizations: FOAMEX LP (CONTACT/OWNER)
, CRAIN INDUSTRIES INC (CONTACT/OWNER)
Alternative names: FOAMEX INTERNATIONAL, FOAMEX LP
MARK CONTAINER CORP (1951 WILLIAMS ST in SAN LEANDRO, CA)
STATE MASTER (California - Hazardous Waste Tracking) - HAZARDOU WASTE PROGRAM Large Quantity Generators, more that 1000 kg of hazardous waste/month (Resource Conservation and Recovery Act (tracking hazardous waste)) - notification
MARINA PONTIAC G M C (1444 MARINA BLVD in SAN LEANDRO, CA)
STATE MASTER (California - Hazardous Waste Tracking) - HAZARDOU WASTE PROGRAM Large Quantity Generators, more that 1000 kg of hazardous waste/month (Resource Conservation and Recovery Act (tracking hazardous waste)) - notification Organizations: MARK KANE (CONTACT/OWNER)
FOAMEX L P (2435 POLVOROSA AVE in SAN LEANDRO, CA)
STATE MASTER (California - Hazardous Waste Tracking) - HAZARDOU WASTE PROGRAM Small Quantity Generators, between 100 kg and 1000 kg of hazardous waste/month (Resource Conservation and Recovery Act (tracking hazardous waste)) - notification Business NAICS classification: PLASTICS MATERIAL AND RESIN MANUFACTURING.; SYNTHETIC RUBBER MANUFACTURING. Organizations: CRAIN PACIFIC (CONTACT/OPERATOR)
, CRAIN INDUSTRIES INC (CONTACT/OWNER)
Alternative names: FOAMEX INTERNATIONAL
FOUR SEASONS CLEANERS (13778 DOOLITTLE DRIVE in SAN LEANDRO, CA)
STATE MASTER (California - Hazardous Waste Tracking) - HAZARDOU WASTE PROGRAM CRITERIA AND HAZARDOUS AIR POLLUTANT INVENTORY (Inventory of air pollution sources) Small Quantity Generators, between 100 kg and 1000 kg of hazardous waste/month (Resource Conservation and Recovery Act (tracking hazardous waste)) - notification Business SIC classification: DRYCLEANING PLANTS, EXCEPT RUG CLEANING Organizations: TAMAYO LOUISE (CONTACT/OWNER)
L A SMITH & SONS BODY SHOP (903 WILLIAMS STREET in SAN LEANDRO, CA)
STATE MASTER (California - Hazardous Waste Tracking) - HAZARDOU WASTE PROGRAM CRITERIA AND HAZARDOUS AIR POLLUTANT INVENTORY (Inventory of air pollution sources) Small Quantity Generators, between 100 kg and 1000 kg of hazardous waste/month (Resource Conservation and Recovery Act (tracking hazardous waste)) Business SIC classification: TOP, BODY, AND UPHOLSTERY REPAIR SHOPS AND PAINT SHOPS Business NAICS classification: AUTOMOTIVE BODY, PAINT, AND INTERIOR REPAIR AND MAINTENANCE. Alternative names: LA SMITH & SONS BODY SHOP
MARS ENGINEERING CO (699 MONTAGUE AVE. in SAN LEANDRO, CA)
STATE MASTER (California - Hazardous Waste Tracking) - HAZARDOU WASTE PROGRAM Small Quantity Generators, between 100 kg and 1000 kg of hazardous waste/month (Resource Conservation and Recovery Act (tracking hazardous waste)) TRI REPORTER (Tracking of toxic chemicals releasing facilities) Business SIC classification: SCREW MACHINE PRODUCTS Business NAICS classification: PRECISION TURNED PRODUCT MANUFACTURING. Alternative names: M A R 'S ENGINEERING CO
CALTRANS DISTRICT 4 (600 LEWELLING BLVD in SAN LEANDRO, CA)
STATE MASTER (California - Hazardous Waste Tracking) - HAZARDOU WASTE PROGRAM HAZARDOUS WASTE BIENNIAL REPORTER (Resource Conservation and Recovery Act (tracking hazardous waste)) Small Quantity Generators, between 100 kg and 1000 kg of hazardous waste/month (Resource Conservation and Recovery Act (tracking hazardous waste))
NOVA INDUSTRIES INCORPORATED (999 MONTAGUE AVENUE in SAN LEANDRO, CA)
STATE MASTER (California - Hazardous Waste Tracking) - HAZARDOU WASTE PROGRAM CRITERIA AND HAZARDOUS AIR POLLUTANT INVENTORY (Inventory of air pollution sources) Small Quantity Generators, between 100 kg and 1000 kg of hazardous waste/month (Resource Conservation and Recovery Act (tracking hazardous waste)) Business SIC classification: ELECTRICAL MACHINERY, EQUIPMENT, AND SUPPLIES Business NAICS classification: RESIDENTIAL ELECTRIC LIGHTING FIXTURE MANUFACTURING.; COMMERCIAL, INDUSTRIAL, AND INSTITUTIONAL ELECTRIC LIGHTING FIXTURE MANUFACTURING.
NELSONS BODY SHOP (512 MARINA BOULEVARD in SAN LEANDRO, CA)
STATE MASTER (California - Hazardous Waste Tracking) - HAZARDOU WASTE PROGRAM CRITERIA AND HAZARDOUS AIR POLLUTANT INVENTORY (Inventory of air pollution sources) Small Quantity Generators, between 100 kg and 1000 kg of hazardous waste/month (Resource Conservation and Recovery Act (tracking hazardous waste)) Business SIC classification: TOP, BODY, AND UPHOLSTERY REPAIR SHOPS AND PAINT SHOPS Business NAICS classification: AUTOMOTIVE BODY, PAINT, AND INTERIOR REPAIR AND MAINTENANCE.
LEUTENEKER INC (476 WHITNEY ST in SAN LEANDRO, CA)
STATE MASTER (California - Hazardous Waste Tracking) - HAZARDOU WASTE PROGRAM Small Quantity Generators, between 100 kg and 1000 kg of hazardous waste/month (Resource Conservation and Recovery Act (tracking hazardous waste)) - notification Organizations: JON LEUTENEKER (CONTACT/OWNER)
Housing units lacking complete plumbing facilities: 0.7% Housing units lacking complete kitchen facilities: 2.1%
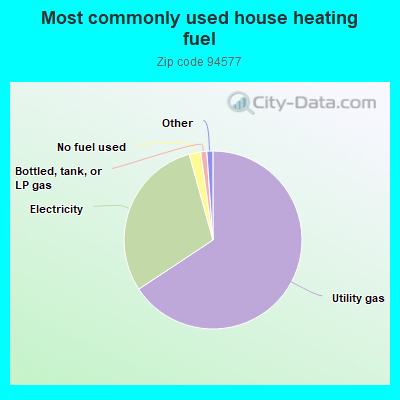
65.7%Utility gas
30.0%Electricity
2.1%No fuel used
1.1%Bottled, tank, or LP gas
Population in 1990: 36,779. Population change in the 1990s: +5,088 (+13.8%).
Place of birth for U.S.-born residents:
This state: 24,670
Northeast: 1,353
Midwest: 1,495
South: 1,850
West: 1,134
58% of the 94577 zip code residents lived in the same house 5 years ago. Out of people who lived in different houses, 72% lived in this county. Out of people who lived in different counties, 50% lived in California.
93% of the 94577 zip code residents lived in the same house 1 year ago. Out of people who lived in different houses, 58% moved from this county. Out of people who lived in different houses, 26% moved from different county within same state. Out of people who lived in different houses, 12% moved from different state. Out of people who lived in different houses, 5% moved from abroad.
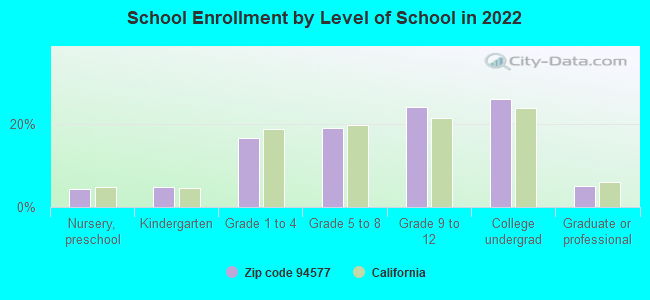
Private vs. public school enrollment:
Students in private schools in grades 1 to 8 (elementary and middle school): 454
Here:
12.9%
California:
10.5%
Students in private schools in grades 9 to 12 (high school): 325
Here:
13.7%
California:
8.5%
Students in private undergraduate colleges: 367
Here:
14.4%
California:
15.9%
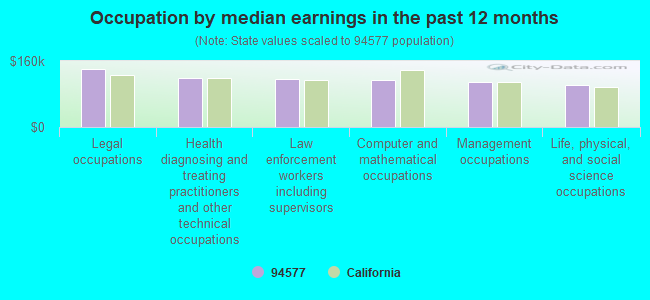
Occupation by median earnings in the past 12 months ($)
140,879Legal occupations
119,032Health diagnosing and treating practitioners and other technical occupations
116,636Law enforcement workers including supervisors
114,693Computer and mathematical occupations
108,581Management occupations
101,737Life, physical, and social science occupations
Companies with biggest federal contracts located in this zip code (SAN LEANDRO, CA):
RAITO, INC (1660 FACTOR AVE) : $27,618,351 in 98 contractsfrom 2002 to 2005
Contracts for Construction of Structures and Facilities -- Dredging, Maintenance, Repair or Alteration of Real Property -- Dams, Construction of Structures and Facilities -- Dams by U.S. Army Corps of Engineers - civil program financing only, Army Signed by year:2000: $0; 2001: $0; 2002: $1,237,382; 2003: $2,816,517; 2004: $21,455,870; 2005: $2,108,582; 2006: $0.
Biggest contracts:
$4,242,080 with U.S. Army Corps of Engineers - civil program financing only for Construction of Structures and Facilities -- Dredging. Taking place in VT. Signed on 2004-04-02. Completion date: 2004-12-18.
$4,242,080 with Army for Construction of Structures and Facilities -- Dredging. Taking place in VT. Signed on 2004-04-02. Completion date: 2004-12-18.
$2,247,820 with U.S. Army Corps of Engineers - civil program financing only for Maintenance, Repair or Alteration of Real Property -- Dams. Taking place in VT. Signed on 2003-08-12. Completion date: 2004-12-18.
$1,181,807, same as above.Signed on 2002-11-21. Completion date: 2004-12-18.
ASSOCIATED AEROSPACE ACTIVITIE (2502 WILLIAMS STREET; small business) : $22,678,008 in 77 contractsfrom 1999 to 2006
Contracts for Gas Turbines and Jet Engines, Aircraft; Prime Moving, and Components by Air Force, Defense Logistics Agency Signed by year:2000: $7,014,253; 2001: $7,699,034; 2002: $1,990,685; 2003: $608,847; 2004: $831,602; 2005: $3,411,325; 2006: $1,005,262.
Biggest contracts:
$3,051,360 with Air Force for Gas Turbines and Jet Engines, Aircraft; Prime Moving, and Components. Signed on 2001-12-19. Completion date: 2004-01-31.
$2,501,207, same as above.Signed on 2001-10-29. Completion date: 2002-05-31.
$2,320,079, same as above.Signed on 2000-02-11. Completion date: 2001-02-28.
$2,026,126, same as above.Signed on 2005-08-05. Completion date: 2006-07-31.
ALAMEDA APPLIED SCIENCES CORP (626 WHITNEY ST; small business) : $14,968,086 in 59 contractsfrom 1999 to 2006
Contracts for Other General Transportation -- Basic Research (R&D), Weapons -- Basic Research (R&D), Defense Missile and Space Systems -- Applied Research and Exploratory Development (R&D), Other Defense -- Management and Support (R&D), and moreby Department of Defense, Air Force, Defense Threat Reduction Agency, Navy, and others Signed by year:2000: $1,384,670; 2001: $999,116; 2002: $3,804,981; 2003: $1,618,218; 2004: $3,610,908; 2005: $2,823,888; 2006: $200,000.
Biggest contracts:
$2,855,000 with Department of Defense for Other General Transportation -- Basic Research (R&D). Signed on 2002-11-21. Completion date: 2001-01-31.
$1,290,000, same as above.Signed on 2005-01-19. Completion date: 2006-05-27.
$950,000, same as above.Signed on 2004-12-29. Completion date: 2006-05-27.
$749,904 with Air Force for Weapons -- Basic Research (R&D). Signed on 2004-07-20. Completion date: 2006-10-16.
OTIS SPUNKMEYER INC (14490 CATALINA ST) : $9,232,527 in 38 contractsfrom 1999 to 2005
Contracts for Food Items For Resale, Non-Food Items For Resale by Defense Commissary Agency, Department of Defense Signed by year:2000: $441,128; 2001: $236,035; 2002: $941,786; 2003: $408,981; 2004: $2,035,331; 2005: $4,970,535; 2006: $0.
Biggest contracts:
$1,650,467 with Defense Commissary Agency for Food Items For Resale. Signed on 2005-04-01. Completion date: 2005-08-31.
$984,025, same as above.Signed on 2004-10-01. Completion date: 2005-02-28.
$883,631 with Department of Defense for Food Items For Resale. Signed on 2002-12-01. Completion date: 2003-05-31.
$820,272 with Defense Commissary Agency for Non-Food Items For Resale. Signed on 2005-10-01. Completion date: 2005-12-31.
STARZZ MANAGEMENT SERVICES, IN (900 DOOLITTLE DRIVE; small business) : $7,772,140 in 189 contractsfrom 1999 to 2006
Contracts for Packing/Crating Services, Other Administrative Support Services, Post Office Services, Mailing and Distribution Services, and moreby Army, Navy, Air Force, ENERGY, Department of, and others Signed by year:2000: $555,180; 2001: $580,052; 2002: $822,386; 2003: $749,855; 2004: $1,394,495; 2005: $3,160,775; 2006: $127,413.
Biggest contracts:
$733,708 with Army for Packing/Crating Services. Taking place in GA. Signed on 2005-03-17. Completion date: 2006-02-28.
$586,960 with Navy for Other Administrative Support Services. Taking place in MS. Signed on 2005-02-28. Completion date: 2007-04-30.
$501,865 with Air Force for Post Office Services. Taking place in TX. Signed on 2004-10-01. Completion date: 2005-09-30.
$327,877 with Navy for Other Administrative Support Services. Taking place in IL. Signed on 2002-10-01. Completion date: 2003-09-30.
TITAN CORPORATION (2700 MERCED STREET; small business) : $3,046,581 in 8 contractsfrom 1999 to 2005
Contracts for Other Defense -- Basic Research (R&D), Defense Electronics and Communication Equipment -- Advanced Development (R&D), Cable, Cord, and Wire Assemblies: Communications Equipment, Wire and Cable, Electrical by Navy, Army Signed by year:2000: $861,773; 2001: $1,972,759; 2002: $0; 2003: $0; 2004: $26,090; 2005: $6,025; 2006: $0.
Biggest contracts:
$1,600,000 with Navy for Other Defense -- Basic Research (R&D). Signed on 2001-03-07. Completion date: 2002-03-01.
$799,908 with Navy for Defense Electronics and Communication Equipment -- Advanced Development (R&D). Signed on 2000-01-27. Completion date: 1999-12-31.
$372,759 with Navy for Other Defense -- Basic Research (R&D). Signed on 2001-07-19. Completion date: 2002-03-06.
$179,934 with Navy for Defense Electronics and Communication Equipment -- Advanced Development (R&D). Signed on 1999-10-29. Completion date: 1999-12-31.
AERO-DYNE SUPPLY CO, INC (474 WHITNEY ST; small business) : $2,538,598 in 95 contractsfrom 2002 to 2006
Contracts for Hose, Pipe, Tube, Lubrication, and Railing Fittings, Aircraft Hydraulic, Vacuum, and De-icing System Components, Hose and Flexible Tubing, Hardware, Commercial, and moreby Defense Logistics Agency, Navy Signed by year:2000: $0; 2001: $0; 2002: $425,926; 2003: $211,392; 2004: $952,590; 2005: $763,045; 2006: $185,645.
Biggest contracts:
$94,360 with Defense Logistics Agency for Hose, Pipe, Tube, Lubrication, and Railing Fittings. Signed on 2002-02-11. Completion date: 2002-06-11.
$90,361, same as above.Signed on 2002-01-28. Completion date: 2002-05-28.
$89,523, same as above.Signed on 2005-05-18. Completion date: 2005-10-05.
$83,448, same as above.Signed on 2006-04-07. Completion date: 2006-09-13.
PRIMEX TACTICAL SYSTEMS, INC. (1840 FAIRWAY DR.) : $2,060,353 in 4 contractsfrom 1999 to 2000
$982,000 with Army for Defense Tank - Automotive -- Advanced Development (R&D). Signed on 2000-01-20. Completion date: 2002-06-30.
$700,000, same as above.Signed on 1999-11-08. Completion date: 2002-06-30.
$330,468 with Army for Ammunition -- Management and Support (R&D). Signed on 2000-06-08. Completion date: 2000-12-30.
$47,885 with Army for Defense Tank - Automotive -- Advanced Development (R&D). Signed on 2000-04-18. Completion date: 2000-09-30.
TINI ALLOY COMPANY (1619 NEPTUNE DR; small business) : $1,515,904 in 10 contractsfrom 2000 to 2005
Contracts for Other Defense -- Basic Research (R&D), Environmental Sciences -- Applied Research and Exploratory Development (R&D), Other Defense -- Applied Research and Exploratory Development (R&D) by Army, NASA Signed by year:2000: $70,000; 2001: $420,601; 2002: $225,000; 2003: $51,123; 2004: $0; 2005: $749,180; 2006: $0.
Biggest contracts:
$749,180 with Army for Other Defense -- Basic Research (R&D). Signed on 2005-09-21. Completion date: 2006-11-21.
$255,000 with NASA for Environmental Sciences -- Applied Research and Exploratory Development (R&D). Signed on 2001-01-15. Completion date: 2003-01-15.
$225,000, same as above.Signed on 2002-03-15. Completion date: 2003-01-15.
$98,601 with Army for Other Defense -- Applied Research and Exploratory Development (R&D). Signed on 2001-03-07. Completion date: 2001-11-12.
ROLLS WOOD GROUP (REPAIR & OVE (14700 DOOLITTLE DR) : $1,317,019 in 30 contractsfrom 2002 to 2006
Contracts for Gas Turbines and Jet Engines, Non-Aircraft; and Components, Torque Converters and Speed Changers, Pressure, Temperature, and Humidity Measuring and Controlling Instruments by Navy Signed by year:2000: $0; 2001: $0; 2002: $188,000; 2003: $606,967; 2004: $135,440; 2005: $295,087; 2006: $91,525.
Biggest contracts:
$309,787 with Navy for Gas Turbines and Jet Engines, Non-Aircraft; and Components. Signed on 2003-09-23. Completion date: 2004-04-08.
$96,000, same as above.Signed on 2003-09-18. Completion date: 2004-02-18.
$94,000, same as above.Signed on 2002-10-01. Completion date: 2003-02-06.
$91,627, same as above.Signed on 2003-09-18. Completion date: 2004-04-01.
Top industries in this zip code by the number of employees in 2005:
Real Estate and Rental and Leasing: Passenger Car Rental (over 1000 employees: 1 establishment, 50-99 employees: 2 establishments, 20-49 employees: 1 establishment, 10-19 employees: 1 establishment, 5-9 employees: 1 establishment, 1-4 employees: 3 establishments)
Wholesale Trade: Toy and Hobby Goods and Supplies Merchant Wholesalers (over 1000: 1, 5-9: 1)
2005 - 2018 National Fire Incident Reporting System (NFIRS) incidents
According to the data from the years 2005 - 2018 the average number of fire incidents per year is 136. The highest number of reported fires - 272 took place in 2018, and the least - 0 in 2014. The data has a rising trend.
When looking into fire subcategories, the most reports belonged to: Structure Fires (42.0%), and Outside Fires (33.9%).
Fire incident types reported to NFIRS in Zip Code 94577


+$167
-$7,562
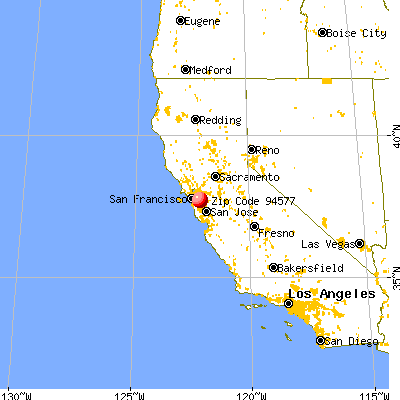
 Nearest zip codes: 94603, 94579, 94578, 94580, 94605, 94621.


 According to the data from the years 2005 - 2018 the average number of fire incidents per year is 136. The highest number of reported fires - 272 took place in 2018, and the least - 0 in 2014. The data has a rising trend.
 When looking into fire subcategories, the most reports belonged to: Structure Fires (42.0%), and Outside Fires (33.9%).