Cherrywood neighborhood in San Leandro, California (CA), 94577, 94603 detailed profile
Settings
X

Business Search - 14 Million verified businesses
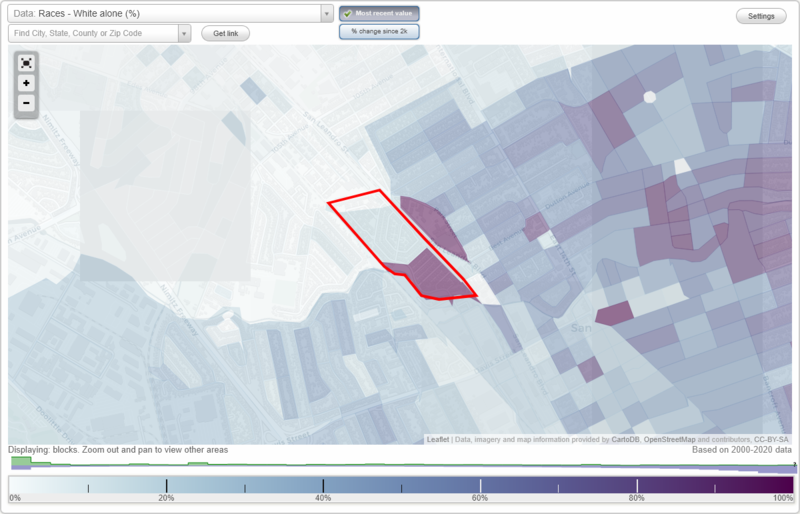
Area: 0.078 square miles
Population: 898
Population density:
| Cherrywood: | 11,512 people per square mile |
| San Leandro: | 6,610 people per square mile |

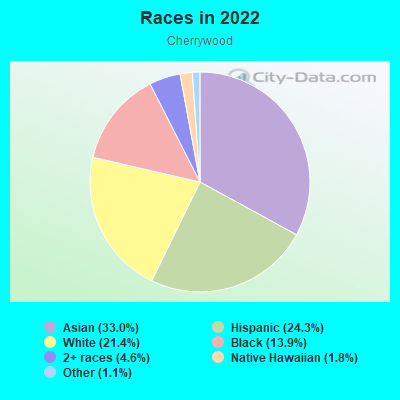
- 30133.0%Asian
- 22224.3%Hispanic or Latino
- 19521.4%White
- 12713.9%Black
- 424.6%Two or more races
- 161.8%Native Hawaiian and Other
Pacific Islander - 101.1%Some other race
Median household income in 2022:
| Cherrywood: | $138,947 |
| San Leandro: | $92,651 |
Distribution of median household income
![Distribution of median household income]()
- 11Less than $10,000
- 39$10,000 to $19,999
- 10$20,000 to $29,999
- 11$30,000 to $39,999
- 29$40,000 to $49,999
- 12$50,000 to $59,999
- 2$60,000 to $74,999
- 33$75,000 to $99,999
- 24$100,000 to $124,999
- 18$125,000 to $149,999
- 50$150,000 to $199,999
- 130$200,000 or more

Distribution of owner-occupied house/condo value
![Distribution of owner-occupied house/condo value]()
- 4Less than $50,000
- 1$50,000 to $99,999
- 1$100,000 to $149,999
- 41$200,000 to $249,999
- 2$250,000 to $299,999
- 10$300,000 to $399,999
- 4$400,000 to $499,999
- 69$500,000 to $749,999
- 150$750,000 to $999,999
- 36$1,000,000 or more

Distribution of rent paid by renters
![Distribution of rent paid by renters]()
- 7Less than $100
- 12$200 to $299
- 6$300 to $399
- 6$500 to $599
- 18$900 to $999
- 7$1,000 to $1,249
- 17$1,250 to $1,499
- 11$1,500 to $1,999
- 28$2,000 or more

| Males: | 511 |
| Females: | 386 |
Males:
| This neighborhood: | 45.0 years |
| Whole city: | 40.3 years |
| This neighborhood: | 41.9 years |
| Whole city: | 45.2 years |
Average household size:
| Cherrywood: | 3.1 people |
| San Leandro: | 2.9 people |
Percentage of family households:
| Cherrywood: | 52.2% |
| San Leandro: | 44.4% |
| Here: | 55.2% |
| San Leandro: | 49.6% |
Percentage of married-couple families with children (among all households):
| Cherrywood: | 30.5% |
| San Leandro: | 26.2% |
Percentage of single-mother households (among all households):
| Cherrywood: | 1.5% |
| San Leandro: | 7.1% |
Percentage of never married males 15 years old and over:
Percentage of never married females 15 years old and over:
| Cherrywood: | 16.2% |
| San Leandro: | 18.2% |
Percentage of never married females 15 years old and over:
| Cherrywood: | 10.1% |
| city: | 16.0% |
Percentage of people that speak English not well or not at all:
| Cherrywood: | 7.6% |
| San Leandro: | 12.0% |
Percentage of people born in this state:
Percentage of people born in another U.S. state:
Percentage of native residents but born outside the U.S.:
Percentage of foreign born residents:
| Here: | 52.3% |
| San Leandro: | 44.1% |
Percentage of people born in another U.S. state:
| Cherrywood: | 14.0% |
| San Leandro: | 9.8% |
Percentage of native residents but born outside the U.S.:
| Here: | 3.8% |
| city: | 1.7% |
Percentage of foreign born residents:
| Here: | 30.3% |
| San Leandro: | 44.4% |
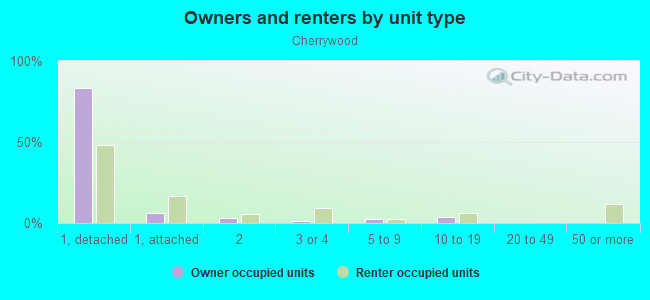
Owner-occupied
Renter-occupied

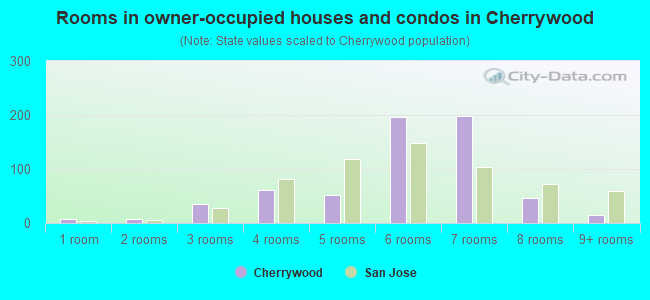
- Rooms in owner-occupied houses and condos in Cherrywood
- 31 room
- 02 rooms
- 13 rooms
- 394 rooms
- 855 rooms
- 416 rooms
- 337 rooms
- 348 rooms
- 269+ rooms
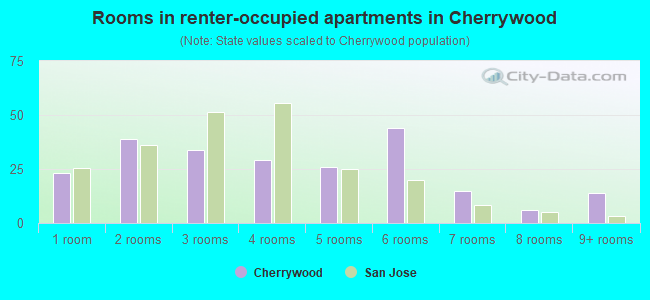
- Rooms in renter-occupied apartments in Cherrywood
- 61 room
- 22 rooms
- 243 rooms
- 114 rooms
- 175 rooms
- 86 rooms
- 37 rooms
- 38 rooms
- 19+ rooms
Owner-occupied
Renter-occupied
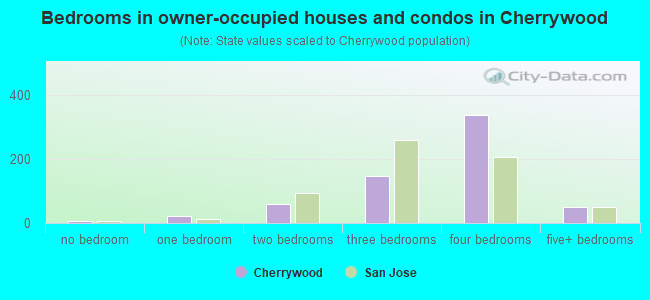
- Bedrooms in owner-occupied houses and condos in Cherrywood
- 3no bedroom
- 01 bedroom
- 852 bedrooms
- 983 bedrooms
- 354 bedrooms
- 365+ bedrooms
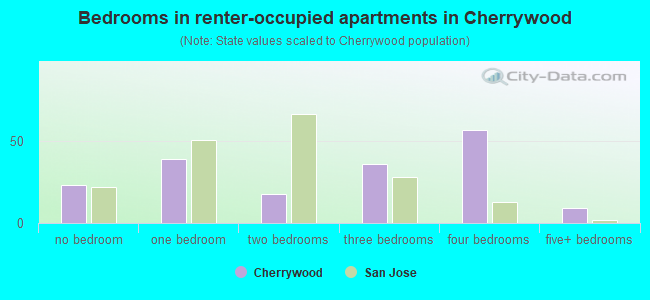
- Bedrooms in renter-occupied apartments in Cherrywood
- 6no bedroom
- 241 bedroom
- 142 bedrooms
- 103 bedrooms
- 114 bedrooms
- 15+ bedrooms
Average number of cars or other vehicles available in houses/condos:
Average number of cars or other vehicles available in apartments:
| This neighborhood: | 2.2 |
| San Leandro: | 2.2 |
Average number of cars or other vehicles available in apartments:
| Here: | 2.1 |
| city: | 1.3 |
Percentage of units with a mortgage:
| Cherrywood: | 61.5% |
| San Leandro: | 63.4% |
Average estimated value of detached houses in 2022 (89.9% of all units):
| Cherrywood: | $802,374 |
| California: | $988,808 |
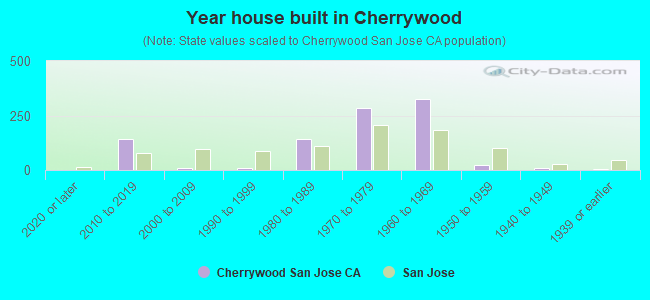
- Year house built in Cherrywood
- 02020 or later
- 22010 to 2019
- 1132000 to 2009
- 161990 to 1999
- 31980 to 1989
- 221970 to 1979
- 71960 to 1969
- 131950 to 1959
- 721940 to 1949
- 1161939 or earlier
City-data.com crime index for city in 2020 (higher means more crime):
| City: | 374.8 |
| U.S. average: | 219.5 |
Travel time to work (commute)
![Travel time to work (commute)]()
- 245 to 9 minutes
- 2310 to 14 minutes
- 2815 to 19 minutes
- 7220 to 24 minutes
- 2225 to 29 minutes
- 4730 to 34 minutes
- 2335 to 39 minutes
- 3040 to 44 minutes
- 6045 to 59 minutes
- 5460 to 89 minutes
- 990 or more minutes

Means of transportation to work
![Means of transportation to work]()
- 59.0%266Drove a car alone
- 10.4%47Carpooled
- 0.7%3Bus
- 6.7%30Subway or elevated rail
- 5.1%23Long-distance train or commuter rail
- 0.7%3Light rail, streetcar or trolley
- 0.7%3Motorcycle
- 0.7%3Walked
- 2.0%9Other means
- 18.2%82Worked at home

Time leaving home to go to work
![Time leaving home to go to work]()
- 2712:00 a.m. to 4:59 a.m.
- 255:00 a.m. to 5:29 a.m.
- 95:30 a.m. to 5:59 a.m.
- 266:00 a.m. to 6:29 a.m.
- 366:30 a.m. to 6:59 a.m.
- 507:00 a.m. to 7:29 a.m.
- 437:30 a.m. to 7:59 a.m.
- 318:00 a.m. to 8:29 a.m.
- 408:30 a.m. to 8:59 a.m.
- 429:00 a.m. to 9:59 a.m.
- 1310:00 a.m. to 10:59 a.m.
- 911:00 a.m. to 11:59 a.m.
- 2112:00 p.m. to 3:59 p.m.
- 234:00 p.m. to 11:59 p.m.

Occupations of males:
- Percentage of males in management occupations (except farmers):
Here: 19.3% city: 9.9%
- Percentage of males in business and financial operations occupations:
Here: 3.1% city: 4.3%
- Percentage of males in computer and mathematical occupations:
Here: 9.6% city: 6.7%
- Percentage of males in architecture and engineering occupations:
Here: 3.2% city: 3.6%
- Percentage of males in community and social services occupations:
Here: 3.2% city: 1.7%
- Percentage of males in legal occupations:
Here: 1.9% city: 0.7%
- Percentage of males in education, training, and library occupations:
Here: 1.6% city: 3.0%
- Percentage of males in arts, design, entertainment, sports, and media occupations:
Here: 1.3% city: 1.5%
- Percentage of males in healthcare practitioners and technical occupations:
Here: 12.8% city: 2.2%
- Percentage of males in service occupations:
Here: 11.2% city: 14.6%
- Percentage of males in sales and office occupations:
Here: 5.4% city: 14.8%
- Percentage of males in farming, fishing, and forestry occupations:
Here: 2.2% city: 0.5%
- Percentage of males in construction, extraction, and maintenance occupations:
Here: 6.9% city: 10.0%
- Percentage of males in production occupations:
Here: 7.9% city: 7.8%
- Percentage of males in transportation occupations:
Here: 3.4% city: 7.3%
- Percentage of males in material moving occupations:
Here: 4.7% city: 6.8%
Occupations of females:
- Percentage of females in management occupations (except farmers):
Here: 7.3% city: 9.2%
- Percentage of females in business and financial operations occupations:
Here: 8.9% city: 7.3%
- Percentage of females in computer and mathematical occupations:
Here: 2.7% city: 2.3%
- Percentage of females in architecture and engineering occupations:
Here: 1.4% city: 0.9%
- Percentage of females in community and social services occupations:
Here: 3.8% city: 1.8%
- Percentage of females in legal occupations:
Here: 1.6% city: 1.5%
- Percentage of females in education, training, and library occupations:
Here: 5.5% city: 6.9%
- Percentage of females in arts, design, entertainment, sports, and media occupations:
Here: 2.6% city: 2.2%
- Percentage of females in healthcare practitioners and technical occupations:
Here: 23.4% city: 6.5%
- Percentage of females in service occupations:
Here: 5.4% city: 23.3%
- Percentage of females in sales and office occupations:
Here: 34.3% city: 26.6%
- Percentage of females in production occupations:
Here: 1.9% city: 5.3%
- Percentage of females in transportation occupations:
Here: 1.2% city: 0.5%
- Percentage of females in material moving occupations:
Here: 6.5% city: 3.5%
Percentage of people 16-64 in Armed Forces:
| Cherrywood: | 0.3% |
| San Leandro: | 0.1% |
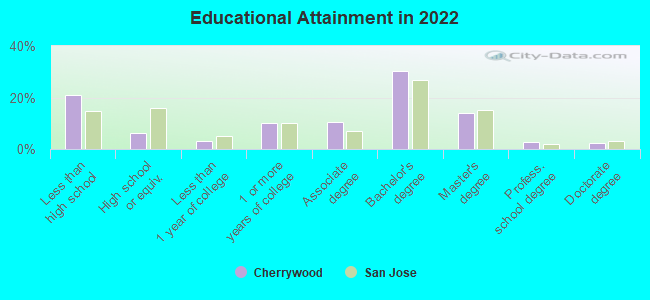
Education in this neighborhood (subdivision or community):
- Percentage of people 3 years and older in K-12 schools:
Cherrywood: 15.0% San Leandro: 14.4%
- Percentage of people 3 years and older in undergraduate colleges:
Cherrywood: 2.9% San Leandro: 5.5%
- Percentage of people 3 years and older in grad. or professional schools:
Cherrywood: 1.2% San Leandro: 1.6%
- Percentage of students K-12 enrolled in private schools:
Cherrywood: 40.6% San Leandro: 9.9%
Percentage of population below poverty level:
| Cherrywood: | 8.6% |
| San Leandro: | 7.4% |
Median year owner moved in (as recorded in 2022):
| Cherrywood: | 2009 |
| San Leandro: | 2006 |
Percentage of married-couple families with both working:
| Cherrywood: | 83.1% |
| San Leandro: | 62.2% |
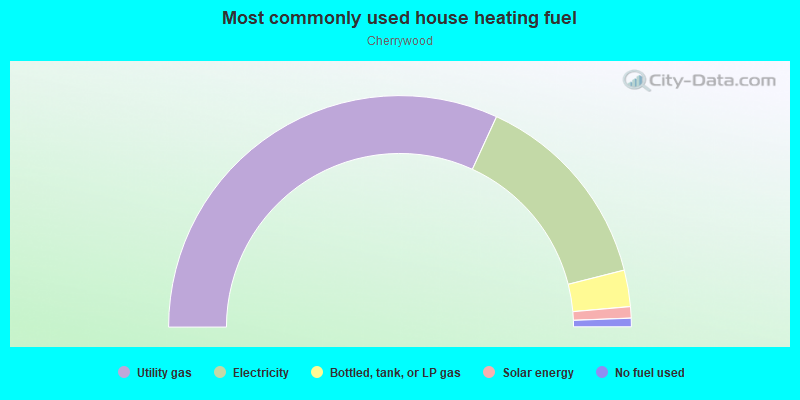
- 66.2%Utility gas
- 22.6%Electricity
- 4.3%No fuel used
- 3.2%Bottled, tank, or LP gas
- 2.4%Solar energy
- 1.3%Coal or coke
Roads and streets:
Peralta Ave
Length: 0.31 miles
Directions: E-W, SE-NW, SW-NE
Address range: 701 to 1099
Directions: E-W, SE-NW, SW-NE
Address range: 701 to 1099
Franklin Ln
Length: 0.11 miles
Direction: SE-NW
Direction: SE-NW
Railroad features:
Bay Area Rapid Transit RR
Length: 0.53 miles
Directions: E-W, SE-NW
Directions: E-W, SE-NW
Union Pacific RR
Length: 0.34 miles
Direction: SE-NW
Direction: SE-NW