Estimated zip code population in 2022: 17,594 Zip code population in 2010: 14,389 Zip code population in 2000: 11,700
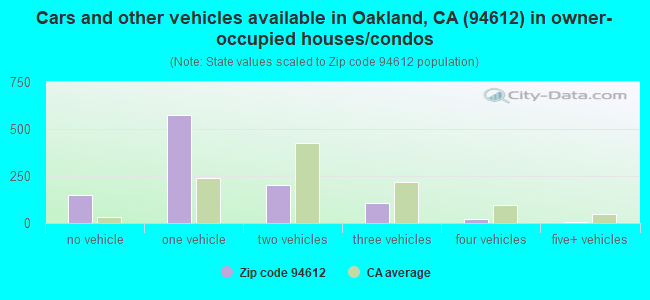
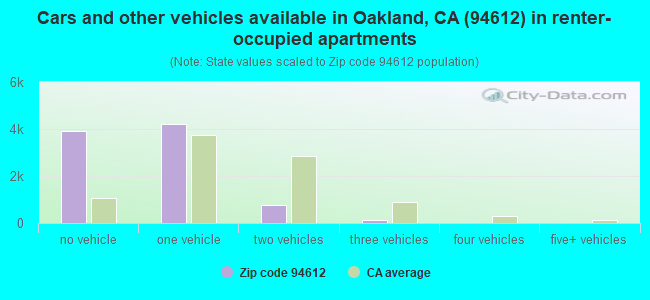
Houses and condos: 11,497 Renter-occupied apartments: 9,006
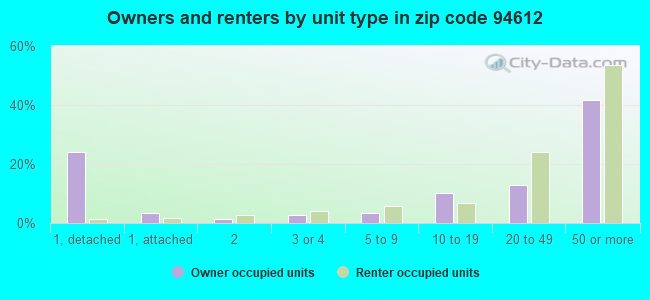
% of renters here:
90%
State:
44%
March 2022 cost of living index in zip code 94612: 122.4 (high, U.S. average is 100)
Land area: 0.9 sq. mi. Water area: 0.0 sq. mi.
Population density: 20,664 people per square mile
(very high).
OSM Map
General Map
Google Map
MSN Map
OSM Map
General Map
Google Map
MSN Map
OSM Map
General Map
Google Map
MSN Map
OSM Map
General Map
Google Map
MSN Map
Please wait while loading the map...
Real estate property taxes paid for housing units in 2022:
This zip code:
0.8% ($7,453)
California:
0.7% ($4,831)
Median real estate property taxes paid for housing units with mortgages in 2022: $7,920 (0.9%) Median real estate property taxes paid for housing units with no mortgage in 2022: $6,874 (0.7%)
Averages for the 2020 tax year for zip code 94612, filed in 2021:
Average Adjusted Gross Income (AGI) in 2020: $113,372 (Individual Income Tax Returns)
Here:
$113,372
State:
$95,910
Salary/wage: $97,115 (reported on 87.3% of returns)
Here:
$97,115
State:
$77,331
(% of AGI for various income ranges: 1292.5% for AGIs below $25k, 4348.9% for AGIs $25k-50k, 7895.1% for AGIs $50k-75k, 12065.7% for AGIs $75k-100k, 21216.7% for AGIs $100k-200k, 137010.4% for AGIs over 200k)
Taxable interest for individuals: $1,351 (reported on 29.7% of returns)
This zip code:
$1,351
California:
$2,294
(% of AGI for various income ranges: 10.4% for AGIs below $25k, 13.7% for AGIs $25k-50k, 24.7% for AGIs $50k-75k, 34.9% for AGIs $75k-100k, 72.6% for AGIs $100k-200k, 916.8% for AGIs over 200k)
Ordinary dividends: $5,155 (reported on 25.8% of returns)
Here:
$5,155
State:
$10,949
(% of AGI for various income ranges: 20.0% for AGIs below $25k, 22.9% for AGIs $25k-50k, 65.3% for AGIs $50k-75k, 146.0% for AGIs $75k-100k, 280.7% for AGIs $100k-200k, 3031.2% for AGIs over 200k)
Net capital gain/loss in AGI: +$22,307 (reported on 26.4% of returns)
Here:
+$22,307
State:
+$49,306
(% of AGI for various income ranges: 20.1% for AGIs below $25k, 40.5% for AGIs $25k-50k, 81.2% for AGIs $50k-75k, 159.6% for AGIs $75k-100k, 423.9% for AGIs $100k-200k, 20492.8% for AGIs over 200k)
Profit/loss from business: +$13,581 (reported on 17.4% of returns)
Here:
+$13,581
State:
+$15,671
(% of AGI for various income ranges: 131.0% for AGIs below $25k, 257.7% for AGIs $25k-50k, 213.3% for AGIs $50k-75k, 176.8% for AGIs $75k-100k, 381.9% for AGIs $100k-200k, 4070.8% for AGIs over 200k)
Taxable individual retirement arrangement distribution: $19,444 (reported on 4.1% of returns)
94612:
$19,444
California:
$23,505
(% of AGI for various income ranges: 18.1% for AGIs below $25k, 53.7% for AGIs $25k-50k, 54.9% for AGIs $50k-75k, 123.3% for AGIs $75k-100k, 240.8% for AGIs $100k-200k, 1014.8% for AGIs over 200k)
Self-employed (Keogh) retirement plans: $24,025 (reported on 0.8% of returns)
94612:
$24,025
California:
$30,163
(% of AGI for various income ranges: 44.7% for AGIs $100k-200k, 547.2% for AGIs over 200k)
Total itemized deductions: $32,614 (reported on 9.1% of returns)
Here:
$32,614
State:
$39,517
(% of AGI for various income ranges: 55.2% for AGIs below $25k, 104.1% for AGIs $25k-50k, 215.6% for AGIs $50k-75k, 447.5% for AGIs $75k-100k, 795.3% for AGIs $100k-200k, 4971.2% for AGIs over 200k)
Charity contributions: $9,538 (reported on 7.3% of returns)
Here:
$9,538
State:
$12,598
(% of AGI for various income ranges: 11.4% for AGIs $25k-50k, 27.7% for AGIs $50k-75k, 63.2% for AGIs $75k-100k, 158.2% for AGIs $100k-200k, 1676.4% for AGIs over 200k)
Taxes paid: $8,946 (reported on 9.0% of returns)
94612:
$8,946
State:
$8,807
(% of AGI for various income ranges: 5.9% for AGIs below $25k, 20.2% for AGIs $25k-50k, 45.1% for AGIs $50k-75k, 117.9% for AGIs $75k-100k, 257.4% for AGIs $100k-200k, 1304.4% for AGIs over 200k)
Earned income credit: $1,460 (reported on 10.1% of returns)
Here:
$1,460
State:
$2,074
(% of AGI for various income ranges: 67.8% for AGIs below $25k, 39.4% for AGIs $25k-50k)
Percentage of individuals using paid preparers for their 2020 taxes: 93.3%
Here:
93%
State:
92%
(% for various income ranges: 88.2% for AGIs below $25k, 92.5% for AGIs $25k-50k, 93.6% for AGIs $50k-75k, 95.5% for AGIs $75k-100k, 96.2% for AGIs $100k-200k, 97.1% for AGIs over 200k)
Averages for the 2012 tax year for zip code 94612, filed in 2013:
Average Adjusted Gross Income (AGI) in 2012: $54,857 (Individual Income Tax Returns)
Here:
$54,857
State:
$72,726
Salary/wage: $49,537 (reported on 86.2% of returns)
Here:
$49,537
State:
$59,079
(% of AGI for various income ranges: 76.9% for AGIs below $25k, 88.1% for AGIs $25k-50k, 88.5% for AGIs $50k-75k, 88.9% for AGIs $75k-100k, 81.4% for AGIs $100k-200k, 48.6% for AGIs over 200k)
Taxable interest for individuals: $1,482 (reported on 26.3% of returns)
This zip code:
$1,482
California:
$2,146
(% of AGI for various income ranges: 0.7% for AGIs below $25k, 0.5% for AGIs $25k-50k, 0.4% for AGIs $50k-75k, 0.7% for AGIs $75k-100k, 0.7% for AGIs $100k-200k, 1.2% for AGIs over 200k)
Ordinary dividends: $7,264 (reported on 15.0% of returns)
Here:
$7,264
State:
$9,308
(% of AGI for various income ranges: 1.2% for AGIs below $25k, 0.9% for AGIs $25k-50k, 1.3% for AGIs $50k-75k, 1.7% for AGIs $75k-100k, 1.9% for AGIs $100k-200k, 4.2% for AGIs over 200k)
Net capital gain/loss in AGI: +$9,746 (reported on 13.8% of returns)
Here:
+$9,746
State:
+$30,460
(% of AGI for various income ranges: 0.3% for AGIs $25k-50k, 0.4% for AGIs $50k-75k, 0.4% for AGIs $75k-100k, 1.5% for AGIs $100k-200k, 9.7% for AGIs over 200k)
Profit/loss from business: +$15,092 (reported on 17.9% of returns)
Here:
+$15,092
State:
+$17,064
(% of AGI for various income ranges: 12.3% for AGIs below $25k, 4.1% for AGIs $25k-50k, 1.8% for AGIs $50k-75k, 1.9% for AGIs $75k-100k, 4.2% for AGIs $100k-200k, 7.7% for AGIs over 200k)
Taxable individual retirement arrangement distribution: $18,370 (reported on 4.5% of returns)
94612:
$18,370
California:
$19,557
(% of AGI for various income ranges: 0.9% for AGIs below $25k, 0.9% for AGIs $25k-50k, 1.2% for AGIs $50k-75k, 1.2% for AGIs $75k-100k, 2.3% for AGIs $100k-200k, 1.6% for AGIs over 200k)
Self-employment retirement plans: $17,983 (reported on 0.8% of returns)
94612:
$17,983
California:
$24,530
Total itemized deductions: $25,714 (21% of AGI, reported on 24.9% of returns)
Here:
$25,714
State:
$34,004
Here:
21.2% of AGI
State:
22.7% of AGI
(% of AGI for various income ranges: 6.1% for AGIs below $25k, 5.3% for AGIs $25k-50k, 8.0% for AGIs $50k-75k, 12.5% for AGIs $75k-100k, 14.1% for AGIs $100k-200k, 19.4% for AGIs over 200k)
Charity contributions: $4,522 (reported on 18.0% of returns)
Here:
$4,522
State:
$4,659
(% of AGI for various income ranges: 0.5% for AGIs below $25k, 0.6% for AGIs $25k-50k, 1.0% for AGIs $50k-75k, 1.1% for AGIs $75k-100k, 1.7% for AGIs $100k-200k, 3.1% for AGIs over 200k)
Taxes paid: $11,349 (reported on 24.4% of returns)
94612:
$11,349
State:
$14,448
(% of AGI for various income ranges: 1.0% for AGIs below $25k, 1.2% for AGIs $25k-50k, 2.3% for AGIs $50k-75k, 5.5% for AGIs $75k-100k, 7.2% for AGIs $100k-200k, 9.6% for AGIs over 200k)
Earned income credit: $1,647 (reported on 17.8% of returns)
Here:
$1,647
State:
$2,286
(% of AGI for various income ranges: 5.1% for AGIs below $25k, 0.5% for AGIs $25k-50k)
Percentage of individuals using paid preparers for their 2012 taxes: 41.5%
Here:
41%
State:
64%
(% for various income ranges: 39.9% for AGIs below $25k, 40.5% for AGIs $25k-50k, 37.5% for AGIs $50k-75k, 37.9% for AGIs $75k-100k, 48.7% for AGIs $100k-200k, 78.9% for AGIs over 200k)
Averages for the 2004 tax year for zip code 94612, filed in 2005:
Average Adjusted Gross Income (AGI) in 2004: $54,506 (Individual Income Tax Returns)
Here:
$54,506
State:
$58,600
Salary/wage: $34,148 (reported on 84.1% of returns)
Here:
$34,148
State:
$49,455
(% of AGI for various income ranges: 149.6% for AGIs below $10k, 85.3% for AGIs $10k-25k, 89.2% for AGIs $25k-50k, 80.2% for AGIs $50k-75k, 78.2% for AGIs $75k-100k, 19.7% for AGIs over 100k)
Taxable interest for individuals: $3,076 (reported on 32.2% of returns)
This zip code:
$3,076
California:
$2,365
(% of AGI for various income ranges: 7.3% for AGIs below $10k, 1.3% for AGIs $10k-25k, 1.6% for AGIs $25k-50k, 2.0% for AGIs $50k-75k, 2.1% for AGIs $75k-100k, 1.8% for AGIs over 100k)
Taxable dividends: $8,164 (reported on 16.5% of returns)
Here:
$8,164
State:
$4,746
(% of AGI for various income ranges: 5.5% for AGIs below $10k, 1.3% for AGIs $10k-25k, 1.3% for AGIs $25k-50k, 2.4% for AGIs $50k-75k, 2.8% for AGIs $75k-100k, 3.0% for AGIs over 100k)
Net capital gain/loss: +$21,073 (reported on 14.8% of returns)
Here:
+$21,073
State:
+$23,418
(% of AGI for various income ranges: -1.7% for AGIs below $10k, -0.1% for AGIs $10k-25k, 0.2% for AGIs $25k-50k, 0.9% for AGIs $50k-75k, 2.2% for AGIs $75k-100k, 10.9% for AGIs over 100k)
Profit/loss from business: +$16,258 (reported on 13.8% of returns)
Here:
+$16,258
State:
+$16,826
(% of AGI for various income ranges: 5.9% for AGIs below $10k, 4.9% for AGIs $10k-25k, 3.2% for AGIs $25k-50k, 3.6% for AGIs $50k-75k, 2.7% for AGIs $75k-100k, 4.6% for AGIs over 100k)
IRA payment deduction: $2,650 (reported on 2.5% of returns)
94612:
$2,650
California:
$3,192
(% of AGI for various income ranges: 0.2% for AGIs $10k-25k, 0.3% for AGIs $25k-50k, 0.1% for AGIs $50k-75k, 0.2% for AGIs $75k-100k, 0.0% for AGIs over 100k)
Self-employed pension: $17,547 (reported on 1.1% of returns)
Here:
$17,547
California:
$17,688
(% of AGI for various income ranges: 0.2% for AGIs $10k-25k, 0.5% for AGIs $50k-75k, 0.5% for AGIs over 100k)
Total itemized deductions: $26,888 (20% of AGI, reported on 21.3% of returns)
Here:
$26,888
State:
$28,113
Here:
19.6% of AGI
State:
25.3% of AGI
(% of AGI for various income ranges: 17.7% for AGIs below $10k, 6.8% for AGIs $10k-25k, 7.3% for AGIs $25k-50k, 12.5% for AGIs $50k-75k, 19.3% for AGIs $75k-100k, 10.6% for AGIs over 100k)
Charity contributions deductions: $7,659 (5% of AGI, reported on 17.0% of returns)
Here:
$7,659
State:
$3,923
Here:
4.9% of AGI
State:
3.3% of AGI
(% of AGI for various income ranges: 0.3% for AGIs below $10k, 0.6% for AGIs $10k-25k, 0.8% for AGIs $25k-50k, 1.7% for AGIs $50k-75k, 2.3% for AGIs $75k-100k, 3.6% for AGIs over 100k)
Total tax: $8,089 (reported on 75.1% of returns)
94612:
$8,089
State:
$10,761
(% of AGI for various income ranges: 5.3% for AGIs below $10k, 4.6% for AGIs $10k-25k, 8.6% for AGIs $25k-50k, 12.6% for AGIs $50k-75k, 14.0% for AGIs $75k-100k, 12.7% for AGIs over 100k)
Earned income credit: $1,399 (reported on 17.4% of returns)
Here:
$1,399
State:
$1,763
Percentage of individuals using paid preparers for their 2004 taxes: 54.3%
Here:
54%
State:
66%
(% for various income ranges: 54.3% for AGIs below $10k, 54.2% for AGIs $10k-25k, 52.3% for AGIs $25k-50k, 51.5% for AGIs $50k-75k, 55.5% for AGIs $75k-100k, 70.8% for AGIs over 100k)
Likely homosexual households (counted as self-reported same-sex unmarried-partner households)
Lesbian couples: 0.5% of all households
Gay men: 0.8% of all households
Household received Food Stamps/SNAP in the past 12 months: 2,068 Household did not receive Food Stamps/SNAP in the past 12 months: 8,179
Women who had a birth in the past 12 months: 204 (126 now married, 78 unmarried) Women who did not have a birth in the past 12 months: 4,640 (1,178 now married, 3,490 unmarried)
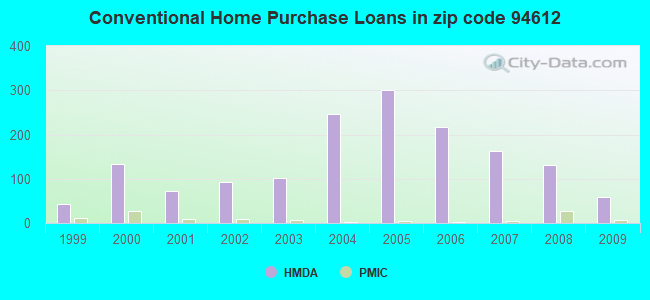
Housing units in zip code 94612 with a mortgage: 706 (48 second mortgage, 48 both second mortgage and home equity loan) Houses without a mortgage: 20
Median monthly owner costs for units with a mortgage: $3,335 Median monthly owner costs for units without a mortgage: $1,240
Residents with income below the poverty level in 2022:
This zip code:
20.4%
Whole state:
12.2%
Residents with income below 50% of the poverty level in 2022:
This zip code:
9.2%
Whole state:
6.2%
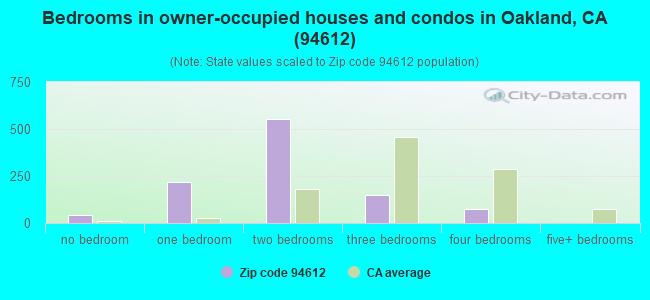
Median number of rooms in houses and condos:
Here:
4.2
State:
6.0
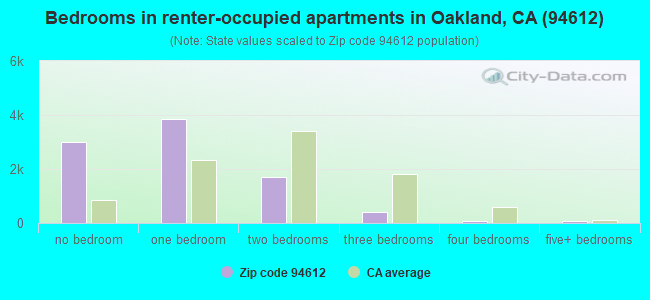
Median number of rooms in apartments:
Here:
2.4
State:
3.9
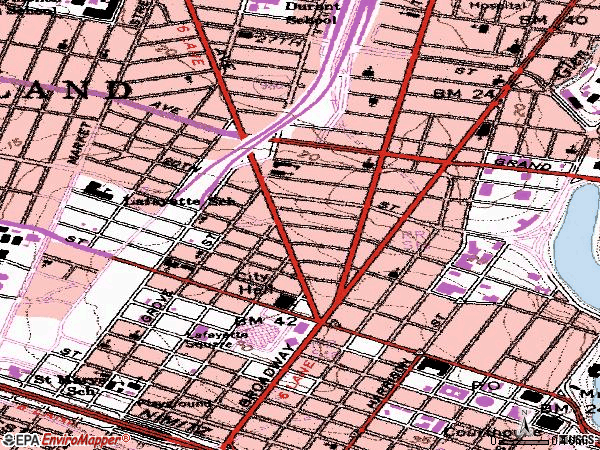
Notable locations in this zip code not listed on our city pages
Notable locations in zip code 94612: Alameda County Administration Building (A), Alice Arts Center (B), Cityline Branch Oakland Public Library (C), Oakland Public Library (D), Oakland City Hall (E), Camron-Stanford House Museum (F), Alameda County Courthouse (G), Oakland Fire Department Station 15 (H), Oakland Fire Prevention Bureau (I), Oakland Fire Department Station 1 (J), Paramount Theatre (K), Wenote Hall (L), Latham Square Building (M), Wakefield Building (N), Tapscott Building (O), Madison Street Masonic Temple (P), Jules Building (Q), Howden Building (R), Franklin Building (S). Display/hide their locations on the map
Churches in zip code 94612 include: Church of Christ (A), Corinthian Baptist Church (B), Saint Augustines Church (C), Seventh Church of Christ Scientist (D), First Baptist Church (E), First Unitarian Church (F), Friendship Missionary Baptist Church (G), Pilgrim Rest Baptist Church (H), Welsh Presbyterian Church (I). Display/hide their locations on the map
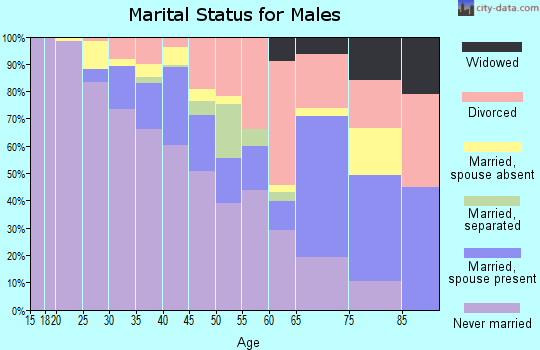
646 married couples with children.
637 single-parent households (196 men, 441 women).
64.0% of residents of 94612 zip code speak English at home.
5.6% of residents speak Spanish at home (66% very well, 9% well, 11% not well, 14% not at all).
7.0% of residents speak other Indo-European language at home (85% very well, 7% well, 9% not well).
19.9% of residents speak Asian or Pacific Island language at home (40% very well, 15% well, 22% not well, 23% not at all).
3.9% of residents speak other language at home (71% very well, 21% well, 8% not well).
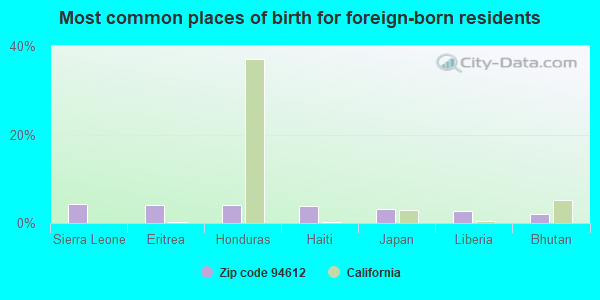
Foreign born population: 5,703 (32.4%) (56.8% of them are naturalized citizens)
Major facilities with environmental interests located in this zip code:
KAISER CENTER INC (300 LAKESIDE DRIVE in OAKLAND, CA)
COMPLIANCE ACTIVITY (Tracking inspections of insecticide, fungicide, and rodenticide, and toxic substances) CRITERIA AND HAZARDOUS AIR POLLUTANT INVENTORY (Inventory of air pollution sources) (Resource Conservation and Recovery Act (tracking hazardous waste)) Business SIC classification: OPERATORS OF NONRESIDENTIAL BUILDINGS; GENERAL MEDICAL AND SURGICAL HOSPITALS Alternative names: ASEA KAISER (US) INC, HARSHAW/FILTROL, KAISER ALUMINUM & CHEMICAL CORP, KAISER EXPORT COMPANY, UNIVERSITY OF CALIFORNIA
KAISER FNDN HLTH PLAN OFC BLDG (1950 FRANKLIN ST in OAKLAND, CA)
STATE MASTER (California - Hazardous Waste Tracking) - HAZARDOU WASTE PROGRAM Small Quantity Generators, between 100 kg and 1000 kg of hazardous waste/month (Resource Conservation and Recovery Act (tracking hazardous waste)) - notification Business NAICS classification: OFFICES OF PHYSICIANS, MENTAL HEALTH SPECIALISTS. Alternative names: KAISER PERMANENTE
JOHNSON PLATING WORKS INCORPORATED (2526 TELEGRAPH AVE in OAKLAND, CA)
STATE MASTER (California - Hazardous Waste Tracking) - HAZARDOU WASTE PROGRAM Small Quantity Generators, between 100 kg and 1000 kg of hazardous waste/month (Resource Conservation and Recovery Act (tracking hazardous waste)) Business NAICS classification: ELECTROPLATING, PLATING, POLISHING, ANODIZING, AND COLORING. Alternative names: JOHNSON PLATING PLAT
CHEVRON STATION NO 94800 (1700 CASTRO ST in OAKLAND, CA)
STATE MASTER (California - Hazardous Waste Tracking) - HAZARDOU WASTE PROGRAM Small Quantity Generators, between 100 kg and 1000 kg of hazardous waste/month (Resource Conservation and Recovery Act (tracking hazardous waste)) - notification Organizations: CHEVRON PRODUCTS CO (CONTACT/OWNER)
B P S OAKLAND (1700 JEFFERSON in OAKLAND, CA)
STATE MASTER (California - Hazardous Waste Tracking) - HAZARDOU WASTE PROGRAM Small Quantity Generators, between 100 kg and 1000 kg of hazardous waste/month (Resource Conservation and Recovery Act (tracking hazardous waste)) - notification Organizations: BLUE PRINT SVC INC (CONTACT/OWNER)
CALTRANS DIST 4 (111 GRAND AVE in OAKLAND, CA)
STATE MASTER (California - Hazardous Waste Tracking) - HAZARDOU WASTE PROGRAM Small Quantity Generators, between 100 kg and 1000 kg of hazardous waste/month (Resource Conservation and Recovery Act (tracking hazardous waste)) - notification Alternative names: CALTRANS DISTRICT 4
CENTRAL COAST VIRTUAL CHARTER SCHOOL, INC. (1333 BROADWAY SUITE 235 in OAKLAND, CA)
(National Center for Education Statistics) - STATE ID-6120976 Organizations: SAN LORENZO VALLEY UNIFIED (SCHOOL DISTRICT)
CALIFORNIA VIRTUAL ACADEMY @ JAMESTOWN (1333 BROADWAY SUITE 235 in OAKLAND, CA)
(National Center for Education Statistics) - STATE ID-0100099 Organizations: JAMESTOWN ELEMENTARY (SCHOOL DISTRICT)
CALIFORNIA VIRTUAL ACADEMY @ KERN (1333 BROADWAY SUITE 235 in OAKLAND, CA)
(National Center for Education Statistics) - STATE ID-6121024 Organizations: MARICOPA UNIFIED (SCHOOL DISTRICT)
CALIFORNIA VIRTUAL ACADEMY @ SAN DIEGO (1333 BROADWAY SUITE 235 in OAKLAND, CA)
(National Center for Education Statistics) - STATE ID-6120893 Organizations: SPENCER VALLEY ELEMENTARY (SCHOOL DISTRICT)
NEXTEL 4 (475 14TH STREET in OAKLAND, CA)
(Integrated Compliance Information System) - ICIS-HQ-2002-6001, FORMAL ENFORCEMENT ACTION
FOREIGN BODY SHOP (2350 WEBSTER ST in OAKLAND, CA)
CRITERIA AND HAZARDOUS AIR POLLUTANT INVENTORY (Inventory of air pollution sources) Small Quantity Generators, between 100 kg and 1000 kg of hazardous waste/month (Resource Conservation and Recovery Act (tracking hazardous waste)) - notification Business SIC classification: TOP, BODY, AND UPHOLSTERY REPAIR SHOPS AND PAINT SHOPS Business NAICS classification: AUTOMOTIVE BODY, PAINT, AND INTERIOR REPAIR AND MAINTENANCE. Organizations: JOE DIMARCO (CONTACT/OWNER)
GESTETNER CORP (300 27TH ST in OAKLAND, CA)
Small Quantity Generators, between 100 kg and 1000 kg of hazardous waste/month (Resource Conservation and Recovery Act (tracking hazardous waste)) - notification Organizations: THE CONFERENCE (CONTACT/OWNER)
Housing units lacking complete plumbing facilities: 3.5% Housing units lacking complete kitchen facilities: 5.8%
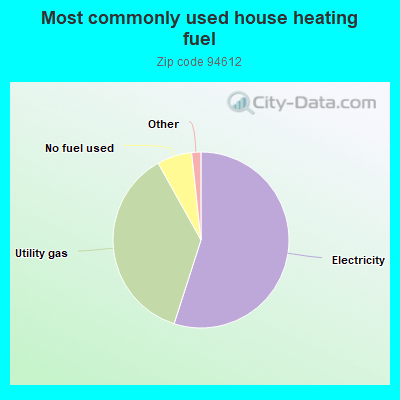
55.0%Electricity
37.0%Utility gas
6.4%No fuel used
0.9%Bottled, tank, or LP gas
0.6%Other fuel
Population in 1990: 10,763. Population change in the 1990s: +937 (+8.7%).
Place of birth for U.S.-born residents:
This state: 7,101
Northeast: 1,207
Midwest: 1,140
South: 1,425
West: 724
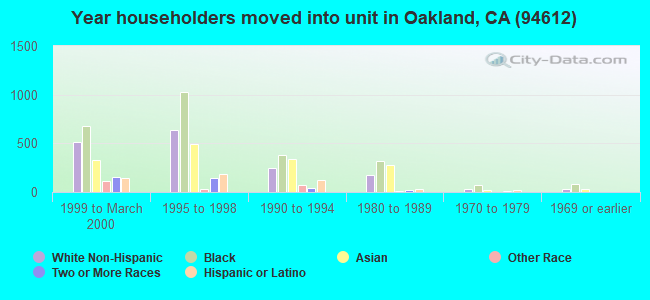
43% of the 94612 zip code residents lived in the same house 5 years ago. Out of people who lived in different houses, 56% lived in this county. Out of people who lived in different counties, 50% lived in California.
73% of the 94612 zip code residents lived in the same house 1 year ago. Out of people who lived in different houses, 36% moved from this county. Out of people who lived in different houses, 44% moved from different county within same state. Out of people who lived in different houses, 16% moved from different state. Out of people who lived in different houses, 1% moved from abroad.
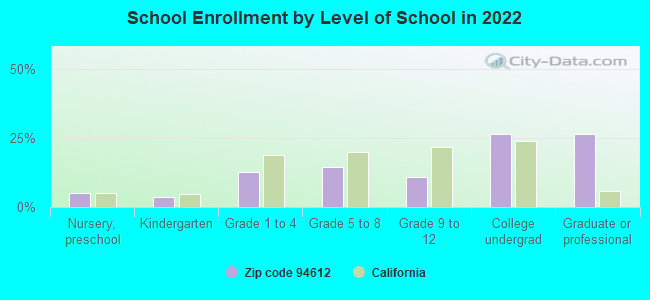
Private vs. public school enrollment:
Students in private schools in grades 1 to 8 (elementary and middle school): 30
Here:
4.1%
California:
10.5%
Students in private schools in grades 9 to 12 (high school): 36
Here:
12.0%
California:
8.5%
Students in private undergraduate colleges: 77
Here:
10.5%
California:
15.9%
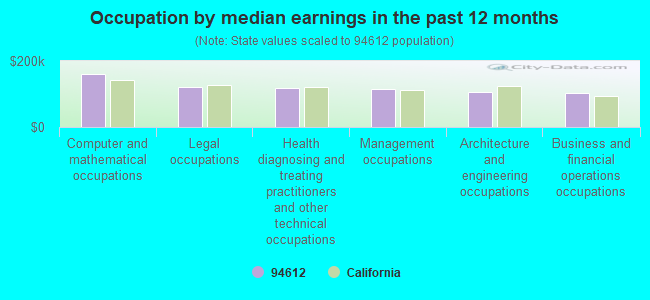
Occupation by median earnings in the past 12 months ($)
160,301Computer and mathematical occupations
119,862Legal occupations
118,624Health diagnosing and treating practitioners and other technical occupations
115,897Management occupations
106,119Architecture and engineering occupations
102,630Business and financial operations occupations
Companies with biggest federal contracts located in this zip code (OAKLAND, CA):
THE CLOROX COMPANY (1221 BROADWAY FL 13) : $105,202,686 in 71 contractsfrom 1999 to 2005
Contracts for Food Items For Resale, Non-Food Items For Resale, Cleaning and Polishing Compounds and Preparations by Defense Commissary Agency, Department of Defense, Federal Supply Service Signed by year:2000: $3,644,364; 2001: $7,977,028; 2002: $12,017,254; 2003: $5,785,969; 2004: $35,158,765; 2005: $38,212,953; 2006: $0.
Biggest contracts:
$16,397,344 with Defense Commissary Agency for Food Items For Resale. Signed on 2005-04-01. Completion date: 2005-08-31.
$13,896,415, same as above.Signed on 2004-10-01. Completion date: 2005-02-28.
$13,896,415, same as above.Signed on 2004-10-01. Completion date: 2005-02-28.
$9,813,067 with Defense Commissary Agency for Non-Food Items For Resale. Signed on 2005-10-01. Completion date: 2005-12-31.
MARINE TERMINALS CORPORATION H (1999 HARRISON STREET, SUIT) : $34,828,743 in 141 contractsfrom 1999 to 2006
Contracts for Stevedoring, Other Cargo and Freight Services, Vessel Freight, Defense Missile and Space Systems -- Advanced Development (R&D), and moreby Army, Navy Signed by year:2000: $4,383,320; 2001: $3,998,552; 2002: $136,218; 2003: $7,353,638; 2004: $9,155,308; 2005: $4,851,861; 2006: $1,291,330.
Biggest contracts:
$4,000,000 with Army for Stevedoring. Signed on 2005-08-05. Completion date: 2006-08-06.
$3,000,000, same as above.Signed on 1999-12-14. Completion date: 2000-12-15.
$2,344,513 with Army for Other Cargo and Freight Services. Signed on 2001-05-16. Completion date: 2001-12-12.
$2,178,969, same as above.Signed on 2000-12-28. Completion date: 2001-01-31.
KINGSFORD PRODUCTS COMPANY, TH (1221 BROADWAY) : $10,560,655 in 33 contractsfrom 1999 to 2005
Contracts for Food Items For Resale, Non-Food Items For Resale by Defense Commissary Agency, Department of Defense Signed by year:2000: $1,193,455; 2001: $1,172,099; 2002: $0; 2003: $0; 2004: $2,313,552; 2005: $5,762,126; 2006: $0.
Biggest contracts:
$2,200,235 with Defense Commissary Agency for Food Items For Resale. Signed on 2005-04-01. Completion date: 2005-08-31.
$1,579,636, same as above.Signed on 2005-04-01. Completion date: 2005-08-31.
$806,124 with Department of Defense for Food Items For Resale. Signed on 2001-01-01. Completion date: 2001-02-28.
$550,390 with Defense Commissary Agency for Food Items For Resale. Signed on 2005-01-01. Completion date: 2005-03-31.
TRANSYSTEMS CORPORATION (180 GRAND AVENUE) : $4,012,227 in 53 contractsfrom 2002 to 2006
Contracts for Architect - Engineer Services (including landscaping, interior layout, and designing), Other Architect and Engineering Services, Airfield, Communication and Missile Facilities, Other Buildings by Navy, Army, U.S. Army Corps of Engineers - civil program financing only, Air Force, and others Signed by year:2000: $0; 2001: $0; 2002: $103,680; 2003: $237,125; 2004: $1,224,865; 2005: $1,735,872; 2006: $710,685.
Biggest contracts:
$549,031 with Navy for Architect - Engineer Services (including landscaping, interior layout, and designing). Signed on 2006-02-23. Completion date: 2006-06-01.
$333,256, same as above.Signed on 2005-08-16. Completion date: 2006-04-22.
$299,934 with Army for Architect - Engineer Services (including landscaping, interior layout, and designing). Signed on 2004-07-23. Completion date: 2005-01-19.
$299,934 with U.S. Army Corps of Engineers - civil program financing only for Architect - Engineer Services (including landscaping, interior layout, and designing). Signed on 2004-07-23. Completion date: 2005-01-19.
OAKLAND CONSULTING GROUP INC (1611 TELEGRAPH AVE STE 111; small business) : $3,573,669 in 8 contractsfrom 2004 to 2006
Contracts for Other ADP and Telecommunications Services (includes data storage on tapes, compact disks, etc.), Computer Aided Design/Computer Aided Manufacturing (CAD/CAM) Services, Automated Information System Design and Integration Services, ADP Systems Development Services by Navy, Defense Logistics Agency, Department of Veterans Affairs Signed by year:2000: $0; 2001: $0; 2002: $0; 2003: $0; 2004: $720,952; 2005: $1,791,109; 2006: $1,061,608.
Biggest contracts:
$1,213,781 with Navy for Other ADP and Telecommunications Services (includes data storage on tapes, compact disks, etc.). Signed on 2005-09-30. Completion date: 2006-09-30.
$843,464 with Defense Logistics Agency for Computer Aided Design/Computer Aided Manufacturing (CAD/CAM) Services. Taking place in OH. Signed on 2006-04-27. Completion date: 2006-10-30.
$720,952 with Department of Veterans Affairs for Automated Information System Design and Integration Services. Signed on 2004-10-01. Completion date: 2005-03-31.
$328,326 with Navy for Other ADP and Telecommunications Services (includes data storage on tapes, compact disks, etc.). Signed on 2005-12-01. Completion date: 2006-09-30.
GAIA CONSULTING, INC (2101 WEBSTER STREET, 12TH; small business) : $2,686,140 in 30 contractsfrom 2001 to 2006
Contracts for Other Architect and Engineering Services, Environmental Studies and Assessments, Other Administrative Support Services by U.S. Army Corps of Engineers - civil program financing only, Army Signed by year:2000: $0; 2001: $343,923; 2002: $124,604; 2003: $1,179,551; 2004: $427,127; 2005: $518,916; 2006: $92,019.
Biggest contracts:
$613,235 with U.S. Army Corps of Engineers - civil program financing only for Other Architect and Engineering Services. Signed on 2003-06-10. Completion date: 2003-04-11.
$343,923 with U.S. Army Corps of Engineers - civil program financing only for Environmental Studies and Assessments. Signed on 2001-05-04. Completion date: 2001-09-20.
$275,642 with U.S. Army Corps of Engineers - civil program financing only for Other Architect and Engineering Services. Signed on 2003-03-19. Completion date: 2004-02-03.
$258,240, same as above.Signed on 2003-09-30. Completion date: 2003-03-17.
DEAN RYAN CONSULTANTS & DESIGN (1970 BROADWAY, SUITE 310) : $1,633,221 in 28 contractsfrom 2001 to 2005
Contracts for Other Environmental Services, Studies, and Analytical Support, Endangered Species Studies - Plant and Animal, Environmental Studies and Assessments, Other Professional Services by U.S. Army Corps of Engineers - civil program financing only, Army Signed by year:2000: $0; 2001: $28,002; 2002: $639,778; 2003: $719,442; 2004: $262,626; 2005: -$16,627; 2006: $0.
Biggest contracts:
$219,976 with U.S. Army Corps of Engineers - civil program financing only for Other Environmental Services, Studies, and Analytical Support. Signed on 2002-11-04. Completion date: 2003-03-14.
$217,406, same as above.Signed on 2002-05-09. Completion date: 2003-03-14.
$87,700, same as above.Signed on 2003-10-09. Completion date: 2004-08-06.
$87,700 with Army for Other Environmental Services, Studies, and Analytical Support. Signed on 2003-10-09. Completion date: 2004-08-06.
US DEPT OF ENERGY (1301 CLAY STREET SUITE 700N) : $1,610,903 in 22 contractsfrom 1999 to 2005
Contracts for Other Defense -- Basic Research (R&D), Aeronautics and Space Technology -- Basic Research (R&D), Other Research and Development -- Applied Research and Exploratory Development (R&D), Marine and Oceanographic -- Applied Research and Exploratory Development (R&D), and moreby Navy, NASA Signed by year:2000: $398,292; 2001: $118,000; 2002: $15,000; 2003: $66,400; 2004: $110,998; 2005: $545,740; 2006: $0.
Biggest contracts:
$251,069 with Navy for Other Defense -- Basic Research (R&D). Signed on 2000-02-09. Completion date: 2001-12-31.
$219,740 with NASA for Aeronautics and Space Technology -- Basic Research (R&D). Signed on 2005-02-17. Completion date: 2006-12-17.
$166,000 with NASA for Other Research and Development -- Applied Research and Exploratory Development (R&D). Signed on 2005-06-13. Completion date: 2006-04-30.
$142,996 with Navy for Other Defense -- Basic Research (R&D). Signed on 1999-10-14. Completion date: 2000-10-30.
MANUEL C FERNANDEZ AND ASSOC/S (1322 WEBSTER STREET; small business) : $1,412,859 in 64 contractsfrom 1999 to 2004
Contracts for Administrative and Service Buildings, Architect - Engineer Services (including landscaping, interior layout, and designing) by Navy Signed by year:2000: $424,585; 2001: $693,467; 2002: $241,527; 2003: -$5,110; 2004: -$5,162; 2005: $0; 2006: $0.
Biggest contracts:
$325,334 with Navy for Administrative and Service Buildings. Signed on 2001-12-10. Completion date: 2002-04-30.
$182,749, same as above.Signed on 2001-05-31. Completion date: 2001-09-15.
$131,353, same as above.Signed on 2000-04-05. Completion date: 2000-07-21.
$117,971, same as above.Signed on 2001-09-17. Completion date: 2000-07-21.
BEAR RIVER ASSOCIATES INC (2201 BROADWAY, SUITE 315; small business) : $1,078,953 in 3 contractsfrom 2003 to 2005
$631,260 with Army for ADP Systems Development Services. Taking place in VA. Signed on 2004-06-22. Completion date: 2003-08-21.
$354,778, same as above.Signed on 2003-09-04. Completion date: 2003-08-21.
$92,915 with Department of Defense for Office Information System Equipment. Signed on 2005-09-30. Completion date: 2006-09-29.
Top industries in this zip code by the number of employees in 2005:
2005 - 2018 National Fire Incident Reporting System (NFIRS) incidents
According to the data from the years 2005 - 2018 the average number of fire incidents per year is 102. The highest number of reported fire incidents - 353 took place in 2018, and the least - 0 in 2010. The data has an increasing trend.
When looking into fire subcategories, the most reports belonged to: Outside Fires (54.0%), and Structure Fires (30.1%).
Fire incident types reported to NFIRS in Zip Code 94612


 Nearest zip codes: 94609, 94610, 94606, 94607, 94608, 94501.


 According to the data from the years 2005 - 2018 the average number of fire incidents per year is 102. The highest number of reported fire incidents - 353 took place in 2018, and the least - 0 in 2010. The data has an increasing trend.
 When looking into fire subcategories, the most reports belonged to: Outside Fires (54.0%), and Structure Fires (30.1%).