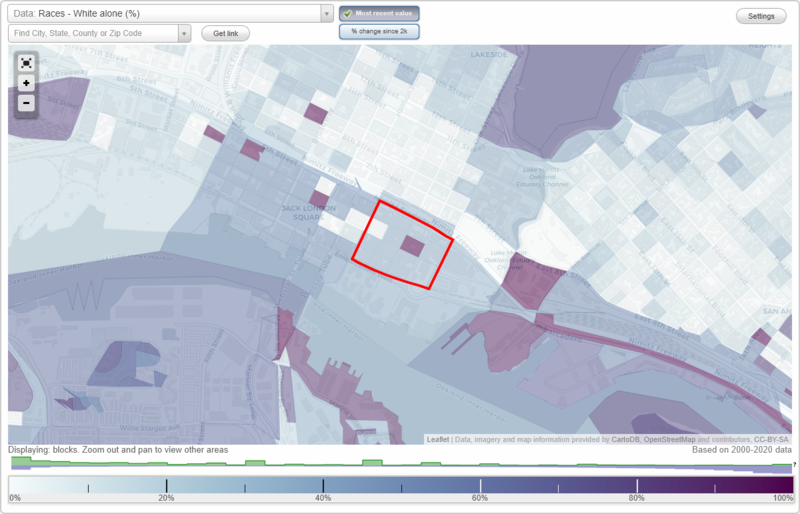
Loft District neighborhood in Oakland, California (CA), 94607 detailed profile
Settings
X

Business Search - 14 Million verified businesses
Area: 0.063 square miles
Population: 366
Population density:
Loft District: | 5,816 people per square mile |
Oakland: | 7,725 people per square mile |
- 14939.8%White
- 13135.0%Asian
- 338.8%Two or more races
- 267.0%Hispanic or Latino
- 256.7%Black
- 102.7%American Indian
Median household income in 2019:
Loft District: | $145,429 |
Oakland: | $82,018 |
Distribution of median household income
- 10Less than $10,000
- 15$10,000 to $19,999
- 13$20,000 to $29,999
- 16$30,000 to $39,999
- 3$40,000 to $49,999
- 14$50,000 to $59,999
- 5$60,000 to $74,999
- 36$75,000 to $99,999
- 13$100,000 to $124,999
- 31$125,000 to $149,999
- 23$150,000 to $199,999
- 65$200,000 or more
Distribution of owner-occupied house/condo value
- 3Less than $50,000
- 5$100,000 to $149,999
- 2$200,000 to $249,999
- 6$250,000 to $299,999
- 13$300,000 to $399,999
- 5$400,000 to $499,999
- 51$500,000 to $749,999
- 16$750,000 to $999,999
Distribution of rent paid by renters
- 14$200 to $299
- 4$500 to $599
- 10$600 to $699
- 12$700 to $799
- 5$800 to $899
- 10$1,000 to $1,249
- 3$1,250 to $1,499
- 12$1,500 to $1,999
- 87$2,000 or more
Median rent in 2019:
Loft District: | $2,726 |
Oakland: | $1,499 |
Males: | 172 |
Females: | 193 |
Males:
This neighborhood: | 34.3 years |
Whole city: | 36.6 years |
This neighborhood: | 35.5 years |
Whole city: | 37.1 years |
Average household size:
Loft District: | 1.7 people |
Oakland: | 2.5 people |
Percentage of family households:
Loft District: | 28.7% |
Oakland: | 39.5% |
Here: | 18.5% |
Oakland: | 36.3% |
Percentage of married-couple families with children (among all households):
Loft District: | 35.5% |
Oakland: | 27.1% |
Percentage of single-mother households (among all households):
Loft District: | 23.3% |
Oakland: | 9.5% |
Percentage of never married males 15 years old and over:
Percentage of never married females 15 years old and over:
Loft District: | 32.4% |
Oakland: | 21.7% |
Percentage of never married females 15 years old and over:
Loft District: | 36.8% |
city: | 23.0% |
Percentage of people that speak English not well or not at all:
Loft District: | 14.6% |
Oakland: | 6.0% |
Percentage of people born in this state:
Percentage of people born in another U.S. state:
Percentage of native residents but born outside the U.S.:
Percentage of foreign born residents:
Here: | 31.1% |
Oakland: | 53.0% |
Percentage of people born in another U.S. state:
Loft District: | 21.5% |
Oakland: | 20.6% |
Percentage of native residents but born outside the U.S.:
Here: | 0.8% |
city: | 1.3% |
Percentage of foreign born residents:
Here: | 46.6% |
Oakland: | 25.1% |
Owner-occupied
Renter-occupied
- Rooms in owner-occupied houses and condos in Loft District
- 91 room
- 122 rooms
- 333 rooms
- 234 rooms
- 145 rooms
- 46 rooms
- 07 rooms
- 08 rooms
- 09+ rooms
- Rooms in renter-occupied apartments in Loft District
- 71 room
- 502 rooms
- 473 rooms
- 24 rooms
- 45 rooms
- 46 rooms
- 77 rooms
- 08 rooms
- 59+ rooms
Owner-occupied
Renter-occupied
- Bedrooms in owner-occupied houses and condos in Loft District
- 9no bedroom
- 461 bedroom
- 362 bedrooms
- 43 bedrooms
- 04 bedrooms
- 05+ bedrooms
- Bedrooms in renter-occupied apartments in Loft District
- 11no bedroom
- 791 bedroom
- 212 bedrooms
- 43 bedrooms
- 34 bedrooms
- 15+ bedrooms
Average number of cars or other vehicles available in houses/condos:
Average number of cars or other vehicles available in apartments:
This neighborhood: | 1.1 |
Oakland: | 1.9 |
Average number of cars or other vehicles available in apartments:
Here: | 1.1 |
city: | 1.2 |
Percentage of units with a mortgage:
Loft District: | 87.9% |
Oakland: | 72.8% |
- Year house built in Loft District
- 72014 or later
- 22010 to 2013
- 1482000 to 2009
- 201990 to 1999
- 231980 to 1989
- 341970 to 1979
- 91960 to 1969
- 61950 to 1959
- 71940 to 1949
- 171939 or earlier
City-data.com crime index for city in 2019 (higher means more crime):
City: | 725.2 |
U.S. average: | 211.9 |
Travel time to work (commute)
- 85 to 9 minutes
- 1910 to 14 minutes
- 2815 to 19 minutes
- 2320 to 24 minutes
- 1725 to 29 minutes
- 3230 to 34 minutes
- 1135 to 39 minutes
- 2440 to 44 minutes
- 5345 to 59 minutes
- 1760 to 89 minutes
- 190 or more minutes
Means of transportation to work
- 32.1%90Drove a car alone
- 1.4%4Carpooled
- 3.2%9Bus
- 41.0%115Subway or elevated rail
- 0.7%2Long-distance train or commuter rail
- 0.4%1Light rail, streetcar or trolley
- 6.1%17Ferryboat
- 0.7%2Motorcycle
- 1.4%4Bicycle
- 5.0%14Walked
- 1.8%5Other means
- 4.3%12Worked at home
Time leaving home to go to work
- 312:00 a.m. to 4:59 a.m.
- 65:00 a.m. to 5:29 a.m.
- 15:30 a.m. to 5:59 a.m.
- 66:00 a.m. to 6:29 a.m.
- 156:30 a.m. to 6:59 a.m.
- 157:00 a.m. to 7:29 a.m.
- 347:30 a.m. to 7:59 a.m.
- 368:00 a.m. to 8:29 a.m.
- 268:30 a.m. to 8:59 a.m.
- 499:00 a.m. to 9:59 a.m.
- 510:00 a.m. to 10:59 a.m.
- 611:00 a.m. to 11:59 a.m.
- 212:00 p.m. to 3:59 p.m.
- 164:00 p.m. to 11:59 p.m.
Occupations of males:
- Percentage of males in management occupations (except farmers):
Here: 35.4% city: 11.4%
- Percentage of males in business and financial operations occupations:
Here: 16.5% city: 5.8%
- Percentage of males in computer and mathematical occupations:
Here: 11.5% city: 6.9%
- Percentage of males in architecture and engineering occupations:
Here: 5.7% city: 2.5%
- Percentage of males in education, training, and library occupations:
Here: 3.0% city: 4.3%
- Percentage of males in arts, design, entertainment, sports, and media occupations:
Here: 11.8% city: 4.9%
- Percentage of males in service occupations:
Here: 4.9% city: 16.2%
- Percentage of males in sales and office occupations:
Here: 5.5% city: 13.1%
- Percentage of males in construction, extraction, and maintenance occupations:
Here: 1.8% city: 9.2%
- Percentage of males in production occupations:
Here: 3.7% city: 4.5%
Occupations of females:
- Percentage of females in management occupations (except farmers):
Here: 19.4% city: 12.1%
- Percentage of females in business and financial operations occupations:
Here: 17.7% city: 7.7%
- Percentage of females in computer and mathematical occupations:
Here: 10.0% city: 2.5%
- Percentage of females in architecture and engineering occupations:
Here: 4.2% city: 1.2%
- Percentage of females in life, physical, and social science occupations:
Here: 1.7% city: 2.0%
- Percentage of females in community and social services occupations:
Here: 6.5% city: 3.9%
- Percentage of females in legal occupations:
Here: 2.8% city: 2.4%
- Percentage of females in education, training, and library occupations:
Here: 3.2% city: 8.7%
- Percentage of females in arts, design, entertainment, sports, and media occupations:
Here: 2.7% city: 4.7%
- Percentage of females in healthcare practitioners and technical occupations:
Here: 7.9% city: 5.6%
- Percentage of females in service occupations:
Here: 7.6% city: 20.9%
- Percentage of females in sales and office occupations:
Here: 16.4% city: 21.3%
- Percentage of females in production occupations:
Here: 2.9% city: 3.1%
- Percentage of females in material moving occupations:
Here: 6.2% city: 1.9%
Education in this neighborhood (subdivision or community):
- Percentage of people 3 years and older in K-12 schools:
Loft District: 6.8% Oakland: 13.7%
- Percentage of people 3 years and older in undergraduate colleges:
Loft District: 6.6% Oakland: 5.8%
- Percentage of people 3 years and older in grad. or professional schools:
Loft District: 4.6% Oakland: 2.4%
- Percentage of students K-12 enrolled in private schools:
Loft District: 16.7% Oakland: 12.8%
Percentage of population below poverty level:
Loft District: | 26.7% |
Oakland: | 13.9% |
Median year owner moved in (as recorded in 2019):
Median year renter moved in (as recorded in 2019):
Loft District: | 2013 |
Oakland: | 2006 |
Median year renter moved in (as recorded in 2019):
Loft District: | 2016 |
Oakland: | 2015 |
Percentage of married-couple families with both working:
Loft District: | 83.5% |
Oakland: | 68.2% |
- 71.5%Electricity
- 18.8%Utility gas
- 3.6%No fuel used
- 3.1%Wood
- 1.8%Other fuel
- 1.2%Bottled, tank, or LP gas
Roads and streets:
4th St
Length: 0.26 miles
Direction: E-W
Address range: 50 to 199
Direction: E-W
Address range: 50 to 199
Jackson St
Length: 0.25 miles
Directions: SE-NW, SW-NE
Address range: 100 to 499
Directions: SE-NW, SW-NE
Address range: 100 to 499
5th St
Length: 0.21 miles
Directions: E-W, SE-NW
Address range: 100 to 199
Directions: E-W, SE-NW
Address range: 100 to 199
Madison St
Length: 0.21 miles
Direction: SW-NE
Address range: 100 to 499
Direction: SW-NE
Address range: 100 to 499
Oak St
Length: 0.21 miles
Direction: SW-NE
Address range: 111 to 499
Direction: SW-NE
Address range: 111 to 499
Fallon St
Length: 0.18 miles
Direction: SW-NE
Address range: 100 to 499
Direction: SW-NE
Address range: 100 to 499
2nd St
Length: 0.18 miles
Direction: E-W
Address range: 100 to 199
Direction: E-W
Address range: 100 to 199
Railroad features:
Union Pacific RR
Length: 0.53 miles
Direction: E-W
Direction: E-W