Emeryville, California Submit your own pictures of this city and show them to the world
OSM Map
General Map
Google Map
MSN Map
OSM Map
General Map
Google Map
MSN Map
OSM Map
General Map
Google Map
MSN Map
OSM Map
General Map
Google Map
MSN Map
Please wait while loading the map...
Population in 2022: 12,913 (100% urban, 0% rural). Population change since 2000: +87.6%Males: 6,381 Females: 6,532
March 2022 cost of living index in Emeryville: 125.3 (high, U.S. average is 100) Percentage of residents living in poverty in 2022: 12.2%for White Non-Hispanic residents , 11.7% for Black residents , 6.2% for Hispanic or Latino residents , 34.5% for Native Hawaiian and other Pacific Islander residents , 6.0% for other race residents , 10.4% for two or more races residents )
Profiles of local businesses
Business Search - 14 Million verified businesses
Data:
Median household income ($)
Median household income (% change since 2000)
Household income diversity
Ratio of average income to average house value (%)
Ratio of average income to average rent
Median household income ($) - White
Median household income ($) - Black or African American
Median household income ($) - Asian
Median household income ($) - Hispanic or Latino
Median household income ($) - American Indian and Alaska Native
Median household income ($) - Multirace
Median household income ($) - Other Race
Median household income for houses/condos with a mortgage ($)
Median household income for apartments without a mortgage ($)
Races - White alone (%)
Races - White alone (% change since 2000)
Races - Black alone (%)
Races - Black alone (% change since 2000)
Races - American Indian alone (%)
Races - American Indian alone (% change since 2000)
Races - Asian alone (%)
Races - Asian alone (% change since 2000)
Races - Hispanic (%)
Races - Hispanic (% change since 2000)
Races - Native Hawaiian and Other Pacific Islander alone (%)
Races - Native Hawaiian and Other Pacific Islander alone (% change since 2000)
Races - Two or more races (%)
Races - Two or more races (% change since 2000)
Races - Other race alone (%)
Races - Other race alone (% change since 2000)
Racial diversity
Unemployment (%)
Unemployment (% change since 2000)
Unemployment (%) - White
Unemployment (%) - Black or African American
Unemployment (%) - Asian
Unemployment (%) - Hispanic or Latino
Unemployment (%) - American Indian and Alaska Native
Unemployment (%) - Multirace
Unemployment (%) - Other Race
Population density (people per square mile)
Population - Males (%)
Population - Females (%)
Population - Males (%) - White
Population - Males (%) - Black or African American
Population - Males (%) - Asian
Population - Males (%) - Hispanic or Latino
Population - Males (%) - American Indian and Alaska Native
Population - Males (%) - Multirace
Population - Males (%) - Other Race
Population - Females (%) - White
Population - Females (%) - Black or African American
Population - Females (%) - Asian
Population - Females (%) - Hispanic or Latino
Population - Females (%) - American Indian and Alaska Native
Population - Females (%) - Multirace
Population - Females (%) - Other Race
Coronavirus confirmed cases (Apr 27, 2024)
Deaths caused by coronavirus (Apr 27, 2024)
Coronavirus confirmed cases (per 100k population) (Apr 27, 2024)
Deaths caused by coronavirus (per 100k population) (Apr 27, 2024)
Daily increase in number of cases (Apr 27, 2024)
Weekly increase in number of cases (Apr 27, 2024)
Cases doubled (in days) (Apr 27, 2024)
Hospitalized patients (Apr 18, 2022)
Negative test results (Apr 18, 2022)
Total test results (Apr 18, 2022)
COVID Vaccine doses distributed (per 100k population) (Sep 19, 2023)
COVID Vaccine doses administered (per 100k population) (Sep 19, 2023)
COVID Vaccine doses distributed (Sep 19, 2023)
COVID Vaccine doses administered (Sep 19, 2023)
Likely homosexual households (%)
Likely homosexual households (% change since 2000)
Likely homosexual households - Lesbian couples (%)
Likely homosexual households - Lesbian couples (% change since 2000)
Likely homosexual households - Gay men (%)
Likely homosexual households - Gay men (% change since 2000)
Cost of living index
Median gross rent ($)
Median contract rent ($)
Median monthly housing costs ($)
Median house or condo value ($)
Median house or condo value ($ change since 2000)
Mean house or condo value by units in structure - 1, detached ($)
Mean house or condo value by units in structure - 1, attached ($)
Mean house or condo value by units in structure - 2 ($)
Mean house or condo value by units in structure by units in structure - 3 or 4 ($)
Mean house or condo value by units in structure - 5 or more ($)
Mean house or condo value by units in structure - Boat, RV, van, etc. ($)
Mean house or condo value by units in structure - Mobile home ($)
Median house or condo value ($) - White
Median house or condo value ($) - Black or African American
Median house or condo value ($) - Asian
Median house or condo value ($) - Hispanic or Latino
Median house or condo value ($) - American Indian and Alaska Native
Median house or condo value ($) - Multirace
Median house or condo value ($) - Other Race
Median resident age
Resident age diversity
Median resident age - Males
Median resident age - Females
Median resident age - White
Median resident age - Black or African American
Median resident age - Asian
Median resident age - Hispanic or Latino
Median resident age - American Indian and Alaska Native
Median resident age - Multirace
Median resident age - Other Race
Median resident age - Males - White
Median resident age - Males - Black or African American
Median resident age - Males - Asian
Median resident age - Males - Hispanic or Latino
Median resident age - Males - American Indian and Alaska Native
Median resident age - Males - Multirace
Median resident age - Males - Other Race
Median resident age - Females - White
Median resident age - Females - Black or African American
Median resident age - Females - Asian
Median resident age - Females - Hispanic or Latino
Median resident age - Females - American Indian and Alaska Native
Median resident age - Females - Multirace
Median resident age - Females - Other Race
Commute - mean travel time to work (minutes)
Travel time to work - Less than 5 minutes (%)
Travel time to work - Less than 5 minutes (% change since 2000)
Travel time to work - 5 to 9 minutes (%)
Travel time to work - 5 to 9 minutes (% change since 2000)
Travel time to work - 10 to 19 minutes (%)
Travel time to work - 10 to 19 minutes (% change since 2000)
Travel time to work - 20 to 29 minutes (%)
Travel time to work - 20 to 29 minutes (% change since 2000)
Travel time to work - 30 to 39 minutes (%)
Travel time to work - 30 to 39 minutes (% change since 2000)
Travel time to work - 40 to 59 minutes (%)
Travel time to work - 40 to 59 minutes (% change since 2000)
Travel time to work - 60 to 89 minutes (%)
Travel time to work - 60 to 89 minutes (% change since 2000)
Travel time to work - 90 or more minutes (%)
Travel time to work - 90 or more minutes (% change since 2000)
Marital status - Never married (%)
Marital status - Now married (%)
Marital status - Separated (%)
Marital status - Widowed (%)
Marital status - Divorced (%)
Median family income ($)
Median family income (% change since 2000)
Median non-family income ($)
Median non-family income (% change since 2000)
Median per capita income ($)
Median per capita income (% change since 2000)
Median family income ($) - White
Median family income ($) - Black or African American
Median family income ($) - Asian
Median family income ($) - Hispanic or Latino
Median family income ($) - American Indian and Alaska Native
Median family income ($) - Multirace
Median family income ($) - Other Race
Median year house/condo built
Median year apartment built
Year house built - Built 2005 or later (%)
Year house built - Built 2000 to 2004 (%)
Year house built - Built 1990 to 1999 (%)
Year house built - Built 1980 to 1989 (%)
Year house built - Built 1970 to 1979 (%)
Year house built - Built 1960 to 1969 (%)
Year house built - Built 1950 to 1959 (%)
Year house built - Built 1940 to 1949 (%)
Year house built - Built 1939 or earlier (%)
Average household size
Household density (households per square mile)
Average household size - White
Average household size - Black or African American
Average household size - Asian
Average household size - Hispanic or Latino
Average household size - American Indian and Alaska Native
Average household size - Multirace
Average household size - Other Race
Occupied housing units (%)
Vacant housing units (%)
Owner occupied housing units (%)
Renter occupied housing units (%)
Vacancy status - For rent (%)
Vacancy status - For sale only (%)
Vacancy status - Rented or sold, not occupied (%)
Vacancy status - For seasonal, recreational, or occasional use (%)
Vacancy status - For migrant workers (%)
Vacancy status - Other vacant (%)
Residents with income below the poverty level (%)
Residents with income below 50% of the poverty level (%)
Children below poverty level (%)
Poor families by family type - Married-couple family (%)
Poor families by family type - Male, no wife present (%)
Poor families by family type - Female, no husband present (%)
Poverty status for native-born residents (%)
Poverty status for foreign-born residents (%)
Poverty among high school graduates not in families (%)
Poverty among people who did not graduate high school not in families (%)
Residents with income below the poverty level (%) - White
Residents with income below the poverty level (%) - Black or African American
Residents with income below the poverty level (%) - Asian
Residents with income below the poverty level (%) - Hispanic or Latino
Residents with income below the poverty level (%) - American Indian and Alaska Native
Residents with income below the poverty level (%) - Multirace
Residents with income below the poverty level (%) - Other Race
Air pollution - Air Quality Index (AQI)
Air pollution - CO
Air pollution - NO2
Air pollution - SO2
Air pollution - Ozone
Air pollution - PM10
Air pollution - PM25
Air pollution - Pb
Crime - Murders per 100,000 population
Crime - Rapes per 100,000 population
Crime - Robberies per 100,000 population
Crime - Assaults per 100,000 population
Crime - Burglaries per 100,000 population
Crime - Thefts per 100,000 population
Crime - Auto thefts per 100,000 population
Crime - Arson per 100,000 population
Crime - City-data.com crime index
Crime - Violent crime index
Crime - Property crime index
Crime - Murders per 100,000 population (5 year average)
Crime - Rapes per 100,000 population (5 year average)
Crime - Robberies per 100,000 population (5 year average)
Crime - Assaults per 100,000 population (5 year average)
Crime - Burglaries per 100,000 population (5 year average)
Crime - Thefts per 100,000 population (5 year average)
Crime - Auto thefts per 100,000 population (5 year average)
Crime - Arson per 100,000 population (5 year average)
Crime - City-data.com crime index (5 year average)
Crime - Violent crime index (5 year average)
Crime - Property crime index (5 year average)
1996 Presidential Elections Results (%) - Democratic Party (Clinton)
1996 Presidential Elections Results (%) - Republican Party (Dole)
1996 Presidential Elections Results (%) - Other
2000 Presidential Elections Results (%) - Democratic Party (Gore)
2000 Presidential Elections Results (%) - Republican Party (Bush)
2000 Presidential Elections Results (%) - Other
2004 Presidential Elections Results (%) - Democratic Party (Kerry)
2004 Presidential Elections Results (%) - Republican Party (Bush)
2004 Presidential Elections Results (%) - Other
2008 Presidential Elections Results (%) - Democratic Party (Obama)
2008 Presidential Elections Results (%) - Republican Party (McCain)
2008 Presidential Elections Results (%) - Other
2012 Presidential Elections Results (%) - Democratic Party (Obama)
2012 Presidential Elections Results (%) - Republican Party (Romney)
2012 Presidential Elections Results (%) - Other
2016 Presidential Elections Results (%) - Democratic Party (Clinton)
2016 Presidential Elections Results (%) - Republican Party (Trump)
2016 Presidential Elections Results (%) - Other
2020 Presidential Elections Results (%) - Democratic Party (Biden)
2020 Presidential Elections Results (%) - Republican Party (Trump)
2020 Presidential Elections Results (%) - Other
Ancestries Reported - Arab (%)
Ancestries Reported - Czech (%)
Ancestries Reported - Danish (%)
Ancestries Reported - Dutch (%)
Ancestries Reported - English (%)
Ancestries Reported - French (%)
Ancestries Reported - French Canadian (%)
Ancestries Reported - German (%)
Ancestries Reported - Greek (%)
Ancestries Reported - Hungarian (%)
Ancestries Reported - Irish (%)
Ancestries Reported - Italian (%)
Ancestries Reported - Lithuanian (%)
Ancestries Reported - Norwegian (%)
Ancestries Reported - Polish (%)
Ancestries Reported - Portuguese (%)
Ancestries Reported - Russian (%)
Ancestries Reported - Scotch-Irish (%)
Ancestries Reported - Scottish (%)
Ancestries Reported - Slovak (%)
Ancestries Reported - Subsaharan African (%)
Ancestries Reported - Swedish (%)
Ancestries Reported - Swiss (%)
Ancestries Reported - Ukrainian (%)
Ancestries Reported - United States (%)
Ancestries Reported - Welsh (%)
Ancestries Reported - West Indian (%)
Ancestries Reported - Other (%)
Educational Attainment - No schooling completed (%)
Educational Attainment - Less than high school (%)
Educational Attainment - High school or equivalent (%)
Educational Attainment - Less than 1 year of college (%)
Educational Attainment - 1 or more years of college (%)
Educational Attainment - Associate degree (%)
Educational Attainment - Bachelor's degree (%)
Educational Attainment - Master's degree (%)
Educational Attainment - Professional school degree (%)
Educational Attainment - Doctorate degree (%)
School Enrollment - Nursery, preschool (%)
School Enrollment - Kindergarten (%)
School Enrollment - Grade 1 to 4 (%)
School Enrollment - Grade 5 to 8 (%)
School Enrollment - Grade 9 to 12 (%)
School Enrollment - College undergrad (%)
School Enrollment - Graduate or professional (%)
School Enrollment - Not enrolled in school (%)
School enrollment - Public schools (%)
School enrollment - Private schools (%)
School enrollment - Not enrolled (%)
Median number of rooms in houses and condos
Median number of rooms in apartments
Housing units lacking complete plumbing facilities (%)
Housing units lacking complete kitchen facilities (%)
Density of houses
Urban houses (%)
Rural houses (%)
Households with people 60 years and over (%)
Households with people 65 years and over (%)
Households with people 75 years and over (%)
Households with one or more nonrelatives (%)
Households with no nonrelatives (%)
Population in households (%)
Family households (%)
Nonfamily households (%)
Population in families (%)
Family households with own children (%)
Median number of bedrooms in owner occupied houses
Mean number of bedrooms in owner occupied houses
Median number of bedrooms in renter occupied houses
Mean number of bedrooms in renter occupied houses
Median number of vehichles in owner occupied houses
Mean number of vehichles in owner occupied houses
Median number of vehichles in renter occupied houses
Mean number of vehichles in renter occupied houses
Mortgage status - with mortgage (%)
Mortgage status - with second mortgage (%)
Mortgage status - with home equity loan (%)
Mortgage status - with both second mortgage and home equity loan (%)
Mortgage status - without a mortgage (%)
Average family size
Average family size - White
Average family size - Black or African American
Average family size - Asian
Average family size - Hispanic or Latino
Average family size - American Indian and Alaska Native
Average family size - Multirace
Average family size - Other Race
Geographical mobility - Same house 1 year ago (%)
Geographical mobility - Moved within same county (%)
Geographical mobility - Moved from different county within same state (%)
Geographical mobility - Moved from different state (%)
Geographical mobility - Moved from abroad (%)
Place of birth - Born in state of residence (%)
Place of birth - Born in other state (%)
Place of birth - Native, outside of US (%)
Place of birth - Foreign born (%)
Housing units in structures - 1, detached (%)
Housing units in structures - 1, attached (%)
Housing units in structures - 2 (%)
Housing units in structures - 3 or 4 (%)
Housing units in structures - 5 to 9 (%)
Housing units in structures - 10 to 19 (%)
Housing units in structures - 20 to 49 (%)
Housing units in structures - 50 or more (%)
Housing units in structures - Mobile home (%)
Housing units in structures - Boat, RV, van, etc. (%)
House/condo owner moved in on average (years ago)
Renter moved in on average (years ago)
Year householder moved into unit - Moved in 1999 to March 2000 (%)
Year householder moved into unit - Moved in 1995 to 1998 (%)
Year householder moved into unit - Moved in 1990 to 1994 (%)
Year householder moved into unit - Moved in 1980 to 1989 (%)
Year householder moved into unit - Moved in 1970 to 1979 (%)
Year householder moved into unit - Moved in 1969 or earlier (%)
Means of transportation to work - Drove car alone (%)
Means of transportation to work - Carpooled (%)
Means of transportation to work - Public transportation (%)
Means of transportation to work - Bus or trolley bus (%)
Means of transportation to work - Streetcar or trolley car (%)
Means of transportation to work - Subway or elevated (%)
Means of transportation to work - Railroad (%)
Means of transportation to work - Ferryboat (%)
Means of transportation to work - Taxicab (%)
Means of transportation to work - Motorcycle (%)
Means of transportation to work - Bicycle (%)
Means of transportation to work - Walked (%)
Means of transportation to work - Other means (%)
Working at home (%)
Industry diversity
Most Common Industries - Agriculture, forestry, fishing and hunting, and mining (%)
Most Common Industries - Agriculture, forestry, fishing and hunting (%)
Most Common Industries - Mining, quarrying, and oil and gas extraction (%)
Most Common Industries - Construction (%)
Most Common Industries - Manufacturing (%)
Most Common Industries - Wholesale trade (%)
Most Common Industries - Retail trade (%)
Most Common Industries - Transportation and warehousing, and utilities (%)
Most Common Industries - Transportation and warehousing (%)
Most Common Industries - Utilities (%)
Most Common Industries - Information (%)
Most Common Industries - Finance and insurance, and real estate and rental and leasing (%)
Most Common Industries - Finance and insurance (%)
Most Common Industries - Real estate and rental and leasing (%)
Most Common Industries - Professional, scientific, and management, and administrative and waste management services (%)
Most Common Industries - Professional, scientific, and technical services (%)
Most Common Industries - Management of companies and enterprises (%)
Most Common Industries - Administrative and support and waste management services (%)
Most Common Industries - Educational services, and health care and social assistance (%)
Most Common Industries - Educational services (%)
Most Common Industries - Health care and social assistance (%)
Most Common Industries - Arts, entertainment, and recreation, and accommodation and food services (%)
Most Common Industries - Arts, entertainment, and recreation (%)
Most Common Industries - Accommodation and food services (%)
Most Common Industries - Other services, except public administration (%)
Most Common Industries - Public administration (%)
Occupation diversity
Most Common Occupations - Management, business, science, and arts occupations (%)
Most Common Occupations - Management, business, and financial occupations (%)
Most Common Occupations - Management occupations (%)
Most Common Occupations - Business and financial operations occupations (%)
Most Common Occupations - Computer, engineering, and science occupations (%)
Most Common Occupations - Computer and mathematical occupations (%)
Most Common Occupations - Architecture and engineering occupations (%)
Most Common Occupations - Life, physical, and social science occupations (%)
Most Common Occupations - Education, legal, community service, arts, and media occupations (%)
Most Common Occupations - Community and social service occupations (%)
Most Common Occupations - Legal occupations (%)
Most Common Occupations - Education, training, and library occupations (%)
Most Common Occupations - Arts, design, entertainment, sports, and media occupations (%)
Most Common Occupations - Healthcare practitioners and technical occupations (%)
Most Common Occupations - Health diagnosing and treating practitioners and other technical occupations (%)
Most Common Occupations - Health technologists and technicians (%)
Most Common Occupations - Service occupations (%)
Most Common Occupations - Healthcare support occupations (%)
Most Common Occupations - Protective service occupations (%)
Most Common Occupations - Fire fighting and prevention, and other protective service workers including supervisors (%)
Most Common Occupations - Law enforcement workers including supervisors (%)
Most Common Occupations - Food preparation and serving related occupations (%)
Most Common Occupations - Building and grounds cleaning and maintenance occupations (%)
Most Common Occupations - Personal care and service occupations (%)
Most Common Occupations - Sales and office occupations (%)
Most Common Occupations - Sales and related occupations (%)
Most Common Occupations - Office and administrative support occupations (%)
Most Common Occupations - Natural resources, construction, and maintenance occupations (%)
Most Common Occupations - Farming, fishing, and forestry occupations (%)
Most Common Occupations - Construction and extraction occupations (%)
Most Common Occupations - Installation, maintenance, and repair occupations (%)
Most Common Occupations - Production, transportation, and material moving occupations (%)
Most Common Occupations - Production occupations (%)
Most Common Occupations - Transportation occupations (%)
Most Common Occupations - Material moving occupations (%)
People in Group quarters - Institutionalized population (%)
People in Group quarters - Correctional institutions (%)
People in Group quarters - Federal prisons and detention centers (%)
People in Group quarters - Halfway houses (%)
People in Group quarters - Local jails and other confinement facilities (including police lockups) (%)
People in Group quarters - Military disciplinary barracks (%)
People in Group quarters - State prisons (%)
People in Group quarters - Other types of correctional institutions (%)
People in Group quarters - Nursing homes (%)
People in Group quarters - Hospitals/wards, hospices, and schools for the handicapped (%)
People in Group quarters - Hospitals/wards and hospices for chronically ill (%)
People in Group quarters - Hospices or homes for chronically ill (%)
People in Group quarters - Military hospitals or wards for chronically ill (%)
People in Group quarters - Other hospitals or wards for chronically ill (%)
People in Group quarters - Hospitals or wards for drug/alcohol abuse (%)
People in Group quarters - Mental (Psychiatric) hospitals or wards (%)
People in Group quarters - Schools, hospitals, or wards for the mentally retarded (%)
People in Group quarters - Schools, hospitals, or wards for the physically handicapped (%)
People in Group quarters - Institutions for the deaf (%)
People in Group quarters - Institutions for the blind (%)
People in Group quarters - Orthopedic wards and institutions for the physically handicapped (%)
People in Group quarters - Wards in general hospitals for patients who have no usual home elsewhere (%)
People in Group quarters - Wards in military hospitals for patients who have no usual home elsewhere (%)
People in Group quarters - Juvenile institutions (%)
People in Group quarters - Long-term care (%)
People in Group quarters - Homes for abused, dependent, and neglected children (%)
People in Group quarters - Residential treatment centers for emotionally disturbed children (%)
People in Group quarters - Training schools for juvenile delinquents (%)
People in Group quarters - Short-term care, detention or diagnostic centers for delinquent children (%)
People in Group quarters - Type of juvenile institution unknown (%)
People in Group quarters - Noninstitutionalized population (%)
People in Group quarters - College dormitories (includes college quarters off campus) (%)
People in Group quarters - Military quarters (%)
People in Group quarters - On base (%)
People in Group quarters - Barracks, unaccompanied personnel housing (UPH), (Enlisted/Officer), ;and similar group living quarters for military personnel (%)
People in Group quarters - Transient quarters for temporary residents (%)
People in Group quarters - Military ships (%)
People in Group quarters - Group homes (%)
People in Group quarters - Homes or halfway houses for drug/alcohol abuse (%)
People in Group quarters - Homes for the mentally ill (%)
People in Group quarters - Homes for the mentally retarded (%)
People in Group quarters - Homes for the physically handicapped (%)
People in Group quarters - Other group homes (%)
People in Group quarters - Religious group quarters (%)
People in Group quarters - Dormitories (%)
People in Group quarters - Agriculture workers' dormitories on farms (%)
People in Group quarters - Job Corps and vocational training facilities (%)
People in Group quarters - Other workers' dormitories (%)
People in Group quarters - Crews of maritime vessels (%)
People in Group quarters - Other nonhousehold living situations (%)
People in Group quarters - Other noninstitutional group quarters (%)
Residents speaking English at home (%)
Residents speaking English at home - Born in the United States (%)
Residents speaking English at home - Native, born elsewhere (%)
Residents speaking English at home - Foreign born (%)
Residents speaking Spanish at home (%)
Residents speaking Spanish at home - Born in the United States (%)
Residents speaking Spanish at home - Native, born elsewhere (%)
Residents speaking Spanish at home - Foreign born (%)
Residents speaking other language at home (%)
Residents speaking other language at home - Born in the United States (%)
Residents speaking other language at home - Native, born elsewhere (%)
Residents speaking other language at home - Foreign born (%)
Class of Workers - Employee of private company (%)
Class of Workers - Self-employed in own incorporated business (%)
Class of Workers - Private not-for-profit wage and salary workers (%)
Class of Workers - Local government workers (%)
Class of Workers - State government workers (%)
Class of Workers - Federal government workers (%)
Class of Workers - Self-employed workers in own not incorporated business and Unpaid family workers (%)
House heating fuel used in houses and condos - Utility gas (%)
House heating fuel used in houses and condos - Bottled, tank, or LP gas (%)
House heating fuel used in houses and condos - Electricity (%)
House heating fuel used in houses and condos - Fuel oil, kerosene, etc. (%)
House heating fuel used in houses and condos - Coal or coke (%)
House heating fuel used in houses and condos - Wood (%)
House heating fuel used in houses and condos - Solar energy (%)
House heating fuel used in houses and condos - Other fuel (%)
House heating fuel used in houses and condos - No fuel used (%)
House heating fuel used in apartments - Utility gas (%)
House heating fuel used in apartments - Bottled, tank, or LP gas (%)
House heating fuel used in apartments - Electricity (%)
House heating fuel used in apartments - Fuel oil, kerosene, etc. (%)
House heating fuel used in apartments - Coal or coke (%)
House heating fuel used in apartments - Wood (%)
House heating fuel used in apartments - Solar energy (%)
House heating fuel used in apartments - Other fuel (%)
House heating fuel used in apartments - No fuel used (%)
Armed forces status - In Armed Forces (%)
Armed forces status - Civilian (%)
Armed forces status - Civilian - Veteran (%)
Armed forces status - Civilian - Nonveteran (%)
Fatal accidents locations in years 2005-2021
Fatal accidents locations in 2005
Fatal accidents locations in 2006
Fatal accidents locations in 2007
Fatal accidents locations in 2008
Fatal accidents locations in 2009
Fatal accidents locations in 2010
Fatal accidents locations in 2011
Fatal accidents locations in 2012
Fatal accidents locations in 2013
Fatal accidents locations in 2014
Fatal accidents locations in 2015
Fatal accidents locations in 2016
Fatal accidents locations in 2017
Fatal accidents locations in 2018
Fatal accidents locations in 2019
Fatal accidents locations in 2020
Fatal accidents locations in 2021
Alcohol use - People drinking some alcohol every month (%)
Alcohol use - People not drinking at all (%)
Alcohol use - Average days/month drinking alcohol
Alcohol use - Average drinks/week
Alcohol use - Average days/year people drink much
Audiometry - Average condition of hearing (%)
Audiometry - People that can hear a whisper from across a quiet room (%)
Audiometry - People that can hear normal voice from across a quiet room (%)
Audiometry - Ears ringing, roaring, buzzing (%)
Audiometry - Had a job exposure to loud noise (%)
Audiometry - Had off-work exposure to loud noise (%)
Blood Pressure & Cholesterol - Has high blood pressure (%)
Blood Pressure & Cholesterol - Checking blood pressure at home (%)
Blood Pressure & Cholesterol - Frequently checking blood cholesterol (%)
Blood Pressure & Cholesterol - Has high cholesterol level (%)
Consumer Behavior - Money monthly spent on food at supermarket/grocery store
Consumer Behavior - Money monthly spent on food at other stores
Consumer Behavior - Money monthly spent on eating out
Consumer Behavior - Money monthly spent on carryout/delivered foods
Consumer Behavior - Income spent on food at supermarket/grocery store (%)
Consumer Behavior - Income spent on food at other stores (%)
Consumer Behavior - Income spent on eating out (%)
Consumer Behavior - Income spent on carryout/delivered foods (%)
Current Health Status - General health condition (%)
Current Health Status - Blood donors (%)
Current Health Status - Has blood ever tested for HIV virus (%)
Current Health Status - Left-handed people (%)
Dermatology - People using sunscreen (%)
Diabetes - Diabetics (%)
Diabetes - Had a blood test for high blood sugar (%)
Diabetes - People taking insulin (%)
Diet Behavior & Nutrition - Diet health (%)
Diet Behavior & Nutrition - Milk product consumption (# of products/month)
Diet Behavior & Nutrition - Meals not home prepared (#/week)
Diet Behavior & Nutrition - Meals from fast food or pizza place (#/week)
Diet Behavior & Nutrition - Ready-to-eat foods (#/month)
Diet Behavior & Nutrition - Frozen meals/pizza (#/month)
Drug Use - People that ever used marijuana or hashish (%)
Drug Use - Ever used hard drugs (%)
Drug Use - Ever used any form of cocaine (%)
Drug Use - Ever used heroin (%)
Drug Use - Ever used methamphetamine (%)
Health Insurance - People covered by health insurance (%)
Kidney Conditions-Urology - Avg. # of times urinating at night
Medical Conditions - People with asthma (%)
Medical Conditions - People with anemia (%)
Medical Conditions - People with psoriasis (%)
Medical Conditions - People with overweight (%)
Medical Conditions - Elderly people having difficulties in thinking or remembering (%)
Medical Conditions - People who ever received blood transfusion (%)
Medical Conditions - People having trouble seeing even with glass/contacts (%)
Medical Conditions - People with arthritis (%)
Medical Conditions - People with gout (%)
Medical Conditions - People with congestive heart failure (%)
Medical Conditions - People with coronary heart disease (%)
Medical Conditions - People with angina pectoris (%)
Medical Conditions - People who ever had heart attack (%)
Medical Conditions - People who ever had stroke (%)
Medical Conditions - People with emphysema (%)
Medical Conditions - People with thyroid problem (%)
Medical Conditions - People with chronic bronchitis (%)
Medical Conditions - People with any liver condition (%)
Medical Conditions - People who ever had cancer or malignancy (%)
Mental Health - People who have little interest in doing things (%)
Mental Health - People feeling down, depressed, or hopeless (%)
Mental Health - People who have trouble sleeping or sleeping too much (%)
Mental Health - People feeling tired or having little energy (%)
Mental Health - People with poor appetite or overeating (%)
Mental Health - People feeling bad about themself (%)
Mental Health - People who have trouble concentrating on things (%)
Mental Health - People moving or speaking slowly or too fast (%)
Mental Health - People having thoughts they would be better off dead (%)
Oral Health - Average years since last visit a dentist
Oral Health - People embarrassed because of mouth (%)
Oral Health - People with gum disease (%)
Oral Health - General health of teeth and gums (%)
Oral Health - Average days a week using dental floss/device
Oral Health - Average days a week using mouthwash for dental problem
Oral Health - Average number of teeth
Pesticide Use - Households using pesticides to control insects (%)
Pesticide Use - Households using pesticides to kill weeds (%)
Physical Activity - People doing vigorous-intensity work activities (%)
Physical Activity - People doing moderate-intensity work activities (%)
Physical Activity - People walking or bicycling (%)
Physical Activity - People doing vigorous-intensity recreational activities (%)
Physical Activity - People doing moderate-intensity recreational activities (%)
Physical Activity - Average hours a day doing sedentary activities
Physical Activity - Average hours a day watching TV or videos
Physical Activity - Average hours a day using computer
Physical Functioning - People having limitations keeping them from working (%)
Physical Functioning - People limited in amount of work they can do (%)
Physical Functioning - People that need special equipment to walk (%)
Physical Functioning - People experiencing confusion/memory problems (%)
Physical Functioning - People requiring special healthcare equipment (%)
Prescription Medications - Average number of prescription medicines taking
Preventive Aspirin Use - Adults 40+ taking low-dose aspirin (%)
Reproductive Health - Vaginal deliveries (%)
Reproductive Health - Cesarean deliveries (%)
Reproductive Health - Deliveries resulted in a live birth (%)
Reproductive Health - Pregnancies resulted in a delivery (%)
Reproductive Health - Women breastfeeding newborns (%)
Reproductive Health - Women that had a hysterectomy (%)
Reproductive Health - Women that had both ovaries removed (%)
Reproductive Health - Women that have ever taken birth control pills (%)
Reproductive Health - Women taking birth control pills (%)
Reproductive Health - Women that have ever used Depo-Provera or injectables (%)
Reproductive Health - Women that have ever used female hormones (%)
Sexual Behavior - People 18+ that ever had sex (vaginal, anal, or oral) (%)
Sexual Behavior - Males 18+ that ever had vaginal sex with a woman (%)
Sexual Behavior - Males 18+ that ever performed oral sex on a woman (%)
Sexual Behavior - Males 18+ that ever had anal sex with a woman (%)
Sexual Behavior - Males 18+ that ever had any sex with a man (%)
Sexual Behavior - Females 18+ that ever had vaginal sex with a man (%)
Sexual Behavior - Females 18+ that ever performed oral sex on a man (%)
Sexual Behavior - Females 18+ that ever had anal sex with a man (%)
Sexual Behavior - Females 18+ that ever had any kind of sex with a woman (%)
Sexual Behavior - Average age people first had sex
Sexual Behavior - Average number of female sex partners in lifetime (males 18+)
Sexual Behavior - Average number of female vaginal sex partners in lifetime (males 18+)
Sexual Behavior - Average age people first performed oral sex on a woman (18+)
Sexual Behavior - Average number of woman performed oral sex on in lifetime (18+)
Sexual Behavior - Average number of male sex partners in lifetime (males 18+)
Sexual Behavior - Average number of male anal sex partners in lifetime (males 18+)
Sexual Behavior - Average age people first performed oral sex on a man (18+)
Sexual Behavior - Average number of male oral sex partners in lifetime (18+)
Sexual Behavior - People using protection when performing oral sex (%)
Sexual Behavior - Average number of times people have vaginal or anal sex a year
Sexual Behavior - People having sex without condom (%)
Sexual Behavior - Average number of male sex partners in lifetime (females 18+)
Sexual Behavior - Average number of male vaginal sex partners in lifetime (females 18+)
Sexual Behavior - Average number of female sex partners in lifetime (females 18+)
Sexual Behavior - Circumcised males 18+ (%)
Sleep Disorders - Average hours sleeping at night
Sleep Disorders - People that has trouble sleeping (%)
Smoking-Cigarette Use - People smoking cigarettes (%)
Taste & Smell - People 40+ having problems with smell (%)
Taste & Smell - People 40+ having problems with taste (%)
Taste & Smell - People 40+ that ever had wisdom teeth removed (%)
Taste & Smell - People 40+ that ever had tonsils teeth removed (%)
Taste & Smell - People 40+ that ever had a loss of consciousness because of a head injury (%)
Taste & Smell - People 40+ that ever had a broken nose or other serious injury to face or skull (%)
Taste & Smell - People 40+ that ever had two or more sinus infections (%)
Weight - Average height (inches)
Weight - Average weight (pounds)
Weight - Average BMI
Weight - People that are obese (%)
Weight - People that ever were obese (%)
Weight - People trying to lose weight (%)
4,291 34.1% White alone 3,953 31.4% Asian alone 1,939 15.4% Black alone 1,163 9.3% Hispanic 880 7.0% Two or more races 264 2.1% Other race alone 47 0.4% Native Hawaiian and Other 9 0.07% American Indian alone
According to our research of California and other state lists, there were 7 registered sex offenders living in Emeryville, California as of April 27, 2024 . The ratio of all residents to sex offenders in Emeryville is 1,629 to 1.The ratio of registered sex offenders to all residents in this city is lower than the state average.
Officers per 1,000 residents here:
2.98California average:
2.30
Latest news from Emeryville, CA collected exclusively by city-data.com from local newspapers, TV, and radio stations
Ancestries: Iranian (5.0%), American (2.3%), German (2.2%), Italian (2.1%), Ethiopian (1.7%), European (1.4%).
Current Local Time:
Land area: 1.22 square miles.
Population density: 10,594 people per square mile (high).
4,275 residents are foreign born (23.0% Asia , 4.4% Europe ).
This city:
34.0%California:
26.5%
Median real estate property taxes paid for housing units with mortgages in 2022: $7,378 (1.0%)Median real estate property taxes paid for housing units with no mortgage in 2022: $5,593 (0.9%)
Nearest city with pop. 50,000+: Berkeley, CA
Nearest city with pop. 200,000+: Oakland, CA
Nearest city with pop. 1,000,000+: Los Angeles, CA
Nearest cities:
Latitude: 37.84 N, Longitude: 122.29 W
Daytime population change due to commuting: +11,796 (+93.8%)Workers who live and work in this city: 3,827 (43.7%)
Area code commonly used in this area: 925
Emeryville tourist attractions:
Single-family new house construction building permits:
2022: 2 buildings , average cost: $434,0002021: 3 buildings , average cost: $141,1002019: 1 building , cost: $182,2002017: 2 buildings , average cost: $311,5002016: 1 building , cost: $224,9002015: 2 buildings , average cost: $157,5002013: 1 building , cost: $219,4002011: 1 building , cost: $164,6002008: 2 buildings , average cost: $158,7002007: 3 buildings , average cost: $291,7002002: 1 building , cost: $100,0002001: 2 buildings , average cost: $255,0002000: 2 buildings , average cost: $150,000Unemployment in December 2023:
Population change in the 1990s: +1,219 (+21.5%).
Most common industries in Emeryville, CA (%)
Both Males Females
Professional, scientific, technical services (16.6%)
Educational services (10.7%)
Health care (7.8%)
Finance & insurance (6.3%)
Construction (4.7%)
Public administration (4.3%)
Accommodation & food services (3.6%)
Professional, scientific, technical services (19.4%)
Educational services (8.1%)
Construction (6.7%)
Other transportation, support activities, couriers (5.3%)
Finance & insurance (5.3%)
Accommodation & food services (5.2%)
Health care (5.2%)
Educational services (13.9%)
Professional, scientific, technical services (13.4%)
Health care (10.8%)
Finance & insurance (7.4%)
Public administration (6.7%)
Arts, entertainment, recreation (3.9%)
Administrative & support & waste management services (3.3%)
Most common occupations in Emeryville, CA (%)
Both Males Females
Computer specialists (8.2%)
Other management occupations, except farmers and farm managers (7.3%)
Postsecondary teachers (3.8%)
Other sales and related occupations, including supervisors (3.7%)
Sales representatives, services, wholesale and manufacturing (3.6%)
Accountants and auditors (3.4%)
Other production occupations, including supervisors (2.6%)
Computer specialists (11.4%)
Other management occupations, except farmers and farm managers (7.4%)
Sales representatives, services, wholesale and manufacturing (4.5%)
Other sales and related occupations, including supervisors (4.0%)
Postsecondary teachers (3.9%)
Engineers (3.7%)
Motor vehicle operators, except bus and truck drivers (3.2%)
Other management occupations, except farmers and farm managers (7.3%)
Computer specialists (4.6%)
Information and record clerks, except customer service representatives (4.2%)
Accountants and auditors (3.9%)
Postsecondary teachers (3.7%)
Secretaries and administrative assistants (3.6%)
Other sales and related occupations, including supervisors (3.4%)
Earthquake activity:
Emeryville-area historical earthquake activity is significantly above California state average. It is 7514% greater than the overall U.S. average. On 4/18/1906 at 13:12:21, a magnitude 7.9 (7.9 UK, Class: Major, Intensity: VIII - XII) earthquake occurred 40.5 miles away from the city center, causing $524,000,000 total damage On 10/18/1989 at 00:04:15, a magnitude 7.1 (6.5 MB, 7.1 MS, 6.9 MW, 7.0 ML) earthquake occurred 57.7 miles away from the city center, causing 62 deaths ( 62 shaking deaths) and 3757 injuries, causing $1,305,032,704 total damage On 11/4/1927 at 13:51:53, a magnitude 7.5 (7.5 UK) earthquake occurred 213.8 miles away from Emeryville center On 7/21/1952 at 11:52:14, a magnitude 7.7 (7.7 UK) earthquake occurred 268.2 miles away from the city center, causing $50,000,000 total damage On 1/31/1922 at 13:17:28, a magnitude 7.6 (7.6 UK) earthquake occurred 264.2 miles away from Emeryville center On 4/25/1992 at 18:06:04, a magnitude 7.2 (6.3 MB, 7.1 MS, 7.2 MW, 7.1 MW, Depth: 9.4 mi) earthquake occurred 198.4 miles away from the city center, causing $75,000,000 total damage Magnitude types: body-wave magnitude (MB), local magnitude (ML), surface-wave magnitude (MS), moment magnitude (MW) Natural disasters: The number of natural disasters in Alameda County (20) is greater than the US average (15).Major Disasters (Presidential) Declared: 14Emergencies Declared: 2Floods: 13, Storms: 7, Mudslides: 6, Winter Storms: 6, Landslides: 4, Fires: 2, Drought: 1, Earthquake: 1, Freeze: 1, Hurricane: 1, Tornado: 1, Other: 1 (Note: some incidents may be assigned to more than one category). Main business address for: LEAPFROG ENTERPRISES INC GAMES, TOYS & CHILDREN'S VEHICLES (NO DOLLS & BICYCLES) ), LECG CORP SERVICES-MANAGEMENT CONSULTING SERVICES ), PIXAR \CA\ SERVICES-MOTION PICTURE & VIDEO TAPE PRODUCTION ), ZIPREALTY INC REAL ESTATE AGENTS & MANAGERS (FOR OTHERS) ), NETOPIA INC COMPUTER COMMUNICATIONS EQUIPMENT ), CHIRON CORP PHARMACEUTICAL PREPARATIONS ), ONYX PHARMACEUTICALS INC BIOLOGICAL PRODUCTS (NO DIAGNOSTIC SUBSTANCES) ), GEOWORKS /CA/ SERVICES-PREPACKAGED SOFTWARE ).
Hospitals and medical centers in Emeryville: SUTTER VISITING NURSE ASSOC AND HOSPICE (1900 POWELL STREET) WELLBOUND OF EMERYVILLE (2000 POWELL STREET SUITE 140)
Other hospitals and medical centers near Emeryville: FMC BERKELEY (Dialysis Facility, about 2 miles away; BERKELEY, CA)
VNA COMPLETE HOSPICE, INC (Hospital, about 2 miles away; OAKLAND, CA)
OAKLAND PERITONEAL DIALYSIS CENTER (Dialysis Facility, about 2 miles away; OAKLAND, CA)
OAKLAND DIALYSIS CENTER (Dialysis Facility, about 2 miles away; OAKLAND, CA)
KINDRED NURSING AND REHABILITATION - MEDICAL HILL (Nursing Home, about 2 miles away; OAKLAND, CA)
SHADOWBROOK MANOR (Nursing Home, about 2 miles away; OAKLAND, CA)
MCCLURE CONVALESCENT HOSP AND REHAB CENTER (Nursing Home, about 2 miles away; OAKLAND, CA)
Amtrak station: EMERYVILLE (5885 LANDREGAN ST.)
.
Services: ticket office, fully wheelchair accessible, enclosed waiting area, public restrooms, public payphones, snack bar, free short-term parking, free long-term parking, call for taxi service, public transit connection.
Colleges/Universities in Emeryville: Expression College for Digital Arts Full-time enrollment: 608; Location: 6601 Shellmond St; Private, for-profit; Website: www.expression.edu)
National Holistic Institute Full-time enrollment: 449; Location: 5900 Doyle Street; Private, for-profit; Website: www.nhi.edu)
Carrington College California-Emeryville Location: 6001 Shellmound St., Ste. 145; Private, for-profit)
Colleges/universities with over 2000 students nearest to Emeryville:
Berkeley City College (about 3 miles; Berkeley, CA ; Full-time enrollment: 3,146)
University of California-Berkeley (about 3 miles; Berkeley, CA ; FT enrollment: 37,127)
Laney College (about 4 miles; Oakland, CA ; FT enrollment: 5,668)
College of Alameda (about 4 miles; Alameda, CA ; FT enrollment: 3,071)
Academy of Art University (about 8 miles; San Francisco, CA ; FT enrollment: 12,352)
Merritt College (about 8 miles; Oakland, CA ; FT enrollment: 2,842)
Contra Costa College (about 10 miles; San Pablo, CA ; FT enrollment: 4,249)
Public elementary/middle school in Emeryville:
See full list of schools located in Emeryville
Notable locations in Emeryville: (A) , Peabody Landing (B) , Emeryville City Hall (C) , Veterans Memorial Building (D) , Emeryville Fire Department Station 2 (E) . Display/hide their locations on the map
Shopping Centers: (1) , Powell Street Plaza Shopping Center (2) . Display/hide their locations on the map
Main business address in Emeryville include: (A) , LECG CORP (B) , PIXAR \CA\ (C) , ZIPREALTY INC (D) , NETOPIA INC (E) , CHIRON CORP (F) , ONYX PHARMACEUTICALS INC (G) . Display/hide their locations on the map
Hotel:
Alameda County has a predicted average indoor radon screening level between 2 and 4 pCi/L (pico curies per liter) - Moderate Potential Average household size: This city:
1.8 peopleCalifornia:
2.9 people
Percentage of family households: This city:
32.2%Whole state:
68.7%
Percentage of households with unmarried partners: This city:
10.5%Whole state:
7.2%
Likely homosexual households (counted as self-reported same-sex unmarried-partner households)
Lesbian couples: 0.7% of all households Gay men: 1.4% of all households
71 people in other noninstitutional facilities in 2010people in emergency and transitional shelters (with sleeping facilities) for people experiencing homelessness in 2010people in other noninstitutional group quarters in 2000
Banks with branches in Emeryville (2011 data):
Bank of America, National Association: Emeryville Branch at 4120 San Pablo Avenue, branch established on 1927/02/19. Info updated 2009/11/18: Bank assets: $1,451,969.3 mil, Deposits: $1,077,176.8 mil, headquarters in Charlotte, NC, positive income , 5782 total offices , Holding Company: Bank Of America Corporation
Bank of Alameda: Emeryville Commercial Branch at 2200 Powell Street, Ste. 105, branch established on 2002/01/22. Info updated 2006/11/03: Bank assets: $247.8 mil, Deposits: $218.4 mil, headquarters in Alameda, CA, positive income , Commercial Lending Specialization, 6 total offices , Holding Company: Norcal Community Bancorp
Summit Bank: Emeryville Branch at 2000 Powell Street, branch established on 1986/01/02. Info updated 2008/10/16: Bank assets: $185.7 mil, Deposits: $163.9 mil, headquarters in Oakland, CA, positive income , Commercial Lending Specialization, 3 total offices , Holding Company: Summit Bancshares, Inc.
JPMorgan Chase Bank, National Association: Emeryville Branch at 5747 Christie Avenue, branch established on 2007/05/21. Info updated 2011/11/10: Bank assets: $1,811,678.0 mil, Deposits: $1,190,738.0 mil, headquarters in Columbus, OH, positive income , International Specialization, 5577 total offices , Holding Company: Jpmorgan Chase & Co.
Wells Fargo Bank, National Association: Emeryville Branch at 5801 Christie Avenue, branch established on 1971/05/21. Info updated 2011/04/05: Bank assets: $1,161,490.0 mil, Deposits: $905,653.0 mil, headquarters in Sioux Falls, SD, positive income , 6395 total offices , Holding Company: Wells Fargo & Company
For population 15 years and over in Emeryville:
Never married: 51.4%Now married: 35.3%Separated: 0.8%Widowed: 2.8%Divorced: 9.6% For population 25 years and over in Emeryville:
High school or higher: 97.5%Bachelor's degree or higher: 72.6%Graduate or professional degree: 32.7%Unemployed: 4.0%Mean travel time to work (commute): 20.0 minutes
Education Gini index (Inequality in education) Here:
9.4California average:
15.5
Religion statistics for Emeryville, CA (based on Alameda County data)
Religion Adherents Congregations Catholic 231,500 53 Evangelical Protestant 123,422 538 Other 87,110 227 Mainline Protestant 40,185 181 Black Protestant 20,716 76 Orthodox 6,640 16 None 1,000,698 -
Source: Clifford Grammich, Kirk Hadaway, Richard Houseal, Dale E.Jones, Alexei Krindatch, Richie Stanley and Richard H.Taylor. 2012. 2010 U.S.Religion Census: Religious Congregations & Membership Study. Association of Statisticians of American Religious Bodies. Jones, Dale E., et al. 2002. Congregations and Membership in the United States 2000. Nashville, TN: Glenmary Research Center. Graphs represent county-level data
Food Environment Statistics: Number of grocery stores : 364Alameda County :
2.50 / 10,000 pop.California :
2.14 / 10,000 pop.
Number of supercenters and club stores : 5This county :
0.03 / 10,000 pop.California :
0.04 / 10,000 pop.
Number of convenience stores (no gas) : 97Alameda County :
0.67 / 10,000 pop.California :
0.62 / 10,000 pop.
Number of convenience stores (with gas) : 232Here :
1.60 / 10,000 pop.California :
1.49 / 10,000 pop.
Number of full-service restaurants : 1,299Alameda County :
8.94 / 10,000 pop.California :
7.42 / 10,000 pop.
Adult diabetes rate : Alameda County :
6.9%California :
7.3%
Adult obesity rate : Alameda County :
19.3%State :
21.3%
Low-income preschool obesity rate : Alameda County :
16.6%State :
17.9%
Health and Nutrition: Healthy diet rate : Emeryville:
56.2%State:
49.4%
Average overall health of teeth and gums : Emeryville:
56.0%California:
48.0%
People feeling badly about themselves : Emeryville:
15.2%California:
20.2%
People not drinking alcohol at all : This city:
11.6%California:
11.2%
Average hours sleeping at night : This city:
6.9California:
6.8
Overweight people : This city:
27.9%State:
31.5%
General health condition : Emeryville:
63.3%California:
56.4%
Average condition of hearing : Emeryville:
84.7%California:
80.9%
More about Health and Nutrition of Emeryville, CA Residents
Local government employment and payroll (March 2022)
Function
Full-time employees
Monthly full-time payroll
Average yearly full-time wage
Part-time employees
Monthly part-time payroll
Police Protection - Officers
35 $450,698 $154,525 0 $0 Streets and Highways
21 $141,172 $80,670 0 $0 Other and Unallocable
20 $62,300 $37,380 35 $7,054 Police - Other
14 $108,180 $92,726 1 $1,141 Other Government Administration
13 $101,166 $93,384 0 $0 Financial Administration
5 $53,698 $128,875 0 $0 Parks and Recreation
4 $34,791 $104,373 26 $24,050 Sewerage
2 $6,412 $38,472 0 $0 Housing and Community Development (Local)
1 $11,574 $138,888 0 $0 Judicial and Legal
1 $11,244 $134,928 0 $0
Totals for Government
116 $981,235 $101,507 62 $32,245
Emeryville government finances - Expenditure in 2021 (per resident):
Construction - Regular Highways: $21,509,000 ($1665.69)
Housing and Community Development: $13,099,000 ($1014.40)General - Other: $1,938,000 ($150.08)Parking Facilities: $1,013,000 ($78.45)Parks and Recreation: $59,000 ($4.57)Current Operations - General - Other: $21,167,000 ($1639.20)
Police Protection: $14,026,000 ($1086.19)Central Staff Services: $11,424,000 ($884.69)Local Fire Protection: $9,210,000 ($713.23)Transit Utilities: $4,732,000 ($366.45)Protective Inspection and Regulation - Other: $4,437,000 ($343.61)Health - Other: $2,474,000 ($191.59)Parks and Recreation: $2,398,000 ($185.70)Housing and Community Development: $2,055,000 ($159.14)Financial Administration: $982,000 ($76.05)Judicial and Legal Services: $491,000 ($38.02)Sewerage: $441,000 ($34.15)Regular Highways: $207,000 ($16.03)General - Interest on Debt: $280,000 ($21.68)
Other Capital Outlay - General - Other: $460,000 ($35.62)
Emeryville government finances - Revenue in 2021 (per resident):
Charges - Other: $24,355,000 ($1886.08)
Sewerage: $1,271,000 ($98.43)Parks and Recreation: $343,000 ($26.56)Federal Intergovernmental - Other: $531,000 ($41.12)
Housing and Community Development: $10,000 ($0.77)Local Intergovernmental - Other: $1,970,000 ($152.56)
Transit Utilities: $69,000 ($5.34)Miscellaneous - General Revenue - Other: $6,449,000 ($499.42)
Interest Earnings: $3,979,000 ($308.14)Rents: $689,000 ($53.36)Fines and Forfeits: $113,000 ($8.75)Revenue - Transit Utilities: $1,000 ($0.08)
State Intergovernmental - Other: $2,110,000 ($163.40)
Highways: $498,000 ($38.57)General Local Government Support: $70,000 ($5.42)Tax - Documentary and Stock Transfer: $11,682,000 ($904.67)
Property: $9,960,000 ($771.32)General Sales and Gross Receipts: $7,517,000 ($582.13)Occupation and Business License - Other: $6,551,000 ($507.32)Public Utilities Sales: $5,013,000 ($388.21)Other License: $3,828,000 ($296.45)Other: $3,022,000 ($234.03)Other Selective Sales: $2,278,000 ($176.41)
Emeryville government finances - Debt in 2021 (per resident):
Long Term Debt - Beginning Outstanding - Unspecified Public Purpose: $7,749,000 ($600.09)
Outstanding Unspecified Public Purpose: $5,605,000 ($434.06)Retired Unspecified Public Purpose: $2,144,000 ($166.03)
Emeryville government finances - Cash and Securities in 2021 (per resident):
Bond Funds - Cash and Securities: $73,141,000 ($5664.14)
Other Funds - Cash and Securities: $110,073,000 ($8524.20)
Sinking Funds - Cash and Securities: $17,310,000 ($1340.51)
6.77% of this county's 2021 resident taxpayers lived in other counties in 2020 ($121,106 average adjusted gross income )
Here:
6.77%California average:
5.19%
0.01% of residents moved from foreign countries ($76 average AGI )Alameda County:
0.01%California average:
0.03%
Top counties from which taxpayers relocated into this county between 2020 and 2021:
8.96% of this county's 2020 resident taxpayers moved to other counties in 2021 ($131,786 average adjusted gross income )
Here:
8.96%California average:
6.14%
0.01% of residents moved to foreign countries ($103 average AGI )Alameda County:
0.01%California average:
0.02%
Top counties to which taxpayers relocated from this county between 2020 and 2021:
Businesses in Emeryville, CA
Name Count Name Count
ALDO 1 Jamba Juice 1 AT&T 1 KFC 1 Abercrombie & Fitch 1 La-Z-Boy 1 Aerosoles 1 Lane Bryant 1 Ann Taylor 1 LensCrafters 1 Apple Store 1 Little Caesars Pizza 1 Banana Republic 2 Marshalls 1 Barnes & Noble 1 Men's Wearhouse 1 Baskin-Robbins 1 Motherhood Maternity 1 Bath & Body Works 1 Nike 3 Bebe 1 Office Depot 1 Burger King 1 OfficeMax 1 CVS 1 Old Navy 1 Casual Male XL 1 Pier 1 Imports 1 Chico's 1 Pottery Barn 1 Cold Stone Creamery 1 Quiznos 1 Dennys 1 RadioShack 1 Express 1 Safeway 1 FedEx 7 Sephora 1 GNC 1 Sprint Nextel 1 GameStop 2 Starbucks 4 Gap 1 Subway 5 Gymboree 1 Toys"R"Us 1 H&M 1 Trader Joe's 1 Home Depot 1 UPS 11 Hyatt 1 Verizon Wireless 1 IHOP 1 Victoria's Secret 1 IKEA 1 Vons 1 J.Crew 1
Strongest AM radio stations in Emeryville:
KTRB (860 AM; 50 kW; MODESTO, CA; Owner: PAPPAS RADIO OF CALIFORNIA, A CALIFORNIA LIMITED PARTNERSHIP)
KIQI (1010 AM; 35 kW; SAN FRANCISCO, CA; Owner: RADIO UNICA OF SAN FRANCISCO LICENSE CORP.)
KFRC (610 AM; 5 kW; SAN FRANCISCO, CA; Owner: INFINITY BROADCASTING CORPORATION OF LOS ANGELES)
KMZT (1510 AM; 8 kW; SAN RAFAEL, CA; Owner: MOUNT WILSON FM BROADCASTERS, INC.)
KABL (960 AM; 5 kW; OAKLAND, CA; Owner: AMFM RADIO LICENSES, L.L.C.)
KMKY (1310 AM; 5 kW; OAKLAND, CA; Owner: KGO-AM RADIO, INC.)
KNEW (910 AM; 20 kW; OAKLAND, CA; Owner: AMFM RADIO LICENSES, L.L.C.)
KVTO (1400 AM; 1 kW; BERKELEY, CA; Owner: ICBC BROADCAST HOLDINGS - CA, INC.)
KTCT (1050 AM; 50 kW; SAN MATEO, CA; Owner: SUSQUEHANNA RADIO CORP.)
KFAX (1100 AM; 50 kW; SAN FRANCISCO, CA; Owner: GOLDEN GATE BROADCASTING CO, INC.)
KNBR (680 AM; 50 kW; SAN FRANCISCO, CA; Owner: KNBR LICO, INC.)
KSFO (560 AM; 5 kW; SAN FRANCISCO, CA; Owner: KGO-AM RADIO, INC.)
KGO (810 AM; 50 kW; SAN FRANCISCO, CA; Owner: KGO-AM RADIO, INC.)
Strongest FM radio stations in Emeryville:
KLLC (97.3 FM; SAN FRANCISCO, CA; Owner: INFINITY BROADCASTING OPERATIONS, INC.)
KALX (90.7 FM; BERKELEY, CA; Owner: UNIVERSITY OF CALIFORNIA)
KOIT-FM (96.5 FM; SAN FRANCISCO, CA; Owner: BONNEVILLE HOLDING COMPANY)
KKSF (103.7 FM; SAN FRANCISCO, CA; Owner: AMFM RADIO LICENSES, L.L.C.)
KFOG (104.5 FM; SAN FRANCISCO, CA; Owner: KFFG LICO, INC)
KKSF-FM1 (103.7 FM; PLEASANTON, ETC., CA; Owner: AMFM RADIO LICENSES, L.L.C.)
KSOL (98.9 FM; SAN FRANCISCO, CA; Owner: TMS LICENSE CALIFORNIA, INC)
KFRC-FM3 (99.7 FM; WALNUT CREEK, CA; Owner: INFINITY KFRC-FM, INC.)
KZBR-FM1 (95.7 FM; WALNUT CREEK, CA; Owner: BONNEVILLE HOLDING COMPANY)
KBLX-FM2 (102.9 FM; PLEASANTON, CA; Owner: ICBC BROADCAST HOLDINGS -CA, INC.)
KSOL-FM3 (98.9 FM; PLEASANTON, CA; Owner: TMS LICENSE CALIFORNIA, INC)
KDFC-FM (102.1 FM; SAN FRANCISCO, CA; Owner: BONNEVILLE HOLDING COMPANY)
KISQ-FM3 (98.1 FM; CONCORD, CA; Owner: AMFM RADIO LICENSES, L.L.C.)
KSFB-FM (100.7 FM; SAN RAFAEL, CA; Owner: GOLDEN GATE BROADCASTING COMPANY, INC.)
KMEL-FM1 (106.1 FM; CONCORD, CA; Owner: AMFM RADIO LICENSES, L.L.C.)
KYLD (94.9 FM; SAN FRANCISCO, CA; Owner: AMFM RADIO LICENSES, L.L.C.)
KFJO (92.1 FM; WALNUT CREEK, CA; Owner: CHASE RADIO PROPERTIES, L.L.C.)
KFRC-FM (99.7 FM; SAN FRANCISCO, CA; Owner: INFINITY KFRC-FM, INC.)
KMEL (106.1 FM; SAN FRANCISCO, CA; Owner: AMFM RADIO LICENSES, L.L.C.)
KBLX-FM (102.9 FM; BERKELEY, CA; Owner: ICBC BROADCAST HOLDINGS - CA, INC.)
TV broadcast stations around Emeryville:
KQED (Channel 9; SAN FRANCISCO, CA; Owner: KQED, INC.)
KGO-TV (Channel 7; SAN FRANCISCO, CA; Owner: KGO TELEVISION, INC.)
KPIX-TV (Channel 5; SAN FRANCISCO, CA; Owner: CBS BROADCASTING INC.)
KTVU (Channel 2; OAKLAND, CA; Owner: KTVU PARTNERSHIP)
KRON-TV (Channel 4; SAN FRANCISCO, CA; Owner: YOUNG BROADCASTING OF SAN FRANCISCO, INC.)
KMTP-TV (Channel 32; SAN FRANCISCO, CA; Owner: MINORITY TELEVISION PROJECT)
KBHK-TV (Channel 44; SAN FRANCISCO, CA; Owner: VIACOM TELEVISION STATIONS GROUP OF SAN FRANCISCO INC.)
KBWB (Channel 20; SAN FRANCISCO, CA; Owner: KBWB LICENSE, INC.)
KFSF (Channel 66; VALLEJO, CA; Owner: TELEFUTURA SAN FRANCISCO LLC)
KCNS (Channel 38; SAN FRANCISCO, CA; Owner: WRAY, INC.)
KCSM-TV (Channel 60; SAN MATEO, CA; Owner: SAN MATEO COUNTY COMMUNITY COLLEGE DISTRICT)
KOVR (Channel 13; STOCKTON, CA; Owner: SCI - SACRAMENTO LICENSEE, LLC)
KXTV (Channel 10; SACRAMENTO, CA; Owner: KXTV, INC.)
KSPX (Channel 29; SACRAMENTO, CA; Owner: PAXSON SACRAMENTO LICENSE, INC.)
KCRA-TV (Channel 3; SACRAMENTO, CA; Owner: KCRA HEARST-ARGYLE TELEVISION, INC.)
KTXL (Channel 40; SACRAMENTO, CA; Owner: CHANNEL 40, INC.)
KUVS (Channel 19; MODESTO, CA; Owner: KUVS LICENSE PARTNERSHIP, G.P.)
KQCA (Channel 58; STOCKTON, CA; Owner: KCRA HEARST-ARGYLE TELEVISION, INC.)
KVIE (Channel 6; SACRAMENTO, CA; Owner: KVIE, INC.)
KMAX-TV (Channel 31; SACRAMENTO, CA; Owner: UPN STATIONS GROUP INC.)
KTNC-TV (Channel 42; CONCORD, CA; Owner: KTNC LICENSE, LLC)
KTSF (Channel 26; SAN FRANCISCO, CA; Owner: LINCOLN BROADCASTING COMPANY, A CALIFORNIA LP)
KBIT-CA (Channel 28; SAN FRANCISCO, ETC., CA; Owner: POLAR BROADCASTING, INC.)
KICU-TV (Channel 36; SAN JOSE, CA; Owner: KTVU PARTNERSHIP)
Home Mortgage Disclosure Act Aggregated Statistics For Year 2009(Based on 1 full tract) A) FHA, FSA/RHS & VA B) Conventional C) Refinancings D) Home Improvement Loans E) Loans on Dwellings For 5+ Families F) Non-occupant Loans on Number Average Value Number Average Value Number Average Value Number Average Value Number Average Value Number Average Value
LOANS ORIGINATED 20 $254,350 88 $253,114 147 $243,939 2 $252,500 1 $36,374,000 31 $222,323 APPLICATIONS APPROVED, NOT ACCEPTED 1 $476,000 17 $245,471 23 $292,870 0 $0 0 $0 5 $255,400 APPLICATIONS DENIED 2 $217,500 26 $275,692 119 $297,689 2 $300,000 0 $0 34 $269,441 APPLICATIONS WITHDRAWN 5 $267,800 18 $242,889 26 $275,462 1 $38,000 2 $723,000 8 $217,375 FILES CLOSED FOR INCOMPLETENESS 0 $0 7 $219,286 8 $297,875 0 $0 0 $0 0 $0
Aggregated Statistics For Year 2008(Based on 1 full tract) A) FHA, FSA/RHS & VA B) Conventional C) Refinancings D) Home Improvement Loans E) Loans on Dwellings For 5+ Families F) Non-occupant Loans on Number Average Value Number Average Value Number Average Value Number Average Value Number Average Value Number Average Value
LOANS ORIGINATED 9 $370,222 122 $287,107 97 $274,361 5 $424,600 1 $18,125,000 49 $263,265 APPLICATIONS APPROVED, NOT ACCEPTED 2 $520,500 17 $248,529 37 $290,811 1 $62,000 1 $810,000 10 $272,200 APPLICATIONS DENIED 2 $417,000 9 $296,333 60 $268,100 3 $123,333 0 $0 13 $278,923 APPLICATIONS WITHDRAWN 3 $383,000 22 $313,364 43 $289,140 4 $237,500 0 $0 8 $300,500 FILES CLOSED FOR INCOMPLETENESS 0 $0 3 $222,667 5 $250,800 2 $25,000 0 $0 3 $203,667
Aggregated Statistics For Year 2007(Based on 1 full tract) B) Conventional C) Refinancings D) Home Improvement Loans E) Loans on Dwellings For 5+ Families F) Non-occupant Loans on Number Average Value Number Average Value Number Average Value Number Average Value Number Average Value
LOANS ORIGINATED 309 $275,968 177 $291,791 23 $184,174 5 $584,200 106 $279,991 APPLICATIONS APPROVED, NOT ACCEPTED 58 $301,741 47 $311,745 1 $15,000 1 $535,000 20 $329,850 APPLICATIONS DENIED 64 $315,109 123 $322,358 20 $293,950 0 $0 44 $298,159 APPLICATIONS WITHDRAWN 28 $318,643 47 $277,511 5 $245,000 0 $0 16 $275,062 FILES CLOSED FOR INCOMPLETENESS 6 $205,167 15 $367,800 2 $252,500 1 $500,000 7 $323,286
Aggregated Statistics For Year 2006(Based on 1 full tract) A) FHA, FSA/RHS & VA B) Conventional C) Refinancings D) Home Improvement Loans E) Loans on Dwellings For 5+ Families F) Non-occupant Loans on Number Average Value Number Average Value Number Average Value Number Average Value Number Average Value Number Average Value
LOANS ORIGINATED 1 $332,000 397 $323,496 205 $293,849 20 $188,050 2 $2,950,000 113 $303,451 APPLICATIONS APPROVED, NOT ACCEPTED 0 $0 93 $346,968 44 $304,000 8 $139,500 1 $500,000 19 $286,368 APPLICATIONS DENIED 0 $0 127 $333,551 108 $274,444 15 $136,200 0 $0 32 $276,125 APPLICATIONS WITHDRAWN 0 $0 56 $296,196 61 $325,770 4 $49,500 0 $0 13 $314,385 FILES CLOSED FOR INCOMPLETENESS 0 $0 16 $343,438 15 $323,333 1 $150,000 0 $0 9 $319,444
Aggregated Statistics For Year 2005(Based on 1 full tract) B) Conventional C) Refinancings D) Home Improvement Loans E) Loans on Dwellings For 5+ Families F) Non-occupant Loans on G) Loans On Manufactured Number Average Value Number Average Value Number Average Value Number Average Value Number Average Value Number Average Value
LOANS ORIGINATED 439 $303,756 271 $275,173 23 $222,652 1 $759,000 129 $283,233 0 $0 APPLICATIONS APPROVED, NOT ACCEPTED 75 $319,480 43 $269,279 5 $369,000 0 $0 13 $256,538 0 $0 APPLICATIONS DENIED 118 $297,314 117 $281,060 13 $227,538 2 $795,000 46 $287,522 1 $410,000 APPLICATIONS WITHDRAWN 79 $338,380 86 $288,907 10 $244,100 0 $0 27 $329,296 0 $0 FILES CLOSED FOR INCOMPLETENESS 29 $324,724 18 $317,556 0 $0 0 $0 7 $312,286 0 $0
Aggregated Statistics For Year 2004(Based on 1 full tract) B) Conventional C) Refinancings D) Home Improvement Loans E) Loans on Dwellings For 5+ Families F) Non-occupant Loans on G) Loans On Manufactured Number Average Value Number Average Value Number Average Value Number Average Value Number Average Value Number Average Value
LOANS ORIGINATED 277 $261,567 311 $224,881 21 $170,619 5 $1,744,200 121 $207,917 0 $0 APPLICATIONS APPROVED, NOT ACCEPTED 54 $230,204 64 $223,469 2 $198,500 0 $0 18 $210,000 0 $0 APPLICATIONS DENIED 88 $248,739 108 $230,259 15 $115,533 1 $648,000 47 $215,851 0 $0 APPLICATIONS WITHDRAWN 48 $273,625 58 $244,879 5 $184,400 0 $0 17 $225,118 1 $96,000 FILES CLOSED FOR INCOMPLETENESS 7 $359,857 20 $287,950 4 $62,500 0 $0 4 $300,750 0 $0
Aggregated Statistics For Year 2003(Based on 1 full tract) A) FHA, FSA/RHS & VA B) Conventional C) Refinancings D) Home Improvement Loans E) Loans on Dwellings For 5+ Families F) Non-occupant Loans on Number Average Value Number Average Value Number Average Value Number Average Value Number Average Value Number Average Value
LOANS ORIGINATED 1 $262,000 333 $236,402 565 $178,818 6 $69,167 4 $1,602,250 159 $171,887 APPLICATIONS APPROVED, NOT ACCEPTED 0 $0 50 $252,400 84 $196,107 2 $9,000 0 $0 16 $200,500 APPLICATIONS DENIED 1 $222,000 77 $254,299 106 $209,840 5 $74,200 2 $480,000 28 $219,750 APPLICATIONS WITHDRAWN 0 $0 45 $233,822 94 $189,223 1 $26,000 1 $220,000 16 $221,625 FILES CLOSED FOR INCOMPLETENESS 0 $0 7 $327,857 30 $164,167 0 $0 0 $0 7 $150,429
Aggregated Statistics For Year 2002(Based on 1 full tract) A) FHA, FSA/RHS & VA B) Conventional C) Refinancings D) Home Improvement Loans E) Loans on Dwellings For 5+ Families F) Non-occupant Loans on Number Average Value Number Average Value Number Average Value Number Average Value Number Average Value Number Average Value
LOANS ORIGINATED 1 $124,000 219 $196,475 359 $179,331 2 $22,000 1 $550,000 117 $185,538 APPLICATIONS APPROVED, NOT ACCEPTED 1 $40,000 23 $256,870 53 $172,321 1 $35,000 0 $0 17 $177,059 APPLICATIONS DENIED 1 $237,000 33 $192,576 98 $177,204 6 $13,167 2 $6,645,000 31 $177,484 APPLICATIONS WITHDRAWN 0 $0 28 $206,036 73 $186,616 1 $15,000 0 $0 13 $222,923 FILES CLOSED FOR INCOMPLETENESS 0 $0 9 $196,222 23 $193,565 0 $0 0 $0 5 $182,400
Aggregated Statistics For Year 2001(Based on 1 full tract) B) Conventional C) Refinancings D) Home Improvement Loans E) Loans on Dwellings For 5+ Families F) Non-occupant Loans on Number Average Value Number Average Value Number Average Value Number Average Value Number Average Value
LOANS ORIGINATED 154 $189,877 275 $172,465 26 $54,385 1 $265,000 102 $168,255 APPLICATIONS APPROVED, NOT ACCEPTED 9 $237,111 52 $203,212 1 $10,000 0 $0 23 $219,304 APPLICATIONS DENIED 28 $205,143 79 $181,646 13 $56,769 0 $0 19 $235,579 APPLICATIONS WITHDRAWN 10 $174,100 48 $172,958 3 $33,333 1 $7,000,000 7 $188,857 FILES CLOSED FOR INCOMPLETENESS 7 $251,429 14 $169,000 1 $225,000 0 $0 4 $213,750
Aggregated Statistics For Year 2000(Based on 1 full tract) A) FHA, FSA/RHS & VA B) Conventional C) Refinancings D) Home Improvement Loans E) Loans on Dwellings For 5+ Families F) Non-occupant Loans on Number Average Value Number Average Value Number Average Value Number Average Value Number Average Value Number Average Value
LOANS ORIGINATED 0 $0 225 $170,449 73 $139,767 11 $46,273 1 $2,483,000 58 $163,103 APPLICATIONS APPROVED, NOT ACCEPTED 2 $122,000 40 $156,875 16 $87,000 0 $0 0 $0 10 $147,300 APPLICATIONS DENIED 2 $181,500 42 $153,929 31 $137,323 13 $57,538 1 $130,000 15 $112,667 APPLICATIONS WITHDRAWN 1 $109,000 29 $187,793 27 $121,815 2 $22,500 0 $0 10 $192,600 FILES CLOSED FOR INCOMPLETENESS 0 $0 11 $121,909 22 $145,227 0 $0 0 $0 7 $133,286
Aggregated Statistics For Year 1999(Based on 1 partial tract) A) FHA, FSA/RHS & VA B) Conventional C) Refinancings D) Home Improvement Loans E) Loans on Dwellings For 5+ Families F) Non-occupant Loans on Number Average Value Number Average Value Number Average Value Number Average Value Number Average Value Number Average Value
LOANS ORIGINATED 1 $124,830 229 $151,598 153 $119,283 9 $20,303 5 $4,401,060 70 $124,434 APPLICATIONS APPROVED, NOT ACCEPTED 0 $0 34 $184,193 24 $124,797 1 $27,140 0 $0 10 $115,608 APPLICATIONS DENIED 0 $0 49 $175,899 50 $117,906 8 $23,746 0 $0 12 $99,958 APPLICATIONS WITHDRAWN 0 $0 32 $150,164 33 $110,334 0 $0 1 $393,500 9 $95,787 FILES CLOSED FOR INCOMPLETENESS 0 $0 13 $124,278 21 $124,102 0 $0 0 $0 5 $156,134
Detailed HMDA statistics for the following Tracts:
4251.00
Private Mortgage Insurance Companies Aggregated Statistics For Year 2009(Based on 1 full tract) A) Conventional B) Refinancings C) Non-occupant Loans on Number Average Value Number Average Value Number Average Value
LOANS ORIGINATED 6 $313,667 1 $370,000 1 $370,000 APPLICATIONS APPROVED, NOT ACCEPTED 3 $295,667 1 $296,000 0 $0 APPLICATIONS DENIED 2 $272,500 0 $0 0 $0 APPLICATIONS WITHDRAWN 0 $0 0 $0 0 $0 FILES CLOSED FOR INCOMPLETENESS 1 $414,000 0 $0 0 $0
Aggregated Statistics For Year 2008(Based on 1 full tract) A) Conventional B) Refinancings C) Non-occupant Loans on Number Average Value Number Average Value Number Average Value
LOANS ORIGINATED 17 $354,000 3 $342,000 2 $364,500 APPLICATIONS APPROVED, NOT ACCEPTED 1 $414,000 2 $304,500 0 $0 APPLICATIONS DENIED 1 $296,000 0 $0 0 $0 APPLICATIONS WITHDRAWN 1 $414,000 1 $333,000 0 $0 FILES CLOSED FOR INCOMPLETENESS 0 $0 0 $0 0 $0
Aggregated Statistics For Year 2007(Based on 1 full tract) A) Conventional B) Refinancings C) Non-occupant Loans on Number Average Value Number Average Value Number Average Value
LOANS ORIGINATED 10 $337,000 3 $267,667 2 $349,000 APPLICATIONS APPROVED, NOT ACCEPTED 1 $157,000 1 $434,000 0 $0 APPLICATIONS DENIED 1 $428,000 0 $0 0 $0 APPLICATIONS WITHDRAWN 0 $0 0 $0 0 $0 FILES CLOSED FOR INCOMPLETENESS 0 $0 0 $0 0 $0
Aggregated Statistics For Year 2006(Based on 1 full tract) A) Conventional B) Refinancings Number Average Value Number Average Value
LOANS ORIGINATED 6 $394,333 3 $448,333 APPLICATIONS APPROVED, NOT ACCEPTED 1 $563,000 1 $415,000 APPLICATIONS DENIED 1 $275,000 0 $0 APPLICATIONS WITHDRAWN 0 $0 0 $0 FILES CLOSED FOR INCOMPLETENESS 0 $0 0 $0
Aggregated Statistics For Year 2005(Based on 1 full tract) A) Conventional B) Refinancings C) Non-occupant Loans on Number Average Value Number Average Value Number Average Value
LOANS ORIGINATED 13 $338,538 4 $379,250 0 $0 APPLICATIONS APPROVED, NOT ACCEPTED 2 $243,000 0 $0 0 $0 APPLICATIONS DENIED 0 $0 0 $0 0 $0 APPLICATIONS WITHDRAWN 0 $0 1 $230,000 1 $230,000 FILES CLOSED FOR INCOMPLETENESS 0 $0 0 $0 0 $0
Aggregated Statistics For Year 2004(Based on 1 full tract) A) Conventional B) Refinancings C) Non-occupant Loans on Number Average Value Number Average Value Number Average Value
LOANS ORIGINATED 4 $247,250 2 $239,500 1 $207,000 APPLICATIONS APPROVED, NOT ACCEPTED 2 $472,000 2 $210,500 0 $0 APPLICATIONS DENIED 0 $0 0 $0 0 $0 APPLICATIONS WITHDRAWN 0 $0 1 $249,000 0 $0 FILES CLOSED FOR INCOMPLETENESS 0 $0 0 $0 0 $0
Aggregated Statistics For Year 2003(Based on 1 full tract) A) Conventional B) Refinancings C) Non-occupant Loans on Number Average Value Number Average Value Number Average Value
LOANS ORIGINATED 15 $264,467 7 $198,143 3 $198,333 APPLICATIONS APPROVED, NOT ACCEPTED 5 $369,000 1 $142,000 1 $540,000 APPLICATIONS DENIED 0 $0 0 $0 0 $0 APPLICATIONS WITHDRAWN 1 $445,000 1 $166,000 0 $0 FILES CLOSED FOR INCOMPLETENESS 0 $0 0 $0 0 $0
Aggregated Statistics For Year 2002(Based on 1 full tract) A) Conventional B) Refinancings C) Non-occupant Loans on Number Average Value Number Average Value Number Average Value
LOANS ORIGINATED 22 $252,591 2 $228,000 2 $267,000 APPLICATIONS APPROVED, NOT ACCEPTED 2 $266,500 3 $201,000 0 $0 APPLICATIONS DENIED 0 $0 0 $0 0 $0 APPLICATIONS WITHDRAWN 0 $0 0 $0 0 $0 FILES CLOSED FOR INCOMPLETENESS 0 $0 0 $0 0 $0
Aggregated Statistics For Year 2001(Based on 1 full tract) A) Conventional B) Refinancings C) Non-occupant Loans on Number Average Value Number Average Value Number Average Value
LOANS ORIGINATED 16 $222,438 2 $189,500 3 $188,333 APPLICATIONS APPROVED, NOT ACCEPTED 3 $184,667 0 $0 0 $0 APPLICATIONS DENIED 1 $159,000 0 $0 0 $0 APPLICATIONS WITHDRAWN 0 $0 0 $0 0 $0 FILES CLOSED FOR INCOMPLETENESS 0 $0 0 $0 0 $0
Aggregated Statistics For Year 2000(Based on 1 full tract) A) Conventional B) Refinancings C) Non-occupant Loans on Number Average Value Number Average Value Number Average Value
LOANS ORIGINATED 35 $202,314 4 $160,000 2 $101,500 APPLICATIONS APPROVED, NOT ACCEPTED 6 $206,833 0 $0 0 $0 APPLICATIONS DENIED 2 $371,500 0 $0 1 $433,000 APPLICATIONS WITHDRAWN 3 $181,333 0 $0 0 $0 FILES CLOSED FOR INCOMPLETENESS 2 $185,500 0 $0 0 $0
Aggregated Statistics For Year 1999(Based on 1 partial tract) A) Conventional B) Refinancings C) Non-occupant Loans on Number Average Value Number Average Value Number Average Value
LOANS ORIGINATED 68 $156,562 2 $156,950 4 $146,320 APPLICATIONS APPROVED, NOT ACCEPTED 5 $149,078 0 $0 2 $121,215 APPLICATIONS DENIED 5 $174,046 0 $0 0 $0 APPLICATIONS WITHDRAWN 2 $86,840 0 $0 0 $0 FILES CLOSED FOR INCOMPLETENESS 2 $84,580 0 $0 0 $0
Detailed PMIC statistics for the following Tracts:
4251.00
Fire-safe hotels and motels in Emeryville, California:
Holiday Inn San Francisco, 1800 Powell St, Emeryville, California 94608 Phone: (510) 658-9300, Fax: (510) 547-8166
Woodfin Hotel Emeryville, 5800 Shellmound Way, Emeryville, California 94608 Phone: (888) 433-9042, Fax: (510) 601-5833
Extended Stay America - Oakland - Emeryville, 3650 Mandela Pkwy, Emeryville, California 94608 Phone: (510) 923-1481, Fax: (510) 923-1598
Hyatt Place Emeryville / San Francisco Bay Area, 5700 Bay St, Emeryville, California 94608 Phone: (510) 285-9232, Fax: (510) 285-9234
All 4 fire-safe hotels and motels in Emeryville, California
Most common first names in Emeryville, CA among deceased individuals Name Count Lived (average)
John 156 73.3 years James 146 71.0 years Willie 135 71.2 years Mary 132 80.9 years William 100 69.4 years Robert 98 67.5 years George 87 73.1 years Charles 70 71.4 years Frank 60 74.5 years Joseph 60 73.2 years
Most common last names in Emeryville, CA among deceased individuals Last name Count Lived (average)
Williams 156 75.0 years Johnson 134 72.2 years Smith 133 72.5 years Jackson 104 70.7 years Jones 95 71.1 years Brown 86 74.6 years Robinson 56 74.1 years Thomas 55 71.2 years Wilson 54 71.8 years Taylor 47 70.5 years
Emeryville compared to California state average:
Unemployed percentage significantly below state average. Black race population percentage significantly above state average. Hispanic race population percentage below state average. Foreign-born population percentage significantly above state average. Number of rooms per house significantly below state average. House age below state average. Number of college students above state average. Percentage of population with a bachelor's degree or higher significantly above state average. Emeryville on our top lists :
#5 on the list of "Top 101 cities with the highest number of robberies per 100,000 residents, excludes tourist destinations and others with a lot of outsiders visiting based on city industries data (population 5,000+)"
#6 on the list of "Top 101 cities with the highest number of thefts per 100,000 residents, excludes tourist destinations and others with a lot of outsiders visiting based on city industries data (population 5,000+)"
#12 on the list of "Top 101 cities with the highest city-data.com crime index, excludes tourist destinations and others with a lot of outsiders visiting based on city industries data (population 5,000+)"
#13 on the list of "Top 101 cities with the highest number of auto thefts per 100,000 residents, excludes tourist destinations and others with a lot of outsiders visiting based on city industries data (population 5,000+)"
#14 on the list of "Top 101 cities with the lowest percentage of family households, population 10,000+"
#18 on the list of "Top 101 cities that people commute into (largest positive percentage daily daytime population change due to commuting) (population 5,000+)"
#31 on the list of "Top 100 least-safe cities (highest city-data.com crime index)"
#32 on the list of "Top 101 cities with the largest percentage of likely gay men couples (counted as self-reported male-male unmarried-partner households) (population 5,000+)"
#36 on the list of "Top 101 cities with the smallest percentage of one, detached housing units in structures (2,000+ housing units)"
#38 on the list of "Top 101 cities with the lowest percentage of family households, population 1,000+"
#39 on the list of "Top 101 cities with the biggest property tax revenues per resident (population 10,000+)"
#42 on the list of "Top 101 cities with the largest percentage of likely homosexual households (counted as self-reported same-sex unmarried-partner households) (population 5,000+)"
#55 on the list of "Top 101 cities with largest percentage of males in occupations: arts, design, entertainment, sports, and media occupations (population 5,000+)"
#67 on the list of "Top 101 cities with the highest number of murders per 100,000 residents, excludes tourist destinations and others with a lot of outsiders visiting based on city industries data (population 5,000+)"
#68 on the list of "Top 101 cities with the most people taking subway or elevated to work (population 5,000+)"
#79 on the list of "Top 101 cities with the most people taking a bicycle to work (population 5,000+)"
#96 on the list of "Top 100 cities with smallest houses"
#100 on the list of "Top 100 most racially diverse cities"
#11 on the list of "Top 101 counties with the lowest Ozone (1-hour) air pollution readings in 2012 (ppm)"
#17 on the list of "Top 101 counties with highest percentage of residents voting for Obama (Democrat) in the 2012 Presidential Election (pop. 50,000+)"
#18 on the list of "Top 101 counties with the most Other congregations"
#21 on the list of "Top 101 counties with the highest surface withdrawal of fresh water for public supply (pop. 50,000+)"
#22 on the list of "Top 101 counties with the highest percentage of residents that exercised in the past month"
Top Patent Applicants
Jung Ook Hong (21)
Zhen Zhou (21)
Youngsook Shin (19)
Michael Eugene Young (18)
Neil A. Straus (17)
Mandana Veiseh (17)
Eric Hanson (15)
Peter P. Repetti (15)
S. Bahram Bahrami (14)
Bertrand Vick (13)
Total of 1116 patent applications in 2008-2024.
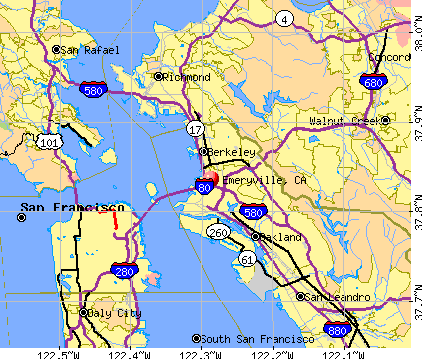


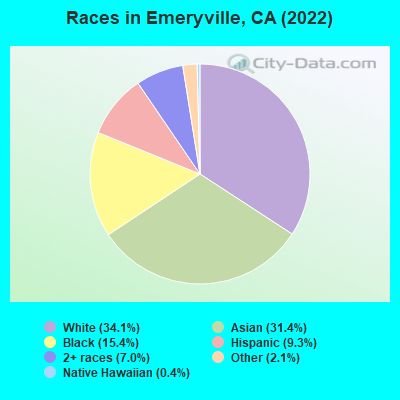
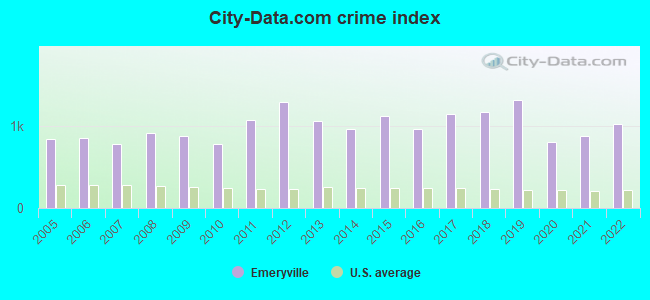
 Recent articles from our blog. Our writers, many of them Ph.D. graduates or candidates, create easy-to-read articles on a wide variety of topics.

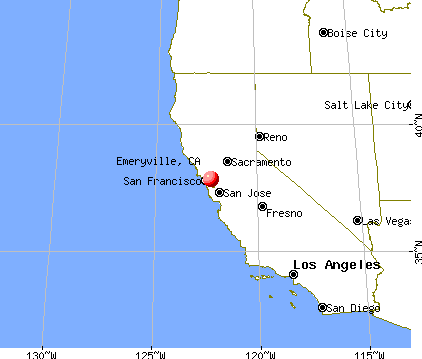
 (2.6 miles
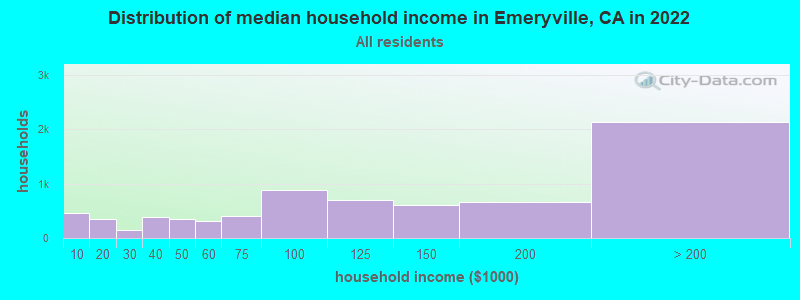
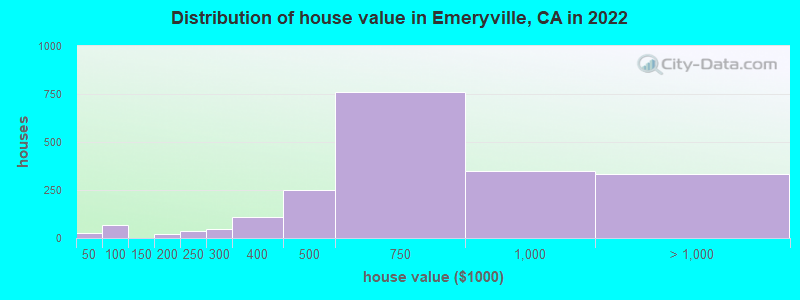
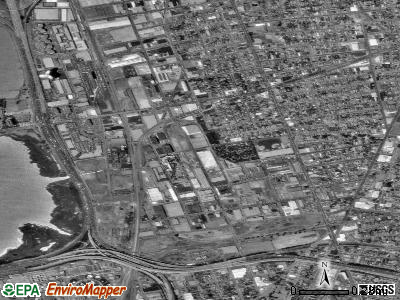
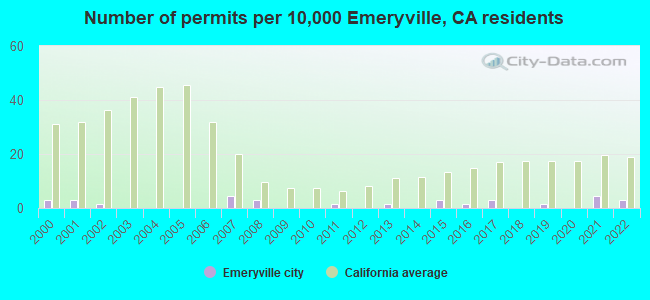
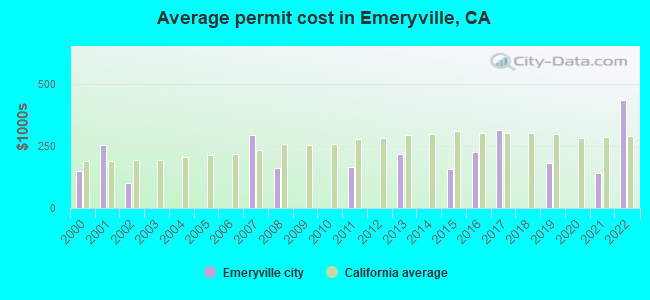
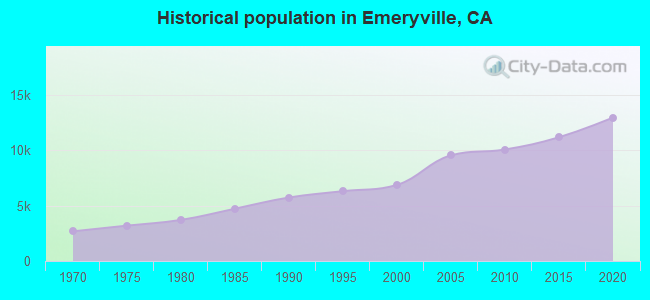
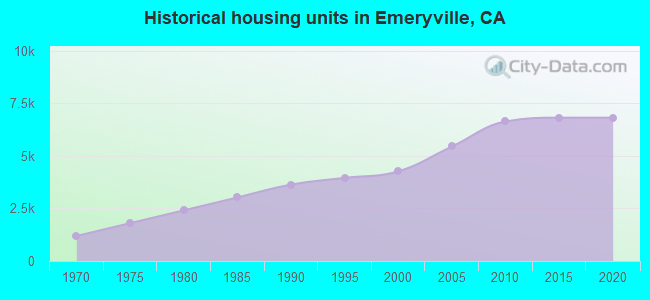
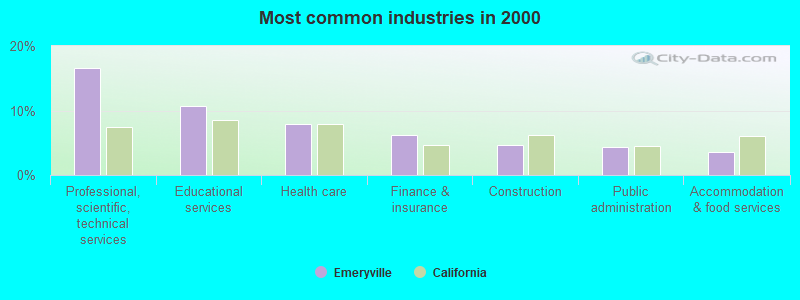
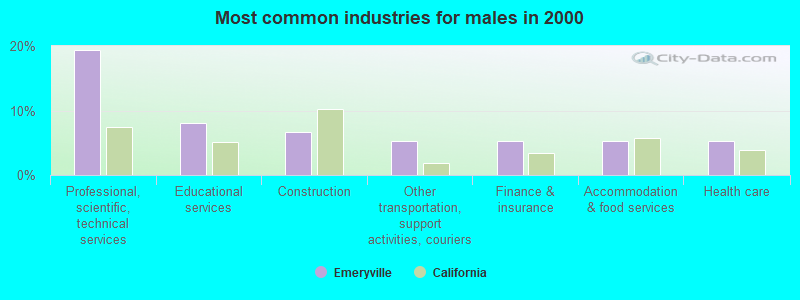
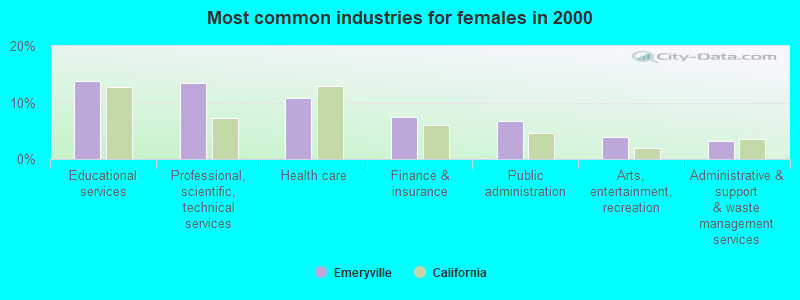
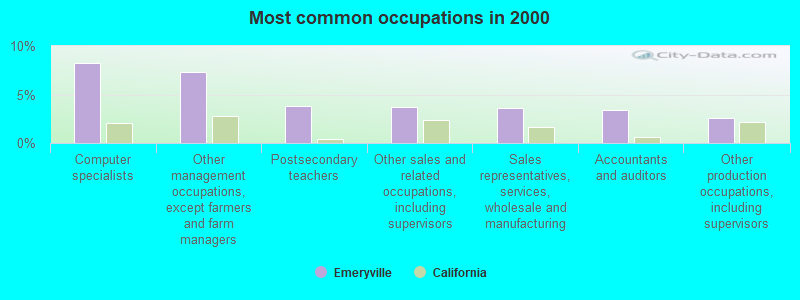
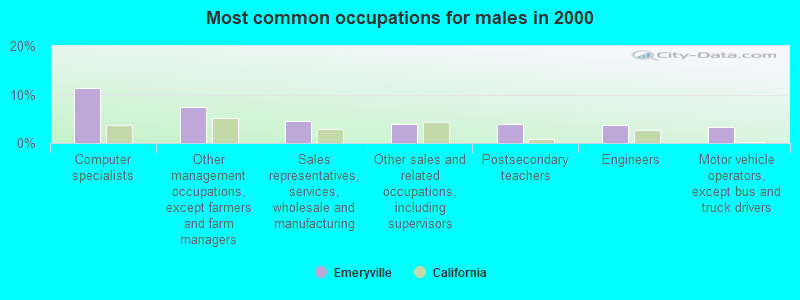
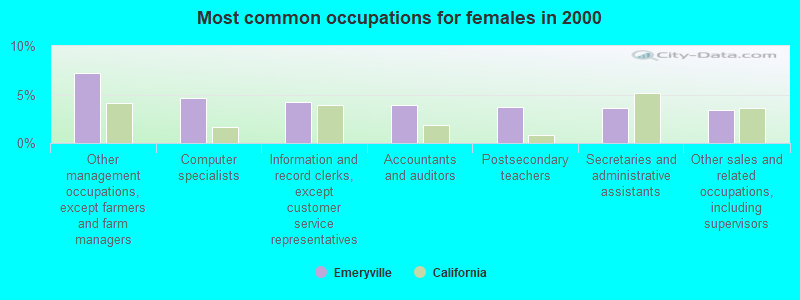
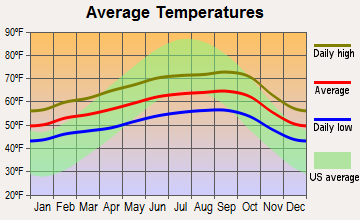
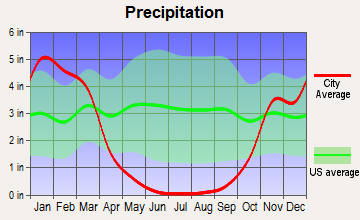
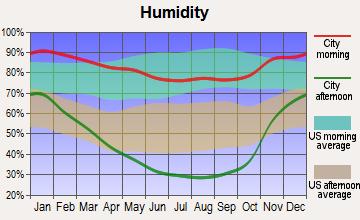
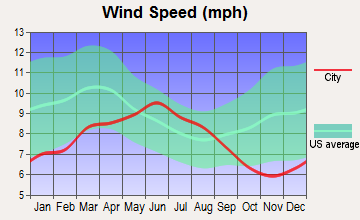
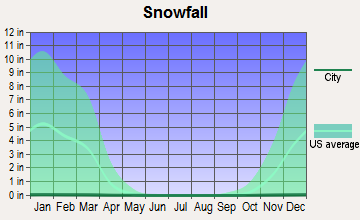
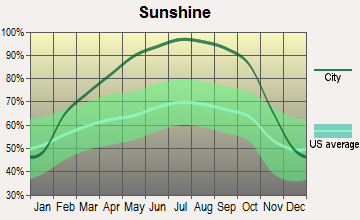
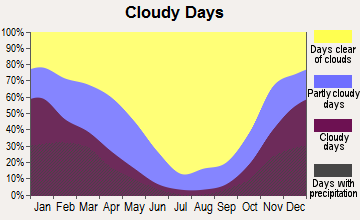


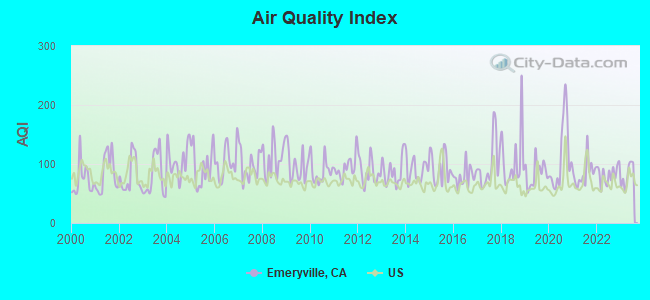
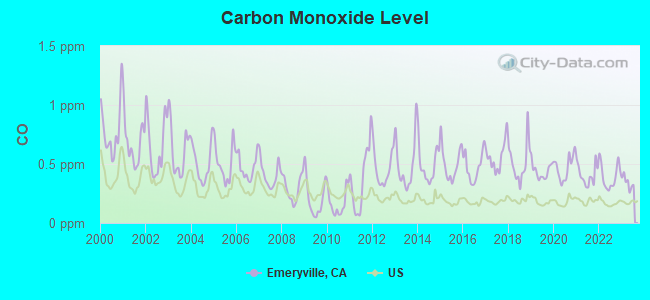
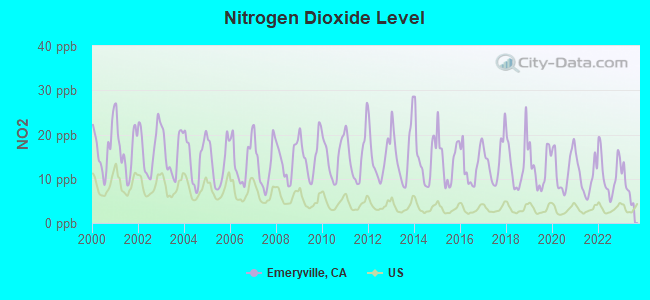
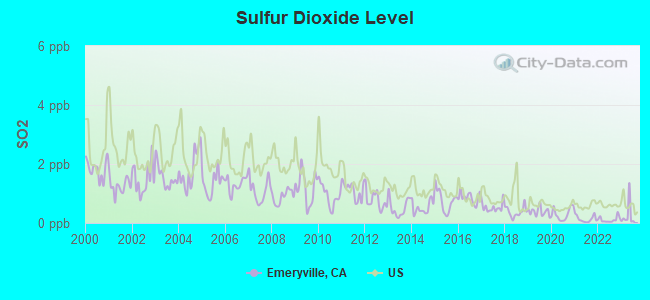
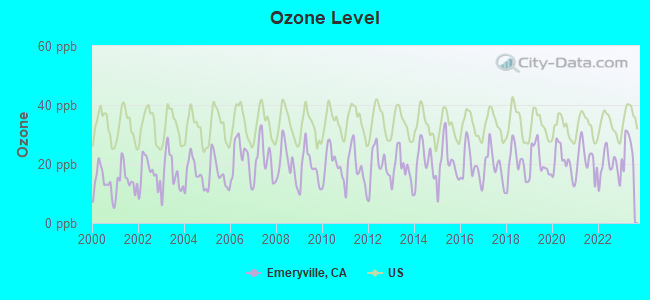
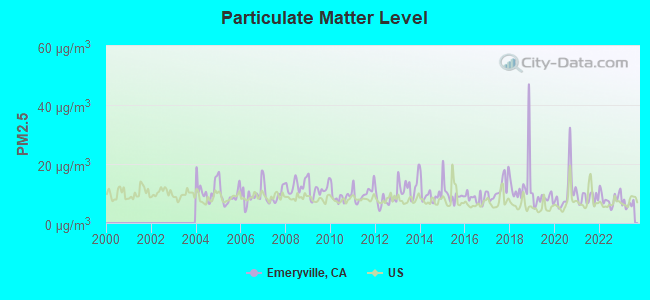
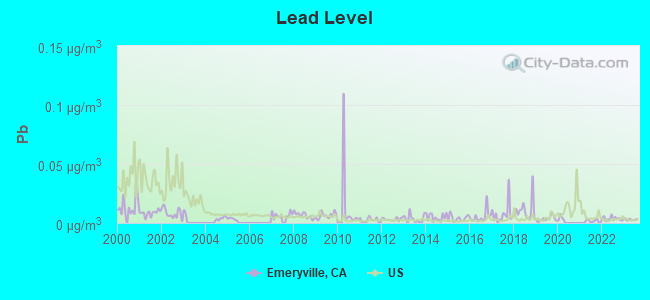

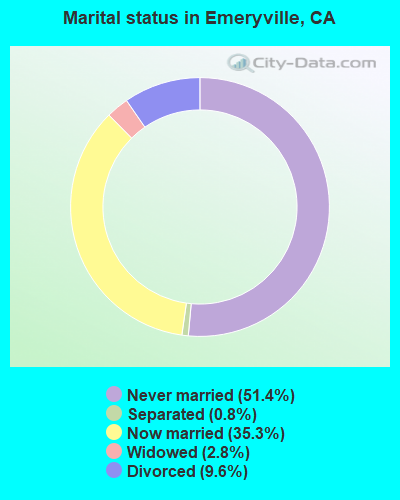
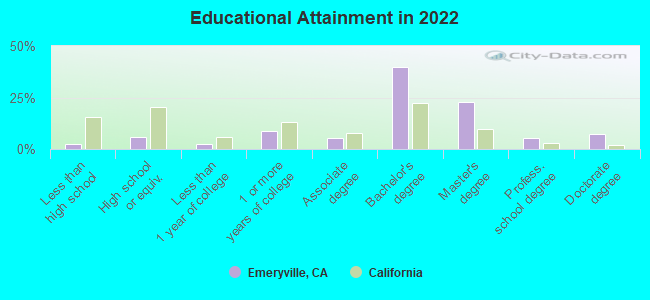
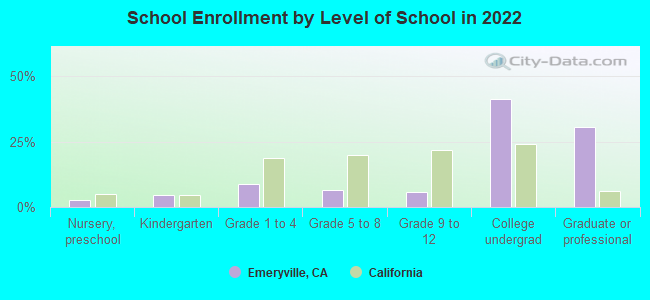
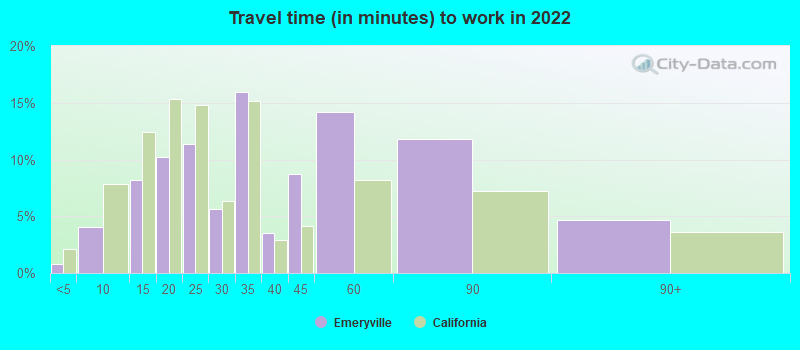
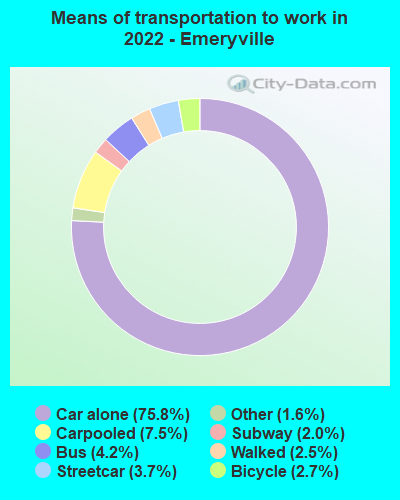
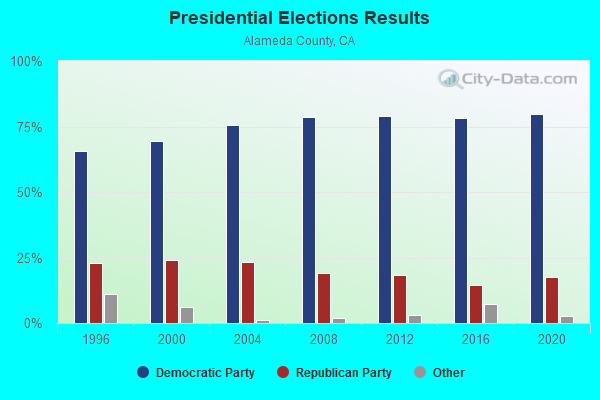
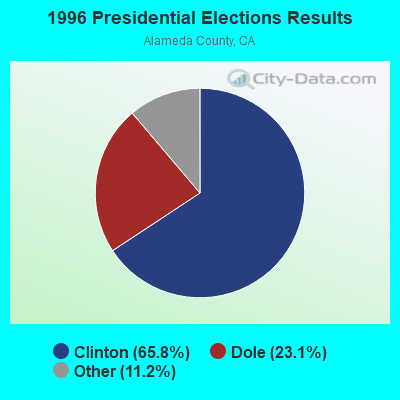
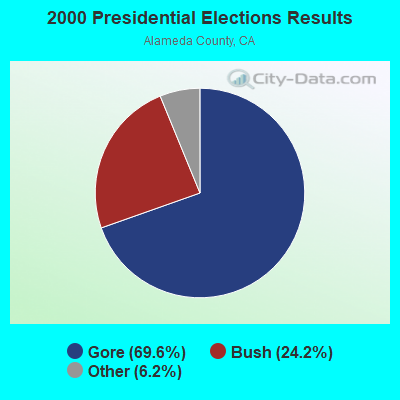
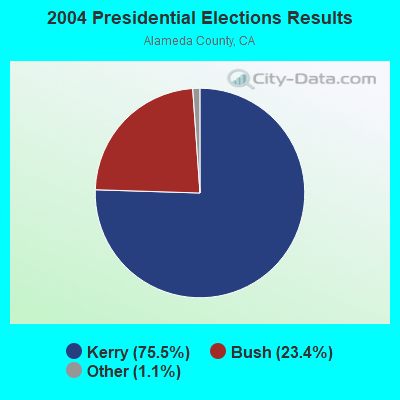
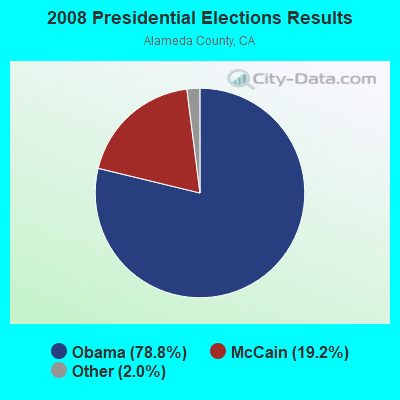

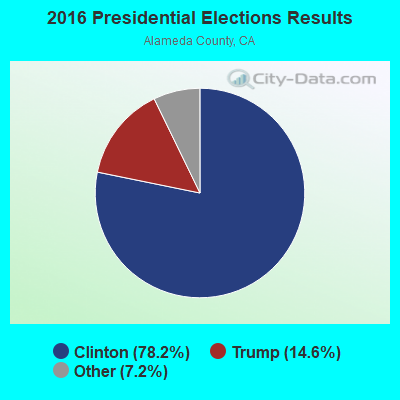
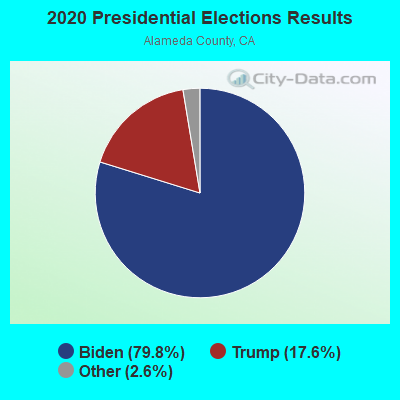
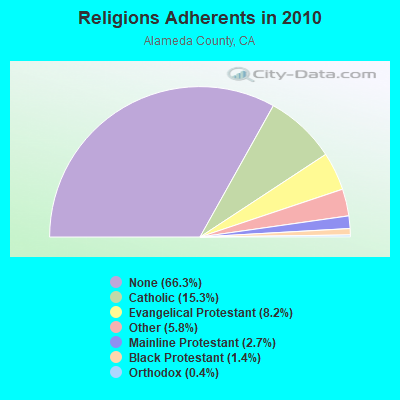
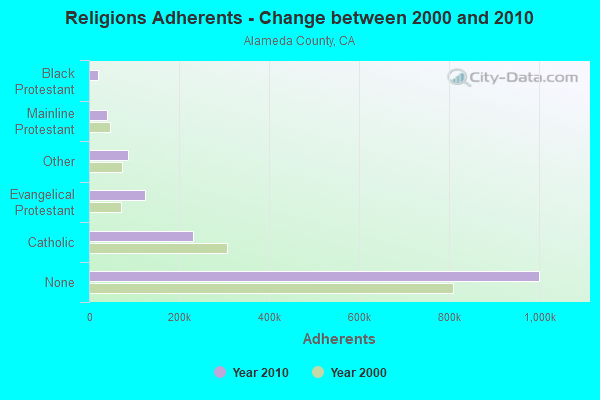
 Based on the data from the years 2005 - 2018 the average number of fire incidents per year is 18. The highest number of reported fire incidents - 63 took place in 2018, and the least - 0 in 2007. The data has an increasing trend.
 When looking into fire subcategories, the most reports belonged to: Outside Fires (42.7%), and Structure Fires (35.7%).