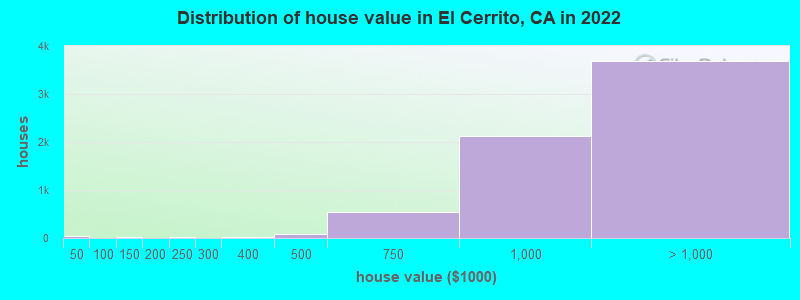
Estimated median house or condo value in 2022: over $1,000,000 (it was $291,400 in 2000)
El Cerrito:
over $1,000,000
CA:
$715,900
Mean prices in 2022:all housing units: over $1,000,000; detached houses: over $1,000,000; townhouses or other attached units: $949,400; in 2-unit structures: $693,350; in 5-or-more-unit structures: over $1,000,000
Median gross rent in 2022: $2,314.
March 2022 cost of living index in El Cerrito: 125.7 (high, U.S. average is 100)
Percentage of residents living in poverty in 2022: 8.1%
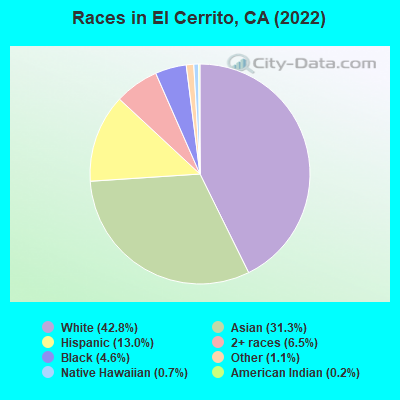
(6.1% for White Non-Hispanic residents, 10.6% for Black residents, 7.1% for Hispanic or Latino residents, 0.6% for American Indian residents, 8.4% for Native Hawaiian and other Pacific Islander residents, 9.2% for other race residents, 5.7% for two or more races residents)
1680.7%Native Hawaiian and Other Pacific Islander alone
390.2%American Indian alone
According to our research of California and other state lists, there were 9 registered sex offenders living in El Cerrito, California as of April 27, 2024. The ratio of all residents to sex offenders in El Cerrito is 2,806 to 1. The ratio of registered sex offenders to all residents in this city is much lower than the state average.
Crime rates in El Cerrito by year
Type
2009
2010
2011
2012
2013
2014
2015
2016
2017
2018
2019
2020
2021
2022
Murders (per 100,000)
0 (0.0)
0 (0.0)
0 (0.0)
0 (0.0)
0 (0.0)
0 (0.0)
1 (4.0)
1 (4.0)
1 (3.9)
0 (0.0)
1 (3.9)
0 (0.0)
0 (0.0)
1 (3.9)
Rapes (per 100,000)
6 (27.1)
2 (8.5)
3 (12.6)
2 (8.3)
0 (0.0)
3 (12.3)
2 (8.1)
6 (23.8)
2 (7.8)
3 (11.6)
4 (15.5)
2 (7.8)
0 (0.0)
1 (3.9)
Robberies (per 100,000)
78 (352.7)
75 (318.5)
58 (243.4)
79 (327.0)
63 (260.5)
43 (175.6)
68 (273.7)
78 (309.3)
93 (361.8)
101 (391.6)
91 (351.9)
57 (221.6)
25 (97.7)
60 (233.3)
Assaults (per 100,000)
72 (325.6)
57 (242.0)
43 (180.5)
47 (194.6)
29 (119.9)
31 (126.6)
26 (104.7)
52 (206.2)
72 (280.1)
67 (259.8)
56 (216.6)
55 (213.8)
30 (117.3)
49 (190.5)
Burglaries (per 100,000)
215 (972.1)
208 (883.3)
228 (956.9)
239 (989.4)
280 (1,158)
158 (645.3)
211 (849.4)
126 (499.6)
164 (638.0)
167 (647.5)
166 (642.0)
129 (501.5)
35 (136.8)
104 (404.4)
Thefts (per 100,000)
611 (2,763)
590 (2,505)
587 (2,464)
635 (2,629)
717 (2,965)
667 (2,724)
899 (3,619)
831 (3,295)
1,100 (4,279)
1,045 (4,051)
1,054 (4,076)
697 (2,709)
408 (1,595)
791 (3,076)
Auto thefts (per 100,000)
103 (465.7)
149 (632.7)
108 (453.3)
148 (612.7)
123 (508.6)
101 (412.5)
121 (487.1)
107 (424.2)
77 (299.6)
102 (395.5)
80 (309.4)
105 (408.2)
51 (199.3)
144 (559.9)
Arson (per 100,000)
14 (63.3)
4 (17.0)
1 (4.2)
1 (4.1)
1 (4.1)
8 (32.7)
2 (8.1)
3 (11.9)
5 (19.5)
9 (34.9)
7 (27.1)
17 (66.1)
4 (15.6)
17 (66.1)
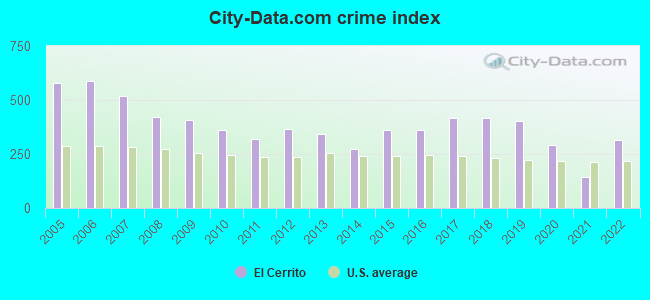
City-Data.com crime index
408.4
363.4
321.0
367.1
342.5
274.9
360.7
361.7
418.4
417.7
401.7
291.6
142.1
315.1
The City-Data.com crime index weighs serious crimes and violent crimes more heavily. Higher means more crime, U.S. average is 246.1. It adjusts for the number of visitors and daily workers commuting into cities.
Latest news from El Cerrito, CA collected exclusively by city-data.com from local newspapers, TV, and radio stations
Ancestries: European (5.1%), German (3.4%), English (3.2%), Russian (2.4%), Italian (2.1%), American (1.9%).
Current Local Time: PST time zone
Elevation: 66 feet
Land area: 3.65 square miles.
Population density: 7,018 people per square mile (high).
8,552 residents are foreign born (22.9% Asia, 4.4% Europe, 3.8% Latin America).
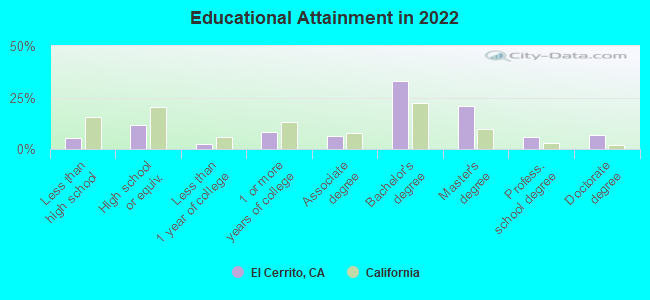
This city:
33.2%
California:
26.5%
Median real estate property taxes paid for housing units with mortgages in 2022: $10,187 (0.9%) Median real estate property taxes paid for housing units with no mortgage in 2022: $6,084 (0.6%)
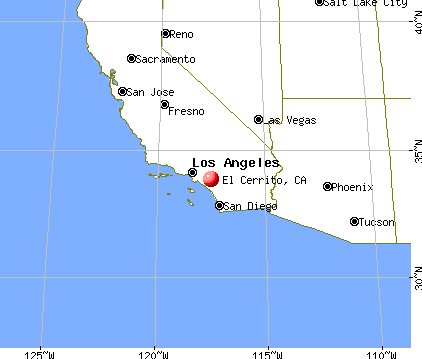
Nearest city with pop. 50,000+: Richmond, CA (2.4 miles , pop. 99,216).
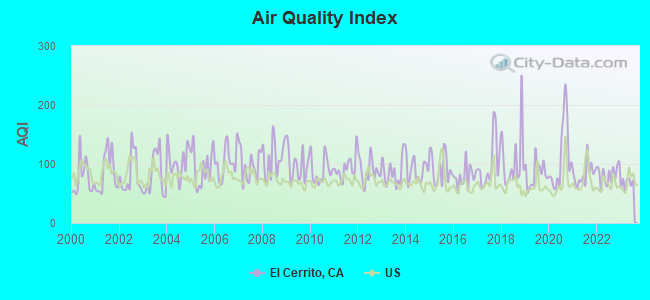
Air Quality Index (AQI) level in 2023 was 67.5. This is about average.
City:
67.5
U.S.:
72.6
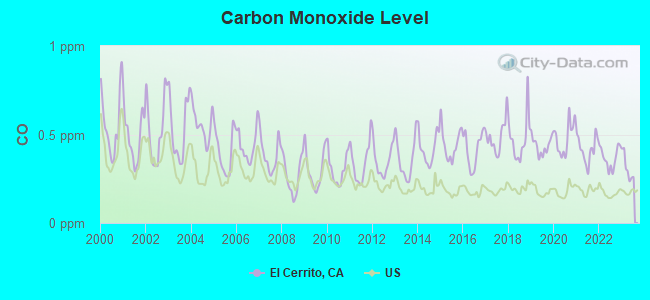
Carbon Monoxide (CO) [ppm] level in 2023 was 0.314. This is worse than average.Closest monitor was 1.9 miles away from the city center.
City:
0.314
U.S.:
0.251
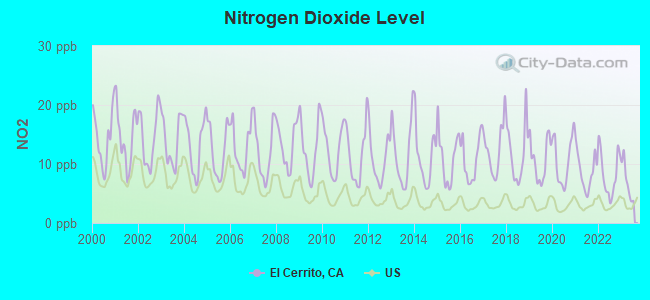
Nitrogen Dioxide (NO2) [ppb] level in 2023 was 7.07. This is worse than average.Closest monitor was 1.9 miles away from the city center.
City:
7.07
U.S.:
5.11
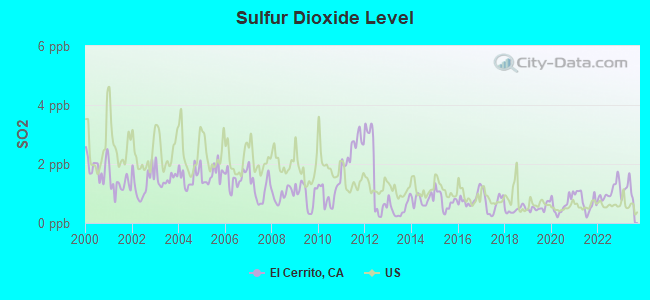
Sulfur Dioxide (SO2) [ppb] level in 2023 was 1.10. This is better than average.Closest monitor was 1.9 miles away from the city center.
City:
1.10
U.S.:
1.51
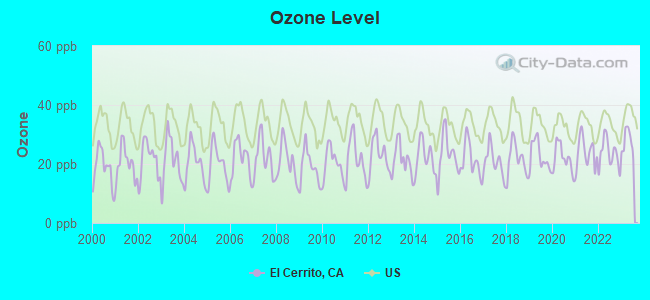
Ozone [ppb] level in 2023 was 27.6. This is better than average.Closest monitor was 2.7 miles away from the city center.
City:
27.6
U.S.:
33.3
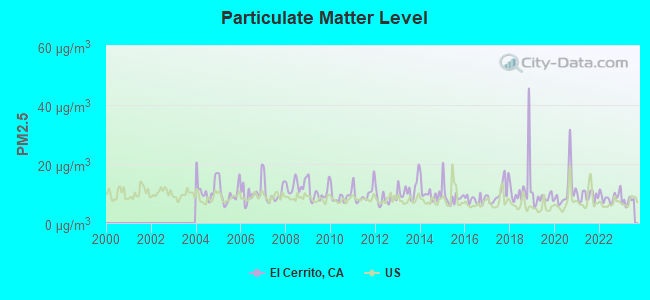
Particulate Matter (PM2.5) [µg/m3] level in 2023 was 7.31. This is about average.Closest monitor was 3.6 miles away from the city center.
City:
7.31
U.S.:
8.11
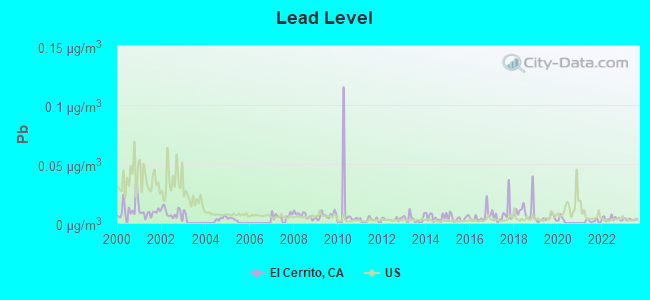
Lead (Pb) [µg/m3] level in 2023 was 0.00290. This is significantly better than average.Closest monitor was 2.7 miles away from the city center.
City:
0.00290
U.S.:
0.00931
Earthquake activity:
El Cerrito-area historical earthquake activity is significantly above California state average. It is 7520% greater than the overall U.S. average.
On 4/18/1906 at 13:12:21, a magnitude 7.9 (7.9 UK, Class: Major, Intensity: VIII - XII) earthquake occurred 38.3 miles away from El Cerrito center, causing $524,000,000 total damage On 10/18/1989 at 00:04:15, a magnitude 7.1 (6.5 MB, 7.1 MS, 6.9 MW, 7.0 ML) earthquake occurred 63.1 miles away from the city center, causing 62 deaths (62 shaking deaths) and 3757 injuries, causing $1,305,032,704 total damage On 11/4/1927 at 13:51:53, a magnitude 7.5 (7.5 UK) earthquake occurred 219.4 miles away from the city center On 7/21/1952 at 11:52:14, a magnitude 7.7 (7.7 UK) earthquake occurred 272.9 miles away from El Cerrito center, causing $50,000,000 total damage On 1/31/1922 at 13:17:28, a magnitude 7.6 (7.6 UK) earthquake occurred 259.3 miles away from El Cerrito center On 4/25/1992 at 18:06:04, a magnitude 7.2 (6.3 MB, 7.1 MS, 7.2 MW, 7.1 MW, Depth: 9.4 mi) earthquake occurred 193.0 miles away from El Cerrito center, causing $75,000,000 total damage Magnitude types: body-wave magnitude (MB), local magnitude (ML), surface-wave magnitude (MS), moment magnitude (MW)
Natural disasters:
The number of natural disasters in Contra Costa County (18) is near the US average (15). Major Disasters (Presidential) Declared: 11 Emergencies Declared: 3
Causes of natural disasters: Floods: 13, Storms: 7, Winter Storms: 7, Mudslides: 5, Landslides: 4, Drought: 1, Earthquake: 1, Hurricane: 1, Tornado: 1, Wind: 1, Other: 1 (Note: some incidents may be assigned to more than one category).
Hospitals and medical centers in El Cerrito:
CARLSON CONV HOSP (3230 CARLSON BLVD)
SHIELDS NURSING CENTER (3230 CARLSON BLVD.)
EL CERRITO DIALYSIS CENTER (10690 SAN PABLO AVENUE)
Amtrak stations near El Cerrito:
3 miles: RICHMOND (16TH ST. & MACDONALD AVE.) . Services: fully wheelchair accessible, enclosed waiting area, public restrooms, public payphones, free short-term parking, call for taxi service, public transit connection.
4 miles: BERKELEY (3RD ST. & UNIVERSITY AVE.) . Services: partially wheelchair accessible, public payphones, free short-term parking, free long-term parking, call for taxi service, public transit connection.
6 miles: EMERYVILLE (5885 LANDREGAN ST.) . Services: ticket office, fully wheelchair accessible, enclosed waiting area, public restrooms, public payphones, snack bar, free short-term parking, free long-term parking, call for taxi service, public transit connection.
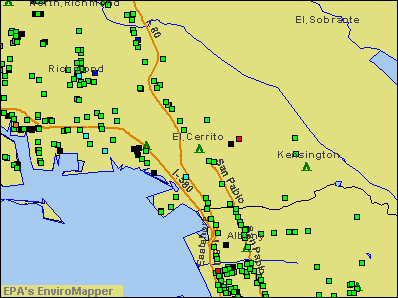
Notable locations in El Cerrito: Mira Vista Country Club (A), Veterans Memorial Building (B), El Cerrito Fire Department Station 72 (C), El Cerrito City Hall (D), El Cerrito Branch Contra Costa County Library (E), El Cerrito Plaza Station (F), El Cerrito Del Norte Station (G), Contra Costa Civic Theatre (H), Cavalry Ambulance (I), Riverside County Fire Department Station 15 El Cerrito (J). Display/hide their locations on the map
Churches in El Cerrito include: Saint Patricks Episcopal Church (A), Saint John the Baptist Catholic Church (B), Saint Jerome Roman Catholic Church (C), Kingdom Hall of Jehovahs Witnesses (D), Grace Lutheran Church (E), El Cerrito United Methodist Church (F), El Cerrito Evangelical Free Church (G), Christ Lutheran Church (H), Berkeley Free Methodist Church (I). Display/hide their locations on the map
Parks in El Cerrito include: Poinsett Park (1), Tassajara Park (2), Cerrito Vista Park (3), Arlington Park (4), Casa Cerrito Park (5), Castro Park (6), El Cerrito Community Swim Center (7), Hillside Natural Area (8), Canyon Trail Park (9). Display/hide their locations on the map
Birthplace of: Eric Allman - (1959-), originator of sendmail, Kim Gillan - Politician.
Contra Costa County has a predicted average indoor radon screening level between 2 and 4 pCi/L (pico curies per liter) - Moderate Potential
Average household size:
This city:
2.3 people
California:
2.9 people
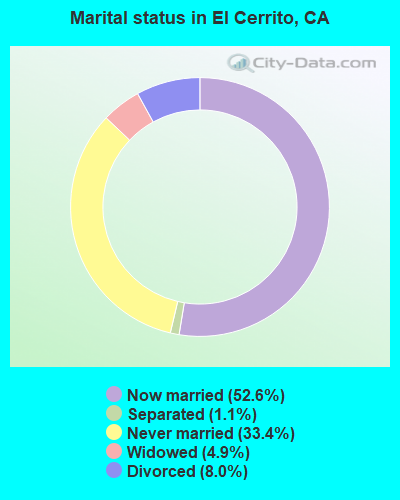
Percentage of family households:
This city:
60.8%
Whole state:
68.7%
Percentage of households with unmarried partners:
This city:
6.9%
Whole state:
7.2%
Likely homosexual households (counted as self-reported same-sex unmarried-partner households)
Lesbian couples: 1.2% of all households
Gay men: 0.7% of all households
People in group quarters in El Cerrito in 2010:
43 people in nursing facilities/skilled-nursing facilities
25 people in workers' group living quarters and job corps centers
9 people in group homes intended for adults
8 people in other noninstitutional facilities
6 people in college/university student housing
2 people in in-patient hospice facilities
People in group quarters in El Cerrito in 2000:
106 people in other noninstitutional group quarters
41 people in nursing homes
21 people in other group homes
8 people in religious group quarters
Banks with branches in El Cerrito (2011 data):
JPMorgan Chase Bank, National Association: El Cerrito Plaza Lucky Branch at 1000 El Cerrito Plaza`, branch established on 2011/05/31; San Pablo Avenue Branch at 9950 San Pablo Avenue, branch established on 1988/12/27. Info updated 2011/11/10: Bank assets: $1,811,678.0 mil, Deposits: $1,190,738.0 mil, headquarters in Columbus, OH, positive income, International Specialization, 5577 total offices, Holding Company: Jpmorgan Chase & Co.
Wells Fargo Bank, National Association: El Cerrito Plaza Lucky Banking Cente at 1000 El Cerrito Plaza, branch established on 2011/05/31; El Cerrito Plaza Branch at 9800 San Pablo Avenue, branch established on 1965/09/20. Info updated 2011/04/05: Bank assets: $1,161,490.0 mil, Deposits: $905,653.0 mil, headquarters in Sioux Falls, SD, positive income, 6395 total offices, Holding Company: Wells Fargo & Company
Bank of America, National Association: El Cerrito Branch at 10422 San Pablo Avenue, branch established on 1948/10/18. Info updated 2009/11/18: Bank assets: $1,451,969.3 mil, Deposits: $1,077,176.8 mil, headquarters in Charlotte, NC, positive income, 5782 total offices, Holding Company: Bank Of America Corporation
Citibank, National Association: 280 El Cerrito Plaza Branch at 280 El Cerrito Plaza, branch established on 1945/01/01. Info updated 2012/01/10: Bank assets: $1,288,658.0 mil, Deposits: $882,541.0 mil, headquarters in Sioux Falls, SD, positive income, International Specialization, 1048 total offices, Holding Company: Citigroup Inc.
Mechanics Bank: El Cerrito Branch at 9996 San Pablo Avenue, branch established on 1927/04/04. Info updated 2011/03/24: Bank assets: $2,991.7 mil, Deposits: $2,573.6 mil, headquarters in Richmond, CA, positive income, Commercial Lending Specialization, 31 total offices
Bank of the West: El Cerrito Branch at 11100 San Pablo Avenue, branch established on 1949/10/29. Info updated 2009/11/16: Bank assets: $62,408.3 mil, Deposits: $43,995.2 mil, headquarters in San Francisco, CA, positive income, 647 total offices, Holding Company: Bnp Paribas
Religion statistics for El Cerrito, CA (based on Contra Costa County data)
Religion
Adherents
Congregations
Catholic
228,400
34
Evangelical Protestant
81,120
352
Other
48,553
123
Mainline Protestant
32,693
101
Black Protestant
10,395
34
Orthodox
2,435
8
None
645,429
-
Source: Clifford Grammich, Kirk Hadaway, Richard Houseal, Dale E.Jones, Alexei Krindatch, Richie Stanley and Richard H.Taylor. 2012. 2010 U.S.Religion Census: Religious Congregations & Membership Study. Association of Statisticians of American Religious Bodies. Jones, Dale E., et al. 2002. Congregations and Membership in the United States 2000. Nashville, TN: Glenmary Research Center. Graphs represent county-level data
Aircraft: PIPER PA-28-151 (Category: Land, Seats: 4, Weight: Up to 12,499 Pounds, Speed: 80 mph), Engine: LYCOMING 0-320 SERIES (180 HP) (Reciprocating) N-Number: 43434, N43434, N-43434, Serial Number: 28-7415491, Year manufactured: 1974, Airworthiness Date: 05/17/1974, Certificate Issue Date: 03/11/2019 Registrant (LLC): Bg Partners LLC, 1323 Lawrence St, El Cerrito, CA 94530
Aircraft: CESSNA 414 (Category: Land, Engines: 2, Seats: 7, Weight: Up to 12,499 Pounds, Speed: 198 mph), Engine: CONT MOTOR TSIO-520 SER (300 HP) (Reciprocating) N-Number: 4765G, N4765G, N-4765G, Serial Number: 414-0940, Year manufactured: 1977, Airworthiness Date: 08/18/1985, Certificate Issue Date: 09/23/2014 Registrant (LLC): Aircraft Charter And Leasing LLC, 6500 Fairmount Ave Ste #2, El Cerrito, CA 94530
Aircraft: CESSNA 140 (Category: Land, Seats: 2, Weight: Up to 12,499 Pounds, Speed: 105 mph), Engine: CONT MOTOR C85 SERIES (85 HP) (Reciprocating) N-Number: 76415, N76415, N-76415, Serial Number: 10841, Year manufactured: 1946, Certificate Issue Date: 07/16/2019 Registrant (Individual): David C Sprinkle, 700 Everett St, El Cerrito, CA 94530
Aircraft: AERONCA 0-58B (Category: Land, Seats: 2, Weight: Up to 12,499 Pounds, Speed: 71 mph), Engine: CONT MOTOR A&C65 SERIES (65 HP) (Reciprocating) N-Number: 48619, N48619, N-48619, Serial Number: 058B4292, Year manufactured: 1943 Registrant (Individual): Bob Kellog, 7508 Fairmount, El Cerrito, CA 94530 Deregistered:Cancel Date: 09/20/2019
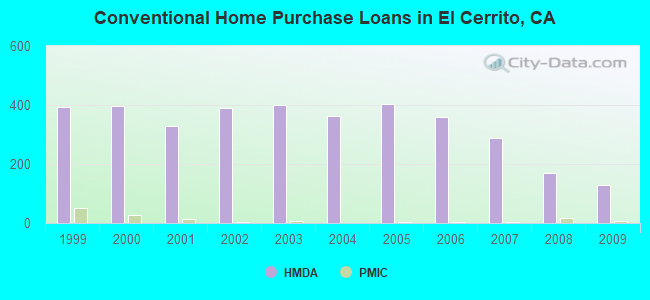
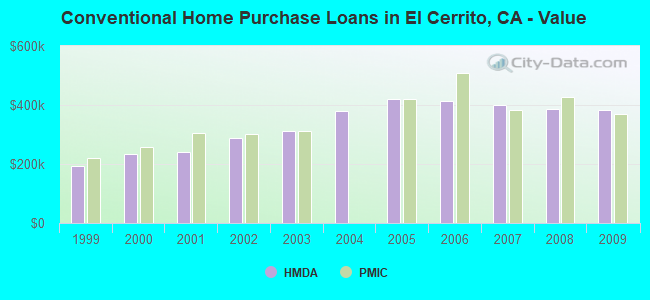
Home Mortgage Disclosure Act Aggregated Statistics For Year 2009 (Based on 9 full and 1 partial tracts)
A) FHA, FSA/RHS & VA Home Purchase Loans
B) Conventional Home Purchase Loans
C) Refinancings
D) Home Improvement Loans
E) Loans on Dwellings For 5+ Families
F) Non-occupant Loans on < 5 Family Dwellings (A B C & D)
Number
Average Value
Number
Average Value
Number
Average Value
Number
Average Value
Number
Average Value
Number
Average Value
LOANS ORIGINATED
24
$517,607
129
$384,262
826
$329,844
34
$254,504
1
$325,000
42
$302,516
APPLICATIONS APPROVED, NOT ACCEPTED
5
$430,904
24
$391,582
95
$385,339
7
$299,003
0
$0
12
$333,469
APPLICATIONS DENIED
5
$546,918
16
$373,021
163
$392,324
10
$238,563
0
$0
18
$287,017
APPLICATIONS WITHDRAWN
1
$405,000
16
$436,651
121
$325,214
8
$186,594
0
$0
10
$278,527
FILES CLOSED FOR INCOMPLETENESS
2
$461,065
4
$425,505
48
$318,787
2
$68,500
0
$0
2
$367,000
Aggregated Statistics For Year 2008 (Based on 9 full and 1 partial tracts)
A) FHA, FSA/RHS & VA Home Purchase Loans
B) Conventional Home Purchase Loans
C) Refinancings
D) Home Improvement Loans
E) Loans on Dwellings For 5+ Families
F) Non-occupant Loans on < 5 Family Dwellings (A B C & D)
G) Loans On Manufactured Home Dwelling (A B C & D)
Number
Average Value
Number
Average Value
Number
Average Value
Number
Average Value
Number
Average Value
Number
Average Value
Number
Average Value
LOANS ORIGINATED
8
$547,008
170
$386,699
243
$340,432
21
$197,158
4
$678,750
35
$319,980
0
$0
APPLICATIONS APPROVED, NOT ACCEPTED
1
$299,010
23
$351,292
57
$371,025
3
$83,637
0
$0
11
$309,550
1
$80,000
APPLICATIONS DENIED
2
$387,945
30
$383,538
121
$403,357
17
$156,610
1
$520,000
13
$363,767
1
$187,240
APPLICATIONS WITHDRAWN
1
$590,050
18
$407,124
69
$384,974
4
$67,340
2
$2,725,000
6
$447,598
0
$0
FILES CLOSED FOR INCOMPLETENESS
0
$0
5
$382,542
26
$420,154
1
$100,000
0
$0
1
$372,060
0
$0
Aggregated Statistics For Year 2007 (Based on 9 full and 1 partial tracts)
B) Conventional Home Purchase Loans
C) Refinancings
D) Home Improvement Loans
E) Loans on Dwellings For 5+ Families
F) Non-occupant Loans on < 5 Family Dwellings (A B C & D)
G) Loans On Manufactured Home Dwelling (A B C & D)
Number
Average Value
Number
Average Value
Number
Average Value
Number
Average Value
Number
Average Value
Number
Average Value
LOANS ORIGINATED
289
$399,813
389
$371,407
80
$215,332
10
$884,179
59
$357,609
0
$0
APPLICATIONS APPROVED, NOT ACCEPTED
61
$442,454
90
$354,975
11
$301,707
0
$0
11
$350,107
0
$0
APPLICATIONS DENIED
70
$458,776
183
$465,603
32
$206,234
0
$0
33
$352,627
1
$28,000
APPLICATIONS WITHDRAWN
34
$441,596
89
$414,832
12
$323,001
2
$1,500,000
20
$363,070
0
$0
FILES CLOSED FOR INCOMPLETENESS
13
$437,020
29
$301,829
5
$275,256
0
$0
3
$353,100
0
$0
Aggregated Statistics For Year 2006 (Based on 9 full and 1 partial tracts)
B) Conventional Home Purchase Loans
C) Refinancings
D) Home Improvement Loans
E) Loans on Dwellings For 5+ Families
F) Non-occupant Loans on < 5 Family Dwellings (A B C & D)
Number
Average Value
Number
Average Value
Number
Average Value
Number
Average Value
Number
Average Value
LOANS ORIGINATED
360
$415,071
464
$371,586
91
$203,305
8
$541,105
101
$390,374
APPLICATIONS APPROVED, NOT ACCEPTED
57
$400,374
88
$368,130
14
$256,680
0
$0
23
$369,848
APPLICATIONS DENIED
76
$448,876
177
$422,773
34
$288,816
1
$250,000
24
$436,175
APPLICATIONS WITHDRAWN
47
$513,204
96
$397,029
15
$258,300
0
$0
10
$415,530
FILES CLOSED FOR INCOMPLETENESS
12
$371,841
20
$345,643
3
$207,187
0
$0
1
$550,000
Aggregated Statistics For Year 2005 (Based on 9 full and 1 partial tracts)
A) FHA, FSA/RHS & VA Home Purchase Loans
B) Conventional Home Purchase Loans
C) Refinancings
D) Home Improvement Loans
E) Loans on Dwellings For 5+ Families
F) Non-occupant Loans on < 5 Family Dwellings (A B C & D)
Number
Average Value
Number
Average Value
Number
Average Value
Number
Average Value
Number
Average Value
Number
Average Value
LOANS ORIGINATED
1
$63,640
404
$419,107
645
$359,367
77
$268,691
11
$669,825
115
$368,840
APPLICATIONS APPROVED, NOT ACCEPTED
0
$0
61
$347,359
107
$373,552
9
$174,086
0
$0
8
$334,105
APPLICATIONS DENIED
0
$0
87
$382,742
164
$388,410
30
$270,552
0
$0
22
$360,778
APPLICATIONS WITHDRAWN
0
$0
57
$411,655
137
$347,197
15
$137,711
1
$697,370
11
$310,690
FILES CLOSED FOR INCOMPLETENESS
1
$158,000
10
$483,400
35
$400,036
2
$85,250
1
$1,200,000
7
$302,630
Aggregated Statistics For Year 2004 (Based on 9 full and 1 partial tracts)
B) Conventional Home Purchase Loans
C) Refinancings
D) Home Improvement Loans
E) Loans on Dwellings For 5+ Families
F) Non-occupant Loans on < 5 Family Dwellings (A B C & D)
G) Loans On Manufactured Home Dwelling (A B C & D)
Number
Average Value
Number
Average Value
Number
Average Value
Number
Average Value
Number
Average Value
Number
Average Value
LOANS ORIGINATED
364
$378,499
801
$313,689
63
$245,246
9
$570,701
99
$300,800
0
$0
APPLICATIONS APPROVED, NOT ACCEPTED
59
$360,170
123
$297,167
10
$198,156
0
$0
17
$298,503
0
$0
APPLICATIONS DENIED
66
$365,118
188
$332,947
33
$185,186
1
$634,000
24
$314,097
1
$5,000
APPLICATIONS WITHDRAWN
46
$390,253
176
$306,109
14
$260,774
0
$0
13
$382,506
0
$0
FILES CLOSED FOR INCOMPLETENESS
7
$267,420
52
$309,766
2
$205,000
0
$0
2
$310,900
0
$0
Aggregated Statistics For Year 2003 (Based on 9 full and 1 partial tracts)
A) FHA, FSA/RHS & VA Home Purchase Loans
B) Conventional Home Purchase Loans
C) Refinancings
D) Home Improvement Loans
E) Loans on Dwellings For 5+ Families
F) Non-occupant Loans on < 5 Family Dwellings (A B C & D)
Number
Average Value
Number
Average Value
Number
Average Value
Number
Average Value
Number
Average Value
Number
Average Value
LOANS ORIGINATED
1
$285,000
399
$312,566
2,031
$248,650
25
$79,365
9
$2,164,676
183
$243,883
APPLICATIONS APPROVED, NOT ACCEPTED
0
$0
37
$295,291
269
$251,489
15
$104,407
0
$0
24
$238,543
APPLICATIONS DENIED
0
$0
57
$319,613
231
$270,840
16
$89,685
0
$0
27
$262,129
APPLICATIONS WITHDRAWN
0
$0
43
$305,252
284
$275,646
2
$33,600
0
$0
19
$204,170
FILES CLOSED FOR INCOMPLETENESS
0
$0
18
$368,899
35
$286,333
1
$20,000
1
$850,000
8
$312,936
Aggregated Statistics For Year 2002 (Based on 9 full and 1 partial tracts)
A) FHA, FSA/RHS & VA Home Purchase Loans
B) Conventional Home Purchase Loans
C) Refinancings
D) Home Improvement Loans
E) Loans on Dwellings For 5+ Families
F) Non-occupant Loans on < 5 Family Dwellings (A B C & D)
Number
Average Value
Number
Average Value
Number
Average Value
Number
Average Value
Number
Average Value
Number
Average Value
LOANS ORIGINATED
2
$84,245
391
$287,341
1,451
$242,519
30
$55,745
8
$689,236
135
$232,986
APPLICATIONS APPROVED, NOT ACCEPTED
0
$0
27
$335,527
207
$247,994
13
$56,542
0
$0
8
$166,595
APPLICATIONS DENIED
0
$0
37
$265,200
151
$265,934
11
$169,855
3
$673,667
20
$240,530
APPLICATIONS WITHDRAWN
1
$159,590
42
$307,899
175
$226,823
2
$52,000
0
$0
12
$217,104
FILES CLOSED FOR INCOMPLETENESS
0
$0
23
$259,383
69
$234,863
1
$94,560
0
$0
6
$202,500
Aggregated Statistics For Year 2001 (Based on 9 full and 1 partial tracts)
A) FHA, FSA/RHS & VA Home Purchase Loans
B) Conventional Home Purchase Loans
C) Refinancings
D) Home Improvement Loans
E) Loans on Dwellings For 5+ Families
F) Non-occupant Loans on < 5 Family Dwellings (A B C & D)
Number
Average Value
Number
Average Value
Number
Average Value
Number
Average Value
Number
Average Value
Number
Average Value
LOANS ORIGINATED
0
$0
330
$241,122
937
$239,237
62
$50,001
6
$478,318
76
$228,136
APPLICATIONS APPROVED, NOT ACCEPTED
0
$0
36
$240,913
114
$218,584
16
$55,402
0
$0
7
$208,699
APPLICATIONS DENIED
0
$0
47
$231,348
129
$247,935
22
$49,746
2
$8,444,140
13
$205,475
APPLICATIONS WITHDRAWN
1
$296,000
26
$208,337
117
$239,618
16
$85,056
0
$0
11
$238,718
FILES CLOSED FOR INCOMPLETENESS
0
$0
15
$291,471
44
$220,487
1
$425,910
0
$0
5
$173,912
Aggregated Statistics For Year 2000 (Based on 9 full and 1 partial tracts)
A) FHA, FSA/RHS & VA Home Purchase Loans
B) Conventional Home Purchase Loans
C) Refinancings
D) Home Improvement Loans
E) Loans on Dwellings For 5+ Families
F) Non-occupant Loans on < 5 Family Dwellings (A B C & D)
Number
Average Value
Number
Average Value
Number
Average Value
Number
Average Value
Number
Average Value
Number
Average Value
LOANS ORIGINATED
0
$0
397
$232,331
204
$194,266
64
$43,895
8
$440,130
54
$202,980
APPLICATIONS APPROVED, NOT ACCEPTED
0
$0
46
$177,162
22
$156,471
17
$31,344
0
$0
9
$171,134
APPLICATIONS DENIED
2
$142,200
37
$241,264
82
$189,226
21
$72,373
1
$365,880
14
$206,095
APPLICATIONS WITHDRAWN
0
$0
31
$262,696
55
$154,928
10
$60,006
1
$550,000
5
$236,418
FILES CLOSED FOR INCOMPLETENESS
0
$0
10
$190,093
34
$184,085
1
$14,690
0
$0
3
$281,967
Aggregated Statistics For Year 1999 (Based on 8 full and 3 partial tracts)
A) FHA, FSA/RHS & VA Home Purchase Loans
B) Conventional Home Purchase Loans
C) Refinancings
D) Home Improvement Loans
E) Loans on Dwellings For 5+ Families
F) Non-occupant Loans on < 5 Family Dwellings (A B C & D)
2005 - 2018 National Fire Incident Reporting System (NFIRS) incidents
Based on the data from the years 2005 - 2018 the average number of fires per year is 56. The highest number of reported fires - 87 took place in 2005, and the least - 30 in 2012. The data has a decreasing trend.
When looking into fire subcategories, the most reports belonged to: Structure Fires (51.7%), and Outside Fires (30.1%).
Fire incident types reported to NFIRS in El Cerrito, CA
#26 on the list of "Top 101 cities with largest percentage of females in occupations: life, physical, and social science occupations (population 5,000+)"
#32 on the list of "Top 101 cities with the largest percentage of likely lesbian couples (counted as self-reported female-female unmarried-partner households) (population 5,000+)"
#32 on the list of "Top 101 cities with the most residents born in Other Northern Africa (population 500+)"
#43 on the list of "Top 101 cities with largest percentage of males in occupations: life, physical, and social science occupations (population 5,000+)"
#51 on the list of "Top 101 cities with the most residents born in Other Eastern Asia (population 500+)"
#60 on the list of "Top 101 cities with the largest percentage of elementary and middle school students in private schools (1,000+ students)"
#62 on the list of "Top 101 cities with the largest percentage of likely homosexual households (counted as self-reported same-sex unmarried-partner households) (population 5,000+)"
#77 on the list of "Top 101 cities with the most residents born in China (population 500+)"
#82 on the list of "Top 101 cities with the most residents born in Hong Kong (population 500+)"
#88 on the list of "Top 101 cities with the most people taking subway or elevated to work (population 5,000+)"
#95 on the list of "Top 101 cities with the most residents born in China, excluding Hong Kong and Taiwan (population 500+)"
#10 on the list of "Top 101 counties with the largest increase in the number of infant deaths per 1000 residents 2000-2006 to 2007-2013 (pop. 50,000+)"
#15 on the list of "Top 101 counties with the lowest Sulfur Oxides Annual air pollution readings in 2012 (µg/m3)"
#17 on the list of "Top 101 counties with the highest Nitrogen Dioxide air pollution readings in 2012 (ppm)"
#31 on the list of "Top 101 counties with the highest percentage of residents that drank alcohol in the past 30 days"
#34 on the list of "Top 101 counties with the highest surface withdrawal of fresh water for public supply (pop. 50,000+)"


 Recent articles from our blog. Our writers, many of them Ph.D. graduates or candidates, create easy-to-read articles on a wide variety of topics.

 (2.4 miles


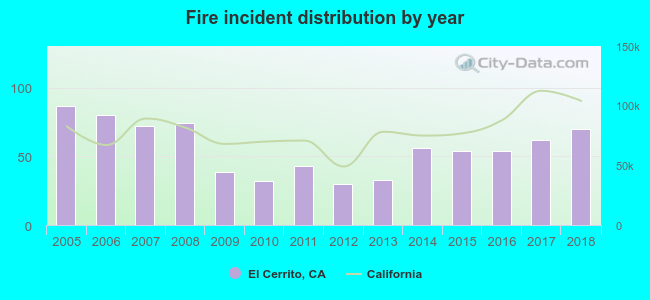 Based on the data from the years 2005 - 2018 the average number of fires per year is 56. The highest number of reported fires - 87 took place in 2005, and the least - 30 in 2012. The data has a decreasing trend.
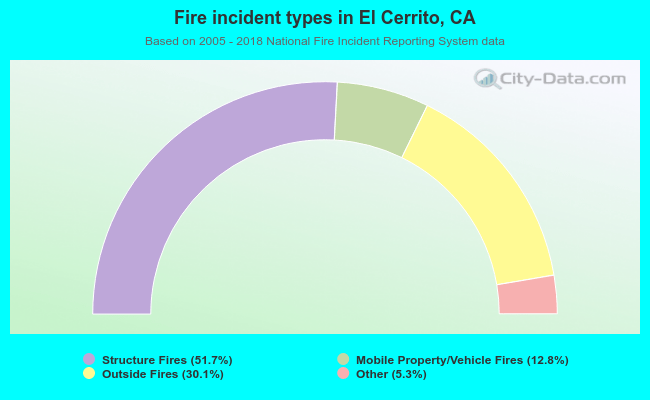 When looking into fire subcategories, the most reports belonged to: Structure Fires (51.7%), and Outside Fires (30.1%).