Richmond, California Submit your own pictures of this city and show them to the world
OSM Map
General Map
Google Map
MSN Map
OSM Map
General Map
Google Map
MSN Map
OSM Map
General Map
Google Map
MSN Map
OSM Map
General Map
Google Map
MSN Map
Please wait while loading the map...
Population in 2022: 114,301 (100% urban, 0% rural). Population change since 2000: +15.2%Males: 58,154 Females: 56,147
March 2022 cost of living index in Richmond: 120.0 (more than average, U.S. average is 100) Percentage of residents living in poverty in 2022: 16.2%for White Non-Hispanic residents , 18.4% for Black residents , 16.4% for Hispanic or Latino residents , 4.4% for American Indian residents , 7.0% for Native Hawaiian and other Pacific Islander residents , 21.3% for other race residents , 12.6% for two or more races residents )
Profiles of local businesses
Business Search - 14 Million verified businesses
Data:
Median household income ($)
Median household income (% change since 2000)
Household income diversity
Ratio of average income to average house value (%)
Ratio of average income to average rent
Median household income ($) - White
Median household income ($) - Black or African American
Median household income ($) - Asian
Median household income ($) - Hispanic or Latino
Median household income ($) - American Indian and Alaska Native
Median household income ($) - Multirace
Median household income ($) - Other Race
Median household income for houses/condos with a mortgage ($)
Median household income for apartments without a mortgage ($)
Races - White alone (%)
Races - White alone (% change since 2000)
Races - Black alone (%)
Races - Black alone (% change since 2000)
Races - American Indian alone (%)
Races - American Indian alone (% change since 2000)
Races - Asian alone (%)
Races - Asian alone (% change since 2000)
Races - Hispanic (%)
Races - Hispanic (% change since 2000)
Races - Native Hawaiian and Other Pacific Islander alone (%)
Races - Native Hawaiian and Other Pacific Islander alone (% change since 2000)
Races - Two or more races (%)
Races - Two or more races (% change since 2000)
Races - Other race alone (%)
Races - Other race alone (% change since 2000)
Racial diversity
Unemployment (%)
Unemployment (% change since 2000)
Unemployment (%) - White
Unemployment (%) - Black or African American
Unemployment (%) - Asian
Unemployment (%) - Hispanic or Latino
Unemployment (%) - American Indian and Alaska Native
Unemployment (%) - Multirace
Unemployment (%) - Other Race
Population density (people per square mile)
Population - Males (%)
Population - Females (%)
Population - Males (%) - White
Population - Males (%) - Black or African American
Population - Males (%) - Asian
Population - Males (%) - Hispanic or Latino
Population - Males (%) - American Indian and Alaska Native
Population - Males (%) - Multirace
Population - Males (%) - Other Race
Population - Females (%) - White
Population - Females (%) - Black or African American
Population - Females (%) - Asian
Population - Females (%) - Hispanic or Latino
Population - Females (%) - American Indian and Alaska Native
Population - Females (%) - Multirace
Population - Females (%) - Other Race
Coronavirus confirmed cases (Apr 27, 2024)
Deaths caused by coronavirus (Apr 27, 2024)
Coronavirus confirmed cases (per 100k population) (Apr 27, 2024)
Deaths caused by coronavirus (per 100k population) (Apr 27, 2024)
Daily increase in number of cases (Apr 27, 2024)
Weekly increase in number of cases (Apr 27, 2024)
Cases doubled (in days) (Apr 27, 2024)
Hospitalized patients (Apr 18, 2022)
Negative test results (Apr 18, 2022)
Total test results (Apr 18, 2022)
COVID Vaccine doses distributed (per 100k population) (Sep 19, 2023)
COVID Vaccine doses administered (per 100k population) (Sep 19, 2023)
COVID Vaccine doses distributed (Sep 19, 2023)
COVID Vaccine doses administered (Sep 19, 2023)
Likely homosexual households (%)
Likely homosexual households (% change since 2000)
Likely homosexual households - Lesbian couples (%)
Likely homosexual households - Lesbian couples (% change since 2000)
Likely homosexual households - Gay men (%)
Likely homosexual households - Gay men (% change since 2000)
Cost of living index
Median gross rent ($)
Median contract rent ($)
Median monthly housing costs ($)
Median house or condo value ($)
Median house or condo value ($ change since 2000)
Mean house or condo value by units in structure - 1, detached ($)
Mean house or condo value by units in structure - 1, attached ($)
Mean house or condo value by units in structure - 2 ($)
Mean house or condo value by units in structure by units in structure - 3 or 4 ($)
Mean house or condo value by units in structure - 5 or more ($)
Mean house or condo value by units in structure - Boat, RV, van, etc. ($)
Mean house or condo value by units in structure - Mobile home ($)
Median house or condo value ($) - White
Median house or condo value ($) - Black or African American
Median house or condo value ($) - Asian
Median house or condo value ($) - Hispanic or Latino
Median house or condo value ($) - American Indian and Alaska Native
Median house or condo value ($) - Multirace
Median house or condo value ($) - Other Race
Median resident age
Resident age diversity
Median resident age - Males
Median resident age - Females
Median resident age - White
Median resident age - Black or African American
Median resident age - Asian
Median resident age - Hispanic or Latino
Median resident age - American Indian and Alaska Native
Median resident age - Multirace
Median resident age - Other Race
Median resident age - Males - White
Median resident age - Males - Black or African American
Median resident age - Males - Asian
Median resident age - Males - Hispanic or Latino
Median resident age - Males - American Indian and Alaska Native
Median resident age - Males - Multirace
Median resident age - Males - Other Race
Median resident age - Females - White
Median resident age - Females - Black or African American
Median resident age - Females - Asian
Median resident age - Females - Hispanic or Latino
Median resident age - Females - American Indian and Alaska Native
Median resident age - Females - Multirace
Median resident age - Females - Other Race
Commute - mean travel time to work (minutes)
Travel time to work - Less than 5 minutes (%)
Travel time to work - Less than 5 minutes (% change since 2000)
Travel time to work - 5 to 9 minutes (%)
Travel time to work - 5 to 9 minutes (% change since 2000)
Travel time to work - 10 to 19 minutes (%)
Travel time to work - 10 to 19 minutes (% change since 2000)
Travel time to work - 20 to 29 minutes (%)
Travel time to work - 20 to 29 minutes (% change since 2000)
Travel time to work - 30 to 39 minutes (%)
Travel time to work - 30 to 39 minutes (% change since 2000)
Travel time to work - 40 to 59 minutes (%)
Travel time to work - 40 to 59 minutes (% change since 2000)
Travel time to work - 60 to 89 minutes (%)
Travel time to work - 60 to 89 minutes (% change since 2000)
Travel time to work - 90 or more minutes (%)
Travel time to work - 90 or more minutes (% change since 2000)
Marital status - Never married (%)
Marital status - Now married (%)
Marital status - Separated (%)
Marital status - Widowed (%)
Marital status - Divorced (%)
Median family income ($)
Median family income (% change since 2000)
Median non-family income ($)
Median non-family income (% change since 2000)
Median per capita income ($)
Median per capita income (% change since 2000)
Median family income ($) - White
Median family income ($) - Black or African American
Median family income ($) - Asian
Median family income ($) - Hispanic or Latino
Median family income ($) - American Indian and Alaska Native
Median family income ($) - Multirace
Median family income ($) - Other Race
Median year house/condo built
Median year apartment built
Year house built - Built 2005 or later (%)
Year house built - Built 2000 to 2004 (%)
Year house built - Built 1990 to 1999 (%)
Year house built - Built 1980 to 1989 (%)
Year house built - Built 1970 to 1979 (%)
Year house built - Built 1960 to 1969 (%)
Year house built - Built 1950 to 1959 (%)
Year house built - Built 1940 to 1949 (%)
Year house built - Built 1939 or earlier (%)
Average household size
Household density (households per square mile)
Average household size - White
Average household size - Black or African American
Average household size - Asian
Average household size - Hispanic or Latino
Average household size - American Indian and Alaska Native
Average household size - Multirace
Average household size - Other Race
Occupied housing units (%)
Vacant housing units (%)
Owner occupied housing units (%)
Renter occupied housing units (%)
Vacancy status - For rent (%)
Vacancy status - For sale only (%)
Vacancy status - Rented or sold, not occupied (%)
Vacancy status - For seasonal, recreational, or occasional use (%)
Vacancy status - For migrant workers (%)
Vacancy status - Other vacant (%)
Residents with income below the poverty level (%)
Residents with income below 50% of the poverty level (%)
Children below poverty level (%)
Poor families by family type - Married-couple family (%)
Poor families by family type - Male, no wife present (%)
Poor families by family type - Female, no husband present (%)
Poverty status for native-born residents (%)
Poverty status for foreign-born residents (%)
Poverty among high school graduates not in families (%)
Poverty among people who did not graduate high school not in families (%)
Residents with income below the poverty level (%) - White
Residents with income below the poverty level (%) - Black or African American
Residents with income below the poverty level (%) - Asian
Residents with income below the poverty level (%) - Hispanic or Latino
Residents with income below the poverty level (%) - American Indian and Alaska Native
Residents with income below the poverty level (%) - Multirace
Residents with income below the poverty level (%) - Other Race
Air pollution - Air Quality Index (AQI)
Air pollution - CO
Air pollution - NO2
Air pollution - SO2
Air pollution - Ozone
Air pollution - PM10
Air pollution - PM25
Air pollution - Pb
Crime - Murders per 100,000 population
Crime - Rapes per 100,000 population
Crime - Robberies per 100,000 population
Crime - Assaults per 100,000 population
Crime - Burglaries per 100,000 population
Crime - Thefts per 100,000 population
Crime - Auto thefts per 100,000 population
Crime - Arson per 100,000 population
Crime - City-data.com crime index
Crime - Violent crime index
Crime - Property crime index
Crime - Murders per 100,000 population (5 year average)
Crime - Rapes per 100,000 population (5 year average)
Crime - Robberies per 100,000 population (5 year average)
Crime - Assaults per 100,000 population (5 year average)
Crime - Burglaries per 100,000 population (5 year average)
Crime - Thefts per 100,000 population (5 year average)
Crime - Auto thefts per 100,000 population (5 year average)
Crime - Arson per 100,000 population (5 year average)
Crime - City-data.com crime index (5 year average)
Crime - Violent crime index (5 year average)
Crime - Property crime index (5 year average)
1996 Presidential Elections Results (%) - Democratic Party (Clinton)
1996 Presidential Elections Results (%) - Republican Party (Dole)
1996 Presidential Elections Results (%) - Other
2000 Presidential Elections Results (%) - Democratic Party (Gore)
2000 Presidential Elections Results (%) - Republican Party (Bush)
2000 Presidential Elections Results (%) - Other
2004 Presidential Elections Results (%) - Democratic Party (Kerry)
2004 Presidential Elections Results (%) - Republican Party (Bush)
2004 Presidential Elections Results (%) - Other
2008 Presidential Elections Results (%) - Democratic Party (Obama)
2008 Presidential Elections Results (%) - Republican Party (McCain)
2008 Presidential Elections Results (%) - Other
2012 Presidential Elections Results (%) - Democratic Party (Obama)
2012 Presidential Elections Results (%) - Republican Party (Romney)
2012 Presidential Elections Results (%) - Other
2016 Presidential Elections Results (%) - Democratic Party (Clinton)
2016 Presidential Elections Results (%) - Republican Party (Trump)
2016 Presidential Elections Results (%) - Other
2020 Presidential Elections Results (%) - Democratic Party (Biden)
2020 Presidential Elections Results (%) - Republican Party (Trump)
2020 Presidential Elections Results (%) - Other
Ancestries Reported - Arab (%)
Ancestries Reported - Czech (%)
Ancestries Reported - Danish (%)
Ancestries Reported - Dutch (%)
Ancestries Reported - English (%)
Ancestries Reported - French (%)
Ancestries Reported - French Canadian (%)
Ancestries Reported - German (%)
Ancestries Reported - Greek (%)
Ancestries Reported - Hungarian (%)
Ancestries Reported - Irish (%)
Ancestries Reported - Italian (%)
Ancestries Reported - Lithuanian (%)
Ancestries Reported - Norwegian (%)
Ancestries Reported - Polish (%)
Ancestries Reported - Portuguese (%)
Ancestries Reported - Russian (%)
Ancestries Reported - Scotch-Irish (%)
Ancestries Reported - Scottish (%)
Ancestries Reported - Slovak (%)
Ancestries Reported - Subsaharan African (%)
Ancestries Reported - Swedish (%)
Ancestries Reported - Swiss (%)
Ancestries Reported - Ukrainian (%)
Ancestries Reported - United States (%)
Ancestries Reported - Welsh (%)
Ancestries Reported - West Indian (%)
Ancestries Reported - Other (%)
Educational Attainment - No schooling completed (%)
Educational Attainment - Less than high school (%)
Educational Attainment - High school or equivalent (%)
Educational Attainment - Less than 1 year of college (%)
Educational Attainment - 1 or more years of college (%)
Educational Attainment - Associate degree (%)
Educational Attainment - Bachelor's degree (%)
Educational Attainment - Master's degree (%)
Educational Attainment - Professional school degree (%)
Educational Attainment - Doctorate degree (%)
School Enrollment - Nursery, preschool (%)
School Enrollment - Kindergarten (%)
School Enrollment - Grade 1 to 4 (%)
School Enrollment - Grade 5 to 8 (%)
School Enrollment - Grade 9 to 12 (%)
School Enrollment - College undergrad (%)
School Enrollment - Graduate or professional (%)
School Enrollment - Not enrolled in school (%)
School enrollment - Public schools (%)
School enrollment - Private schools (%)
School enrollment - Not enrolled (%)
Median number of rooms in houses and condos
Median number of rooms in apartments
Housing units lacking complete plumbing facilities (%)
Housing units lacking complete kitchen facilities (%)
Density of houses
Urban houses (%)
Rural houses (%)
Households with people 60 years and over (%)
Households with people 65 years and over (%)
Households with people 75 years and over (%)
Households with one or more nonrelatives (%)
Households with no nonrelatives (%)
Population in households (%)
Family households (%)
Nonfamily households (%)
Population in families (%)
Family households with own children (%)
Median number of bedrooms in owner occupied houses
Mean number of bedrooms in owner occupied houses
Median number of bedrooms in renter occupied houses
Mean number of bedrooms in renter occupied houses
Median number of vehichles in owner occupied houses
Mean number of vehichles in owner occupied houses
Median number of vehichles in renter occupied houses
Mean number of vehichles in renter occupied houses
Mortgage status - with mortgage (%)
Mortgage status - with second mortgage (%)
Mortgage status - with home equity loan (%)
Mortgage status - with both second mortgage and home equity loan (%)
Mortgage status - without a mortgage (%)
Average family size
Average family size - White
Average family size - Black or African American
Average family size - Asian
Average family size - Hispanic or Latino
Average family size - American Indian and Alaska Native
Average family size - Multirace
Average family size - Other Race
Geographical mobility - Same house 1 year ago (%)
Geographical mobility - Moved within same county (%)
Geographical mobility - Moved from different county within same state (%)
Geographical mobility - Moved from different state (%)
Geographical mobility - Moved from abroad (%)
Place of birth - Born in state of residence (%)
Place of birth - Born in other state (%)
Place of birth - Native, outside of US (%)
Place of birth - Foreign born (%)
Housing units in structures - 1, detached (%)
Housing units in structures - 1, attached (%)
Housing units in structures - 2 (%)
Housing units in structures - 3 or 4 (%)
Housing units in structures - 5 to 9 (%)
Housing units in structures - 10 to 19 (%)
Housing units in structures - 20 to 49 (%)
Housing units in structures - 50 or more (%)
Housing units in structures - Mobile home (%)
Housing units in structures - Boat, RV, van, etc. (%)
House/condo owner moved in on average (years ago)
Renter moved in on average (years ago)
Year householder moved into unit - Moved in 1999 to March 2000 (%)
Year householder moved into unit - Moved in 1995 to 1998 (%)
Year householder moved into unit - Moved in 1990 to 1994 (%)
Year householder moved into unit - Moved in 1980 to 1989 (%)
Year householder moved into unit - Moved in 1970 to 1979 (%)
Year householder moved into unit - Moved in 1969 or earlier (%)
Means of transportation to work - Drove car alone (%)
Means of transportation to work - Carpooled (%)
Means of transportation to work - Public transportation (%)
Means of transportation to work - Bus or trolley bus (%)
Means of transportation to work - Streetcar or trolley car (%)
Means of transportation to work - Subway or elevated (%)
Means of transportation to work - Railroad (%)
Means of transportation to work - Ferryboat (%)
Means of transportation to work - Taxicab (%)
Means of transportation to work - Motorcycle (%)
Means of transportation to work - Bicycle (%)
Means of transportation to work - Walked (%)
Means of transportation to work - Other means (%)
Working at home (%)
Industry diversity
Most Common Industries - Agriculture, forestry, fishing and hunting, and mining (%)
Most Common Industries - Agriculture, forestry, fishing and hunting (%)
Most Common Industries - Mining, quarrying, and oil and gas extraction (%)
Most Common Industries - Construction (%)
Most Common Industries - Manufacturing (%)
Most Common Industries - Wholesale trade (%)
Most Common Industries - Retail trade (%)
Most Common Industries - Transportation and warehousing, and utilities (%)
Most Common Industries - Transportation and warehousing (%)
Most Common Industries - Utilities (%)
Most Common Industries - Information (%)
Most Common Industries - Finance and insurance, and real estate and rental and leasing (%)
Most Common Industries - Finance and insurance (%)
Most Common Industries - Real estate and rental and leasing (%)
Most Common Industries - Professional, scientific, and management, and administrative and waste management services (%)
Most Common Industries - Professional, scientific, and technical services (%)
Most Common Industries - Management of companies and enterprises (%)
Most Common Industries - Administrative and support and waste management services (%)
Most Common Industries - Educational services, and health care and social assistance (%)
Most Common Industries - Educational services (%)
Most Common Industries - Health care and social assistance (%)
Most Common Industries - Arts, entertainment, and recreation, and accommodation and food services (%)
Most Common Industries - Arts, entertainment, and recreation (%)
Most Common Industries - Accommodation and food services (%)
Most Common Industries - Other services, except public administration (%)
Most Common Industries - Public administration (%)
Occupation diversity
Most Common Occupations - Management, business, science, and arts occupations (%)
Most Common Occupations - Management, business, and financial occupations (%)
Most Common Occupations - Management occupations (%)
Most Common Occupations - Business and financial operations occupations (%)
Most Common Occupations - Computer, engineering, and science occupations (%)
Most Common Occupations - Computer and mathematical occupations (%)
Most Common Occupations - Architecture and engineering occupations (%)
Most Common Occupations - Life, physical, and social science occupations (%)
Most Common Occupations - Education, legal, community service, arts, and media occupations (%)
Most Common Occupations - Community and social service occupations (%)
Most Common Occupations - Legal occupations (%)
Most Common Occupations - Education, training, and library occupations (%)
Most Common Occupations - Arts, design, entertainment, sports, and media occupations (%)
Most Common Occupations - Healthcare practitioners and technical occupations (%)
Most Common Occupations - Health diagnosing and treating practitioners and other technical occupations (%)
Most Common Occupations - Health technologists and technicians (%)
Most Common Occupations - Service occupations (%)
Most Common Occupations - Healthcare support occupations (%)
Most Common Occupations - Protective service occupations (%)
Most Common Occupations - Fire fighting and prevention, and other protective service workers including supervisors (%)
Most Common Occupations - Law enforcement workers including supervisors (%)
Most Common Occupations - Food preparation and serving related occupations (%)
Most Common Occupations - Building and grounds cleaning and maintenance occupations (%)
Most Common Occupations - Personal care and service occupations (%)
Most Common Occupations - Sales and office occupations (%)
Most Common Occupations - Sales and related occupations (%)
Most Common Occupations - Office and administrative support occupations (%)
Most Common Occupations - Natural resources, construction, and maintenance occupations (%)
Most Common Occupations - Farming, fishing, and forestry occupations (%)
Most Common Occupations - Construction and extraction occupations (%)
Most Common Occupations - Installation, maintenance, and repair occupations (%)
Most Common Occupations - Production, transportation, and material moving occupations (%)
Most Common Occupations - Production occupations (%)
Most Common Occupations - Transportation occupations (%)
Most Common Occupations - Material moving occupations (%)
People in Group quarters - Institutionalized population (%)
People in Group quarters - Correctional institutions (%)
People in Group quarters - Federal prisons and detention centers (%)
People in Group quarters - Halfway houses (%)
People in Group quarters - Local jails and other confinement facilities (including police lockups) (%)
People in Group quarters - Military disciplinary barracks (%)
People in Group quarters - State prisons (%)
People in Group quarters - Other types of correctional institutions (%)
People in Group quarters - Nursing homes (%)
People in Group quarters - Hospitals/wards, hospices, and schools for the handicapped (%)
People in Group quarters - Hospitals/wards and hospices for chronically ill (%)
People in Group quarters - Hospices or homes for chronically ill (%)
People in Group quarters - Military hospitals or wards for chronically ill (%)
People in Group quarters - Other hospitals or wards for chronically ill (%)
People in Group quarters - Hospitals or wards for drug/alcohol abuse (%)
People in Group quarters - Mental (Psychiatric) hospitals or wards (%)
People in Group quarters - Schools, hospitals, or wards for the mentally retarded (%)
People in Group quarters - Schools, hospitals, or wards for the physically handicapped (%)
People in Group quarters - Institutions for the deaf (%)
People in Group quarters - Institutions for the blind (%)
People in Group quarters - Orthopedic wards and institutions for the physically handicapped (%)
People in Group quarters - Wards in general hospitals for patients who have no usual home elsewhere (%)
People in Group quarters - Wards in military hospitals for patients who have no usual home elsewhere (%)
People in Group quarters - Juvenile institutions (%)
People in Group quarters - Long-term care (%)
People in Group quarters - Homes for abused, dependent, and neglected children (%)
People in Group quarters - Residential treatment centers for emotionally disturbed children (%)
People in Group quarters - Training schools for juvenile delinquents (%)
People in Group quarters - Short-term care, detention or diagnostic centers for delinquent children (%)
People in Group quarters - Type of juvenile institution unknown (%)
People in Group quarters - Noninstitutionalized population (%)
People in Group quarters - College dormitories (includes college quarters off campus) (%)
People in Group quarters - Military quarters (%)
People in Group quarters - On base (%)
People in Group quarters - Barracks, unaccompanied personnel housing (UPH), (Enlisted/Officer), ;and similar group living quarters for military personnel (%)
People in Group quarters - Transient quarters for temporary residents (%)
People in Group quarters - Military ships (%)
People in Group quarters - Group homes (%)
People in Group quarters - Homes or halfway houses for drug/alcohol abuse (%)
People in Group quarters - Homes for the mentally ill (%)
People in Group quarters - Homes for the mentally retarded (%)
People in Group quarters - Homes for the physically handicapped (%)
People in Group quarters - Other group homes (%)
People in Group quarters - Religious group quarters (%)
People in Group quarters - Dormitories (%)
People in Group quarters - Agriculture workers' dormitories on farms (%)
People in Group quarters - Job Corps and vocational training facilities (%)
People in Group quarters - Other workers' dormitories (%)
People in Group quarters - Crews of maritime vessels (%)
People in Group quarters - Other nonhousehold living situations (%)
People in Group quarters - Other noninstitutional group quarters (%)
Residents speaking English at home (%)
Residents speaking English at home - Born in the United States (%)
Residents speaking English at home - Native, born elsewhere (%)
Residents speaking English at home - Foreign born (%)
Residents speaking Spanish at home (%)
Residents speaking Spanish at home - Born in the United States (%)
Residents speaking Spanish at home - Native, born elsewhere (%)
Residents speaking Spanish at home - Foreign born (%)
Residents speaking other language at home (%)
Residents speaking other language at home - Born in the United States (%)
Residents speaking other language at home - Native, born elsewhere (%)
Residents speaking other language at home - Foreign born (%)
Class of Workers - Employee of private company (%)
Class of Workers - Self-employed in own incorporated business (%)
Class of Workers - Private not-for-profit wage and salary workers (%)
Class of Workers - Local government workers (%)
Class of Workers - State government workers (%)
Class of Workers - Federal government workers (%)
Class of Workers - Self-employed workers in own not incorporated business and Unpaid family workers (%)
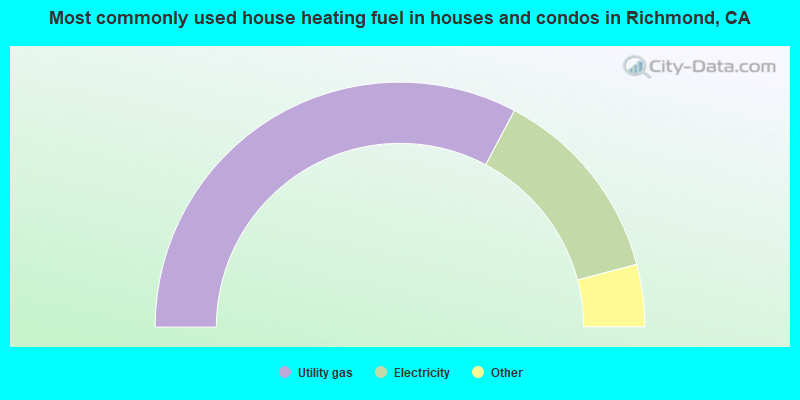
House heating fuel used in houses and condos - Utility gas (%)
House heating fuel used in houses and condos - Bottled, tank, or LP gas (%)
House heating fuel used in houses and condos - Electricity (%)
House heating fuel used in houses and condos - Fuel oil, kerosene, etc. (%)
House heating fuel used in houses and condos - Coal or coke (%)
House heating fuel used in houses and condos - Wood (%)
House heating fuel used in houses and condos - Solar energy (%)
House heating fuel used in houses and condos - Other fuel (%)
House heating fuel used in houses and condos - No fuel used (%)
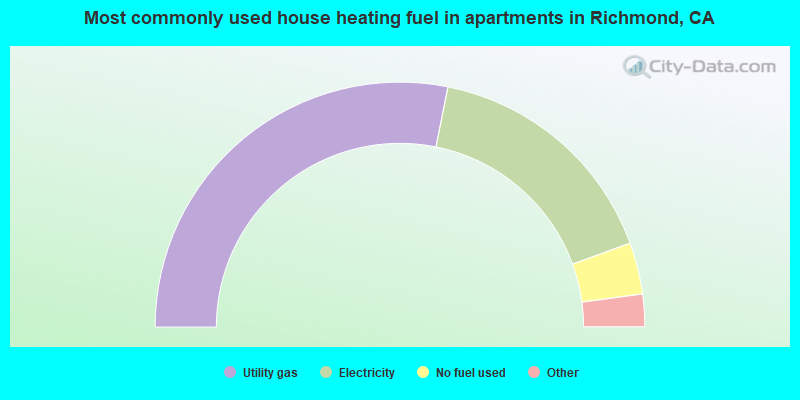
House heating fuel used in apartments - Utility gas (%)
House heating fuel used in apartments - Bottled, tank, or LP gas (%)
House heating fuel used in apartments - Electricity (%)
House heating fuel used in apartments - Fuel oil, kerosene, etc. (%)
House heating fuel used in apartments - Coal or coke (%)
House heating fuel used in apartments - Wood (%)
House heating fuel used in apartments - Solar energy (%)
House heating fuel used in apartments - Other fuel (%)
House heating fuel used in apartments - No fuel used (%)
Armed forces status - In Armed Forces (%)
Armed forces status - Civilian (%)
Armed forces status - Civilian - Veteran (%)
Armed forces status - Civilian - Nonveteran (%)
Fatal accidents locations in years 2005-2021
Fatal accidents locations in 2005
Fatal accidents locations in 2006
Fatal accidents locations in 2007
Fatal accidents locations in 2008
Fatal accidents locations in 2009
Fatal accidents locations in 2010
Fatal accidents locations in 2011
Fatal accidents locations in 2012
Fatal accidents locations in 2013
Fatal accidents locations in 2014
Fatal accidents locations in 2015
Fatal accidents locations in 2016
Fatal accidents locations in 2017
Fatal accidents locations in 2018
Fatal accidents locations in 2019
Fatal accidents locations in 2020
Fatal accidents locations in 2021
Alcohol use - People drinking some alcohol every month (%)
Alcohol use - People not drinking at all (%)
Alcohol use - Average days/month drinking alcohol
Alcohol use - Average drinks/week
Alcohol use - Average days/year people drink much
Audiometry - Average condition of hearing (%)
Audiometry - People that can hear a whisper from across a quiet room (%)
Audiometry - People that can hear normal voice from across a quiet room (%)
Audiometry - Ears ringing, roaring, buzzing (%)
Audiometry - Had a job exposure to loud noise (%)
Audiometry - Had off-work exposure to loud noise (%)
Blood Pressure & Cholesterol - Has high blood pressure (%)
Blood Pressure & Cholesterol - Checking blood pressure at home (%)
Blood Pressure & Cholesterol - Frequently checking blood cholesterol (%)
Blood Pressure & Cholesterol - Has high cholesterol level (%)
Consumer Behavior - Money monthly spent on food at supermarket/grocery store
Consumer Behavior - Money monthly spent on food at other stores
Consumer Behavior - Money monthly spent on eating out
Consumer Behavior - Money monthly spent on carryout/delivered foods
Consumer Behavior - Income spent on food at supermarket/grocery store (%)
Consumer Behavior - Income spent on food at other stores (%)
Consumer Behavior - Income spent on eating out (%)
Consumer Behavior - Income spent on carryout/delivered foods (%)
Current Health Status - General health condition (%)
Current Health Status - Blood donors (%)
Current Health Status - Has blood ever tested for HIV virus (%)
Current Health Status - Left-handed people (%)
Dermatology - People using sunscreen (%)
Diabetes - Diabetics (%)
Diabetes - Had a blood test for high blood sugar (%)
Diabetes - People taking insulin (%)
Diet Behavior & Nutrition - Diet health (%)
Diet Behavior & Nutrition - Milk product consumption (# of products/month)
Diet Behavior & Nutrition - Meals not home prepared (#/week)
Diet Behavior & Nutrition - Meals from fast food or pizza place (#/week)
Diet Behavior & Nutrition - Ready-to-eat foods (#/month)
Diet Behavior & Nutrition - Frozen meals/pizza (#/month)
Drug Use - People that ever used marijuana or hashish (%)
Drug Use - Ever used hard drugs (%)
Drug Use - Ever used any form of cocaine (%)
Drug Use - Ever used heroin (%)
Drug Use - Ever used methamphetamine (%)
Health Insurance - People covered by health insurance (%)
Kidney Conditions-Urology - Avg. # of times urinating at night
Medical Conditions - People with asthma (%)
Medical Conditions - People with anemia (%)
Medical Conditions - People with psoriasis (%)
Medical Conditions - People with overweight (%)
Medical Conditions - Elderly people having difficulties in thinking or remembering (%)
Medical Conditions - People who ever received blood transfusion (%)
Medical Conditions - People having trouble seeing even with glass/contacts (%)
Medical Conditions - People with arthritis (%)
Medical Conditions - People with gout (%)
Medical Conditions - People with congestive heart failure (%)
Medical Conditions - People with coronary heart disease (%)
Medical Conditions - People with angina pectoris (%)
Medical Conditions - People who ever had heart attack (%)
Medical Conditions - People who ever had stroke (%)
Medical Conditions - People with emphysema (%)
Medical Conditions - People with thyroid problem (%)
Medical Conditions - People with chronic bronchitis (%)
Medical Conditions - People with any liver condition (%)
Medical Conditions - People who ever had cancer or malignancy (%)
Mental Health - People who have little interest in doing things (%)
Mental Health - People feeling down, depressed, or hopeless (%)
Mental Health - People who have trouble sleeping or sleeping too much (%)
Mental Health - People feeling tired or having little energy (%)
Mental Health - People with poor appetite or overeating (%)
Mental Health - People feeling bad about themself (%)
Mental Health - People who have trouble concentrating on things (%)
Mental Health - People moving or speaking slowly or too fast (%)
Mental Health - People having thoughts they would be better off dead (%)
Oral Health - Average years since last visit a dentist
Oral Health - People embarrassed because of mouth (%)
Oral Health - People with gum disease (%)
Oral Health - General health of teeth and gums (%)
Oral Health - Average days a week using dental floss/device
Oral Health - Average days a week using mouthwash for dental problem
Oral Health - Average number of teeth
Pesticide Use - Households using pesticides to control insects (%)
Pesticide Use - Households using pesticides to kill weeds (%)
Physical Activity - People doing vigorous-intensity work activities (%)
Physical Activity - People doing moderate-intensity work activities (%)
Physical Activity - People walking or bicycling (%)
Physical Activity - People doing vigorous-intensity recreational activities (%)
Physical Activity - People doing moderate-intensity recreational activities (%)
Physical Activity - Average hours a day doing sedentary activities
Physical Activity - Average hours a day watching TV or videos
Physical Activity - Average hours a day using computer
Physical Functioning - People having limitations keeping them from working (%)
Physical Functioning - People limited in amount of work they can do (%)
Physical Functioning - People that need special equipment to walk (%)
Physical Functioning - People experiencing confusion/memory problems (%)
Physical Functioning - People requiring special healthcare equipment (%)
Prescription Medications - Average number of prescription medicines taking
Preventive Aspirin Use - Adults 40+ taking low-dose aspirin (%)
Reproductive Health - Vaginal deliveries (%)
Reproductive Health - Cesarean deliveries (%)
Reproductive Health - Deliveries resulted in a live birth (%)
Reproductive Health - Pregnancies resulted in a delivery (%)
Reproductive Health - Women breastfeeding newborns (%)
Reproductive Health - Women that had a hysterectomy (%)
Reproductive Health - Women that had both ovaries removed (%)
Reproductive Health - Women that have ever taken birth control pills (%)
Reproductive Health - Women taking birth control pills (%)
Reproductive Health - Women that have ever used Depo-Provera or injectables (%)
Reproductive Health - Women that have ever used female hormones (%)
Sexual Behavior - People 18+ that ever had sex (vaginal, anal, or oral) (%)
Sexual Behavior - Males 18+ that ever had vaginal sex with a woman (%)
Sexual Behavior - Males 18+ that ever performed oral sex on a woman (%)
Sexual Behavior - Males 18+ that ever had anal sex with a woman (%)
Sexual Behavior - Males 18+ that ever had any sex with a man (%)
Sexual Behavior - Females 18+ that ever had vaginal sex with a man (%)
Sexual Behavior - Females 18+ that ever performed oral sex on a man (%)
Sexual Behavior - Females 18+ that ever had anal sex with a man (%)
Sexual Behavior - Females 18+ that ever had any kind of sex with a woman (%)
Sexual Behavior - Average age people first had sex
Sexual Behavior - Average number of female sex partners in lifetime (males 18+)
Sexual Behavior - Average number of female vaginal sex partners in lifetime (males 18+)
Sexual Behavior - Average age people first performed oral sex on a woman (18+)
Sexual Behavior - Average number of woman performed oral sex on in lifetime (18+)
Sexual Behavior - Average number of male sex partners in lifetime (males 18+)
Sexual Behavior - Average number of male anal sex partners in lifetime (males 18+)
Sexual Behavior - Average age people first performed oral sex on a man (18+)
Sexual Behavior - Average number of male oral sex partners in lifetime (18+)
Sexual Behavior - People using protection when performing oral sex (%)
Sexual Behavior - Average number of times people have vaginal or anal sex a year
Sexual Behavior - People having sex without condom (%)
Sexual Behavior - Average number of male sex partners in lifetime (females 18+)
Sexual Behavior - Average number of male vaginal sex partners in lifetime (females 18+)
Sexual Behavior - Average number of female sex partners in lifetime (females 18+)
Sexual Behavior - Circumcised males 18+ (%)
Sleep Disorders - Average hours sleeping at night
Sleep Disorders - People that has trouble sleeping (%)
Smoking-Cigarette Use - People smoking cigarettes (%)
Taste & Smell - People 40+ having problems with smell (%)
Taste & Smell - People 40+ having problems with taste (%)
Taste & Smell - People 40+ that ever had wisdom teeth removed (%)
Taste & Smell - People 40+ that ever had tonsils teeth removed (%)
Taste & Smell - People 40+ that ever had a loss of consciousness because of a head injury (%)
Taste & Smell - People 40+ that ever had a broken nose or other serious injury to face or skull (%)
Taste & Smell - People 40+ that ever had two or more sinus infections (%)
Weight - Average height (inches)
Weight - Average weight (pounds)
Weight - Average BMI
Weight - People that are obese (%)
Weight - People that ever were obese (%)
Weight - People trying to lose weight (%)
48,480 42.4% Hispanic 21,238 18.6% Black alone 17,680 15.5% White alone 16,093 14.1% Asian alone 7,386 6.5% Two or more races 2,349 2.1% Other race alone 788 0.7% Native Hawaiian and Other 273 0.2% American Indian alone
The City-Data.com crime index weighs serious crimes and violent crimes more heavily. Higher means more crime, U.S. average is 246.1. It adjusts for the number of visitors and daily workers commuting into cities.
- means the value is smaller than the state average.
- means the value is about the same as the state average.
- means the value is bigger than the state average.
- means the value is much bigger than the state average.
Crime rate in Richmond detailed stats: murders, rapes, robberies, assaults, burglaries, thefts, arson Officers per 1,000 residents here:
1.17California average:
2.30
Latest news from Richmond, CA collected exclusively by city-data.com from local newspapers, TV, and radio stations
Ancestries: Brazilian (2.0%), European (1.8%), African (1.1%).
Current Local Time:
Land area: 30.0 square miles.
Population density: 3,813 people per square mile (average).
39,693 residents are foreign born (22.7% Latin America , 9.6% Asia ).
This city:
34.5%California:
26.5%
Median real estate property taxes paid for housing units with mortgages in 2022: $6,211 (0.9%)Median real estate property taxes paid for housing units with no mortgage in 2022: $4,529 (0.8%)
Nearest city with pop. 200,000+: West Contra Costa, CA (1.7 miles
Nearest city with pop. 1,000,000+: Los Angeles, CA
Nearest cities:
Latitude: 37.94 N, Longitude: 122.34 W
Daytime population change due to commuting: -7,174 (-6.3%)Workers who live and work in this city: 16,655 (30.8%)
Richmond tourist attractions:
Single-family new house construction building permits:
2022: 64 buildings , average cost: $108,5002021: 77 buildings , average cost: $150,5002020: 137 buildings , average cost: $174,4002019: 50 buildings , average cost: $104,4002018: 96 buildings , average cost: $343,5002017: 17 buildings , average cost: $189,8002016: 66 buildings , average cost: $206,7002015: 76 buildings , average cost: $206,5002014: 8 buildings , average cost: $218,6002011: 27 buildings , average cost: $215,0002010: 47 buildings , average cost: $215,0002009: 43 buildings , average cost: $215,0002008: 59 buildings , average cost: $215,0002007: 115 buildings , average cost: $215,0002006: 170 buildings , average cost: $215,1002005: 234 buildings , average cost: $215,0002004: 233 buildings , average cost: $215,2002003: 201 buildings , average cost: $214,2002002: 215 buildings , average cost: $218,0002001: 162 buildings , average cost: $212,4002000: 267 buildings , average cost: $174,9001999: 72 buildings , average cost: $170,3001998: 39 buildings , average cost: $162,1001997: 137 buildings , average cost: $139,300Unemployment in December 2023:
Population change in the 1990s: +12,706 (+14.7%).
Earthquake activity:
Richmond-area historical earthquake activity is significantly above California state average. It is 7498% greater than the overall U.S. average. On 4/18/1906 at 13:12:21, a magnitude 7.9 (7.9 UK, Class: Major, Intensity: VIII - XII) earthquake occurred 36.1 miles away from the city center, causing $524,000,000 total damage On 10/18/1989 at 00:04:15, a magnitude 7.1 (6.5 MB, 7.1 MS, 6.9 MW, 7.0 ML) earthquake occurred 65.2 miles away from the city center, causing 62 deaths ( 62 shaking deaths) and 3757 injuries, causing $1,305,032,704 total damage On 11/4/1927 at 13:51:53, a magnitude 7.5 (7.5 UK) earthquake occurred 221.4 miles away from the city center On 7/21/1952 at 11:52:14, a magnitude 7.7 (7.7 UK) earthquake occurred 275.3 miles away from the city center, causing $50,000,000 total damage On 1/31/1922 at 13:17:28, a magnitude 7.6 (7.6 UK) earthquake occurred 257.0 miles away from Richmond center On 4/25/1992 at 18:06:04, a magnitude 7.2 (6.3 MB, 7.1 MS, 7.2 MW, 7.1 MW, Depth: 9.4 mi) earthquake occurred 190.9 miles away from the city center, causing $75,000,000 total damage Magnitude types: body-wave magnitude (MB), local magnitude (ML), surface-wave magnitude (MS), moment magnitude (MW) Natural disasters: The number of natural disasters in Contra Costa County (18) is near the US average (15).Major Disasters (Presidential) Declared: 11Emergencies Declared: 3Floods: 13, Storms: 7, Winter Storms: 7, Mudslides: 5, Landslides: 4, Drought: 1, Earthquake: 1, Hurricane: 1, Tornado: 1, Wind: 1, Other: 1 (Note: some incidents may be assigned to more than one category). Main business address for: NEUROBIOLOGICAL TECHNOLOGIES INC /CA/ BIOLOGICAL PRODUCTS (NO DIAGNOSTIC SUBSTANCES) ), DICON FIBEROPTICS INC OPTICAL INSTRUMENTS & LENSES ), QRS CORP SERVICES-COMPUTER PROCESSING & DATA PREPARATION ), SANGAMO BIOSCIENCES INC BIOLOGICAL PRODUCTS (NO DIAGNOSTIC SUBSTANCES) ).
Hospitals and medical centers in Richmond: ELLENS MEMORIAL CONVALESCENT HOSP (2716 OHIO AVE)
GREENRIDGE SENIOR CARE (2150 PYRAMID DRIVE)
SHIELDS RICHMOND NURSING CTR (1919 CUTTING BLVD)
VINTAGE ESTATES OF RICHMOND (955 23RD STREET)
DAVITA RICHMOND DIALYSIS (4200 MACDONALD AVE., STE A)
Amtrak station: RICHMOND (16TH ST. & MACDONALD AVE.)
.
Services: fully wheelchair accessible, enclosed waiting area, public restrooms, public payphones, free short-term parking, call for taxi service, public transit connection.
Colleges/universities with over 2000 students nearest to Richmond:
Contra Costa College (about 3 miles; San Pablo, CA ; Full-time enrollment: 4,249)
Berkeley City College (about 7 miles; Berkeley, CA ; FT enrollment: 3,146)
University of California-Berkeley (about 7 miles; Berkeley, CA ; FT enrollment: 37,127)
Laney College (about 11 miles; Oakland, CA ; FT enrollment: 5,668)
Academy of Art University (about 11 miles; San Francisco, CA ; FT enrollment: 12,352)
College of Alameda (about 12 miles; Alameda, CA ; FT enrollment: 3,071)
College of Marin (about 12 miles; Kentfield, CA ; FT enrollment: 4,489)
Public high schools in Richmond: RICHMOND HIGH Students: 1,119, Location: 1250 23RD ST., Grades: 9-12)DE ANZA SENIOR HIGH Students: 609, Location: 5000 VALLEY VIEW RD., Grades: 9-12)KENNEDY HIGH Students: 594, Location: 4300 CUTTING BLVD., Grades: 9-12)MAKING WAVES ACADEMY Students: 196, Location: 4123 LAKESIDE DR., Grades: 5-12, Charter school )GOMPERS (SAMUEL) CONTINUATION Students: 27, Location: 715 CHANSLOR AVE., Grades: 9-12)LEADERSHIP PUBLIC SCHOOLS: RICHMOND Location: 251 S. 12TH ST., Grades: 9-12, Charter school )
Private high schools in Richmond: SALESIAN HIGH SCHOOL Students: 560, Location: 2851 SALESIAN AVE, Grades: 9-12)
ARLINGTON CHRISTIAN SCHOOL Students: 29, Location: 6382 ARLINGTON BLVD, Grades: KG-12)
COMMUNITY CHRISTIAN ACADEMY Students: 22, Location: 2375 ABERDEEN WAY, Grades: 2-12)
A BETTER CHANCE SCHOOL/CAL AUTISM FOUNDATION Students: 20, Location: 4138 LAKESIDE DR, Grades: 4-12)
LA CHEIM SCHOOL Students: 20, Location: 2853 GROOM DR, Grades: 7-12)
ELIM CHRISTIAN SCHOOL Students: 18, Location: 151 11TH ST, Grades: KG-12)
Biggest public elementary/middle schools in Richmond: LOVONYA DEJEAN MIDDLE Students: 593, Location: 3400 MACDONALD AVE., Grades: 7-8)CESAR E. CHAVEZ ELEMENTARY Students: 367, Location: 960 17TH ST., Grades: KG-6)PERES ELEMENTARY Students: 328, Location: 719 FIFTH ST., Grades: KG-6)VALLEY VIEW ELEMENTARY Students: 293, Location: 3416 MAYWOOD DR., Grades: KG-6)WASHINGTON ELEMENTARY Students: 276, Location: 565 WINE ST., Grades: KG-6)MIRA VISTA ELEMENTARY Students: 256, Location: 6397 HAZEL AVE., Grades: KG-8)SHELDON ELEMENTARY Students: 254, Location: 2601 MAY RD., Grades: KG-6)RIVERSIDE ELEMENTARY Students: 242, Location: 1300 AMADOR ST., Grades: KG-6)CORONADO ELEMENTARY Students: 212, Location: 2001 VIRGINIA AVE., Grades: KG-6)NYSTROM ELEMENTARY Students: 201, Location: 230 HARBOUR WAY S., Grades: KG-6)Private elementary/middle schools in Richmond: ST CORNELIUS SCHOOL Students: 177, Location: 201 28TH ST, Grades: KG-8)
ST DAVID SCHOOL Students: 165, Location: 871 SONOMA ST, Grades: PK-8)
VISTA CHRISTIAN SCHOOL Students: 90, Location: 2354 ANDRADE AVE, Grades: KG-8)
CRESTMONT SCHOOL Students: 81, Location: 6226 ARLINGTON BLVD STE A, Grades: KG-5)
WILLIAMS & BROWN ACADEMY Students: 6, Location: 2225 GAYNOR AVE, Grades: 1-5)
See full list of schools located in Richmond Library in Richmond: RICHMOND PUBLIC LIBRARY Operating income: $6,419,248; Location: 325 CIVIC CENTER PLAZA; 199,109 books ; 10 e-books ; 4,690 audio materials ; 11,240 video materials ; 66 other licensed databases ; 304 print serial subscriptions )
User-submitted facts and corrections:
add to private elementary schools: Crestmont School
richmond is the birthplace of Willie McGee, professional baseball player (Cardinals, Yankees, A's, Giants) birthplace of Benny Barnes, professional football player (Cowboys)
The Rotary Club of Richmond meets at Nooon every Friday at the Mira Vista Golf and Country Club. http://www.richmondcarotary.org
Notable locations in Richmond: (A) , Richmond Yard (B) , Channel Marina (C) , Richmond Reserve Shipyard (D) , Richmond Golf Club (E) , West Side Branch Richmond Public Library (F) , West County Detention Facility (G) , Veterans Memorial Building (H) , Shields-Reid Community Center (I) , Richmond Womens Club (J) , Richmond Public Library (K) , Richmond Memorial Youth Center (L) , Richmond Memorial Convention Center (M) , Richmond City Hall (N) , Richmond Art Center (O) , Point Richmond Historical Society Museum (P) , Parchester Community Center (Q) , Nevin Community Center (R) , Hellenic Community Center (S) , Golden State Model Railroad Museum (T) . Display/hide their locations on the map
Shopping Center: (1) . Display/hide its location on the map
Main business address in Richmond include: (A) , DICON FIBEROPTICS INC (B) , QRS CORP (C) , SANGAMO BIOSCIENCES INC (D) . Display/hide their locations on the map
Churches in Richmond include: (A) , West Contra Costa Christian Center (B) , Unity Church of Richmond (C) , The Temple of Faith (D) , The Point Gospel Chapel (E) , The House of Prayer (F) , Temple Baptist Church (G) , Smyrna Church of God in Christ (H) , Saint Peters Methodist Church (I) . Display/hide their locations on the map
Cemetery: (1) . Display/hide its location on the map
Reservoirs and swamps: (A) , George Whittell Marsh (B) . Display/hide their locations on the map
Creek: (A) . Display/hide its location on the map
Parks in Richmond include: (1) , Mira Vista Park (2) , Rosie the Riveter WWII Home Front National Historical Park (3) , Nicholl Park (4) , Wendell Playground (5) , Atchison Village Park (6) , Boorman Park (7) , Elm Park (8) , Hilltop Lake Park (9) . Display/hide their locations on the map
Beaches: (A) , Kellers Beach (B) . Display/hide their locations on the map
Hotels: (1) , Best Value Inn (1598 Carlson Blvd) (2) . Display/hide their approximate locations on the map
Courts: (1) , Contra Costa County - Superior Court- Courts- Traffic- West County (100 South 37th Street) (2) , Contra Costa County - Courts- Superior Court- Civil- West County (100 South 37th Street) (3) , Contra Costa County - Courts- Superior Court- Clerk Of Court- West Co (100 South 37th Street) (4) , Contra Costa County - Civil Division- Richmond Court- Superior Court- Courts- Small Cl (100 South 37th Street) (5) . Display/hide their approximate locations on the map
Birthplace of: Carl Franklin - Actor, George Miller (California politician) - Politician, Les Claypool - (born 1964), bassist of Primus, Russ Christopher - Baseball player, Jason Becker - Heavy metal guitarist, Antoine Reuben Diavola - Drummer, Dale Sveum - Baseball player and coach, Gary Holt (musician) - Heavy metal guitarist, Ken Olandt - Actor, Lamont Thompson - 2005 NFL player (Tennessee Titans, born : Jul 30, 1978).
Contra Costa County has a predicted average indoor radon screening level between 2 and 4 pCi/L (pico curies per liter) - Moderate Potential Average household size: This city:
2.8 peopleCalifornia:
2.9 people
Percentage of family households: This city:
66.5%Whole state:
68.7%
Percentage of households with unmarried partners: This city:
8.2%Whole state:
7.2%
Likely homosexual households (counted as self-reported same-sex unmarried-partner households)
Lesbian couples: 0.7% of all households Gay men: 0.5% of all households
People in group quarters in Richmond in 2010:
713 people in local jails and other municipal confinement facilities
329 people in emergency and transitional shelters (with sleeping facilities) for people experiencing homelessness
172 people in nursing facilities/skilled-nursing facilities
146 people in other noninstitutional facilities
78 people in group homes intended for adults
62 people in workers' group living quarters and job corps centers
55 people in residential treatment centers for adults
21 people in group homes for juveniles (non-correctional)
7 people in residential schools for people with disabilities
People in group quarters in Richmond in 2000:
715 people in local jails and other confinement facilities (including police lockups)
478 people in other noninstitutional group quarters
165 people in nursing homes
67 people in homes for the mentally retarded
34 people in other nonhousehold living situations
32 people in homes for the mentally ill
31 people in institutions for the blind
25 people in hospitals or wards for drug/alcohol abuse
21 people in crews of maritime vessels
20 people in other group homes
19 people in homes for the physically handicapped
10 people in schools, hospitals, or wards for the intellectually disabled
7 people in homes for abused, dependent, and neglected children
2 people in homes or halfway houses for drug/alcohol abuse
2 people in religious group quarters
Banks with branches in Richmond (2011 data):
Bank of America, National Association: Rollingwood Branch, Richmond Branch, Mira Vista Branch. Info updated 2009/11/18: Bank assets: $1,451,969.3 mil, Deposits: $1,077,176.8 mil, headquarters in Charlotte, NC, positive income , 5782 total offices , Holding Company: Bank Of America Corporation
JPMorgan Chase Bank, National Association: 12121 San Pablo Ave Branch at 12121 San Pablo Ave., branch established on 1988/12/27; 3110 Hilltop Mall Road Branch at 3110 Hilltop Mall Road, branch established on 1965/05/05. Info updated 2011/11/10: Bank assets: $1,811,678.0 mil, Deposits: $1,190,738.0 mil, headquarters in Columbus, OH, positive income , International Specialization, 5577 total offices , Holding Company: Jpmorgan Chase & Co.
Mechanics Bank: at 3170 Hilltop Mall Road, branch established on 1905/01/01; Mira Vista Branch at 4100 Macdonald Avenue, branch established on 1964/12/03. Info updated 2011/03/24: Bank assets: $2,991.7 mil, Deposits: $2,573.6 mil, local headquarters , positive income , Commercial Lending Specialization, 31 total offices
Cathay Bank: Berkeley-Richmond Branch at 3288 Pierce Street, Suite D101, branch established on 1998/04/08. Info updated 2010/12/08: Bank assets: $10,628.9 mil, Deposits: $7,249.8 mil, headquarters in Los Angeles, CA, positive income , Commercial Lending Specialization, 52 total offices , Holding Company: Cathay General Bancorp
Wells Fargo Bank, National Association: Macdonald And San Pablo Branch at 4925 Macdonald Avenue, branch established on 1997/12/23. Info updated 2011/04/05: Bank assets: $1,161,490.0 mil, Deposits: $905,653.0 mil, headquarters in Sioux Falls, SD, positive income , 6395 total offices , Holding Company: Wells Fargo & Company
Citibank, National Association: Richmond Branch at 3634 Macdonald Avenue, branch established on 1987/06/30. Info updated 2012/01/10: Bank assets: $1,288,658.0 mil, Deposits: $882,541.0 mil, headquarters in Sioux Falls, SD, positive income , International Specialization, 1048 total offices , Holding Company: Citigroup Inc.
For population 15 years and over in Richmond:
Never married: 44.2%Now married: 40.7%Separated: 1.8%Widowed: 5.5%Divorced: 7.8% For population 25 years and over in Richmond:
High school or higher: 79.8%Bachelor's degree or higher: 31.7%Graduate or professional degree: 11.2%Unemployed: 7.7%Mean travel time to work (commute): 29.1 minutes
Education Gini index (Inequality in education) Here:
17.3California average:
15.5
Religion statistics for Richmond, CA (based on Contra Costa County data)
Religion Adherents Congregations Catholic 228,400 34 Evangelical Protestant 81,120 352 Other 48,553 123 Mainline Protestant 32,693 101 Black Protestant 10,395 34 Orthodox 2,435 8 None 645,429 -
Source: Clifford Grammich, Kirk Hadaway, Richard Houseal, Dale E.Jones, Alexei Krindatch, Richie Stanley and Richard H.Taylor. 2012. 2010 U.S.Religion Census: Religious Congregations & Membership Study. Association of Statisticians of American Religious Bodies. Jones, Dale E., et al. 2002. Congregations and Membership in the United States 2000. Nashville, TN: Glenmary Research Center. Graphs represent county-level data
Food Environment Statistics: Number of grocery stores : 181Contra Costa County :
1.78 / 10,000 pop.State :
2.14 / 10,000 pop.
Number of supercenters and club stores : 5Contra Costa County :
0.05 / 10,000 pop.California :
0.04 / 10,000 pop.
Number of convenience stores (no gas) : 52Contra Costa County :
0.51 / 10,000 pop.State :
0.62 / 10,000 pop.
Number of convenience stores (with gas) : 178This county :
1.75 / 10,000 pop.California :
1.49 / 10,000 pop.
Number of full-service restaurants : 683Contra Costa County :
6.73 / 10,000 pop.California :
7.42 / 10,000 pop.
Adult diabetes rate : This county :
7.1%State :
7.3%
Adult obesity rate : Contra Costa County :
22.2%California :
21.3%
Low-income preschool obesity rate : This county :
16.8%California :
17.9%
Health and Nutrition: Healthy diet rate : This city:
49.2%California:
49.4%
Average overall health of teeth and gums : Richmond:
48.1%State:
48.0%
Average BMI : Richmond:
28.3California:
28.1
People feeling badly about themselves : Richmond:
18.9%State:
20.2%
People not drinking alcohol at all : Here:
11.9%California:
11.2%
Average hours sleeping at night : Overweight people : Here:
31.6%California:
31.5%
General health condition : Richmond:
56.2%State:
56.4%
Average condition of hearing : Richmond:
82.4%California:
80.9%
More about Health and Nutrition of Richmond, CA Residents
Local government employment and payroll (March 2022)
Function
Full-time employees
Monthly full-time payroll
Average yearly full-time wage
Part-time employees
Monthly part-time payroll
Other and Unallocable
186 $1,515,186 $97,754 21 $62,510 Police Protection - Officers
168 $3,472,212 $248,015 0 $0 Firefighters
92 $1,397,764 $182,317 0 $0 Police - Other
63 $570,620 $108,690 20 $48,732 Financial Administration
46 $439,795 $114,729 0 $0 Local Libraries
33 $245,834 $89,394 14 $20,548 Other Government Administration
33 $260,176 $94,609 5 $8,138 Streets and Highways
28 $290,918 $124,679 4 $9,790 Parks and Recreation
20 $144,566 $86,740 65 $106,050 Judicial and Legal
9 $137,670 $183,560 1 $3,690 Fire - Other
5 $45,393 $108,943 0 $0 Correction
4 $33,344 $100,032 0 $0 Housing and Community Development (Local)
3 $30,978 $123,912 0 $0 Water Transport and Terminals
3 $43,968 $175,872 0 $0
Totals for Government
693 $8,628,424 $149,410 130 $259,458
Richmond government finances - Expenditure in 2021 (per resident):
Construction - Regular Highways: $5,350,000 ($46.81)
Parks and Recreation: $601,000 ($5.26)Police Protection: $131,000 ($1.15)Current Operations - Police Protection: $65,875,000 ($576.33)
Central Staff Services: $46,696,000 ($408.54)Local Fire Protection: $32,751,000 ($286.53)Regular Highways: $30,975,000 ($271.00)Sewerage: $25,556,000 ($223.59)Housing and Community Development: $7,248,000 ($63.41)Parks and Recreation: $5,111,000 ($44.72)Libraries: $5,018,000 ($43.90)General - Other: $4,693,000 ($41.06)Sea and Inland Port Facilities: $2,388,000 ($20.89)Protective Inspection and Regulation - Other: $1,058,000 ($9.26)Miscellaneous Commercial Activities - Other: $789,000 ($6.90)Transit Utilities: $3,000 ($0.03)General - Interest on Debt: $30,572,000 ($267.47)
Richmond government finances - Revenue in 2021 (per resident):
Charges - Sewerage: $57,623,000 ($504.13)
Other: $31,552,000 ($276.04)Sea and Inland Port Facilities: $10,610,000 ($92.83)Solid Waste Management: $1,347,000 ($11.78)Miscellaneous Commercial Activities: $1,146,000 ($10.03)Housing and Community Development: $862,000 ($7.54)Regular Highways: $702,000 ($6.14)Parks and Recreation: $172,000 ($1.50)Federal Intergovernmental - Other: $2,558,000 ($22.38)
Housing and Community Development: $2,049,000 ($17.93)Sewerage: $26,000 ($0.23)Local Intergovernmental - Other: $2,419,000 ($21.16)
Miscellaneous - General Revenue - Other: $17,812,000 ($155.83)
Interest Earnings: $1,116,000 ($9.76)Rents: $699,000 ($6.12)Special Assessments: $666,000 ($5.83)Fines and Forfeits: $455,000 ($3.98)Donations From Private Sources: $78,000 ($0.68)Sale of Property: $71,000 ($0.62)Revenue - Transit Utilities: $1,164,000 ($10.18)
State Intergovernmental - Other: $6,405,000 ($56.04)
Highways: $4,490,000 ($39.28)Public Welfare: $1,989,000 ($17.40)Sewerage: $1,723,000 ($15.07)General Local Government Support: $394,000 ($3.45)Tax - Property: $77,861,000 ($681.19)
Public Utilities Sales: $45,527,000 ($398.31)Other: $26,296,000 ($230.06)Documentary and Stock Transfer: $19,858,000 ($173.73)General Sales and Gross Receipts: $19,553,000 ($171.07)Other License: $12,824,000 ($112.19)Occupation and Business License - Other: $3,168,000 ($27.72)Other Selective Sales: $782,000 ($6.84)
Richmond government finances - Debt in 2021 (per resident):
Long Term Debt - Beginning Outstanding - Unspecified Public Purpose: $716,277,000 ($6266.59)
Outstanding Unspecified Public Purpose: $667,311,000 ($5838.19)Retired Unspecified Public Purpose: $54,505,000 ($476.85)Issue, Unspecified Public Purpose: $5,538,000 ($48.45)Beginning Outstanding - Public Debt for Private Purpose: $3,000,000 ($26.25)Outstanding Nonguaranteed - Industrial Revenue: $3,000,000 ($26.25)
Richmond government finances - Cash and Securities in 2021 (per resident):
Bond Funds - Cash and Securities: $3,636,000 ($31.81)
Other Funds - Cash and Securities: $188,293,000 ($1647.34)
Sinking Funds - Cash and Securities: $41,473,000 ($362.84)
6.37% of this county's 2021 resident taxpayers lived in other counties in 2020 ($134,084 average adjusted gross income )
Here:
6.37%California average:
5.19%
0.01% of residents moved from foreign countries ($98 average AGI )Contra Costa County:
0.01%California average:
0.03%
Top counties from which taxpayers relocated into this county between 2020 and 2021:
7.09% of this county's 2020 resident taxpayers moved to other counties in 2021 ($123,334 average adjusted gross income )
Here:
7.09%California average:
6.14%
0.01% of residents moved to foreign countries ($92 average AGI )Contra Costa County:
0.01%California average:
0.02%
Top counties to which taxpayers relocated from this county between 2020 and 2021:
Businesses in Richmond, CA
Name Count Name Count
24 Hour Fitness 1 Long John Silver's 1 7-Eleven 1 Macy's 1 99 Cents Only Stores 1 Marriott 1 AT&T 3 McDonald's 2 Ace Hardware 2 Motherhood Maternity 1 AutoZone 2 Nike 16 Big O Tires 1 Nissan 1 Burger King 4 Panda Express 1 CVS 1 Payless 2 Church's Chicken 1 PetSmart 1 Cinnabon 1 Quiznos 1 Costco 1 RadioShack 1 Days Inn 2 Safeway 1 Domino's Pizza 1 Sears 2 El Pollo Loco 1 Sprint Nextel 1 Extended Stay America 1 Starbucks 2 FedEx 8 Subway 6 Finish Line 1 T-Mobile 4 Firestone Complete Auto Care 1 Taco Bell 1 Foot Locker 2 Target 1 Ford 1 Toyota 1 GNC 1 U-Haul 2 GameStop 3 UPS 5 H&R Block 1 Vans 4 IHOP 1 Volkswagen 1 JCPenney 1 Vons 1 Jones New York 1 Walgreens 1 KFC 2 Walmart 1 Kroger 1 Wendy's 1 Lane Furniture 1 YMCA 1 LensCrafters 1
Strongest AM radio stations in Richmond:
KNEW (910 AM; 20 kW; OAKLAND, CA; Owner: AMFM RADIO LICENSES, L.L.C.)
KTRB (860 AM; 50 kW; MODESTO, CA; Owner: PAPPAS RADIO OF CALIFORNIA, A CALIFORNIA LIMITED PARTNERSHIP)
KIQI (1010 AM; 35 kW; SAN FRANCISCO, CA; Owner: RADIO UNICA OF SAN FRANCISCO LICENSE CORP.)
KCBS (740 AM; 50 kW; SAN FRANCISCO, CA; Owner: INFINITY BROADCASTING OPERATIONS, INC.)
KFRC (610 AM; 5 kW; SAN FRANCISCO, CA; Owner: INFINITY BROADCASTING CORPORATION OF LOS ANGELES)
KTCT (1050 AM; 50 kW; SAN MATEO, CA; Owner: SUSQUEHANNA RADIO CORP.)
KNBR (680 AM; 50 kW; SAN FRANCISCO, CA; Owner: KNBR LICO, INC.)
KFAX (1100 AM; 50 kW; SAN FRANCISCO, CA; Owner: GOLDEN GATE BROADCASTING CO, INC.)
KABL (960 AM; 5 kW; OAKLAND, CA; Owner: AMFM RADIO LICENSES, L.L.C.)
KMZT (1510 AM; 8 kW; SAN RAFAEL, CA; Owner: MOUNT WILSON FM BROADCASTERS, INC.)
KMKY (1310 AM; 5 kW; OAKLAND, CA; Owner: KGO-AM RADIO, INC.)
KGO (810 AM; 50 kW; SAN FRANCISCO, CA; Owner: KGO-AM RADIO, INC.)
KDYA (1190 AM; 10 kW; VALLEJO, CA; Owner: BAYBRIDGE COMMUNICATIONS, L.L.C.)
Strongest FM radio stations in Richmond:
K249DJ (97.7 FM; SAN PABLO, CA; Owner: EL CERRITO HIGH SCHOOL)
KSFB-FM (100.7 FM; SAN RAFAEL, CA; Owner: GOLDEN GATE BROADCASTING COMPANY, INC.)
KLLC (97.3 FM; SAN FRANCISCO, CA; Owner: INFINITY BROADCASTING OPERATIONS, INC.)
KALX (90.7 FM; BERKELEY, CA; Owner: UNIVERSITY OF CALIFORNIA)
KDFC-FM (102.1 FM; SAN FRANCISCO, CA; Owner: BONNEVILLE HOLDING COMPANY)
KKSF-FM1 (103.7 FM; PLEASANTON, ETC., CA; Owner: AMFM RADIO LICENSES, L.L.C.)
KOIT-FM (96.5 FM; SAN FRANCISCO, CA; Owner: BONNEVILLE HOLDING COMPANY)
KBLX-FM2 (102.9 FM; PLEASANTON, CA; Owner: ICBC BROADCAST HOLDINGS -CA, INC.)
KSOL-FM3 (98.9 FM; PLEASANTON, CA; Owner: TMS LICENSE CALIFORNIA, INC)
KFRC-FM3 (99.7 FM; WALNUT CREEK, CA; Owner: INFINITY KFRC-FM, INC.)
KZBR-FM1 (95.7 FM; WALNUT CREEK, CA; Owner: BONNEVILLE HOLDING COMPANY)
KKSF (103.7 FM; SAN FRANCISCO, CA; Owner: AMFM RADIO LICENSES, L.L.C.)
KISQ (98.1 FM; SAN FRANCISCO, CA; Owner: AMFM RADIO LICENSES, L.L.C.)
KFOG (104.5 FM; SAN FRANCISCO, CA; Owner: KFFG LICO, INC)
KEAR (106.9 FM; SAN FRANCISCO, CA; Owner: FAMILY STATIONS, INC.)
KISQ-FM3 (98.1 FM; CONCORD, CA; Owner: AMFM RADIO LICENSES, L.L.C.)
KSOL-FM2 (98.9 FM; SAUSALITO, ETC., CA; Owner: TMS LICENSE CALIFORNIA, INC)
KSOL (98.9 FM; SAN FRANCISCO, CA; Owner: TMS LICENSE CALIFORNIA, INC)
KMEL-FM1 (106.1 FM; CONCORD, CA; Owner: AMFM RADIO LICENSES, L.L.C.)
KDFC-FM1 (102.1 FM; LAFAYETTE, CA; Owner: BONNEVILLE HOLDING COMPANY)
TV broadcast stations around Richmond:
KQED (Channel 9; SAN FRANCISCO, CA; Owner: KQED, INC.)
KGO-TV (Channel 7; SAN FRANCISCO, CA; Owner: KGO TELEVISION, INC.)
KPIX-TV (Channel 5; SAN FRANCISCO, CA; Owner: CBS BROADCASTING INC.)
KTVU (Channel 2; OAKLAND, CA; Owner: KTVU PARTNERSHIP)
KRON-TV (Channel 4; SAN FRANCISCO, CA; Owner: YOUNG BROADCASTING OF SAN FRANCISCO, INC.)
KMTP-TV (Channel 32; SAN FRANCISCO, CA; Owner: MINORITY TELEVISION PROJECT)
KBHK-TV (Channel 44; SAN FRANCISCO, CA; Owner: VIACOM TELEVISION STATIONS GROUP OF SAN FRANCISCO INC.)
KBWB (Channel 20; SAN FRANCISCO, CA; Owner: KBWB LICENSE, INC.)
KFSF (Channel 66; VALLEJO, CA; Owner: TELEFUTURA SAN FRANCISCO LLC)
KCNS (Channel 38; SAN FRANCISCO, CA; Owner: WRAY, INC.)
KCSM-TV (Channel 60; SAN MATEO, CA; Owner: SAN MATEO COUNTY COMMUNITY COLLEGE DISTRICT)
KOVR (Channel 13; STOCKTON, CA; Owner: SCI - SACRAMENTO LICENSEE, LLC)
KXTV (Channel 10; SACRAMENTO, CA; Owner: KXTV, INC.)
KSPX (Channel 29; SACRAMENTO, CA; Owner: PAXSON SACRAMENTO LICENSE, INC.)
KCRA-TV (Channel 3; SACRAMENTO, CA; Owner: KCRA HEARST-ARGYLE TELEVISION, INC.)
KTXL (Channel 40; SACRAMENTO, CA; Owner: CHANNEL 40, INC.)
KUVS (Channel 19; MODESTO, CA; Owner: KUVS LICENSE PARTNERSHIP, G.P.)
KQCA (Channel 58; STOCKTON, CA; Owner: KCRA HEARST-ARGYLE TELEVISION, INC.)
KVIE (Channel 6; SACRAMENTO, CA; Owner: KVIE, INC.)
KMAX-TV (Channel 31; SACRAMENTO, CA; Owner: UPN STATIONS GROUP INC.)
KTNC-TV (Channel 42; CONCORD, CA; Owner: KTNC LICENSE, LLC)
KTSF (Channel 26; SAN FRANCISCO, CA; Owner: LINCOLN BROADCASTING COMPANY, A CALIFORNIA LP)
National Bridge Inventory (NBI) Statistics 115 Number of bridges4,278ft / 1,304m Total length $15,237,000 Total costs5,035,966 Total average daily traffic180,664 Total average daily truck traffic
New bridges - historical statistics
2 1930-1939 17 1950-1959 17 1960-1969 8 1970-1979 26 1980-1989 40 1990-1999 4 2000-2009 1 2010-2019
See full National Bridge Inventory statistics for Richmond, CA
Home Mortgage Disclosure Act Aggregated Statistics For Year 2009(Based on 15 full and 7 partial tracts) A) FHA, FSA/RHS & VA B) Conventional C) Refinancings D) Home Improvement Loans E) Loans on Dwellings For 5+ Families F) Non-occupant Loans on G) Loans On Manufactured Number Average Value Number Average Value Number Average Value Number Average Value Number Average Value Number Average Value Number Average Value
LOANS ORIGINATED 415 $213,318 684 $196,290 942 $240,030 62 $145,488 7 $3,319,067 218 $154,943 1 $195,620 APPLICATIONS APPROVED, NOT ACCEPTED 53 $221,328 145 $179,940 147 $262,655 14 $115,064 0 $0 55 $131,507 0 $0 APPLICATIONS DENIED 123 $209,153 264 $173,965 706 $257,187 60 $95,814 3 $675,943 189 $159,726 1 $81,020 APPLICATIONS WITHDRAWN 68 $202,340 129 $176,991 283 $252,310 22 $124,434 0 $0 60 $141,006 0 $0 FILES CLOSED FOR INCOMPLETENESS 29 $201,781 27 $201,024 118 $236,391 7 $59,523 0 $0 14 $160,679 0 $0
Aggregated Statistics For Year 2008(Based on 15 full and 7 partial tracts) A) FHA, FSA/RHS & VA B) Conventional C) Refinancings D) Home Improvement Loans E) Loans on Dwellings For 5+ Families F) Non-occupant Loans on G) Loans On Manufactured Number Average Value Number Average Value Number Average Value Number Average Value Number Average Value Number Average Value Number Average Value
LOANS ORIGINATED 221 $243,396 883 $225,263 629 $262,980 72 $134,812 16 $623,747 281 $184,414 1 $85,880 APPLICATIONS APPROVED, NOT ACCEPTED 34 $289,973 225 $262,376 251 $292,692 23 $146,968 2 $725,885 68 $206,532 3 $81,597 APPLICATIONS DENIED 78 $242,787 375 $232,272 953 $315,443 151 $137,344 5 $456,768 196 $220,062 5 $121,542 APPLICATIONS WITHDRAWN 46 $276,457 152 $237,472 293 $293,859 22 $149,853 1 $456,980 69 $236,116 0 $0 FILES CLOSED FOR INCOMPLETENESS 15 $215,055 71 $281,702 109 $314,320 14 $119,861 3 $618,553 27 $260,341 1 $295,000
Aggregated Statistics For Year 2007(Based on 15 full and 7 partial tracts) A) FHA, FSA/RHS & VA B) Conventional C) Refinancings D) Home Improvement Loans E) Loans on Dwellings For 5+ Families F) Non-occupant Loans on G) Loans On Manufactured Number Average Value Number Average Value Number Average Value Number Average Value Number Average Value Number Average Value Number Average Value
LOANS ORIGINATED 1 $247,550 1,417 $308,500 2,438 $307,462 359 $209,689 26 $3,670,803 475 $301,987 3 $297,397 APPLICATIONS APPROVED, NOT ACCEPTED 3 $303,353 387 $318,568 788 $317,435 93 $244,923 2 $995,725 132 $309,338 1 $227,630 APPLICATIONS DENIED 2 $290,720 951 $315,094 2,379 $341,101 417 $178,215 2 $631,965 342 $322,197 10 $114,252 APPLICATIONS WITHDRAWN 2 $314,620 240 $335,696 894 $330,945 85 $180,008 9 $1,220,763 136 $293,349 1 $180,000 FILES CLOSED FOR INCOMPLETENESS 0 $0 106 $322,151 368 $350,951 31 $208,585 1 $135,000 54 $319,232 0 $0
Aggregated Statistics For Year 2006(Based on 15 full and 7 partial tracts) A) FHA, FSA/RHS & VA B) Conventional C) Refinancings D) Home Improvement Loans E) Loans on Dwellings For 5+ Families F) Non-occupant Loans on G) Loans On Manufactured Number Average Value Number Average Value Number Average Value Number Average Value Number Average Value Number Average Value Number Average Value
LOANS ORIGINATED 2 $321,090 2,884 $284,751 3,939 $310,949 614 $234,934 24 $1,294,759 691 $304,803 5 $167,784 APPLICATIONS APPROVED, NOT ACCEPTED 0 $0 815 $277,164 1,022 $312,225 121 $241,909 2 $932,270 191 $289,709 0 $0 APPLICATIONS DENIED 1 $93,280 1,553 $281,652 2,447 $331,970 519 $213,438 8 $425,526 403 $320,967 10 $256,412 APPLICATIONS WITHDRAWN 2 $243,030 616 $284,510 1,368 $327,446 159 $232,235 5 $859,442 170 $315,636 3 $191,000 FILES CLOSED FOR INCOMPLETENESS 0 $0 167 $279,614 416 $323,478 39 $243,852 2 $874,325 55 $322,371 0 $0
Aggregated Statistics For Year 2005(Based on 15 full and 7 partial tracts) A) FHA, FSA/RHS & VA B) Conventional C) Refinancings D) Home Improvement Loans E) Loans on Dwellings For 5+ Families F) Non-occupant Loans on G) Loans On Manufactured Number Average Value Number Average Value Number Average Value Number Average Value Number Average Value Number Average Value Number Average Value
LOANS ORIGINATED 1 $290,000 3,573 $288,047 4,513 $296,340 581 $234,098 34 $1,792,740 908 $286,151 5 $286,226 APPLICATIONS APPROVED, NOT ACCEPTED 0 $0 664 $274,412 858 $295,899 101 $203,542 4 $1,263,010 185 $279,660 4 $144,620 APPLICATIONS DENIED 0 $0 1,339 $283,590 2,400 $294,046 450 $192,895 8 $522,604 381 $285,834 13 $213,660 APPLICATIONS WITHDRAWN 0 $0 616 $294,051 1,632 $290,445 202 $216,972 1 $640,840 238 $283,664 6 $275,682 FILES CLOSED FOR INCOMPLETENESS 0 $0 157 $307,101 526 $300,123 35 $221,953 1 $428,000 66 $289,491 1 $302,380
Aggregated Statistics For Year 2004(Based on 15 full and 7 partial tracts) A) FHA, FSA/RHS & VA B) Conventional C) Refinancings D) Home Improvement Loans E) Loans on Dwellings For 5+ Families F) Non-occupant Loans on G) Loans On Manufactured Number Average Value Number Average Value Number Average Value Number Average Value Number Average Value Number Average Value Number Average Value
LOANS ORIGINATED 6 $185,740 3,056 $245,304 4,760 $245,356 479 $186,290 47 $1,341,080 884 $245,113 4 $182,478 APPLICATIONS APPROVED, NOT ACCEPTED 2 $251,500 565 $246,039 972 $248,547 74 $169,128 1 $1,250,460 154 $249,112 1 $248,000 APPLICATIONS DENIED 3 $271,473 1,096 $231,163 2,451 $253,269 390 $159,189 7 $769,973 342 $240,272 8 $174,571 APPLICATIONS WITHDRAWN 3 $406,860 488 $250,932 1,631 $241,811 126 $148,247 3 $958,157 162 $239,963 0 $0 FILES CLOSED FOR INCOMPLETENESS 0 $0 107 $275,691 583 $262,104 22 $172,680 2 $534,500 73 $236,478 0 $0
Aggregated Statistics For Year 2003(Based on 15 full and 7 partial tracts) A) FHA, FSA/RHS & VA B) Conventional C) Refinancings D) Home Improvement Loans E) Loans on Dwellings For 5+ Families F) Non-occupant Loans on Number Average Value Number Average Value Number Average Value Number Average Value Number Average Value Number Average Value
LOANS ORIGINATED 54 $256,605 1,955 $228,855 7,410 $203,760 169 $63,347 23 $1,401,787 974 $194,317 APPLICATIONS APPROVED, NOT ACCEPTED 11 $132,983 355 $236,356 1,308 $208,204 50 $73,358 2 $289,640 178 $208,767 APPLICATIONS DENIED 12 $280,822 559 $215,028 2,153 $211,041 187 $39,097 10 $624,428 277 $218,248 APPLICATIONS WITHDRAWN 11 $236,075 266 $221,970 2,148 $196,110 45 $62,807 3 $870,803 163 $189,078 FILES CLOSED FOR INCOMPLETENESS 0 $0 77 $240,440 361 $209,343 7 $46,451 1 $350,000 43 $184,641
Aggregated Statistics For Year 2002(Based on 15 full and 7 partial tracts) A) FHA, FSA/RHS & VA B) Conventional C) Refinancings D) Home Improvement Loans E) Loans on Dwellings For 5+ Families F) Non-occupant Loans on Number Average Value Number Average Value Number Average Value Number Average Value Number Average Value Number Average Value
LOANS ORIGINATED 114 $215,531 1,671 $208,283 5,263 $188,877 159 $65,209 40 $1,301,765 712 $188,330 APPLICATIONS APPROVED, NOT ACCEPTED 20 $120,290 260 $212,325 965 $182,214 58 $40,938 1 $1,414,660 97 $200,427 APPLICATIONS DENIED 20 $176,624 411 $182,573 1,538 $181,217 160 $42,827 10 $652,406 215 $197,250 APPLICATIONS WITHDRAWN 10 $198,360 224 $206,034 1,529 $177,960 51 $52,668 3 $547,333 124 $179,939 FILES CLOSED FOR INCOMPLETENESS 2 $314,115 83 $196,037 358 $190,149 6 $40,450 1 $922,320 43 $172,553
Aggregated Statistics For Year 2001(Based on 15 full and 7 partial tracts) A) FHA, FSA/RHS & VA B) Conventional C) Refinancings D) Home Improvement Loans E) Loans on Dwellings For 5+ Families F) Non-occupant Loans on Number Average Value Number Average Value Number Average Value Number Average Value Number Average Value Number Average Value
LOANS ORIGINATED 174 $198,397 1,575 $182,483 4,274 $169,657 195 $42,626 25 $682,748 625 $156,778 APPLICATIONS APPROVED, NOT ACCEPTED 18 $168,377 251 $176,255 691 $161,082 42 $45,185 2 $205,000 119 $158,542 APPLICATIONS DENIED 23 $220,405 500 $168,079 1,440 $150,225 209 $28,347 3 $373,813 179 $159,375 APPLICATIONS WITHDRAWN 38 $176,507 284 $184,962 1,213 $148,683 79 $49,729 4 $1,263,230 123 $142,935 FILES CLOSED FOR INCOMPLETENESS 3 $135,623 65 $158,974 303 $160,540 12 $73,009 2 $1,220,585 32 $141,457
Aggregated Statistics For Year 2000(Based on 15 full and 7 partial tracts) A) FHA, FSA/RHS & VA B) Conventional C) Refinancings D) Home Improvement Loans E) Loans on Dwellings For 5+ Families F) Non-occupant Loans on Number Average Value Number Average Value Number Average Value Number Average Value Number Average Value Number Average Value
LOANS ORIGINATED 309 $153,539 1,574 $147,875 1,330 $128,718 192 $33,423 28 $497,687 353 $123,481 APPLICATIONS APPROVED, NOT ACCEPTED 34 $129,576 215 $136,806 338 $122,549 104 $33,341 1 $165,000 58 $122,388 APPLICATIONS DENIED 56 $154,899 569 $145,037 1,014 $115,571 209 $33,919 12 $660,338 147 $125,636 APPLICATIONS WITHDRAWN 22 $159,340 243 $150,337 653 $116,831 33 $33,886 4 $814,675 73 $120,209 FILES CLOSED FOR INCOMPLETENESS 9 $162,463 60 $135,659 310 $127,191 8 $32,635 5 $1,766,906 37 $118,773
Aggregated Statistics For Year 1999(Based on 12 full and 11 partial tracts) A) FHA, FSA/RHS & VA B) Conventional C) Refinancings D) Home Improvement Loans E) Loans on Dwellings For 5+ Families F) Non-occupant Loans on Number Average Value Number Average Value Number Average Value Number Average Value Number Average Value Number Average Value
LOANS ORIGINATED 424 $129,986 1,253 $133,174 1,716 $117,779 271 $18,952 25 $451,296 388 $101,196 APPLICATIONS APPROVED, NOT ACCEPTED 37 $103,359 141 $132,087 413 $115,519 103 $23,311 2 $760,460 58 $100,093 APPLICATIONS DENIED 72 $123,370 321 $119,498 1,098 $102,476 261 $20,504 7 $294,391 162 $94,017 APPLICATIONS WITHDRAWN 51 $121,747 258 $122,530 824 $114,084 36 $28,446 4 $958,365 86 $104,495 FILES CLOSED FOR INCOMPLETENESS 8 $139,296 70 $130,113 298 $114,602 8 $18,515 4 $698,285 35 $80,701
Detailed mortgage data for all 22 tracts in Richmond, CA
Private Mortgage Insurance Companies Aggregated Statistics For Year 2009(Based on 15 full and 7 partial tracts) A) Conventional B) Refinancings C) Non-occupant Loans on Number Average Value Number Average Value Number Average Value
LOANS ORIGINATED 89 $229,453 13 $276,232 2 $110,405 APPLICATIONS APPROVED, NOT ACCEPTED 56 $222,806 7 $290,899 2 $181,480 APPLICATIONS DENIED 10 $265,722 3 $327,450 1 $48,000 APPLICATIONS WITHDRAWN 8 $225,798 4 $188,885 0 $0 FILES CLOSED FOR INCOMPLETENESS 1 $297,630 0 $0 0 $0
Aggregated Statistics For Year 2008(Based on 15 full and 7 partial tracts) A) Conventional B) Refinancings C) Non-occupant Loans on Number Average Value Number Average Value Number Average Value
LOANS ORIGINATED 260 $269,146 36 $374,291 9 $201,528 APPLICATIONS APPROVED, NOT ACCEPTED 116 $319,653 50 $418,741 5 $260,010 APPLICATIONS DENIED 60 $256,333 7 $436,320 8 $201,086 APPLICATIONS WITHDRAWN 19 $265,175 2 $354,585 4 $300,428 FILES CLOSED FOR INCOMPLETENESS 5 $297,254 1 $247,160 2 $380,940
Aggregated Statistics For Year 2007(Based on 15 full and 7 partial tracts) A) Conventional B) Refinancings C) Non-occupant Loans on Number Average Value Number Average Value Number Average Value
LOANS ORIGINATED 114 $365,510 88 $407,508 8 $330,685 APPLICATIONS APPROVED, NOT ACCEPTED 25 $390,925 40 $438,700 2 $374,000 APPLICATIONS DENIED 8 $440,564 11 $452,300 3 $385,120 APPLICATIONS WITHDRAWN 11 $357,053 17 $451,327 4 $282,590 FILES CLOSED FOR INCOMPLETENESS 0 $0 1 $369,340 0 $0
Aggregated Statistics For Year 2006(Based on 14 full and 7 partial tracts) A) Conventional B) Refinancings C) Non-occupant Loans on Number Average Value Number Average Value Number Average Value
LOANS ORIGINATED 20 $407,354 31 $415,804 1 $407,100 APPLICATIONS APPROVED, NOT ACCEPTED 6 $471,200 11 $421,174 0 $0 APPLICATIONS DENIED 2 $338,000 2 $427,685 0 $0 APPLICATIONS WITHDRAWN 1 $225,000 3 $508,380 0 $0 FILES CLOSED FOR INCOMPLETENESS 1 $795,570 0 $0 0 $0
Aggregated Statistics For Year 2005(Based on 13 full and 7 partial tracts) A) Conventional B) Refinancings C) Non-occupant Loans on Number Average Value Number Average Value Number Average Value
LOANS ORIGINATED 50 $318,066 48 $372,269 4 $356,800 APPLICATIONS APPROVED, NOT ACCEPTED 8 $337,708 12 $303,172 2 $377,840 APPLICATIONS DENIED 0 $0 3 $407,660 0 $0 APPLICATIONS WITHDRAWN 3 $321,660 6 $330,243 0 $0 FILES CLOSED FOR INCOMPLETENESS 0 $0 1 $284,110 0 $0
Aggregated Statistics For Year 2004(Based on 15 full and 7 partial tracts) A) Conventional B) Refinancings C) Non-occupant Loans on Number Average Value Number Average Value Number Average Value
LOANS ORIGINATED 83 $283,438 55 $304,211 13 $254,844 APPLICATIONS APPROVED, NOT ACCEPTED 22 $292,165 25 $261,739 2 $373,760 APPLICATIONS DENIED 2 $254,500 3 $324,293 0 $0 APPLICATIONS WITHDRAWN 7 $294,584 5 $259,874 0 $0 FILES CLOSED FOR INCOMPLETENESS 1 $608,660 1 $494,000 0 $0
Aggregated Statistics For Year 2003(Based on 15 full and 7 partial tracts) A) Conventional B) Refinancings C) Non-occupant Loans on Number Average Value Number Average Value Number Average Value
LOANS ORIGINATED 144 $257,673 121 $251,017 11 $222,884 APPLICATIONS APPROVED, NOT ACCEPTED 30 $255,194 45 $252,033 5 $241,972 APPLICATIONS DENIED 1 $271,000 5 $300,538 1 $513,970 APPLICATIONS WITHDRAWN 7 $237,576 7 $240,559 3 $248,357 FILES CLOSED FOR INCOMPLETENESS 0 $0 0 $0 0 $0
Aggregated Statistics For Year 2002(Based on 15 full and 7 partial tracts) A) Conventional B) Refinancings C) Non-occupant Loans on Number Average Value Number Average Value Number Average Value
LOANS ORIGINATED 255 $232,200 103 $219,994 18 $192,582 APPLICATIONS APPROVED, NOT ACCEPTED 54 $236,514 36 $233,909 5 $241,650 APPLICATIONS DENIED 13 $273,584 1 $279,380 0 $0 APPLICATIONS WITHDRAWN 14 $245,299 17 $209,266 5 $158,034 FILES CLOSED FOR INCOMPLETENESS 1 $346,180 0 $0 0 $0
Aggregated Statistics For Year 2001(Based on 15 full and 7 partial tracts) A) Conventional B) Refinancings C) Non-occupant Loans on Number Average Value Number Average Value Number Average Value
LOANS ORIGINATED 360 $196,072 114 $201,380 33 $166,354 APPLICATIONS APPROVED, NOT ACCEPTED 77 $179,430 44 $190,903 8 $148,000 APPLICATIONS DENIED 14 $191,276 11 $194,735 3 $143,597 APPLICATIONS WITHDRAWN 11 $225,460 6 $179,030 1 $123,000 FILES CLOSED FOR INCOMPLETENESS 5 $181,512 1 $280,930 0 $0
Aggregated Statistics For Year 2000(Based on 15 full and 7 partial tracts) A) Conventional B) Refinancings C) Non-occupant Loans on Number Average Value Number Average Value Number Average Value
LOANS ORIGINATED 438 $160,867 135 $156,244 47 $133,607 APPLICATIONS APPROVED, NOT ACCEPTED 50 $155,422 43 $160,992 9 $107,866 APPLICATIONS DENIED 22 $168,313 13 $209,935 3 $143,333 APPLICATIONS WITHDRAWN 10 $170,784 5 $163,842 1 $217,810 FILES CLOSED FOR INCOMPLETENESS 3 $155,210 0 $0 0 $0
Aggregated Statistics For Year 1999(Based on 12 full and 11 partial tracts) A) Conventional B) Refinancings C) Non-occupant Loans on Number Average Value Number Average Value Number Average Value
LOANS ORIGINATED 313 $148,565 126 $139,765 14 $112,293 APPLICATIONS APPROVED, NOT ACCEPTED 26 $142,231 31 $142,695 2 $151,650 APPLICATIONS DENIED 22 $152,507 7 $195,201 4 $149,028 APPLICATIONS WITHDRAWN 8 $212,598 5 $157,568 0 $0 FILES CLOSED FOR INCOMPLETENESS 2 $171,070 4 $112,028 0 $0
Fire-safe hotels and motels in Richmond, California:
Extended Stay America - Richmond - Hilltop Mall, 3170 Garrity Way, Richmond, California 94806 Phone: (510) 222-7383, Fax: (510) 222-7473
Americas Best Value Inn, 1598 Carlson Blvd, Richmond, California 94804 Phone: (510) 526-2665, Fax: (510) 528-4472
SureStay Plus Richmond, 915 W Cutting Blvd, Richmond, California 94804 Phone: (510) 237-3000
All 3 fire-safe hotels and motels in Richmond, California
Most common first names in Richmond, CA among deceased individuals Name Count Lived (average)
John 455 72.1 years Mary 393 76.9 years William 376 73.6 years James 334 68.5 years Robert 256 68.9 years George 241 74.0 years Charles 235 68.2 years Willie 201 72.1 years Joseph 157 72.6 years Frank 151 74.5 years
Most common last names in Richmond, CA among deceased individuals Last name Count Lived (average)
Johnson 255 71.3 years Williams 254 69.7 years Smith 214 70.2 years Jones 195 71.4 years Brown 195 71.9 years Davis 130 71.5 years Jackson 130 73.0 years Thomas 115 71.9 years Moore 100 71.7 years Wilson 95 70.9 years
Richmond compared to California state average:
Unemployed percentage below state average. Black race population percentage significantly above state average. Length of stay since moving in above state average. Richmond, CA compared to other similar cities:
#2 on the list of "Top 101 cities with the highest number of auto thefts per 100,000 residents, excludes tourist destinations and others with a lot of outsiders visiting based on city industries data (population 50,000+)"
#10 on the list of "Top 101 cities with largest percentage of females in occupations: building and grounds cleaning and maintenance occupations (population 50,000+)"
#10 on the list of "Top 101 cities with largest percentage of females in occupations: transportation occupations (population 50,000+)"
#11 on the list of "Top 101 cities with largest percentage of females in occupations: community and social service occupations (population 50,000+)"
#11 on the list of "Top 101 cities with the highest ratio of murders to rapes between 2002 and 2012 (population 50,000+)"
#12 on the list of "Top 101 cities with largest percentage of males in occupations: construction and extraction occupations (population 50,000+)"
#18 on the list of "Top 101 cities with largest percentage of males in industries: construction (population 50,000+)"
#19 on the list of "Top 100 most racially diverse cities (pop. 50,000+)"
#26 on the list of "Top 101 cities with largest percentage of females in occupations: sales and related occupations (population 50,000+)"
#27 on the list of "Top 101 cities with the largest percentage of people in institutions for the blind (population 1,000+)"
#30 on the list of "Top 101 cities with the largest city-data.com crime index per police officer (population 50,000+)"
#31 on the list of "Top 101 cities with the highest city-data.com crime index, excludes tourist destinations and others with a lot of outsiders visiting based on city industries data (population 50,000+)"
#33 on the list of "Top 101 cities with the largest percentage of likely lesbian couples (counted as self-reported female-female unmarried-partner households) (population 50,000+)"
#35 on the list of "Top 101 cities with the highest maximum monthly sunshine amount (population 50,000+)"
#36 on the list of "Top 101 cities with the largest percentage of people in crews of maritime vessels (population 1,000+)"
#37 on the list of "Top 101 cities with the highest number of murders per 100,000 residents, excludes tourist destinations and others with a lot of outsiders visiting based on city industries data (population 50,000+)"
#39 on the list of "Top 101 cities with largest percentage of males in occupations: healthcare support occupations (population 50,000+)"
#40 on the list of "Top 101 cities with the largest differences between morning and afternoon humidity (population 50,000+)"
#41 on the list of "Top 101 cities with the largest humidity differences during a year (population 50,000+)"
#45 on the list of "Top 101 cities with the smallest temperature differences during a year (population 50,000+)"
#10 on the list of "Top 101 counties with the largest increase in the number of infant deaths per 1000 residents 2000-2006 to 2007-2013 (pop. 50,000+)"
#15 on the list of "Top 101 counties with the lowest Sulfur Oxides Annual air pollution readings in 2012 (µg/m3 )"
#17 on the list of "Top 101 counties with the highest Nitrogen Dioxide air pollution readings in 2012 (ppm)"
#31 on the list of "Top 101 counties with the highest percentage of residents that drank alcohol in the past 30 days"
#34 on the list of "Top 101 counties with the highest surface withdrawal of fresh water for public supply (pop. 50,000+)"
Top Patent Applicants
Fyodor Urnov (41)
John M. Rosenbaum (33)
Dan Xie (26)
Michael C. Holmes (26)
Jeffrey C. Miller (26)
Allen Yang Yang (22)
Huping Luo (21)
Philip D. Gregory (20)
Howard S. Lacheen (19)
Shuwu Yang (19)
Total of 1039 patent applications in 2008-2024.

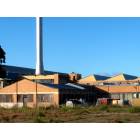
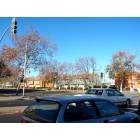
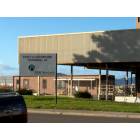
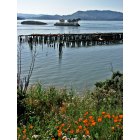
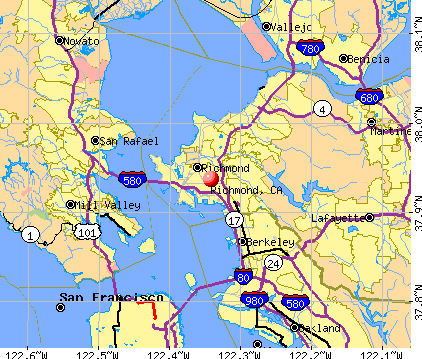


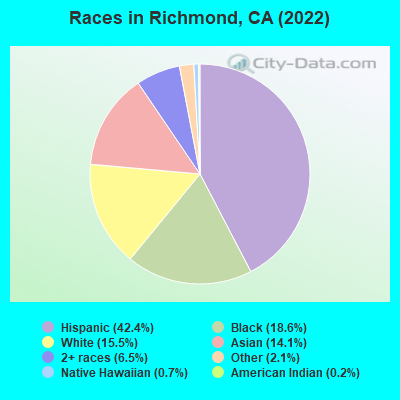
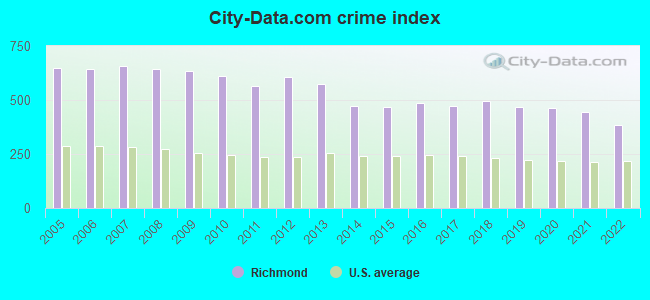
 Recent articles from our blog. Our writers, many of them Ph.D. graduates or candidates, create easy-to-read articles on a wide variety of topics.

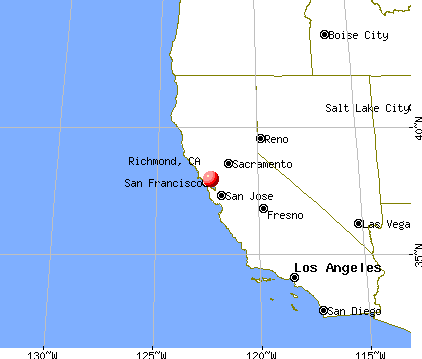
 , pop. 236,008).
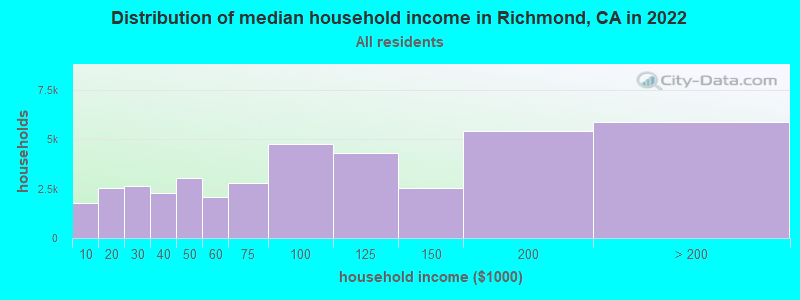
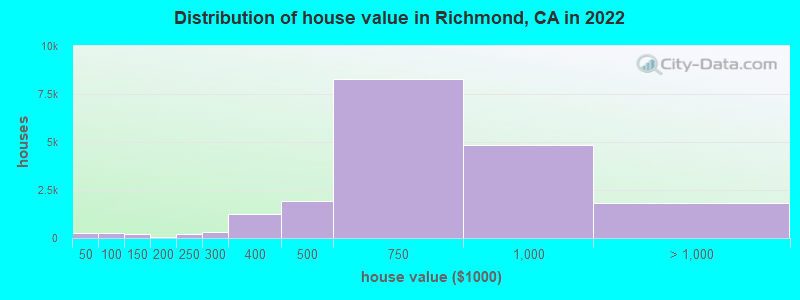

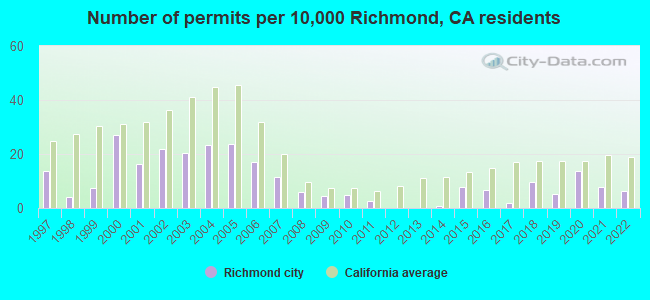
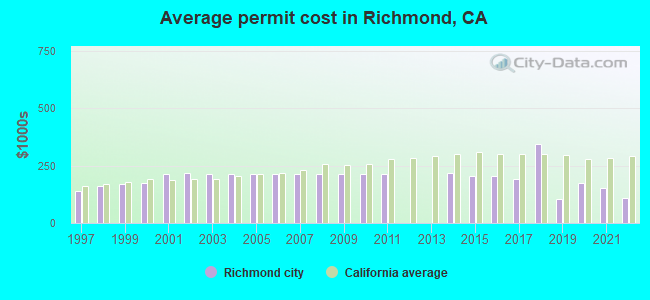
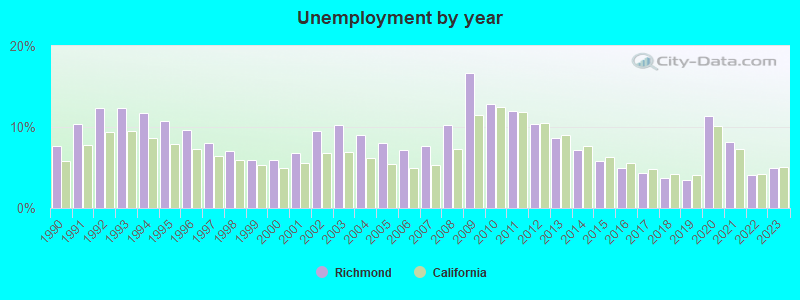
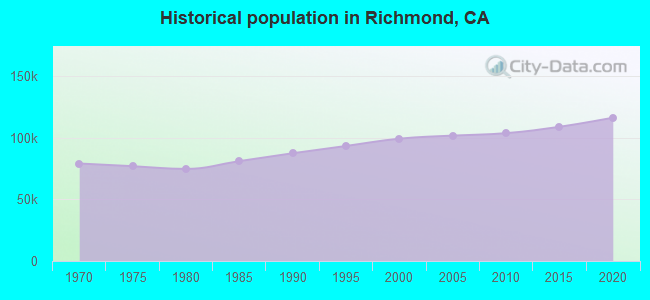
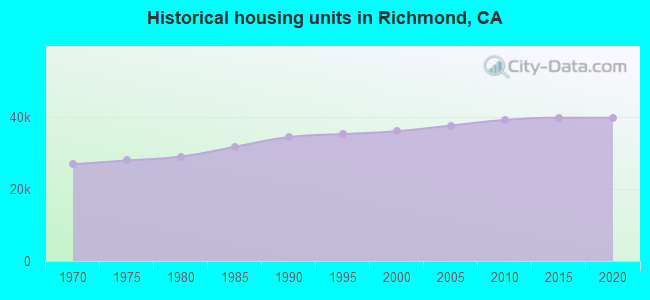
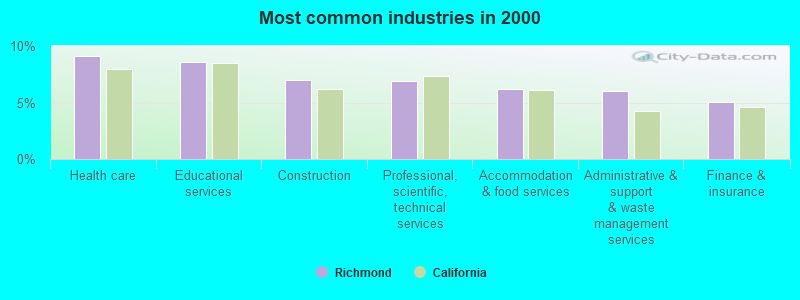
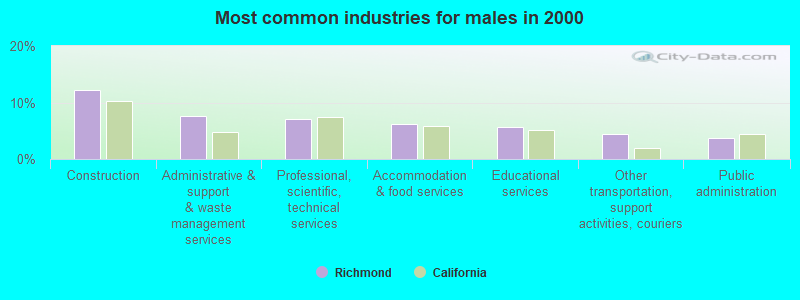
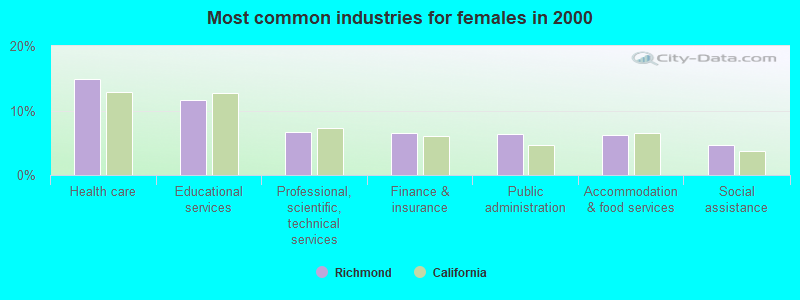
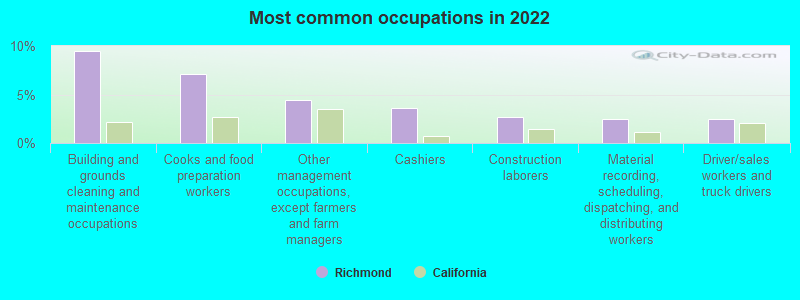
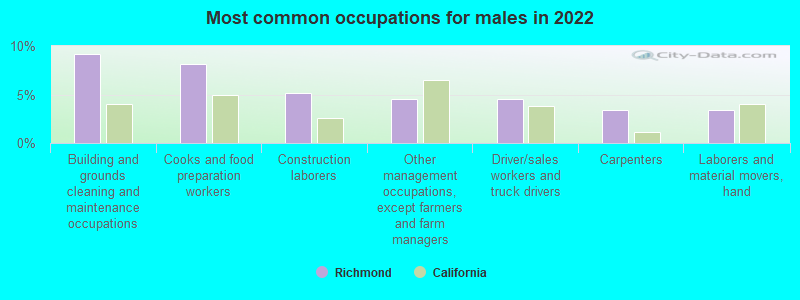
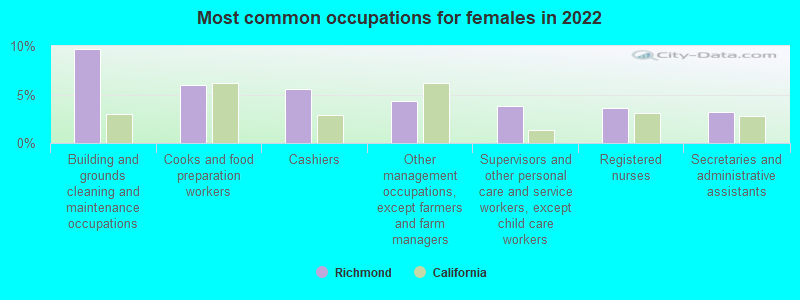


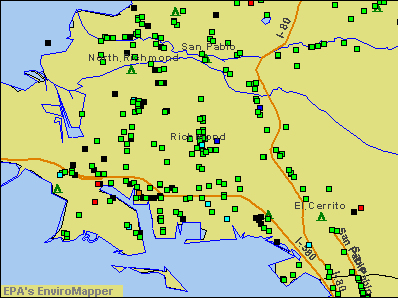

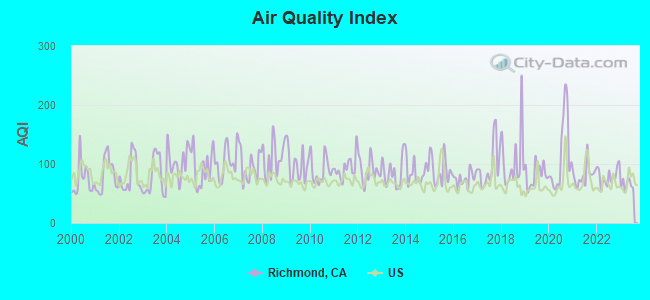
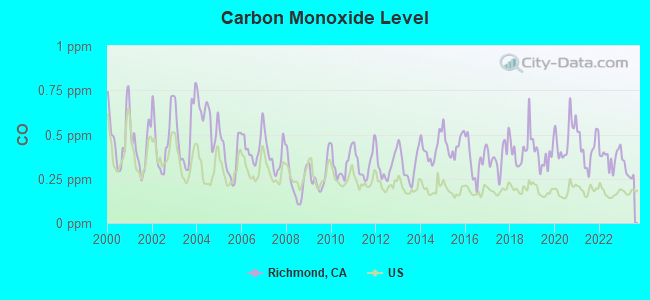
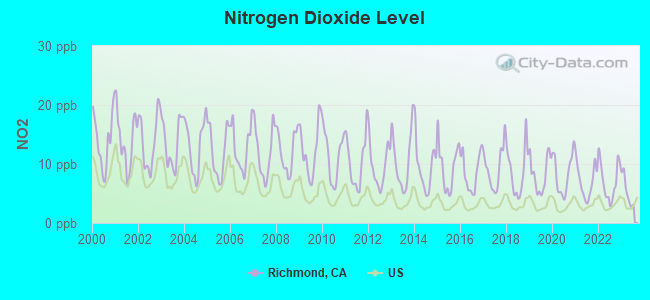
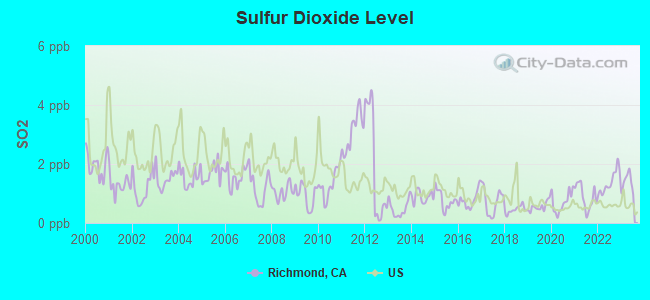
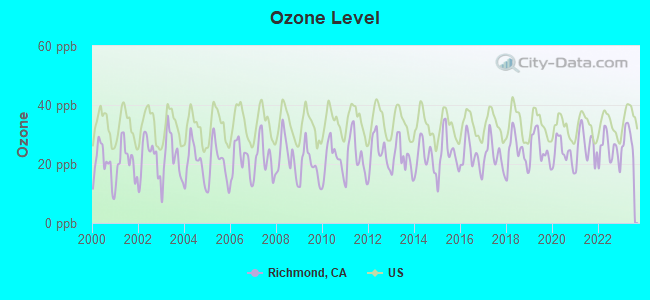
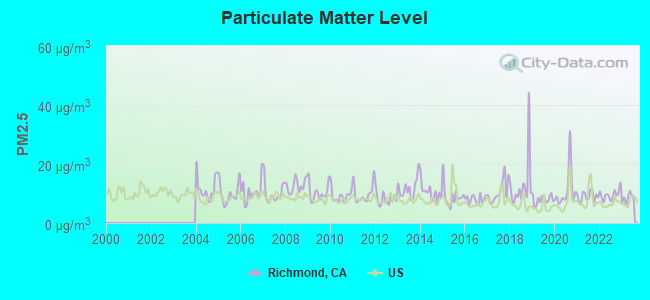
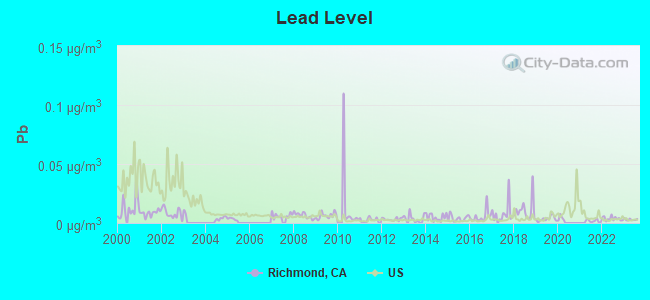
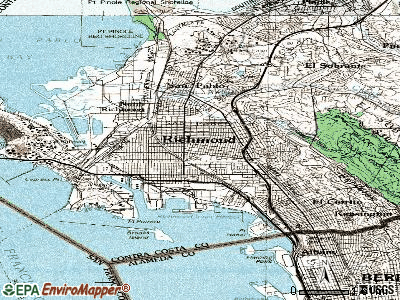
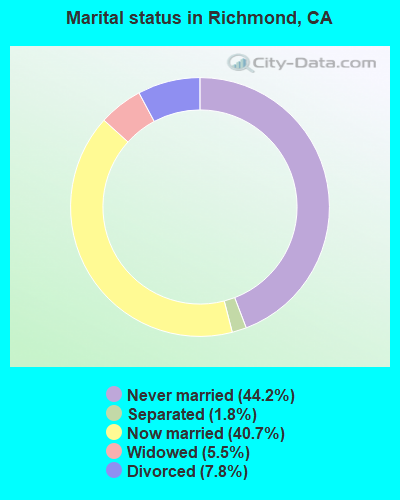
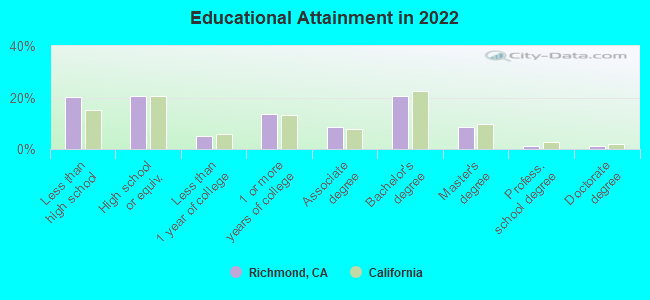
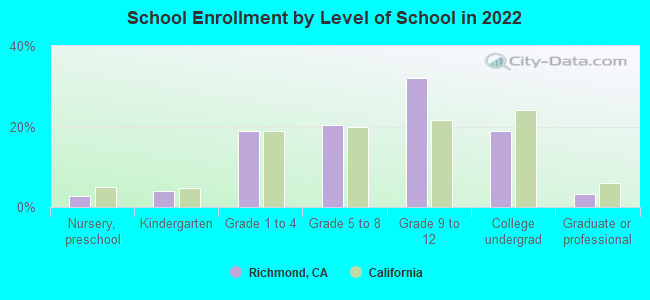
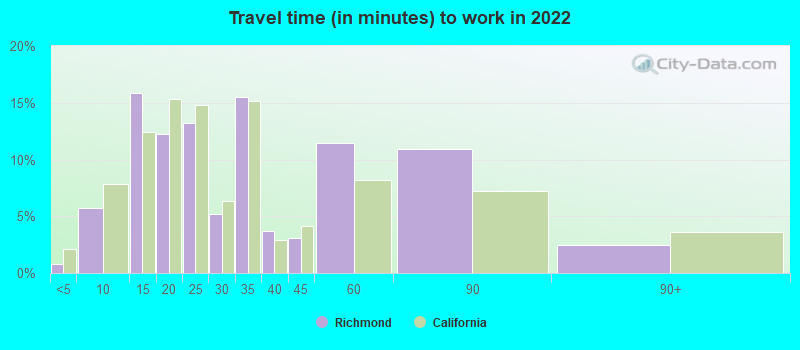
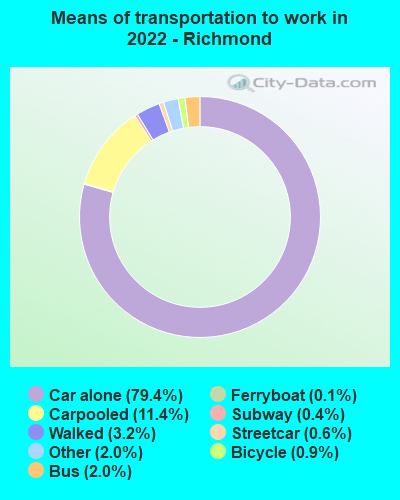


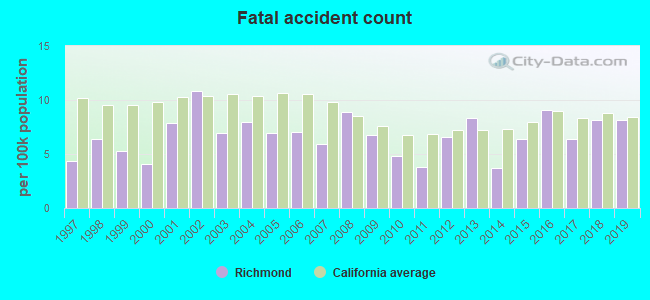
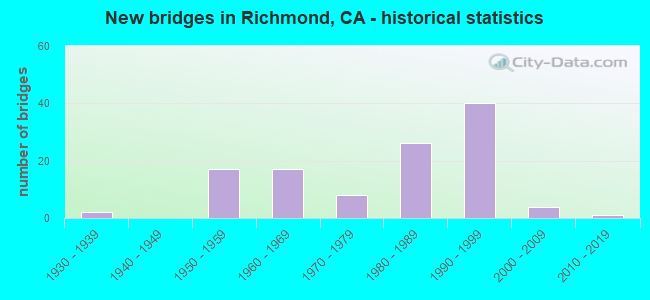
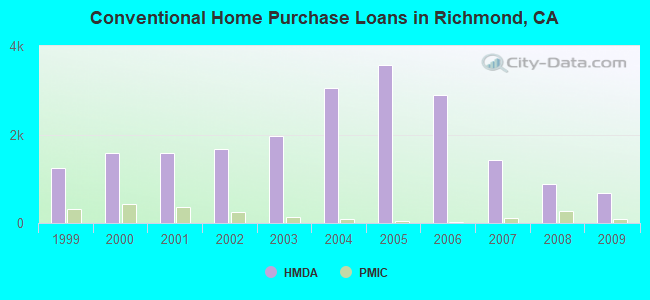
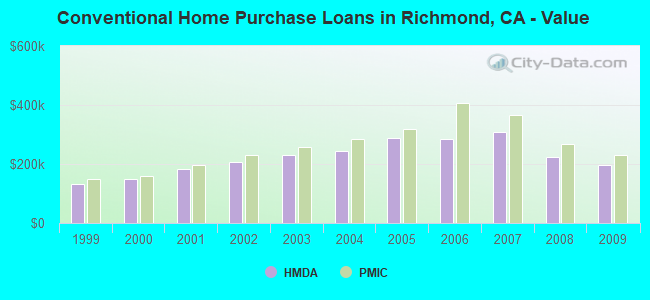
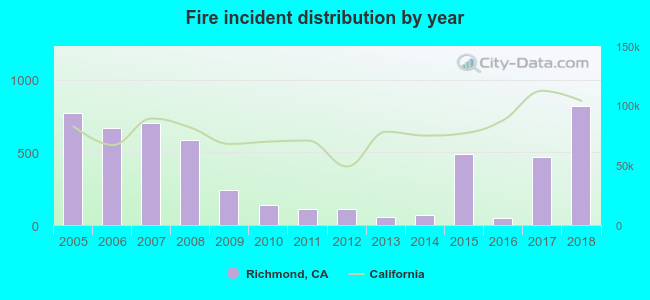 Based on the data from the years 2005 - 2018 the average number of fires per year is 376. The highest number of fire incidents - 821 took place in 2018, and the least - 49 in 2016. The data has an increasing trend.
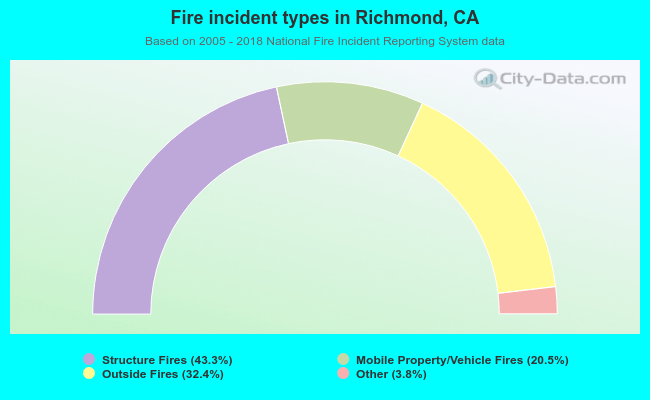 When looking into fire subcategories, the most incidents belonged to: Structure Fires (43.3%), and Outside Fires (32.4%).