El Sobrante, California Submit your own pictures of this place and show them to the world
OSM Map
General Map
Google Map
MSN Map
OSM Map
General Map
Google Map
MSN Map
OSM Map
General Map
Google Map
MSN Map
OSM Map
General Map
Google Map
MSN Map
Please wait while loading the map...
Population in 2010: 12,669. Population change since 2000: +3.3%Males: 6,174 Females: 6,495
March 2022 cost of living index in El Sobrante: 120.0 (more than average, U.S. average is 100) Percentage of residents living in poverty in 2022: 9.6%for White Non-Hispanic residents , 8.7% for Black residents , 9.9% for Hispanic or Latino residents , 8.6% for Native Hawaiian and other Pacific Islander residents , 18.0% for other race residents , 5.2% for two or more races residents )
Profiles of local businesses
Business Search - 14 Million verified businesses
Data:
Median household income ($)
Median household income (% change since 2000)
Household income diversity
Ratio of average income to average house value (%)
Ratio of average income to average rent
Median household income ($) - White
Median household income ($) - Black or African American
Median household income ($) - Asian
Median household income ($) - Hispanic or Latino
Median household income ($) - American Indian and Alaska Native
Median household income ($) - Multirace
Median household income ($) - Other Race
Median household income for houses/condos with a mortgage ($)
Median household income for apartments without a mortgage ($)
Races - White alone (%)
Races - White alone (% change since 2000)
Races - Black alone (%)
Races - Black alone (% change since 2000)
Races - American Indian alone (%)
Races - American Indian alone (% change since 2000)
Races - Asian alone (%)
Races - Asian alone (% change since 2000)
Races - Hispanic (%)
Races - Hispanic (% change since 2000)
Races - Native Hawaiian and Other Pacific Islander alone (%)
Races - Native Hawaiian and Other Pacific Islander alone (% change since 2000)
Races - Two or more races (%)
Races - Two or more races (% change since 2000)
Races - Other race alone (%)
Races - Other race alone (% change since 2000)
Racial diversity
Unemployment (%)
Unemployment (% change since 2000)
Unemployment (%) - White
Unemployment (%) - Black or African American
Unemployment (%) - Asian
Unemployment (%) - Hispanic or Latino
Unemployment (%) - American Indian and Alaska Native
Unemployment (%) - Multirace
Unemployment (%) - Other Race
Population density (people per square mile)
Population - Males (%)
Population - Females (%)
Population - Males (%) - White
Population - Males (%) - Black or African American
Population - Males (%) - Asian
Population - Males (%) - Hispanic or Latino
Population - Males (%) - American Indian and Alaska Native
Population - Males (%) - Multirace
Population - Males (%) - Other Race
Population - Females (%) - White
Population - Females (%) - Black or African American
Population - Females (%) - Asian
Population - Females (%) - Hispanic or Latino
Population - Females (%) - American Indian and Alaska Native
Population - Females (%) - Multirace
Population - Females (%) - Other Race
Coronavirus confirmed cases (Apr 28, 2024)
Deaths caused by coronavirus (Apr 28, 2024)
Coronavirus confirmed cases (per 100k population) (Apr 28, 2024)
Deaths caused by coronavirus (per 100k population) (Apr 28, 2024)
Daily increase in number of cases (Apr 28, 2024)
Weekly increase in number of cases (Apr 28, 2024)
Cases doubled (in days) (Apr 28, 2024)
Hospitalized patients (Apr 18, 2022)
Negative test results (Apr 18, 2022)
Total test results (Apr 18, 2022)
COVID Vaccine doses distributed (per 100k population) (Sep 19, 2023)
COVID Vaccine doses administered (per 100k population) (Sep 19, 2023)
COVID Vaccine doses distributed (Sep 19, 2023)
COVID Vaccine doses administered (Sep 19, 2023)
Likely homosexual households (%)
Likely homosexual households (% change since 2000)
Likely homosexual households - Lesbian couples (%)
Likely homosexual households - Lesbian couples (% change since 2000)
Likely homosexual households - Gay men (%)
Likely homosexual households - Gay men (% change since 2000)
Cost of living index
Median gross rent ($)
Median contract rent ($)
Median monthly housing costs ($)
Median house or condo value ($)
Median house or condo value ($ change since 2000)
Mean house or condo value by units in structure - 1, detached ($)
Mean house or condo value by units in structure - 1, attached ($)
Mean house or condo value by units in structure - 2 ($)
Mean house or condo value by units in structure by units in structure - 3 or 4 ($)
Mean house or condo value by units in structure - 5 or more ($)
Mean house or condo value by units in structure - Boat, RV, van, etc. ($)
Mean house or condo value by units in structure - Mobile home ($)
Median house or condo value ($) - White
Median house or condo value ($) - Black or African American
Median house or condo value ($) - Asian
Median house or condo value ($) - Hispanic or Latino
Median house or condo value ($) - American Indian and Alaska Native
Median house or condo value ($) - Multirace
Median house or condo value ($) - Other Race
Median resident age
Resident age diversity
Median resident age - Males
Median resident age - Females
Median resident age - White
Median resident age - Black or African American
Median resident age - Asian
Median resident age - Hispanic or Latino
Median resident age - American Indian and Alaska Native
Median resident age - Multirace
Median resident age - Other Race
Median resident age - Males - White
Median resident age - Males - Black or African American
Median resident age - Males - Asian
Median resident age - Males - Hispanic or Latino
Median resident age - Males - American Indian and Alaska Native
Median resident age - Males - Multirace
Median resident age - Males - Other Race
Median resident age - Females - White
Median resident age - Females - Black or African American
Median resident age - Females - Asian
Median resident age - Females - Hispanic or Latino
Median resident age - Females - American Indian and Alaska Native
Median resident age - Females - Multirace
Median resident age - Females - Other Race
Commute - mean travel time to work (minutes)
Travel time to work - Less than 5 minutes (%)
Travel time to work - Less than 5 minutes (% change since 2000)
Travel time to work - 5 to 9 minutes (%)
Travel time to work - 5 to 9 minutes (% change since 2000)
Travel time to work - 10 to 19 minutes (%)
Travel time to work - 10 to 19 minutes (% change since 2000)
Travel time to work - 20 to 29 minutes (%)
Travel time to work - 20 to 29 minutes (% change since 2000)
Travel time to work - 30 to 39 minutes (%)
Travel time to work - 30 to 39 minutes (% change since 2000)
Travel time to work - 40 to 59 minutes (%)
Travel time to work - 40 to 59 minutes (% change since 2000)
Travel time to work - 60 to 89 minutes (%)
Travel time to work - 60 to 89 minutes (% change since 2000)
Travel time to work - 90 or more minutes (%)
Travel time to work - 90 or more minutes (% change since 2000)
Marital status - Never married (%)
Marital status - Now married (%)
Marital status - Separated (%)
Marital status - Widowed (%)
Marital status - Divorced (%)
Median family income ($)
Median family income (% change since 2000)
Median non-family income ($)
Median non-family income (% change since 2000)
Median per capita income ($)
Median per capita income (% change since 2000)
Median family income ($) - White
Median family income ($) - Black or African American
Median family income ($) - Asian
Median family income ($) - Hispanic or Latino
Median family income ($) - American Indian and Alaska Native
Median family income ($) - Multirace
Median family income ($) - Other Race
Median year house/condo built
Median year apartment built
Year house built - Built 2005 or later (%)
Year house built - Built 2000 to 2004 (%)
Year house built - Built 1990 to 1999 (%)
Year house built - Built 1980 to 1989 (%)
Year house built - Built 1970 to 1979 (%)
Year house built - Built 1960 to 1969 (%)
Year house built - Built 1950 to 1959 (%)
Year house built - Built 1940 to 1949 (%)
Year house built - Built 1939 or earlier (%)
Average household size
Household density (households per square mile)
Average household size - White
Average household size - Black or African American
Average household size - Asian
Average household size - Hispanic or Latino
Average household size - American Indian and Alaska Native
Average household size - Multirace
Average household size - Other Race
Occupied housing units (%)
Vacant housing units (%)
Owner occupied housing units (%)
Renter occupied housing units (%)
Vacancy status - For rent (%)
Vacancy status - For sale only (%)
Vacancy status - Rented or sold, not occupied (%)
Vacancy status - For seasonal, recreational, or occasional use (%)
Vacancy status - For migrant workers (%)
Vacancy status - Other vacant (%)
Residents with income below the poverty level (%)
Residents with income below 50% of the poverty level (%)
Children below poverty level (%)
Poor families by family type - Married-couple family (%)
Poor families by family type - Male, no wife present (%)
Poor families by family type - Female, no husband present (%)
Poverty status for native-born residents (%)
Poverty status for foreign-born residents (%)
Poverty among high school graduates not in families (%)
Poverty among people who did not graduate high school not in families (%)
Residents with income below the poverty level (%) - White
Residents with income below the poverty level (%) - Black or African American
Residents with income below the poverty level (%) - Asian
Residents with income below the poverty level (%) - Hispanic or Latino
Residents with income below the poverty level (%) - American Indian and Alaska Native
Residents with income below the poverty level (%) - Multirace
Residents with income below the poverty level (%) - Other Race
Air pollution - Air Quality Index (AQI)
Air pollution - CO
Air pollution - NO2
Air pollution - SO2
Air pollution - Ozone
Air pollution - PM10
Air pollution - PM25
Air pollution - Pb
Crime - Murders per 100,000 population
Crime - Rapes per 100,000 population
Crime - Robberies per 100,000 population
Crime - Assaults per 100,000 population
Crime - Burglaries per 100,000 population
Crime - Thefts per 100,000 population
Crime - Auto thefts per 100,000 population
Crime - Arson per 100,000 population
Crime - City-data.com crime index
Crime - Violent crime index
Crime - Property crime index
Crime - Murders per 100,000 population (5 year average)
Crime - Rapes per 100,000 population (5 year average)
Crime - Robberies per 100,000 population (5 year average)
Crime - Assaults per 100,000 population (5 year average)
Crime - Burglaries per 100,000 population (5 year average)
Crime - Thefts per 100,000 population (5 year average)
Crime - Auto thefts per 100,000 population (5 year average)
Crime - Arson per 100,000 population (5 year average)
Crime - City-data.com crime index (5 year average)
Crime - Violent crime index (5 year average)
Crime - Property crime index (5 year average)
1996 Presidential Elections Results (%) - Democratic Party (Clinton)
1996 Presidential Elections Results (%) - Republican Party (Dole)
1996 Presidential Elections Results (%) - Other
2000 Presidential Elections Results (%) - Democratic Party (Gore)
2000 Presidential Elections Results (%) - Republican Party (Bush)
2000 Presidential Elections Results (%) - Other
2004 Presidential Elections Results (%) - Democratic Party (Kerry)
2004 Presidential Elections Results (%) - Republican Party (Bush)
2004 Presidential Elections Results (%) - Other
2008 Presidential Elections Results (%) - Democratic Party (Obama)
2008 Presidential Elections Results (%) - Republican Party (McCain)
2008 Presidential Elections Results (%) - Other
2012 Presidential Elections Results (%) - Democratic Party (Obama)
2012 Presidential Elections Results (%) - Republican Party (Romney)
2012 Presidential Elections Results (%) - Other
2016 Presidential Elections Results (%) - Democratic Party (Clinton)
2016 Presidential Elections Results (%) - Republican Party (Trump)
2016 Presidential Elections Results (%) - Other
2020 Presidential Elections Results (%) - Democratic Party (Biden)
2020 Presidential Elections Results (%) - Republican Party (Trump)
2020 Presidential Elections Results (%) - Other
Ancestries Reported - Arab (%)
Ancestries Reported - Czech (%)
Ancestries Reported - Danish (%)
Ancestries Reported - Dutch (%)
Ancestries Reported - English (%)
Ancestries Reported - French (%)
Ancestries Reported - French Canadian (%)
Ancestries Reported - German (%)
Ancestries Reported - Greek (%)
Ancestries Reported - Hungarian (%)
Ancestries Reported - Irish (%)
Ancestries Reported - Italian (%)
Ancestries Reported - Lithuanian (%)
Ancestries Reported - Norwegian (%)
Ancestries Reported - Polish (%)
Ancestries Reported - Portuguese (%)
Ancestries Reported - Russian (%)
Ancestries Reported - Scotch-Irish (%)
Ancestries Reported - Scottish (%)
Ancestries Reported - Slovak (%)
Ancestries Reported - Subsaharan African (%)
Ancestries Reported - Swedish (%)
Ancestries Reported - Swiss (%)
Ancestries Reported - Ukrainian (%)
Ancestries Reported - United States (%)
Ancestries Reported - Welsh (%)
Ancestries Reported - West Indian (%)
Ancestries Reported - Other (%)
Educational Attainment - No schooling completed (%)
Educational Attainment - Less than high school (%)
Educational Attainment - High school or equivalent (%)
Educational Attainment - Less than 1 year of college (%)
Educational Attainment - 1 or more years of college (%)
Educational Attainment - Associate degree (%)
Educational Attainment - Bachelor's degree (%)
Educational Attainment - Master's degree (%)
Educational Attainment - Professional school degree (%)
Educational Attainment - Doctorate degree (%)
School Enrollment - Nursery, preschool (%)
School Enrollment - Kindergarten (%)
School Enrollment - Grade 1 to 4 (%)
School Enrollment - Grade 5 to 8 (%)
School Enrollment - Grade 9 to 12 (%)
School Enrollment - College undergrad (%)
School Enrollment - Graduate or professional (%)
School Enrollment - Not enrolled in school (%)
School enrollment - Public schools (%)
School enrollment - Private schools (%)
School enrollment - Not enrolled (%)
Median number of rooms in houses and condos
Median number of rooms in apartments
Housing units lacking complete plumbing facilities (%)
Housing units lacking complete kitchen facilities (%)
Density of houses
Urban houses (%)
Rural houses (%)
Households with people 60 years and over (%)
Households with people 65 years and over (%)
Households with people 75 years and over (%)
Households with one or more nonrelatives (%)
Households with no nonrelatives (%)
Population in households (%)
Family households (%)
Nonfamily households (%)
Population in families (%)
Family households with own children (%)
Median number of bedrooms in owner occupied houses
Mean number of bedrooms in owner occupied houses
Median number of bedrooms in renter occupied houses
Mean number of bedrooms in renter occupied houses
Median number of vehichles in owner occupied houses
Mean number of vehichles in owner occupied houses
Median number of vehichles in renter occupied houses
Mean number of vehichles in renter occupied houses
Mortgage status - with mortgage (%)
Mortgage status - with second mortgage (%)
Mortgage status - with home equity loan (%)
Mortgage status - with both second mortgage and home equity loan (%)
Mortgage status - without a mortgage (%)
Average family size
Average family size - White
Average family size - Black or African American
Average family size - Asian
Average family size - Hispanic or Latino
Average family size - American Indian and Alaska Native
Average family size - Multirace
Average family size - Other Race
Geographical mobility - Same house 1 year ago (%)
Geographical mobility - Moved within same county (%)
Geographical mobility - Moved from different county within same state (%)
Geographical mobility - Moved from different state (%)
Geographical mobility - Moved from abroad (%)
Place of birth - Born in state of residence (%)
Place of birth - Born in other state (%)
Place of birth - Native, outside of US (%)
Place of birth - Foreign born (%)
Housing units in structures - 1, detached (%)
Housing units in structures - 1, attached (%)
Housing units in structures - 2 (%)
Housing units in structures - 3 or 4 (%)
Housing units in structures - 5 to 9 (%)
Housing units in structures - 10 to 19 (%)
Housing units in structures - 20 to 49 (%)
Housing units in structures - 50 or more (%)
Housing units in structures - Mobile home (%)
Housing units in structures - Boat, RV, van, etc. (%)
House/condo owner moved in on average (years ago)
Renter moved in on average (years ago)
Year householder moved into unit - Moved in 1999 to March 2000 (%)
Year householder moved into unit - Moved in 1995 to 1998 (%)
Year householder moved into unit - Moved in 1990 to 1994 (%)
Year householder moved into unit - Moved in 1980 to 1989 (%)
Year householder moved into unit - Moved in 1970 to 1979 (%)
Year householder moved into unit - Moved in 1969 or earlier (%)
Means of transportation to work - Drove car alone (%)
Means of transportation to work - Carpooled (%)
Means of transportation to work - Public transportation (%)
Means of transportation to work - Bus or trolley bus (%)
Means of transportation to work - Streetcar or trolley car (%)
Means of transportation to work - Subway or elevated (%)
Means of transportation to work - Railroad (%)
Means of transportation to work - Ferryboat (%)
Means of transportation to work - Taxicab (%)
Means of transportation to work - Motorcycle (%)
Means of transportation to work - Bicycle (%)
Means of transportation to work - Walked (%)
Means of transportation to work - Other means (%)
Working at home (%)
Industry diversity
Most Common Industries - Agriculture, forestry, fishing and hunting, and mining (%)
Most Common Industries - Agriculture, forestry, fishing and hunting (%)
Most Common Industries - Mining, quarrying, and oil and gas extraction (%)
Most Common Industries - Construction (%)
Most Common Industries - Manufacturing (%)
Most Common Industries - Wholesale trade (%)
Most Common Industries - Retail trade (%)
Most Common Industries - Transportation and warehousing, and utilities (%)
Most Common Industries - Transportation and warehousing (%)
Most Common Industries - Utilities (%)
Most Common Industries - Information (%)
Most Common Industries - Finance and insurance, and real estate and rental and leasing (%)
Most Common Industries - Finance and insurance (%)
Most Common Industries - Real estate and rental and leasing (%)
Most Common Industries - Professional, scientific, and management, and administrative and waste management services (%)
Most Common Industries - Professional, scientific, and technical services (%)
Most Common Industries - Management of companies and enterprises (%)
Most Common Industries - Administrative and support and waste management services (%)
Most Common Industries - Educational services, and health care and social assistance (%)
Most Common Industries - Educational services (%)
Most Common Industries - Health care and social assistance (%)
Most Common Industries - Arts, entertainment, and recreation, and accommodation and food services (%)
Most Common Industries - Arts, entertainment, and recreation (%)
Most Common Industries - Accommodation and food services (%)
Most Common Industries - Other services, except public administration (%)
Most Common Industries - Public administration (%)
Occupation diversity
Most Common Occupations - Management, business, science, and arts occupations (%)
Most Common Occupations - Management, business, and financial occupations (%)
Most Common Occupations - Management occupations (%)
Most Common Occupations - Business and financial operations occupations (%)
Most Common Occupations - Computer, engineering, and science occupations (%)
Most Common Occupations - Computer and mathematical occupations (%)
Most Common Occupations - Architecture and engineering occupations (%)
Most Common Occupations - Life, physical, and social science occupations (%)
Most Common Occupations - Education, legal, community service, arts, and media occupations (%)
Most Common Occupations - Community and social service occupations (%)
Most Common Occupations - Legal occupations (%)
Most Common Occupations - Education, training, and library occupations (%)
Most Common Occupations - Arts, design, entertainment, sports, and media occupations (%)
Most Common Occupations - Healthcare practitioners and technical occupations (%)
Most Common Occupations - Health diagnosing and treating practitioners and other technical occupations (%)
Most Common Occupations - Health technologists and technicians (%)
Most Common Occupations - Service occupations (%)
Most Common Occupations - Healthcare support occupations (%)
Most Common Occupations - Protective service occupations (%)
Most Common Occupations - Fire fighting and prevention, and other protective service workers including supervisors (%)
Most Common Occupations - Law enforcement workers including supervisors (%)
Most Common Occupations - Food preparation and serving related occupations (%)
Most Common Occupations - Building and grounds cleaning and maintenance occupations (%)
Most Common Occupations - Personal care and service occupations (%)
Most Common Occupations - Sales and office occupations (%)
Most Common Occupations - Sales and related occupations (%)
Most Common Occupations - Office and administrative support occupations (%)
Most Common Occupations - Natural resources, construction, and maintenance occupations (%)
Most Common Occupations - Farming, fishing, and forestry occupations (%)
Most Common Occupations - Construction and extraction occupations (%)
Most Common Occupations - Installation, maintenance, and repair occupations (%)
Most Common Occupations - Production, transportation, and material moving occupations (%)
Most Common Occupations - Production occupations (%)
Most Common Occupations - Transportation occupations (%)
Most Common Occupations - Material moving occupations (%)
People in Group quarters - Institutionalized population (%)
People in Group quarters - Correctional institutions (%)
People in Group quarters - Federal prisons and detention centers (%)
People in Group quarters - Halfway houses (%)
People in Group quarters - Local jails and other confinement facilities (including police lockups) (%)
People in Group quarters - Military disciplinary barracks (%)
People in Group quarters - State prisons (%)
People in Group quarters - Other types of correctional institutions (%)
People in Group quarters - Nursing homes (%)
People in Group quarters - Hospitals/wards, hospices, and schools for the handicapped (%)
People in Group quarters - Hospitals/wards and hospices for chronically ill (%)
People in Group quarters - Hospices or homes for chronically ill (%)
People in Group quarters - Military hospitals or wards for chronically ill (%)
People in Group quarters - Other hospitals or wards for chronically ill (%)
People in Group quarters - Hospitals or wards for drug/alcohol abuse (%)
People in Group quarters - Mental (Psychiatric) hospitals or wards (%)
People in Group quarters - Schools, hospitals, or wards for the mentally retarded (%)
People in Group quarters - Schools, hospitals, or wards for the physically handicapped (%)
People in Group quarters - Institutions for the deaf (%)
People in Group quarters - Institutions for the blind (%)
People in Group quarters - Orthopedic wards and institutions for the physically handicapped (%)
People in Group quarters - Wards in general hospitals for patients who have no usual home elsewhere (%)
People in Group quarters - Wards in military hospitals for patients who have no usual home elsewhere (%)
People in Group quarters - Juvenile institutions (%)
People in Group quarters - Long-term care (%)
People in Group quarters - Homes for abused, dependent, and neglected children (%)
People in Group quarters - Residential treatment centers for emotionally disturbed children (%)
People in Group quarters - Training schools for juvenile delinquents (%)
People in Group quarters - Short-term care, detention or diagnostic centers for delinquent children (%)
People in Group quarters - Type of juvenile institution unknown (%)
People in Group quarters - Noninstitutionalized population (%)
People in Group quarters - College dormitories (includes college quarters off campus) (%)
People in Group quarters - Military quarters (%)
People in Group quarters - On base (%)
People in Group quarters - Barracks, unaccompanied personnel housing (UPH), (Enlisted/Officer), ;and similar group living quarters for military personnel (%)
People in Group quarters - Transient quarters for temporary residents (%)
People in Group quarters - Military ships (%)
People in Group quarters - Group homes (%)
People in Group quarters - Homes or halfway houses for drug/alcohol abuse (%)
People in Group quarters - Homes for the mentally ill (%)
People in Group quarters - Homes for the mentally retarded (%)
People in Group quarters - Homes for the physically handicapped (%)
People in Group quarters - Other group homes (%)
People in Group quarters - Religious group quarters (%)
People in Group quarters - Dormitories (%)
People in Group quarters - Agriculture workers' dormitories on farms (%)
People in Group quarters - Job Corps and vocational training facilities (%)
People in Group quarters - Other workers' dormitories (%)
People in Group quarters - Crews of maritime vessels (%)
People in Group quarters - Other nonhousehold living situations (%)
People in Group quarters - Other noninstitutional group quarters (%)
Residents speaking English at home (%)
Residents speaking English at home - Born in the United States (%)
Residents speaking English at home - Native, born elsewhere (%)
Residents speaking English at home - Foreign born (%)
Residents speaking Spanish at home (%)
Residents speaking Spanish at home - Born in the United States (%)
Residents speaking Spanish at home - Native, born elsewhere (%)
Residents speaking Spanish at home - Foreign born (%)
Residents speaking other language at home (%)
Residents speaking other language at home - Born in the United States (%)
Residents speaking other language at home - Native, born elsewhere (%)
Residents speaking other language at home - Foreign born (%)
Class of Workers - Employee of private company (%)
Class of Workers - Self-employed in own incorporated business (%)
Class of Workers - Private not-for-profit wage and salary workers (%)
Class of Workers - Local government workers (%)
Class of Workers - State government workers (%)
Class of Workers - Federal government workers (%)
Class of Workers - Self-employed workers in own not incorporated business and Unpaid family workers (%)
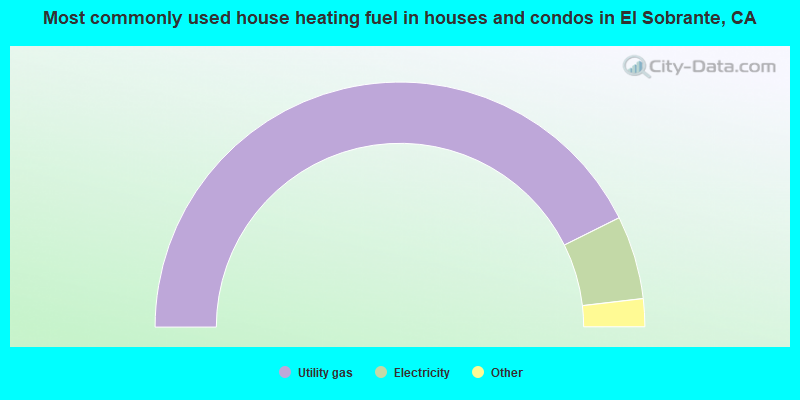
House heating fuel used in houses and condos - Utility gas (%)
House heating fuel used in houses and condos - Bottled, tank, or LP gas (%)
House heating fuel used in houses and condos - Electricity (%)
House heating fuel used in houses and condos - Fuel oil, kerosene, etc. (%)
House heating fuel used in houses and condos - Coal or coke (%)
House heating fuel used in houses and condos - Wood (%)
House heating fuel used in houses and condos - Solar energy (%)
House heating fuel used in houses and condos - Other fuel (%)
House heating fuel used in houses and condos - No fuel used (%)
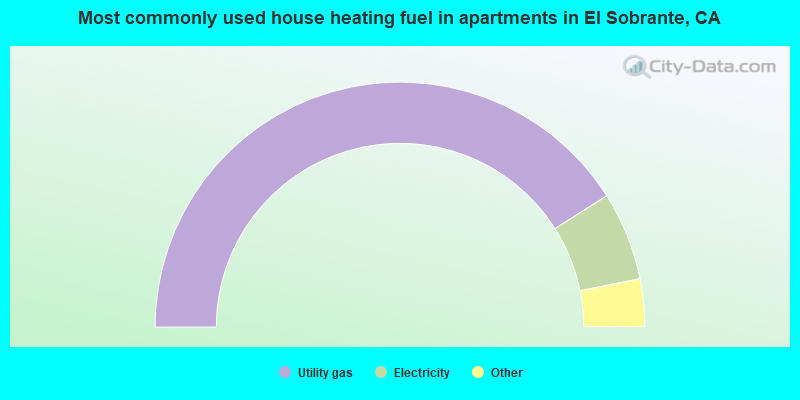
House heating fuel used in apartments - Utility gas (%)
House heating fuel used in apartments - Bottled, tank, or LP gas (%)
House heating fuel used in apartments - Electricity (%)
House heating fuel used in apartments - Fuel oil, kerosene, etc. (%)
House heating fuel used in apartments - Coal or coke (%)
House heating fuel used in apartments - Wood (%)
House heating fuel used in apartments - Solar energy (%)
House heating fuel used in apartments - Other fuel (%)
House heating fuel used in apartments - No fuel used (%)
Armed forces status - In Armed Forces (%)
Armed forces status - Civilian (%)
Armed forces status - Civilian - Veteran (%)
Armed forces status - Civilian - Nonveteran (%)
Fatal accidents locations in years 2005-2021
Fatal accidents locations in 2005
Fatal accidents locations in 2006
Fatal accidents locations in 2007
Fatal accidents locations in 2008
Fatal accidents locations in 2009
Fatal accidents locations in 2010
Fatal accidents locations in 2011
Fatal accidents locations in 2012
Fatal accidents locations in 2013
Fatal accidents locations in 2014
Fatal accidents locations in 2015
Fatal accidents locations in 2016
Fatal accidents locations in 2017
Fatal accidents locations in 2018
Fatal accidents locations in 2019
Fatal accidents locations in 2020
Fatal accidents locations in 2021
Alcohol use - People drinking some alcohol every month (%)
Alcohol use - People not drinking at all (%)
Alcohol use - Average days/month drinking alcohol
Alcohol use - Average drinks/week
Alcohol use - Average days/year people drink much
Audiometry - Average condition of hearing (%)
Audiometry - People that can hear a whisper from across a quiet room (%)
Audiometry - People that can hear normal voice from across a quiet room (%)
Audiometry - Ears ringing, roaring, buzzing (%)
Audiometry - Had a job exposure to loud noise (%)
Audiometry - Had off-work exposure to loud noise (%)
Blood Pressure & Cholesterol - Has high blood pressure (%)
Blood Pressure & Cholesterol - Checking blood pressure at home (%)
Blood Pressure & Cholesterol - Frequently checking blood cholesterol (%)
Blood Pressure & Cholesterol - Has high cholesterol level (%)
Consumer Behavior - Money monthly spent on food at supermarket/grocery store
Consumer Behavior - Money monthly spent on food at other stores
Consumer Behavior - Money monthly spent on eating out
Consumer Behavior - Money monthly spent on carryout/delivered foods
Consumer Behavior - Income spent on food at supermarket/grocery store (%)
Consumer Behavior - Income spent on food at other stores (%)
Consumer Behavior - Income spent on eating out (%)
Consumer Behavior - Income spent on carryout/delivered foods (%)
Current Health Status - General health condition (%)
Current Health Status - Blood donors (%)
Current Health Status - Has blood ever tested for HIV virus (%)
Current Health Status - Left-handed people (%)
Dermatology - People using sunscreen (%)
Diabetes - Diabetics (%)
Diabetes - Had a blood test for high blood sugar (%)
Diabetes - People taking insulin (%)
Diet Behavior & Nutrition - Diet health (%)
Diet Behavior & Nutrition - Milk product consumption (# of products/month)
Diet Behavior & Nutrition - Meals not home prepared (#/week)
Diet Behavior & Nutrition - Meals from fast food or pizza place (#/week)
Diet Behavior & Nutrition - Ready-to-eat foods (#/month)
Diet Behavior & Nutrition - Frozen meals/pizza (#/month)
Drug Use - People that ever used marijuana or hashish (%)
Drug Use - Ever used hard drugs (%)
Drug Use - Ever used any form of cocaine (%)
Drug Use - Ever used heroin (%)
Drug Use - Ever used methamphetamine (%)
Health Insurance - People covered by health insurance (%)
Kidney Conditions-Urology - Avg. # of times urinating at night
Medical Conditions - People with asthma (%)
Medical Conditions - People with anemia (%)
Medical Conditions - People with psoriasis (%)
Medical Conditions - People with overweight (%)
Medical Conditions - Elderly people having difficulties in thinking or remembering (%)
Medical Conditions - People who ever received blood transfusion (%)
Medical Conditions - People having trouble seeing even with glass/contacts (%)
Medical Conditions - People with arthritis (%)
Medical Conditions - People with gout (%)
Medical Conditions - People with congestive heart failure (%)
Medical Conditions - People with coronary heart disease (%)
Medical Conditions - People with angina pectoris (%)
Medical Conditions - People who ever had heart attack (%)
Medical Conditions - People who ever had stroke (%)
Medical Conditions - People with emphysema (%)
Medical Conditions - People with thyroid problem (%)
Medical Conditions - People with chronic bronchitis (%)
Medical Conditions - People with any liver condition (%)
Medical Conditions - People who ever had cancer or malignancy (%)
Mental Health - People who have little interest in doing things (%)
Mental Health - People feeling down, depressed, or hopeless (%)
Mental Health - People who have trouble sleeping or sleeping too much (%)
Mental Health - People feeling tired or having little energy (%)
Mental Health - People with poor appetite or overeating (%)
Mental Health - People feeling bad about themself (%)
Mental Health - People who have trouble concentrating on things (%)
Mental Health - People moving or speaking slowly or too fast (%)
Mental Health - People having thoughts they would be better off dead (%)
Oral Health - Average years since last visit a dentist
Oral Health - People embarrassed because of mouth (%)
Oral Health - People with gum disease (%)
Oral Health - General health of teeth and gums (%)
Oral Health - Average days a week using dental floss/device
Oral Health - Average days a week using mouthwash for dental problem
Oral Health - Average number of teeth
Pesticide Use - Households using pesticides to control insects (%)
Pesticide Use - Households using pesticides to kill weeds (%)
Physical Activity - People doing vigorous-intensity work activities (%)
Physical Activity - People doing moderate-intensity work activities (%)
Physical Activity - People walking or bicycling (%)
Physical Activity - People doing vigorous-intensity recreational activities (%)
Physical Activity - People doing moderate-intensity recreational activities (%)
Physical Activity - Average hours a day doing sedentary activities
Physical Activity - Average hours a day watching TV or videos
Physical Activity - Average hours a day using computer
Physical Functioning - People having limitations keeping them from working (%)
Physical Functioning - People limited in amount of work they can do (%)
Physical Functioning - People that need special equipment to walk (%)
Physical Functioning - People experiencing confusion/memory problems (%)
Physical Functioning - People requiring special healthcare equipment (%)
Prescription Medications - Average number of prescription medicines taking
Preventive Aspirin Use - Adults 40+ taking low-dose aspirin (%)
Reproductive Health - Vaginal deliveries (%)
Reproductive Health - Cesarean deliveries (%)
Reproductive Health - Deliveries resulted in a live birth (%)
Reproductive Health - Pregnancies resulted in a delivery (%)
Reproductive Health - Women breastfeeding newborns (%)
Reproductive Health - Women that had a hysterectomy (%)
Reproductive Health - Women that had both ovaries removed (%)
Reproductive Health - Women that have ever taken birth control pills (%)
Reproductive Health - Women taking birth control pills (%)
Reproductive Health - Women that have ever used Depo-Provera or injectables (%)
Reproductive Health - Women that have ever used female hormones (%)
Sexual Behavior - People 18+ that ever had sex (vaginal, anal, or oral) (%)
Sexual Behavior - Males 18+ that ever had vaginal sex with a woman (%)
Sexual Behavior - Males 18+ that ever performed oral sex on a woman (%)
Sexual Behavior - Males 18+ that ever had anal sex with a woman (%)
Sexual Behavior - Males 18+ that ever had any sex with a man (%)
Sexual Behavior - Females 18+ that ever had vaginal sex with a man (%)
Sexual Behavior - Females 18+ that ever performed oral sex on a man (%)
Sexual Behavior - Females 18+ that ever had anal sex with a man (%)
Sexual Behavior - Females 18+ that ever had any kind of sex with a woman (%)
Sexual Behavior - Average age people first had sex
Sexual Behavior - Average number of female sex partners in lifetime (males 18+)
Sexual Behavior - Average number of female vaginal sex partners in lifetime (males 18+)
Sexual Behavior - Average age people first performed oral sex on a woman (18+)
Sexual Behavior - Average number of woman performed oral sex on in lifetime (18+)
Sexual Behavior - Average number of male sex partners in lifetime (males 18+)
Sexual Behavior - Average number of male anal sex partners in lifetime (males 18+)
Sexual Behavior - Average age people first performed oral sex on a man (18+)
Sexual Behavior - Average number of male oral sex partners in lifetime (18+)
Sexual Behavior - People using protection when performing oral sex (%)
Sexual Behavior - Average number of times people have vaginal or anal sex a year
Sexual Behavior - People having sex without condom (%)
Sexual Behavior - Average number of male sex partners in lifetime (females 18+)
Sexual Behavior - Average number of male vaginal sex partners in lifetime (females 18+)
Sexual Behavior - Average number of female sex partners in lifetime (females 18+)
Sexual Behavior - Circumcised males 18+ (%)
Sleep Disorders - Average hours sleeping at night
Sleep Disorders - People that has trouble sleeping (%)
Smoking-Cigarette Use - People smoking cigarettes (%)
Taste & Smell - People 40+ having problems with smell (%)
Taste & Smell - People 40+ having problems with taste (%)
Taste & Smell - People 40+ that ever had wisdom teeth removed (%)
Taste & Smell - People 40+ that ever had tonsils teeth removed (%)
Taste & Smell - People 40+ that ever had a loss of consciousness because of a head injury (%)
Taste & Smell - People 40+ that ever had a broken nose or other serious injury to face or skull (%)
Taste & Smell - People 40+ that ever had two or more sinus infections (%)
Weight - Average height (inches)
Weight - Average weight (pounds)
Weight - Average BMI
Weight - People that are obese (%)
Weight - People that ever were obese (%)
Weight - People trying to lose weight (%)
5,514 35.8% White alone 4,686 30.4% Hispanic 2,635 17.1% Asian alone 1,300 8.4% Black alone 934 6.1% Two or more races 298 1.9% Native Hawaiian and Other 35 0.2% Other race alone
Latest news from El Sobrante, CA collected exclusively by city-data.com from local newspapers, TV, and radio stations
Ancestries: European (6.7%), English (5.3%), German (1.7%), American (1.7%), Brazilian (1.6%), Irish (1.3%).
Current Local Time:
Land area: 3.10 square miles.
Population density: 4,085 people per square mile (average).
4,305 residents are foreign born (12.8% Latin America , 11.0% Asia ).
This place:
27.9%California:
26.5%
Median real estate property taxes paid for housing units with mortgages in 2022: $5,700 (0.8%)Median real estate property taxes paid for housing units with no mortgage in 2022: $4,416 (0.6%)
Nearest city with pop. 50,000+: West Contra Costa, CA (1.6 miles
Nearest city with pop. 1,000,000+: Los Angeles, CA
Nearest cities:
Latitude: 37.97 N, Longitude: 122.30 W
Daytime population change due to commuting: -4,441 (-28.8%)Workers who live and work in this place: 1,567 (21.1%)
Unemployment in December 2023:
Most common occupations in El Sobrante, CA (%)
Both Males Females
Other sales and related occupations, including supervisors (4.6%)
Other management occupations, except farmers and farm managers (4.1%)
Retail sales workers, except cashiers (3.4%)
Other office and administrative support workers, including supervisors (3.3%)
Other production occupations, including supervisors (3.2%)
Electrical equipment mechanics and other installation, maintenance, and repair workers, including supervisors (3.2%)
Cashiers (3.1%)
Electrical equipment mechanics and other installation, maintenance, and repair workers, including supervisors (5.3%)
Driver/sales workers and truck drivers (5.1%)
Other sales and related occupations, including supervisors (4.8%)
Carpenters (4.4%)
Other management occupations, except farmers and farm managers (3.8%)
Computer specialists (3.7%)
Retail sales workers, except cashiers (3.6%)
Secretaries and administrative assistants (5.7%)
Other office and administrative support workers, including supervisors (4.9%)
Other management occupations, except farmers and farm managers (4.5%)
Other sales and related occupations, including supervisors (4.3%)
Registered nurses (4.2%)
Information and record clerks, except customer service representatives (3.8%)
Bookkeeping, accounting, and auditing clerks (3.7%)
Earthquake activity:
El Sobrante-area historical earthquake activity is significantly above California state average. It is 7538% greater than the overall U.S. average. On 4/18/1906 at 13:12:21, a magnitude 7.9 (7.9 UK, Class: Major, Intensity: VIII - XII) earthquake occurred 38.4 miles away from the city center, causing $524,000,000 total damage On 10/18/1989 at 00:04:15, a magnitude 7.1 (6.5 MB, 7.1 MS, 6.9 MW, 7.0 ML) earthquake occurred 66.0 miles away from El Sobrante center, causing 62 deaths ( 62 shaking deaths) and 3757 injuries, causing $1,305,032,704 total damage On 11/4/1927 at 13:51:53, a magnitude 7.5 (7.5 UK) earthquake occurred 222.6 miles away from the city center On 7/21/1952 at 11:52:14, a magnitude 7.7 (7.7 UK) earthquake occurred 275.2 miles away from El Sobrante center, causing $50,000,000 total damage On 1/31/1922 at 13:17:28, a magnitude 7.6 (7.6 UK) earthquake occurred 257.0 miles away from the city center On 4/25/1992 at 18:06:04, a magnitude 7.2 (6.3 MB, 7.1 MS, 7.2 MW, 7.1 MW, Depth: 9.4 mi) earthquake occurred 190.2 miles away from the city center, causing $75,000,000 total damage Magnitude types: body-wave magnitude (MB), local magnitude (ML), surface-wave magnitude (MS), moment magnitude (MW) Natural disasters: The number of natural disasters in Contra Costa County (18) is near the US average (15).Major Disasters (Presidential) Declared: 11Emergencies Declared: 3Floods: 13, Storms: 7, Winter Storms: 7, Mudslides: 5, Landslides: 4, Drought: 1, Earthquake: 1, Hurricane: 1, Tornado: 1, Wind: 1, Other: 1 (Note: some incidents may be assigned to more than one category). Hospitals and medical centers near El Sobrante: GREENRIDGE SENIOR CARE (Nursing Home, about 1 miles away; RICHMOND, CA)
DOCTORS MEDICAL CENTER PINOLE CAMPUS (Hospital, about 2 miles away; PINOLE, CA)
DOCTORS MED CTR PINOLE CAMPUS DP SNF (Nursing Home, about 2 miles away; PINOLE, CA)
SAN PABLO HEALTHCARE AND WELLNESS CENTER (Nursing Home, about 3 miles away; SAN PABLO, CA)
VALE HEALTH CARE CENTER (Nursing Home, about 3 miles away; SAN PABLO, CA)
BAYCREST NURSING CENTER (Nursing Home, about 3 miles away; SAN PABLO, CA)
PROFESSIONAL HEALTHCARE AT HOME (Home Health Center, about 3 miles away; SAN PABLO, CA)
Amtrak stations near El Sobrante: 4 miles: RICHMOND (16TH ST. & MACDONALD AVE.) Services: fully wheelchair accessible, enclosed waiting area, public restrooms, public payphones, free short-term parking, call for taxi service, public transit connection.
7 miles: BERKELEY (3RD ST. & UNIVERSITY AVE.) Services: partially wheelchair accessible, public payphones, free short-term parking, free long-term parking, call for taxi service, public transit connection.
9 miles: EMERYVILLE (5885 LANDREGAN ST.) Services: ticket office, fully wheelchair accessible, enclosed waiting area, public restrooms, public payphones, snack bar, free short-term parking, free long-term parking, call for taxi service, public transit connection.
Colleges/universities with over 2000 students nearest to El Sobrante:
Contra Costa College (about 3 miles; San Pablo, CA ; Full-time enrollment: 4,249)
Berkeley City College (about 7 miles; Berkeley, CA ; FT enrollment: 3,146)
University of California-Berkeley (about 7 miles; Berkeley, CA ; FT enrollment: 37,127)
Laney College (about 13 miles; Oakland, CA ; FT enrollment: 5,668)
Diablo Valley College (about 13 miles; Pleasant Hill, CA ; FT enrollment: 13,015)
College of Alameda (about 13 miles; Alameda, CA ; FT enrollment: 3,071)
Saint Mary's College of California (about 14 miles; Moraga, CA ; FT enrollment: 4,200)
Private high schools in El Sobrante: EL SOBRANTE CHRISTIAN SCHOOL Students: 290, Location: 5100 ARGYLE RD, Grades: KG-12)
CALVARY CHRISTIAN ACADEMY Students: 52, Location: 4892 SAN PABLO DAM RD, Grades: PK-12)
BETHEL CHRISTIAN ACADEMY Students: 47, Location: 431 RINCON RD, Grades: KG-12)
Public elementary/middle schools in El Sobrante: CRESPI JUNIOR HIGH Students: 512, Location: 1121 ALLVIEW AVE., Grades: 7-8)MURPHY ELEMENTARY Students: 196, Location: 4350 VALLEY VIEW RD., Grades: KG-6)OLINDA ELEMENTARY Location: 5855 OLINDA RD., Grades: KG-6)
Private elementary/middle school in El Sobrante: EAST BAY WALDORF SCHOOL Students: 135, Location: 3800 CLARK RD, Grades: KG-8)
See full list of schools located in El Sobrante Birthplace of: Chijioke Onyenegecha - Player of and football.
Contra Costa County has a predicted average indoor radon screening level between 2 and 4 pCi/L (pico curies per liter) - Moderate Potential Drinking water stations with addresses in El Sobrante and their reported violations in the past:
O.A.R.S., INC #70 (Population served: 100, Groundwater):
Past monitoring violations:
5 routine major monitoring violations
Population served: 84, Groundwater):
Past health violations:
MCL, Monthly (TCR) - Between JUL-2007 and SEP-2007, Contaminant: Coliform. Follow-up actions: St Public Notif issued (AUG-31-2007), St Tech Assistance Visit (AUG-31-2007), St Compliance achieved (AUG-31-2007), St Formal NOV issued (AUG-31-2007)
Past monitoring violations:
5 regular monitoring violations
Average household size: This place:
2.6 peopleCalifornia:
2.9 people
Percentage of family households: This place:
67.5%Whole state:
68.7%
Percentage of households with unmarried partners: This place:
8.0%Whole state:
7.2%
Likely homosexual households (counted as self-reported same-sex unmarried-partner households)
Lesbian couples: 0.8% of all households Gay men: 0.6% of all households
People in group quarters in El Sobrante in 2010:
36 people in group homes intended for adults
11 people in other noninstitutional facilities
2 people in workers' group living quarters and job corps centers
People in group quarters in El Sobrante in 2000:
24 people in other noninstitutional group quarters
6 people in nursing homes
6 people in homes for the mentally ill
Banks with branches in El Sobrante (2011 data):
Bank of America, National Association: El Sobrante Branch at 3939 San Pablo Dam Road, branch established on 1964/04/06. Info updated 2009/11/18: Bank assets: $1,451,969.3 mil, Deposits: $1,077,176.8 mil, headquarters in Charlotte, NC, positive income , 5782 total offices , Holding Company: Bank Of America Corporation
Mechanics Bank: El Sobrante Branch at 3884 San Pablo Dam Road, branch established on 1955/05/02. Info updated 2011/03/24: Bank assets: $2,991.7 mil, Deposits: $2,573.6 mil, headquarters in Richmond, CA, positive income , Commercial Lending Specialization, 31 total offices
For population 15 years and over in El Sobrante:
Never married: 34.9%Now married: 49.6%Separated: 2.0%Widowed: 4.7%Divorced: 8.8% For population 25 years and over in El Sobrante:
High school or higher: 88.9%Bachelor's degree or higher: 34.9%Graduate or professional degree: 12.6%Unemployed: 3.6%Mean travel time to work (commute): 26.6 minutes
Education Gini index (Inequality in education) Here:
13.1California average:
15.5
Religion statistics for El Sobrante, CA (based on Contra Costa County data)
Religion Adherents Congregations Catholic 228,400 34 Evangelical Protestant 81,120 352 Other 48,553 123 Mainline Protestant 32,693 101 Black Protestant 10,395 34 Orthodox 2,435 8 None 645,429 -
Source: Clifford Grammich, Kirk Hadaway, Richard Houseal, Dale E.Jones, Alexei Krindatch, Richie Stanley and Richard H.Taylor. 2012. 2010 U.S.Religion Census: Religious Congregations & Membership Study. Association of Statisticians of American Religious Bodies. Jones, Dale E., et al. 2002. Congregations and Membership in the United States 2000. Nashville, TN: Glenmary Research Center. Graphs represent county-level data
Food Environment Statistics: Number of grocery stores : 181Contra Costa County :
1.78 / 10,000 pop.California :
2.14 / 10,000 pop.
Number of supercenters and club stores : 5This county :
0.05 / 10,000 pop.State :
0.04 / 10,000 pop.
Number of convenience stores (no gas) : 52Contra Costa County :
0.51 / 10,000 pop.State :
0.62 / 10,000 pop.
Number of convenience stores (with gas) : 178Contra Costa County :
1.75 / 10,000 pop.California :
1.49 / 10,000 pop.
Number of full-service restaurants : 683This county :
6.73 / 10,000 pop.State :
7.42 / 10,000 pop.
Adult diabetes rate : This county :
7.1%California :
7.3%
Adult obesity rate : Here :
22.2%California :
21.3%
Low-income preschool obesity rate : Health and Nutrition: Healthy diet rate : El Sobrante:
51.1%California:
49.4%
Average overall health of teeth and gums : El Sobrante:
49.0%California:
48.0%
Average BMI : El Sobrante:
28.3California:
28.1
People feeling badly about themselves : This city:
19.7%California:
20.2%
People not drinking alcohol at all : El Sobrante:
11.9%California:
11.2%
Average hours sleeping at night : Overweight people : El Sobrante:
33.1%California:
31.5%
General health condition : El Sobrante:
57.1%California:
56.4%
Average condition of hearing : El Sobrante:
80.3%California:
80.9%
More about Health and Nutrition of El Sobrante, CA Residents
6.37% of this county's 2021 resident taxpayers lived in other counties in 2020 ($134,084 average adjusted gross income )
Here:
6.37%California average:
5.19%
0.01% of residents moved from foreign countries ($98 average AGI )Contra Costa County:
0.01%California average:
0.03%
Top counties from which taxpayers relocated into this county between 2020 and 2021:
7.09% of this county's 2020 resident taxpayers moved to other counties in 2021 ($123,334 average adjusted gross income )
Here:
7.09%California average:
6.14%
0.01% of residents moved to foreign countries ($92 average AGI )Contra Costa County:
0.01%California average:
0.02%
Top counties to which taxpayers relocated from this county between 2020 and 2021:
Businesses in El Sobrante, CA
Name Count Name Count
Ace Hardware 1 Starbucks 1 Domino's Pizza 1 Subway 1 FedEx 2 U-Haul 1 Goodwill 2 UPS 2 H&R Block 1 Walgreens 1 Little Caesars Pizza 1
Strongest AM radio stations in El Sobrante:
KNEW (910 AM; 20 kW; OAKLAND, CA; Owner: AMFM RADIO LICENSES, L.L.C.)
KTRB (860 AM; 50 kW; MODESTO, CA; Owner: PAPPAS RADIO OF CALIFORNIA, A CALIFORNIA LIMITED PARTNERSHIP)
KIQI (1010 AM; 35 kW; SAN FRANCISCO, CA; Owner: RADIO UNICA OF SAN FRANCISCO LICENSE CORP.)
KCBS (740 AM; 50 kW; SAN FRANCISCO, CA; Owner: INFINITY BROADCASTING OPERATIONS, INC.)
KFRC (610 AM; 5 kW; SAN FRANCISCO, CA; Owner: INFINITY BROADCASTING CORPORATION OF LOS ANGELES)
KTCT (1050 AM; 50 kW; SAN MATEO, CA; Owner: SUSQUEHANNA RADIO CORP.)
KNBR (680 AM; 50 kW; SAN FRANCISCO, CA; Owner: KNBR LICO, INC.)
KFAX (1100 AM; 50 kW; SAN FRANCISCO, CA; Owner: GOLDEN GATE BROADCASTING CO, INC.)
KDYA (1190 AM; 10 kW; VALLEJO, CA; Owner: BAYBRIDGE COMMUNICATIONS, L.L.C.)
KGO (810 AM; 50 kW; SAN FRANCISCO, CA; Owner: KGO-AM RADIO, INC.)
KDIA (1640 AM; 10 kW; VALLEJO, CA; Owner: BAYBRIDGE COMMUNICATIONS, L.L.C.)
KABL (960 AM; 5 kW; OAKLAND, CA; Owner: AMFM RADIO LICENSES, L.L.C.)
KMZT (1510 AM; 8 kW; SAN RAFAEL, CA; Owner: MOUNT WILSON FM BROADCASTERS, INC.)
Strongest FM radio stations in El Sobrante:
K249DJ (97.7 FM; SAN PABLO, CA; Owner: EL CERRITO HIGH SCHOOL)
KSFB-FM (100.7 FM; SAN RAFAEL, CA; Owner: GOLDEN GATE BROADCASTING COMPANY, INC.)
KLLC (97.3 FM; SAN FRANCISCO, CA; Owner: INFINITY BROADCASTING OPERATIONS, INC.)
KALX (90.7 FM; BERKELEY, CA; Owner: UNIVERSITY OF CALIFORNIA)
KKSF-FM1 (103.7 FM; PLEASANTON, ETC., CA; Owner: AMFM RADIO LICENSES, L.L.C.)
KBLX-FM2 (102.9 FM; PLEASANTON, CA; Owner: ICBC BROADCAST HOLDINGS -CA, INC.)
KSOL-FM3 (98.9 FM; PLEASANTON, CA; Owner: TMS LICENSE CALIFORNIA, INC)
KFRC-FM3 (99.7 FM; WALNUT CREEK, CA; Owner: INFINITY KFRC-FM, INC.)
KZBR-FM1 (95.7 FM; WALNUT CREEK, CA; Owner: BONNEVILLE HOLDING COMPANY)
KISQ-FM3 (98.1 FM; CONCORD, CA; Owner: AMFM RADIO LICENSES, L.L.C.)
KDFC-FM1 (102.1 FM; LAFAYETTE, CA; Owner: BONNEVILLE HOLDING COMPANY)
KOIT-FM2 (96.5 FM; MARTINEZ, ETC., CA; Owner: BONNEVILLE HOLDING CO. C/O KOIT(FM))
KIOI-FM1 (101.3 FM; WALNUT CREEK, CA; Owner: AMFM RADIO LICENSES, L.L.C.)
KMEL-FM1 (106.1 FM; CONCORD, CA; Owner: AMFM RADIO LICENSES, L.L.C.)
KDFC-FM (102.1 FM; SAN FRANCISCO, CA; Owner: BONNEVILLE HOLDING COMPANY)
KFJO (92.1 FM; WALNUT CREEK, CA; Owner: CHASE RADIO PROPERTIES, L.L.C.)
KOIT-FM (96.5 FM; SAN FRANCISCO, CA; Owner: BONNEVILLE HOLDING COMPANY)
KKSF (103.7 FM; SAN FRANCISCO, CA; Owner: AMFM RADIO LICENSES, L.L.C.)
KFOG (104.5 FM; SAN FRANCISCO, CA; Owner: KFFG LICO, INC)
KISQ (98.1 FM; SAN FRANCISCO, CA; Owner: AMFM RADIO LICENSES, L.L.C.)
TV broadcast stations around El Sobrante:
KQED (Channel 9; SAN FRANCISCO, CA; Owner: KQED, INC.)
KGO-TV (Channel 7; SAN FRANCISCO, CA; Owner: KGO TELEVISION, INC.)
KPIX-TV (Channel 5; SAN FRANCISCO, CA; Owner: CBS BROADCASTING INC.)
KTVU (Channel 2; OAKLAND, CA; Owner: KTVU PARTNERSHIP)
KRON-TV (Channel 4; SAN FRANCISCO, CA; Owner: YOUNG BROADCASTING OF SAN FRANCISCO, INC.)
KMTP-TV (Channel 32; SAN FRANCISCO, CA; Owner: MINORITY TELEVISION PROJECT)
KBHK-TV (Channel 44; SAN FRANCISCO, CA; Owner: VIACOM TELEVISION STATIONS GROUP OF SAN FRANCISCO INC.)
KBWB (Channel 20; SAN FRANCISCO, CA; Owner: KBWB LICENSE, INC.)
KFSF (Channel 66; VALLEJO, CA; Owner: TELEFUTURA SAN FRANCISCO LLC)
KCNS (Channel 38; SAN FRANCISCO, CA; Owner: WRAY, INC.)
KOVR (Channel 13; STOCKTON, CA; Owner: SCI - SACRAMENTO LICENSEE, LLC)
KXTV (Channel 10; SACRAMENTO, CA; Owner: KXTV, INC.)
KSPX (Channel 29; SACRAMENTO, CA; Owner: PAXSON SACRAMENTO LICENSE, INC.)
KTNC-TV (Channel 42; CONCORD, CA; Owner: KTNC LICENSE, LLC)
KCSM-TV (Channel 60; SAN MATEO, CA; Owner: SAN MATEO COUNTY COMMUNITY COLLEGE DISTRICT)
KCRA-TV (Channel 3; SACRAMENTO, CA; Owner: KCRA HEARST-ARGYLE TELEVISION, INC.)
KTXL (Channel 40; SACRAMENTO, CA; Owner: CHANNEL 40, INC.)
KUVS (Channel 19; MODESTO, CA; Owner: KUVS LICENSE PARTNERSHIP, G.P.)
KQCA (Channel 58; STOCKTON, CA; Owner: KCRA HEARST-ARGYLE TELEVISION, INC.)
KVIE (Channel 6; SACRAMENTO, CA; Owner: KVIE, INC.)
KMAX-TV (Channel 31; SACRAMENTO, CA; Owner: UPN STATIONS GROUP INC.)
KTSF (Channel 26; SAN FRANCISCO, CA; Owner: LINCOLN BROADCASTING COMPANY, A CALIFORNIA LP)
National Bridge Inventory (NBI) Statistics 3 Number of bridges20ft / 6.2m Total length20,804 Total average daily traffic1,017 Total average daily truck traffic49,172 Total future (year 2037) average daily traffic
FCC Registered Broadcast Land Mobile Towers: 6
5150 Amend Rd (Lat: 37.964361 Lon: -122.280250), Type: Building, Structure height: 13 m, Overall height: 18 m, Call Sign: WNMC644, Assigned Frequencies: 809.962 MHz, 810.212 MHz, 810.487 MHz, 854.962 MHz, 855.212 MHz, 855.487 MHz, Grant Date: 05/29/2014, Expiration Date: 08/23/2024, Cancellation Date: 06/26/2023, Certifier: Willie Edwards, Registrant: Eb Mud, 2201 Larkey Lane Instrument Shop -, Walnut Creek, CA 94597, Phone: (510) 772-9093, Email:
4640 Appianway (Lat: 37.972417 Lon: -122.286639), Call Sign: KMB591, Assigned Frequencies: 46.0600 MHz, 46.1000 MHz, 46.3800 MHz, 46.4200 MHz, Grant Date: 02/03/2015, Expiration Date: 05/02/2025, Registrant: Csi Telecommunications, Inc. Consulting Engineers, Six Hamilton Landing, Suite 170, Novato, CA 94949, Phone: (415) 751-8845, Email:
Pinole Center (Lat: 37.991028 Lon: -122.304694), Call Sign: KNEA731, Licensee ID: L00029558, Assigned Frequencies: 173.396 MHz, Grant Date: 11/14/2015, Expiration Date: 11/19/2025, Registrant: West County Wastewater District, 2910 Hilltop Dr, Richmond, CA 94806, Phone: (415) 232-2867, Fax: (510) 222-3277, Email:
San Pablo Reservoir (Lat: 37.934361 Lon: -122.253861), Call Sign: KVA689, Assigned Frequencies: 48.2600 MHz, Grant Date: 10/12/2022, Expiration Date: 01/07/2033, Registrant: East Bay Municipal Utility District (Ebmud), 375 Eleventh Street, Oakland, CA 94607, Phone: (510) 287-0202, Fax: (510) 287-0373, Email:
W Of I80 Appian Way (Lat: 37.991306 Lon: -122.307472), Call Sign: WNIA895, Assigned Frequencies: 173.396 MHz, Grant Date: 01/26/2012, Expiration Date: 02/17/2022, Cancellation Date: 04/23/2022, Registrant: West County Wastewater District, 2910 Hilltop Drive, Richmond, CA 94806, Phone: (510) 222-6700, Fax: (510) 222-3277, Email:
3300 San Pablo Dam Road (Lat: 37.976667 Lon: -122.292500), Call Sign: WPWG496, Assigned Frequencies: 31.2400 MHz, 33.1600 MHz, 33.4000 MHz, 35.0200 MHz, 151.745 MHz, 151.835 MHz, 151.895 MHz, 154.515 MHz, 154.540 MHz, 457.512 MHz... (+12 more), Grant Date: 11/12/2002, Expiration Date: 11/12/2012, Cancellation Date: 01/12/2013, Certifier: Remona Barbour, Registrant: Kfc Of America, Inc., 5200 Commerce Crossings, Louisville, KY 40299, Phone: (502) 874-6961, Fax: (502) 874-6173, Email:
FCC Registered Microwave Towers: 3
STATION, 2 Mi S Of (Lat: 37.957417 Lon: -122.312167), Overall height: 18.3 m, Call Sign: WNTL811, Assigned Frequencies: 6655.00 MHz, 23125.0 MHz, 6645.00 MHz, Grant Date: 12/19/2001, Expiration Date: 01/31/2012, Cancellation Date: 01/13/2012, Registrant: East Bay Municipal Utility District (Ebmud), 375 Eleventh Street, Oakland, CA 94607, Phone: (510) 287-1912, Fax: (510) 287-0373, Email:
STATION, 5150 Amend Rd (Lat: 37.964361 Lon: -122.280222), Structure height: 12.8 m, Overall height: 21.9 m, Call Sign: WNTL812, Assigned Frequencies: 21925.0 MHz, Grant Date: 12/19/2001, Expiration Date: 01/31/2012, Cancellation Date: 01/10/2012, Registrant: East Bay Municipal Utility District (Ebmud), 375 Eleventh Street, Oakland, CA 94607, Phone: (510) 287-1912, Fax: (510) 287-0373, Email:
PEARL RIDGE, Ebmub Site (Lat: 37.958806 Lon: -122.313583), Type: Tower, Structure height: 18.3 m, Overall height: 21.3 m, Call Sign: WPQL421, Assigned Frequencies: 6596.25 MHz, 6606.25 MHz, Grant Date: 05/08/2010, Expiration Date: 05/11/2020, Cancellation Date: 07/11/2020, Certifier: Leveron Bryant, Registrant: City Of Richmond, 1701 Regatta Blvd, Richmond, CA 94804, Phone: (510) 620-6660, Fax: (510) 215-7695, Email:
FCC Registered Amateur Radio Licenses: 109 (
See the full list of FCC Registered Amateur Radio Licenses in El Sobrante )
FAA Registered Aircraft: 2
Aircraft: BELLANCA 7KCAB (Category: Land, Seats: 2, Weight: Up to 12,499 Pounds, Speed: 90 mph), Engine: LYCOMING IO-320 SERIES (150 HP) (Reciprocating)N-Number: 87025, N87025, N-87025, Serial Number: 450-74, Year manufactured: 1974, Airworthiness Date: 05/25/1974, Certificate Issue Date: 06/25/2018Registrant (Co-Owned): Steven J Lundin, 6240 Hillside Dr, El Sobrante, CA 94803, Other Owners: Lucinda B LundinAircraft: TAYLORCRAFT BF (Category: Land, Seats: 2, Weight: Up to 12,499 Pounds, Speed: 78 mph), Engine: CONT MOTOR A&C65 SERIES (65 HP) (Reciprocating)N-Number: 96641, N96641, N-96641, Serial Number: 8941, Year manufactured: 1946Registrant (Individual): Doyle W Roten, 478 Lapaloma Rd, El Sobrante, CA 94803Deregistered: Cancel Date: 12/15/2020
Home Mortgage Disclosure Act Aggregated Statistics For Year 2009(Based on 5 partial tracts) A) FHA, FSA/RHS & VA B) Conventional C) Refinancings D) Home Improvement Loans F) Non-occupant Loans on G) Loans On Manufactured Number Average Value Number Average Value Number Average Value Number Average Value Number Average Value Number Average Value
LOANS ORIGINATED 35 $256,216 59 $214,053 123 $238,943 4 $147,172 14 $180,503 0 $0 APPLICATIONS APPROVED, NOT ACCEPTED 2 $270,390 10 $276,955 18 $241,411 2 $8,425 2 $190,885 0 $0 APPLICATIONS DENIED 7 $229,670 14 $214,472 63 $280,827 3 $85,410 5 $190,356 1 $109,380 APPLICATIONS WITHDRAWN 5 $295,628 8 $216,835 31 $264,017 1 $112,580 2 $184,575 0 $0 FILES CLOSED FOR INCOMPLETENESS 2 $264,920 2 $157,765 15 $255,773 0 $0 1 $146,530 0 $0
Aggregated Statistics For Year 2008(Based on 5 partial tracts) A) FHA, FSA/RHS & VA B) Conventional C) Refinancings D) Home Improvement Loans E) Loans on Dwellings For 5+ Families F) Non-occupant Loans on G) Loans On Manufactured Number Average Value Number Average Value Number Average Value Number Average Value Number Average Value Number Average Value Number Average Value
LOANS ORIGINATED 21 $298,245 58 $246,770 71 $279,980 7 $145,703 1 $1,192,120 12 $259,211 0 $0 APPLICATIONS APPROVED, NOT ACCEPTED 3 $389,330 12 $305,876 23 $324,273 2 $346,815 0 $0 6 $253,587 0 $0 APPLICATIONS DENIED 7 $352,177 27 $272,242 65 $369,117 9 $120,722 0 $0 6 $279,073 1 $45,840 APPLICATIONS WITHDRAWN 1 $251,860 12 $282,585 29 $334,386 2 $108,175 0 $0 3 $298,420 0 $0 FILES CLOSED FOR INCOMPLETENESS 0 $0 3 $175,497 7 $304,779 1 $73,750 0 $0 2 $113,985 0 $0
Aggregated Statistics For Year 2007(Based on 5 partial tracts) A) FHA, FSA/RHS & VA B) Conventional C) Refinancings D) Home Improvement Loans E) Loans on Dwellings For 5+ Families F) Non-occupant Loans on G) Loans On Manufactured Number Average Value Number Average Value Number Average Value Number Average Value Number Average Value Number Average Value Number Average Value
LOANS ORIGINATED 0 $0 84 $321,482 201 $333,651 38 $182,953 3 $2,165,917 23 $331,926 1 $230,350 APPLICATIONS APPROVED, NOT ACCEPTED 1 $230,350 24 $319,481 65 $331,365 6 $216,373 0 $0 4 $262,325 1 $254,100 APPLICATIONS DENIED 0 $0 62 $333,500 170 $379,541 20 $209,495 0 $0 16 $363,263 0 $0 APPLICATIONS WITHDRAWN 0 $0 21 $375,538 73 $363,119 9 $225,851 0 $0 9 $261,106 0 $0 FILES CLOSED FOR INCOMPLETENESS 0 $0 4 $436,242 36 $398,783 4 $230,932 0 $0 3 $317,130 0 $0
Aggregated Statistics For Year 2006(Based on 5 partial tracts) B) Conventional C) Refinancings D) Home Improvement Loans E) Loans on Dwellings For 5+ Families F) Non-occupant Loans on G) Loans On Manufactured Number Average Value Number Average Value Number Average Value Number Average Value Number Average Value Number Average Value
LOANS ORIGINATED 178 $324,036 296 $336,498 54 $231,108 1 $276,200 32 $346,646 0 $0 APPLICATIONS APPROVED, NOT ACCEPTED 48 $331,866 82 $326,058 9 $266,984 0 $0 9 $320,727 1 $52,480 APPLICATIONS DENIED 104 $345,575 169 $382,437 31 $186,762 0 $0 15 $357,138 2 $441,920 APPLICATIONS WITHDRAWN 35 $329,915 116 $358,430 11 $187,884 1 $596,590 6 $333,695 0 $0 FILES CLOSED FOR INCOMPLETENESS 9 $330,878 32 $393,470 2 $303,610 0 $0 2 $402,160 0 $0
Aggregated Statistics For Year 2005(Based on 5 partial tracts) B) Conventional C) Refinancings D) Home Improvement Loans E) Loans on Dwellings For 5+ Families F) Non-occupant Loans on G) Loans On Manufactured Number Average Value Number Average Value Number Average Value Number Average Value Number Average Value Number Average Value
LOANS ORIGINATED 211 $320,244 377 $322,786 47 $233,550 3 $3,106,777 34 $308,685 1 $214,610 APPLICATIONS APPROVED, NOT ACCEPTED 37 $315,872 55 $309,322 6 $165,312 0 $0 7 $356,664 1 $54,170 APPLICATIONS DENIED 63 $320,613 158 $322,655 33 $218,462 0 $0 18 $301,918 0 $0 APPLICATIONS WITHDRAWN 29 $295,904 130 $326,083 14 $187,647 0 $0 11 $306,746 0 $0 FILES CLOSED FOR INCOMPLETENESS 8 $363,278 37 $370,131 2 $250,905 0 $0 2 $122,500 0 $0
Aggregated Statistics For Year 2004(Based on 5 partial tracts) A) FHA, FSA/RHS & VA B) Conventional C) Refinancings D) Home Improvement Loans E) Loans on Dwellings For 5+ Families F) Non-occupant Loans on G) Loans On Manufactured Number Average Value Number Average Value Number Average Value Number Average Value Number Average Value Number Average Value Number Average Value
LOANS ORIGINATED 1 $140,310 233 $272,909 415 $263,692 45 $205,955 3 $1,648,350 36 $232,481 1 $97,220 APPLICATIONS APPROVED, NOT ACCEPTED 0 $0 42 $263,508 64 $279,795 7 $160,251 1 $805,540 8 $274,478 0 $0 APPLICATIONS DENIED 0 $0 67 $247,524 139 $292,675 33 $146,823 0 $0 12 $267,386 1 $219,300 APPLICATIONS WITHDRAWN 0 $0 27 $308,402 129 $266,229 11 $132,077 0 $0 8 $234,544 0 $0 FILES CLOSED FOR INCOMPLETENESS 0 $0 8 $305,149 40 $299,613 3 $195,570 0 $0 2 $252,205 0 $0
Aggregated Statistics For Year 2003(Based on 5 partial tracts) A) FHA, FSA/RHS & VA B) Conventional C) Refinancings D) Home Improvement Loans E) Loans on Dwellings For 5+ Families F) Non-occupant Loans on Number Average Value Number Average Value Number Average Value Number Average Value Number Average Value Number Average Value
LOANS ORIGINATED 1 $21,540 156 $250,892 766 $216,703 15 $60,101 2 $611,320 48 $203,562 APPLICATIONS APPROVED, NOT ACCEPTED 0 $0 20 $242,672 123 $227,169 8 $66,788 0 $0 8 $217,909 APPLICATIONS DENIED 0 $0 34 $212,920 160 $240,296 12 $62,952 0 $0 8 $242,849 APPLICATIONS WITHDRAWN 1 $283,380 16 $238,658 188 $223,583 3 $65,687 0 $0 11 $184,408 FILES CLOSED FOR INCOMPLETENESS 0 $0 5 $235,418 25 $232,722 2 $46,200 0 $0 1 $219,930
Aggregated Statistics For Year 2002(Based on 5 partial tracts) A) FHA, FSA/RHS & VA B) Conventional C) Refinancings D) Home Improvement Loans E) Loans on Dwellings For 5+ Families F) Non-occupant Loans on Number Average Value Number Average Value Number Average Value Number Average Value Number Average Value Number Average Value
LOANS ORIGINATED 3 $212,197 157 $235,079 577 $201,814 13 $87,462 3 $1,130,330 40 $187,438 APPLICATIONS APPROVED, NOT ACCEPTED 1 $78,870 18 $222,186 98 $215,042 7 $33,906 0 $0 5 $203,280 APPLICATIONS DENIED 3 $231,660 33 $224,728 109 $202,391 12 $64,708 1 $568,610 6 $228,810 APPLICATIONS WITHDRAWN 0 $0 17 $219,954 118 $207,497 4 $129,710 0 $0 6 $206,018 FILES CLOSED FOR INCOMPLETENESS 0 $0 8 $154,045 30 $215,316 0 $0 1 $568,880 2 $145,580
Aggregated Statistics For Year 2001(Based on 5 partial tracts) A) FHA, FSA/RHS & VA B) Conventional C) Refinancings D) Home Improvement Loans E) Loans on Dwellings For 5+ Families F) Non-occupant Loans on Number Average Value Number Average Value Number Average Value Number Average Value Number Average Value Number Average Value
LOANS ORIGINATED 5 $182,372 138 $206,086 446 $188,620 23 $51,516 1 $3,114,590 26 $165,778 APPLICATIONS APPROVED, NOT ACCEPTED 1 $93,910 21 $212,234 78 $176,086 5 $42,578 0 $0 4 $182,878 APPLICATIONS DENIED 2 $240,020 40 $194,174 133 $180,524 10 $34,637 0 $0 8 $193,279 APPLICATIONS WITHDRAWN 1 $97,770 21 $224,171 113 $181,280 8 $60,654 1 $2,152,210 6 $213,100 FILES CLOSED FOR INCOMPLETENESS 0 $0 4 $268,228 25 $185,334 2 $46,075 0 $0 1 $252,230
Aggregated Statistics For Year 2000(Based on 5 partial tracts) A) FHA, FSA/RHS & VA B) Conventional C) Refinancings D) Home Improvement Loans E) Loans on Dwellings For 5+ Families F) Non-occupant Loans on Number Average Value Number Average Value Number Average Value Number Average Value Number Average Value Number Average Value
LOANS ORIGINATED 12 $139,208 156 $169,678 137 $147,763 27 $36,320 2 $3,917,275 15 $135,208 APPLICATIONS APPROVED, NOT ACCEPTED 1 $85,620 16 $164,201 30 $151,784 5 $30,544 0 $0 4 $121,980 APPLICATIONS DENIED 3 $165,963 39 $175,242 80 $137,519 19 $28,389 1 $7,147,400 5 $162,222 APPLICATIONS WITHDRAWN 1 $112,390 20 $167,136 53 $139,242 2 $45,535 0 $0 1 $197,580 FILES CLOSED FOR INCOMPLETENESS 0 $0 8 $190,996 24 $173,387 1 $19,300 1 $11,788,220 1 $58,590
Aggregated Statistics For Year 1999(Based on 5 partial tracts) A) FHA, FSA/RHS & VA B) Conventional C) Refinancings D) Home Improvement Loans E) Loans on Dwellings For 5+ Families F) Non-occupant Loans on Number Average Value Number Average Value Number Average Value Number Average Value Number Average Value Number Average Value
LOANS ORIGINATED 24 $141,184 141 $142,814 194 $137,637 22 $28,028 4 $2,191,505 18 $117,894 APPLICATIONS APPROVED, NOT ACCEPTED 3 $105,717 12 $139,368 53 $137,361 7 $31,024 0 $0 4 $124,088 APPLICATIONS DENIED 2 $196,110 30 $157,494 92 $131,783 16 $24,611 2 $365,690 6 $165,150 APPLICATIONS WITHDRAWN 3 $108,653 25 $154,132 71 $134,898 3 $52,927 0 $0 4 $175,178 FILES CLOSED FOR INCOMPLETENESS 2 $83,955 8 $164,890 24 $139,020 0 $0 1 $2,264,730 1 $146,650
Detailed HMDA statistics for the following Tracts:
3601.00
, 3602.00 , 3630.00
Private Mortgage Insurance Companies Aggregated Statistics For Year 2009(Based on 5 partial tracts) A) Conventional B) Refinancings Number Average Value Number Average Value
LOANS ORIGINATED 7 $218,531 3 $284,050 APPLICATIONS APPROVED, NOT ACCEPTED 5 $263,464 1 $352,980 APPLICATIONS DENIED 0 $0 2 $334,440 APPLICATIONS WITHDRAWN 1 $217,920 0 $0 FILES CLOSED FOR INCOMPLETENESS 0 $0 0 $0
Aggregated Statistics For Year 2008(Based on 5 partial tracts) A) Conventional B) Refinancings C) Non-occupant Loans on Number Average Value Number Average Value Number Average Value
LOANS ORIGINATED 16 $315,191 3 $398,477 1 $234,390 APPLICATIONS APPROVED, NOT ACCEPTED 7 $298,329 5 $462,734 0 $0 APPLICATIONS DENIED 1 $287,700 0 $0 0 $0 APPLICATIONS WITHDRAWN 1 $357,110 0 $0 0 $0 FILES CLOSED FOR INCOMPLETENESS 0 $0 0 $0 0 $0
Aggregated Statistics For Year 2007(Based on 5 partial tracts) A) Conventional B) Refinancings Number Average Value Number Average Value
LOANS ORIGINATED 5 $425,336 3 $395,093 APPLICATIONS APPROVED, NOT ACCEPTED 1 $438,610 3 $517,437 APPLICATIONS DENIED 1 $230,390 0 $0 APPLICATIONS WITHDRAWN 1 $141,970 0 $0 FILES CLOSED FOR INCOMPLETENESS 0 $0 0 $0
Aggregated Statistics For Year 2006(Based on 5 partial tracts) A) Conventional B) Refinancings Number Average Value Number Average Value
LOANS ORIGINATED 1 $267,530 2 $402,465 APPLICATIONS APPROVED, NOT ACCEPTED 0 $0 2 $386,955 APPLICATIONS DENIED 0 $0 0 $0 APPLICATIONS WITHDRAWN 0 $0 1 $334,200 FILES CLOSED FOR INCOMPLETENESS 0 $0 0 $0
Aggregated Statistics For Year 2005(Based on 5 partial tracts) A) Conventional B) Refinancings Number Average Value Number Average Value
LOANS ORIGINATED 2 $439,945 3 $461,703 APPLICATIONS APPROVED, NOT ACCEPTED 1 $405,460 0 $0 APPLICATIONS DENIED 0 $0 0 $0 APPLICATIONS WITHDRAWN 0 $0 1 $174,010 FILES CLOSED FOR INCOMPLETENESS 0 $0 2 $252,725
Aggregated Statistics For Year 2004(Based on 5 partial tracts) A) Conventional B) Refinancings Number Average Value Number Average Value
LOANS ORIGINATED 4 $324,315 4 $341,382 APPLICATIONS APPROVED, NOT ACCEPTED 1 $220,720 2 $277,610 APPLICATIONS DENIED 0 $0 0 $0 APPLICATIONS WITHDRAWN 0 $0 0 $0 FILES CLOSED FOR INCOMPLETENESS 0 $0 0 $0
Aggregated Statistics For Year 2003(Based on 5 partial tracts) A) Conventional B) Refinancings Number Average Value Number Average Value
LOANS ORIGINATED 12 $305,847 9 $274,789 APPLICATIONS APPROVED, NOT ACCEPTED 3 $275,667 3 $241,010 APPLICATIONS DENIED 0 $0 1 $165,720 APPLICATIONS WITHDRAWN 0 $0 0 $0 FILES CLOSED FOR INCOMPLETENESS 0 $0 0 $0
Aggregated Statistics For Year 2002(Based on 5 partial tracts) A) Conventional B) Refinancings Number Average Value Number Average Value
LOANS ORIGINATED 17 $258,729 10 $239,206 APPLICATIONS APPROVED, NOT ACCEPTED 3 $299,380 8 $223,746 APPLICATIONS DENIED 0 $0 0 $0 APPLICATIONS WITHDRAWN 0 $0 0 $0 FILES CLOSED FOR INCOMPLETENESS 0 $0 0 $0
Aggregated Statistics For Year 2001(Based on 5 partial tracts) A) Conventional B) Refinancings C) Non-occupant Loans on Number Average Value Number Average Value Number Average Value
LOANS ORIGINATED 20 $233,590 17 $231,342 1 $184,930 APPLICATIONS APPROVED, NOT ACCEPTED 5 $206,658 4 $278,925 0 $0 APPLICATIONS DENIED 1 $170,690 0 $0 0 $0 APPLICATIONS WITHDRAWN 1 $244,090 1 $218,230 0 $0 FILES CLOSED FOR INCOMPLETENESS 1 $167,930 1 $111,030 0 $0
Aggregated Statistics For Year 2000(Based on 5 partial tracts) A) Conventional B) Refinancings C) Non-occupant Loans on Number Average Value Number Average Value Number Average Value
LOANS ORIGINATED 26 $205,733 12 $171,849 3 $129,803 APPLICATIONS APPROVED, NOT ACCEPTED 5 $184,072 4 $197,595 0 $0 APPLICATIONS DENIED 0 $0 1 $304,260 0 $0 APPLICATIONS WITHDRAWN 1 $169,550 1 $111,010 0 $0 FILES CLOSED FOR INCOMPLETENESS 1 $208,380 0 $0 0 $0
Aggregated Statistics For Year 1999(Based on 5 partial tracts) A) Conventional B) Refinancings C) Non-occupant Loans on Number Average Value Number Average Value Number Average Value
LOANS ORIGINATED 33 $172,675 17 $174,511 2 $95,805 APPLICATIONS APPROVED, NOT ACCEPTED 3 $215,990 2 $182,920 1 $101,390 APPLICATIONS DENIED 4 $184,140 1 $187,010 0 $0 APPLICATIONS WITHDRAWN 4 $202,448 1 $108,630 0 $0 FILES CLOSED FOR INCOMPLETENESS 1 $117,680 0 $0 0 $0
Detailed PMIC statistics for the following Tracts:
3601.00
, 3602.00 , 3630.00
Most common first names in El Sobrante, CA among deceased individuals Name Count Lived (average)
John 105 72.9 years Robert 91 68.7 years William 91 69.8 years Mary 88 79.0 years James 64 70.5 years Joseph 58 75.8 years George 54 73.0 years Helen 45 79.2 years Charles 43 70.7 years Richard 38 73.0 years
Most common last names in El Sobrante, CA among deceased individuals Last name Count Lived (average)
Johnson 39 74.1 years Smith 29 77.7 years Williams 28 76.7 years Lee 20 71.1 years Brown 20 72.7 years Jones 20 80.7 years Young 14 73.4 years Miller 13 80.1 years White 12 75.9 years Anderson 12 72.4 years
El Sobrante compared to California state average:
Unemployed percentage significantly below state average. Black race population percentage above state average. Median age significantly above state average. Length of stay since moving in significantly above state average. El Sobrante on our top lists :
#84 on the list of "Top 100 most racially diverse cities (pop. 5,000+)"
#10 on the list of "Top 101 counties with the largest increase in the number of infant deaths per 1000 residents 2000-2006 to 2007-2013 (pop. 50,000+)"
#15 on the list of "Top 101 counties with the lowest Sulfur Oxides Annual air pollution readings in 2012 (µg/m3 )"
#17 on the list of "Top 101 counties with the highest Nitrogen Dioxide air pollution readings in 2012 (ppm)"
#31 on the list of "Top 101 counties with the highest percentage of residents that drank alcohol in the past 30 days"
#34 on the list of "Top 101 counties with the highest surface withdrawal of fresh water for public supply (pop. 50,000+)"
Top Patent Applicants
John J. Mcnamara (17)
Shawn Suko (16)
Hong Zhang (12)
Ho-Shang Lee (11)
Sham-Yuen Chan (9)
Donald R. James (9)
Akbar Riahi (7)
Aidon P. Jennery (7)
Xiguang Zang (6)
Amritpal Singh Bath (6)
Total of 225 patent applications in 2008-2024.
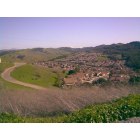

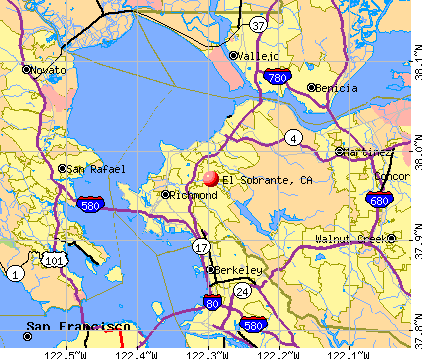


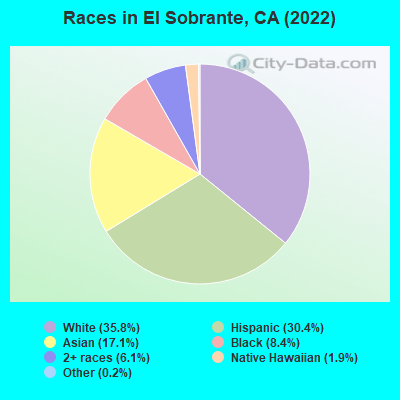
 Recent articles from our blog. Our writers, many of them Ph.D. graduates or candidates, create easy-to-read articles on a wide variety of topics.

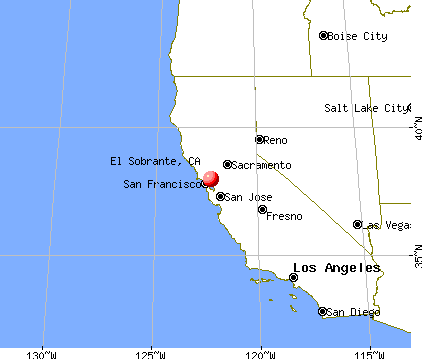
 , pop. 236,008).
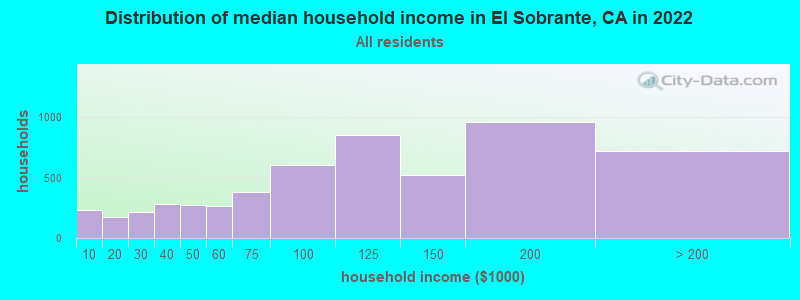
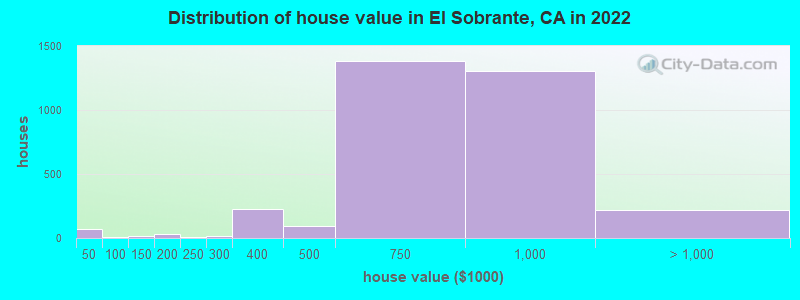
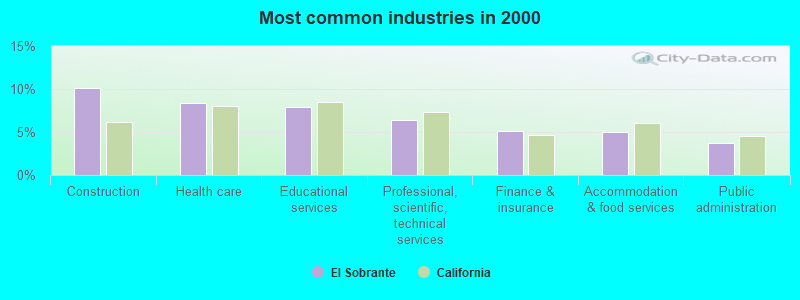
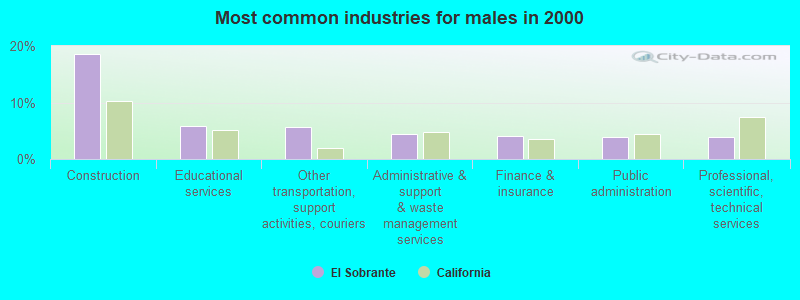
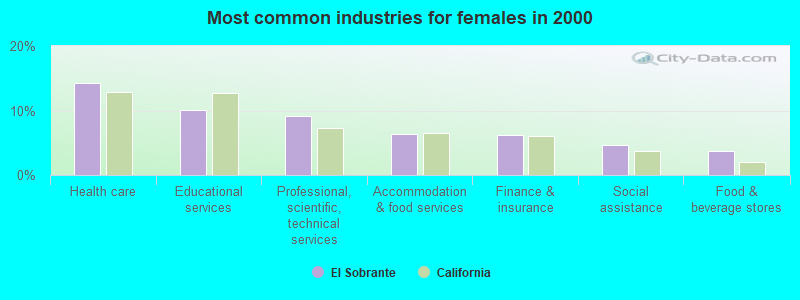
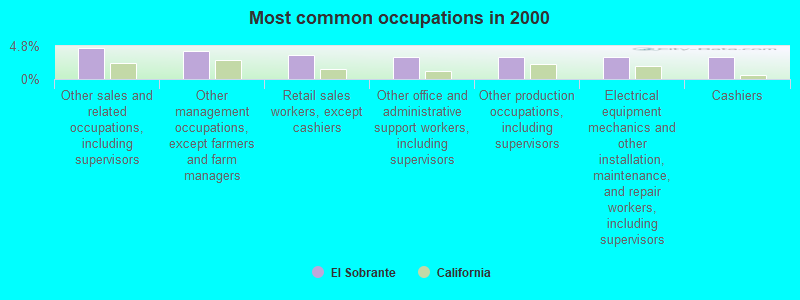
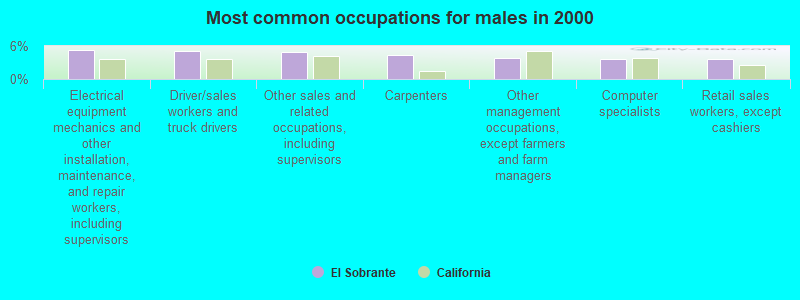
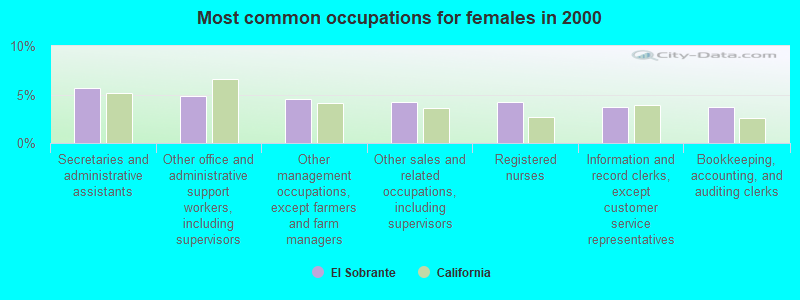
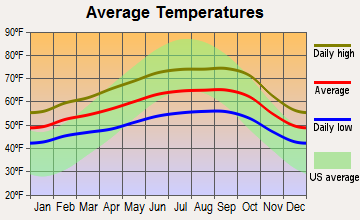
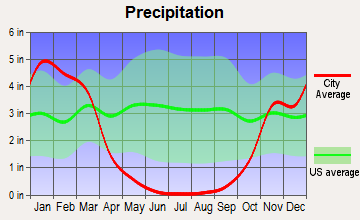
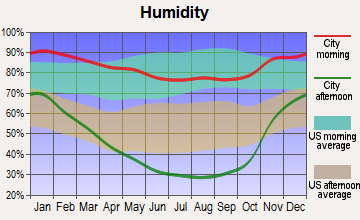
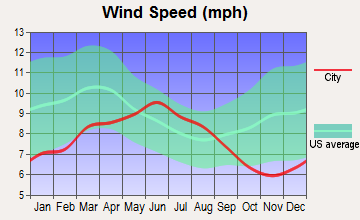
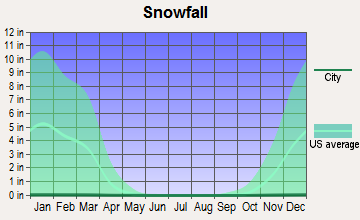
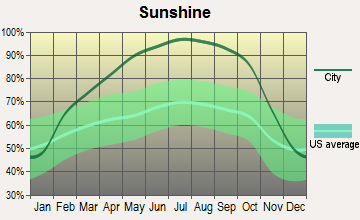
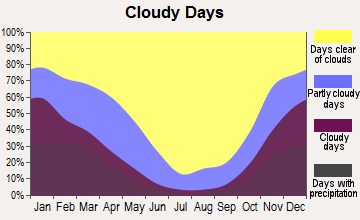
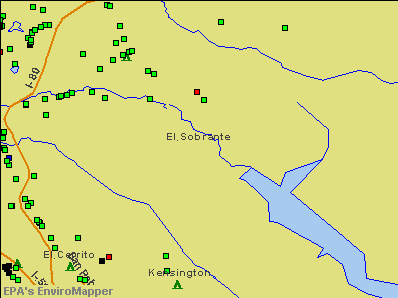

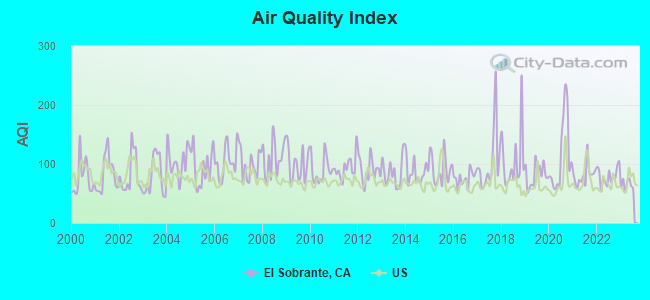
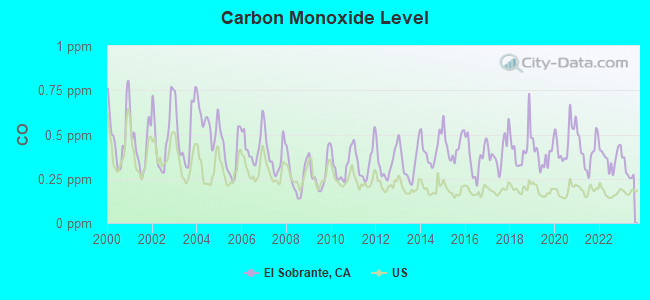
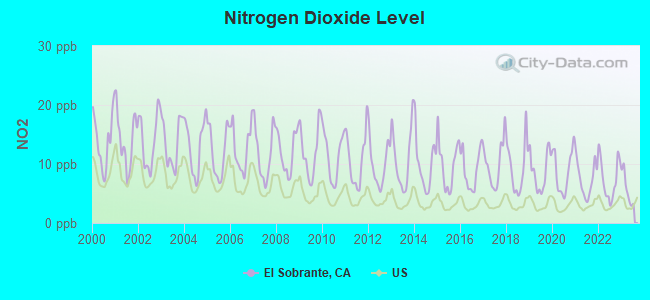
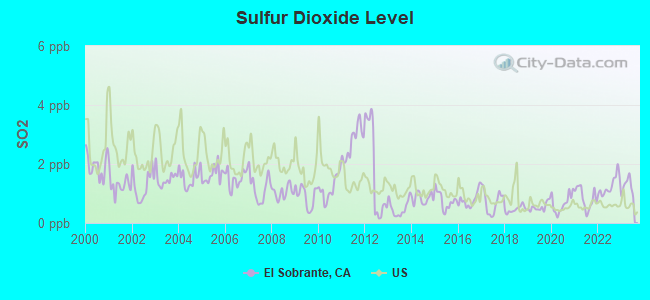
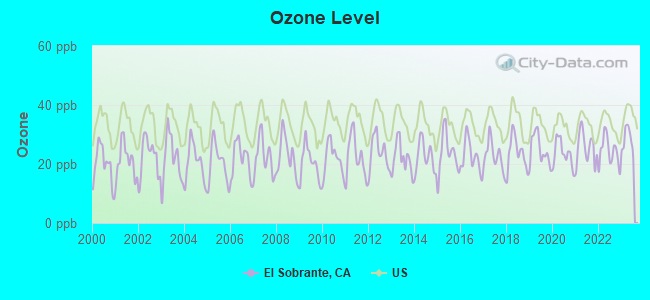
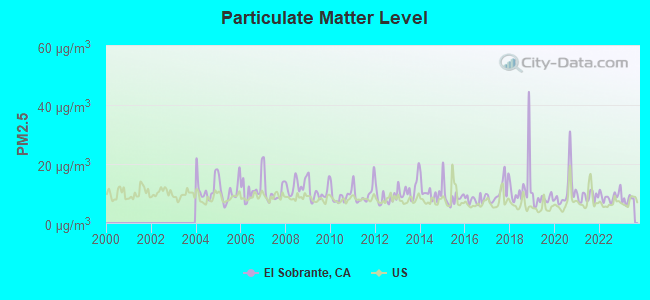
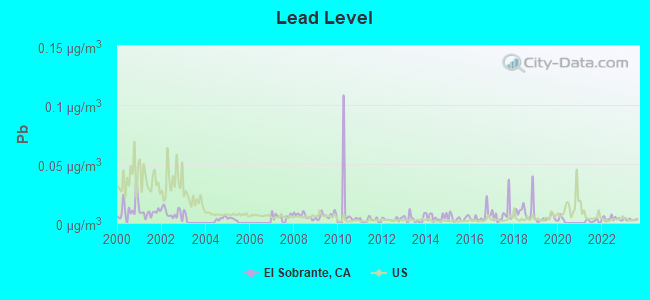

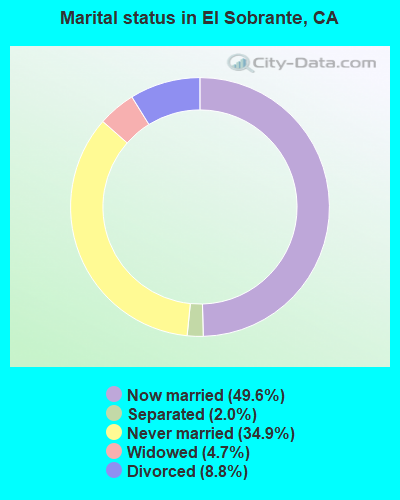
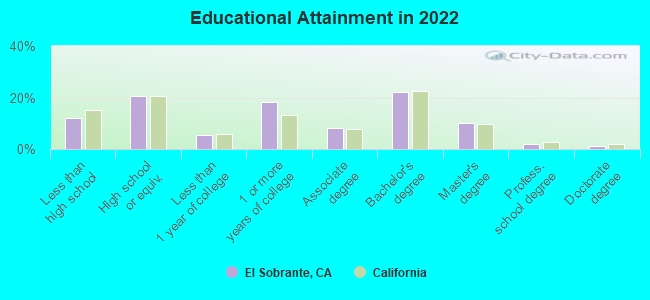
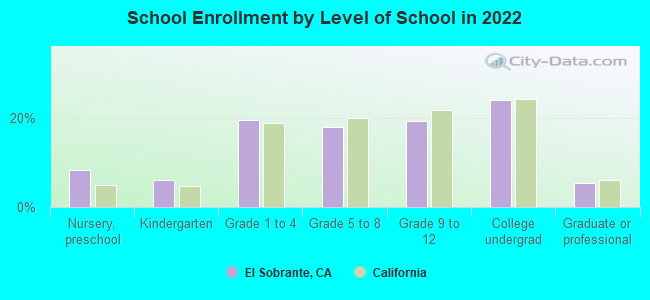
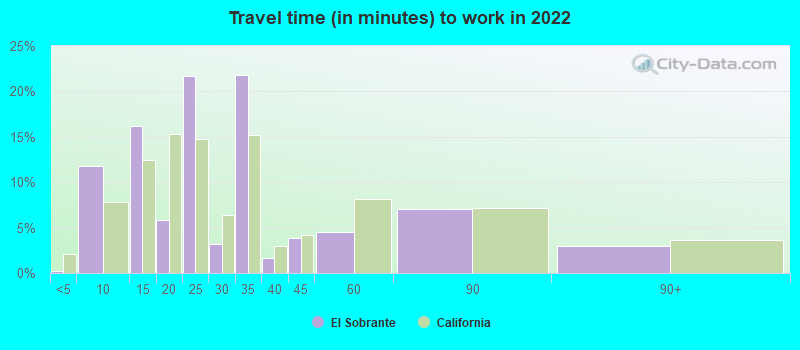
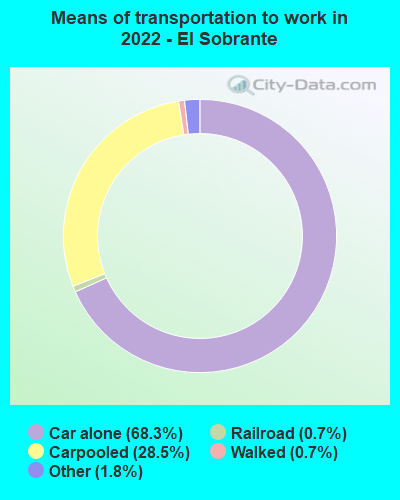


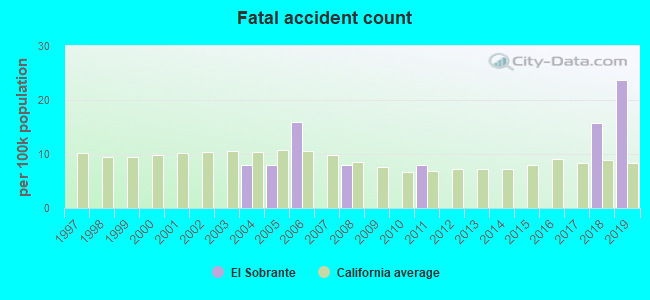
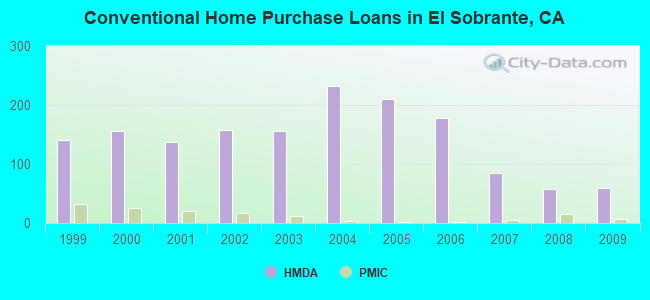
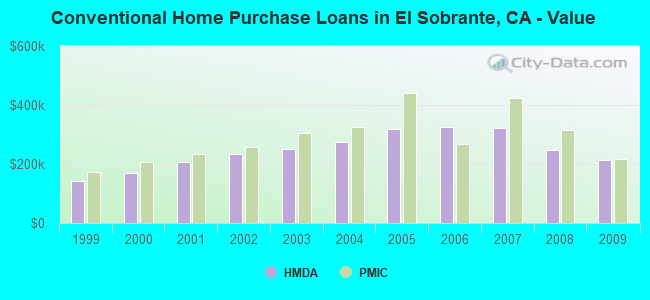
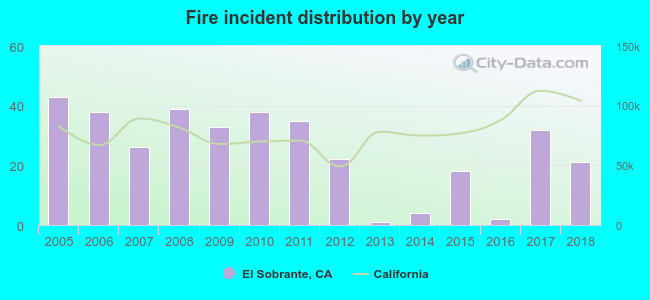 According to the data from the years 2005 - 2018 the average number of fires per year is 25. The highest number of fire incidents - 43 took place in 2005, and the least - 1 in 2013. The data has a decreasing trend.
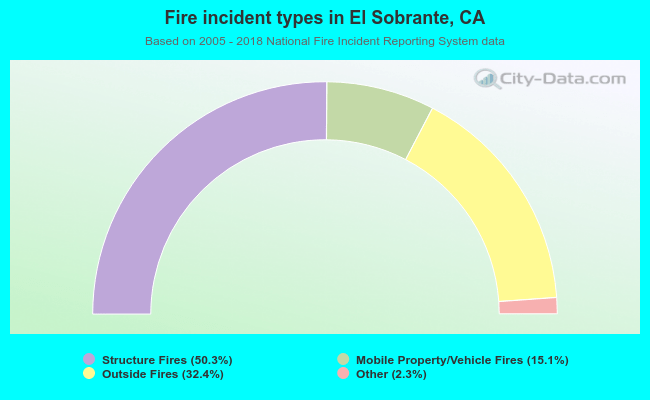 When looking into fire subcategories, the most reports belonged to: Structure Fires (50.3%), and Outside Fires (32.4%).