Central Contra Costa and Richmond, both located in California, offer different living experiences with distinct advantages and challenges. Central Contra Costa is an upscale area with a high cost of living but offers excellent schools, safety, and healthcare. Richmond, located in the inner bay of San Francisco, is more affordable and culturally diverse. It boasts an impressive industrial history and is known for its efforts toward environmental sustainability.
Central Contra Costa is generally safer than Richmond, which has a higher crime rate than the national average. However, Richmond has significantly improved its safety in recent years, deploying strategies that include community policing and violence prevention programs. Despite these efforts, crime is still a concern, and safety may be a significant consideration for people looking to relocate or visit.
Cost of Living
The cost of living in Central Contra Costa is significantly higher than in Richmond, due to higher housing, education, and healthcare costs. Richmond, with lower average housing and living costs, may be a more affordable option, particularly for young families or those just starting on their career journey.
Income Tax
California has progressive income tax, which means the rate increases as income does. Since incomes tend to be higher in Central Contra Costa, residents there may pay more income tax than those in Richmond.
Property Tax
Property taxes are also high in California and are based on assessed property value. Central Contra Costa, with higher property values, typically has higher property tax bills than Richmond.
Sales Tax
Sales tax rates in both Central Contra Costa and Richmond are above the national average due to California's high taxation. However, Richmond has a higher sales tax rate than Central Contra Costa.
Income
Type
Central Contra Costa
Richmond
Estimated median household income
$127,452
$85,754
Estimated per capita income
$68,702
$39,609
Cost of living index (U.S. average is 100)
139.1
121.3
If you make $50,000 in Richmond, you will have to make $57,337 in Central Contra Costa to maintain the same standard of living.
Geographical Conditions
Central Contra Costa is characterized by rolling hills and valleys, offering opportunities for outdoor recreation. Richmond has a diverse landscape, from industrial zones to a long shoreline offering waterfront views and recreational opportunities.
Geographical information
Type
Central Contra Costa
Richmond
Land area
261.3 sq. miles
30 sq. miles
Population density
1,863.4 people per sq. mile
3,857.3 people per sq. mile
Relative area comparison
Central Contra Costa, CA Richmond, CA
Education
Central Contra Costa boasts some of the highest-rated public schools in California, making it attractive for families. However, the cost of education, including private schools and tutoring services, is considerably higher here than in Richmond. Richmond has been investing heavily in its public education and offers several magnet and charter schools.
Central Contra Costa's economy is robust with key sectors in healthcare, education, and professional services. On the other hand, Richmond's economy is anchored in industrial, manufacturing, and service sectors. Unemployment rates are generally higher in Richmond than in Central Contra Costa.
Biggest Employers
Central Contra Costa's biggest employers are in the healthcare and education sectors, including John Muir Health and Mount Diablo Unified School District. In Richmond, the Chevron Refinery and West County Detention Facility are among the largest employers.
Weather
Both Central Contra Costa and Richmond experience a Mediterranean climate characterized by warm, dry summers and mild, wet winters. Richmond's coastal location means it often experiences cooler and more consistent temperatures due to the marine influence, while Central Contra Costa, further inland, has more temperature variability.
Weather and climate
Type
Central Contra Costa
Richmond
Temperature - Average
59.1°F
58.4°F
Humidity - Average morning or afternoon humidity
82.2%
84.1%
Humidity - Differences between morning and afternoon humidity
29.3%
29%
Humidity - Maximum monthly morning or afternoon humidity
88.1%
90.9%
Humidity - Minimum monthly morning or afternoon humidity
58.8%
61.8%
Precipitation - Yearly average
21.8 in
29.3 in
Snowfall - Yearly average
0 in
0 in
Clouds - Number of days clear of clouds
27.7%
27.1%
Sunshine amount - Average
73.3%
73%
Sunshine amount - Differences during a year
22.4%
22%
Sunshine amount - Maximum monthly
77.2%
77%
Sunshine amount - Minimum monthly
54.7%
55%
Wind speed - Average
11.1 mph
11.4 mph
Average climate in Central Contra Costa, California
Average climate in Richmond, California
Air pollution
Type
AQI
CO
NO2
OZONE
PB
PM25
SO2
Year
Central Contra Costa
Richmond
Central Contra Costa
Richmond
Central Contra Costa
Richmond
Central Contra Costa
Richmond
Central Contra Costa
Richmond
Central Contra Costa
Richmond
Central Contra Costa
Richmond
2018
105
105
0.32
0.42
6.9
8.7
22.1
24.4
0.012
0.012
13.3
12.9
0.6
0.5
2017
102
97
0.30
0.38
7.0
9.3
25.9
23.1
0.008
0.008
11.9
10.7
0.7
0.7
2016
86
76
0.28
0.36
6.5
8.6
25.2
22.7
0.005
0.005
6.5
8.1
0.8
0.8
2015
94
89
0.34
0.45
7.6
9.5
25.8
23.6
0.004
0.004
8.8
9.1
0.5
0.8
2014
95
85
0.35
0.42
7.8
9.4
25.2
22.3
0.005
0.005
6.9
10.4
0.5
0.9
2013
93
87
0.34
0.33
9.3
10.6
21.5
22.1
0.004
0.004
7.8
11.8
0.5
0.5
2012
93
89
0.32
0.32
8.5
9.7
25.2
24.1
0.003
0.003
8.3
8.1
0.3
1.9
2011
99
94
0.35
0.34
9.0
10.3
23.0
22.7
0.003
0.003
9.8
10.0
0.6
3.1
2010
93
89
0.31
0.33
8.6
11.4
23.2
21.8
0.014
0.016
8.5
9.1
0.5
1.3
2009
104
98
0.31
0.27
9.5
12.4
23.7
19.6
0.006
0.006
10.3
10.4
0.6
0.9
2008
120
110
0.36
0.23
10.2
12.1
26.1
22.5
0.006
0.006
12.1
12.7
0.8
1.1
2007
104
97
0.36
0.38
10.7
12.1
24.1
22.0
0.006
0.006
9.7
10.1
0.7
1.2
2006
109
104
0.39
0.43
10.9
12.8
26.0
21.3
N/A
N/A
11.1
10.5
0.8
1.6
2005
104
94
0.43
0.37
11.6
12.0
22.7
20.3
N/A
N/A
10.4
10.0
1.0
1.7
2004
112
105
0.46
0.60
12.4
13.1
22.6
20.6
0.004
0.004
11.9
11.8
1.1
1.6
2003
84
77
0.51
0.50
13.4
13.6
23.1
22.0
N/A
N/A
N/A
N/A
0.7
1.5
2002
88
79
0.51
0.48
14.7
13.9
23.3
22.4
0.008
0.008
N/A
N/A
0.9
1.2
2001
90
81
0.56
0.43
15.4
14.1
22.1
21.2
0.008
0.008
N/A
N/A
1.2
1.3
2000
95
73
0.67
0.50
15.9
14.1
20.8
19.6
0.013
0.013
N/A
N/A
1.6
2.0
Natural disasters
Type
Central Contra Costa
Richmond
Tornado activity compared to U.S. average
9.4%
8.3%
Earthquake activity compared to U.S. average
7,786.2%
7,597.7%
Natural disasters compared to U.S. average
18%
18%
Transportation
Both regions are served by the Bay Area Rapid Transit (BART) system, but Central Contra Costa has a broader network of public transportation options, including buses and ferries. Commute times in Central Contra Costa are typically shorter than in Richmond.
Transport
Type
Central Contra Costa
Richmond
Amtrak stations
0
1
Amtrak stations nearby
3
3
FAA registered aircraft
0
21
FAA registered aircraft manufacturers and dealers
0
1
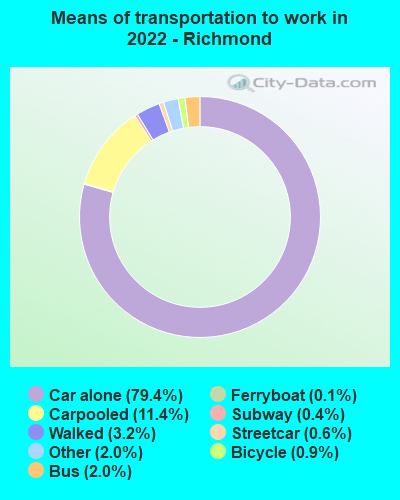
Means of transportation to work
Type
Central Contra Costa
Richmond
Bicycle
0.5%
0.7%
Bus
1%
1.6%
Carpooled
9.9%
13.7%
Car alone
72.3%
79.2%
Ferryboat
0%
0.2%
Motorcycle
0.2%
0.2%
Railroad
0.8%
0.4%
Streetcar
0.1%
0.9%
Subway
7.7%
0.2%
Taxicab
0.1%
0.2%
Walked
1.5%
1.6%
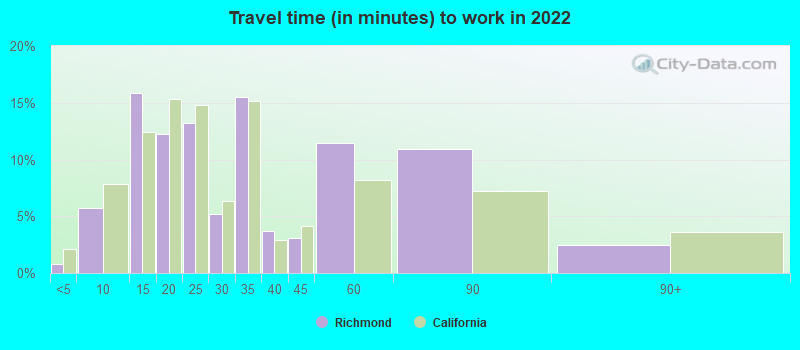
Average travel time to work
Type
Central Contra Costa
Richmond
Average
31.8 min
32.4 min
Real Estate
Real estate costs are high in Central Contra Costa, largely due to demand. Real estate opportunities in Richmond are more affordable, making it an attractive option for first-time homeowners or investors seeking cheaper entries.
Neighborhoods
Central Contra Costa is known for its picturesque, family-friendly neighborhoods like Walnut Creek. Richmond has a variety of neighborhoods, each with a unique personality, including the historic Point Richmond and the culturally vibrant Iron Triangle.
Houses and residents
Type
Central Contra Costa
Richmond
Houses
183,777
42,082
Average household size (people)
2.5
2.8
Houses occupied
179,136 (97.5%)
40,019 (95.1%)
Houses occupied by owners
127,889 (71.4%)
21,432 (53.6%)
Houses occupied by renters
51,247 (28.6%)
18,587 (46.4%)
Median rent asked for vacant for-rent units
$2,527
$1,845
Median price asked for vacant for-sale houses and condos
$1,269,474
$664,947
Estimated median house or condo value
Over $1,000,000
$641,500
Median number of rooms in apartments
4.3
4.3
Median number of rooms in houses and condos
6.5
5.6
Renting percentage
30.3%
48.3%
Housing density (houses/condos per square mile)
703.4
1,403.7
Household income disparities
35.9%
44.2%
Housing units without a mortgage
20,208 (18.2%)
499 (3.3%)
Housing units with both a second mortgage and home equity loan
418 (0.4%)
800 (5.3%)
Housing units with a mortgage
90,899 (81.8%)
14,674 (96.7%)
Housing units with a home equity loan
13,612 (12.3%)
0 (0%)
Housing units with a second mortgage
13,614 (12.3%)
1,195 (7.9%)
Housing units lacking complete kitchen facilities
0.5%
1.6%
Housing units lacking complete plumbing facilities
Self-employed workers in own not incorporated business
22,217
5,114
State government workers
6,705
1,312
Unpaid family workers
617
0
Industries and Occupations
While Central Contra Costa is dominated by healthcare and education-related occupations, Richmond offers opportunities in the industrial, manufacturing, and maritime industries. Richmond is also home to a burgeoning green industry thanks to its endeavor in environmental sustainability.
Health Care
Healthcare services are excellent in Central Contra Costa, with several renowned hospitals and medical centers. Although Richmond's healthcare facilities are improving, the area might not meet the high standards set by Central Contra Costa.
Infrastructure
Both Central Contra Costa and Richmond are well connected by major highways and public transportation. However, Central Contra Costa's infrastructure is generally better developed with more comprehensive public amenities and services.
Infrastructure
Type
Central Contra Costa
Richmond
TV stations
24
22
Culture and Food
Central Contra Costa boasts a vibrant culture and food scene, with an array of upscale dining options and cultural institutions. In contrast, Richmond offers culturally diverse cuisine and a rich history, including the iconic Rosie the Riveter/WWII Home Front National Historical Park.
Sports Teams
While neither area hosts a professional sports team, both are within easy reach of Pro Sports teams based in San Francisco and Oakland, so fans can easily access games.
 Central Contra Costa, CA
 Richmond, CA