Estimated zip code population in 2022: 26,263 Zip code population in 2010: 23,877 Zip code population in 2000: 23,121
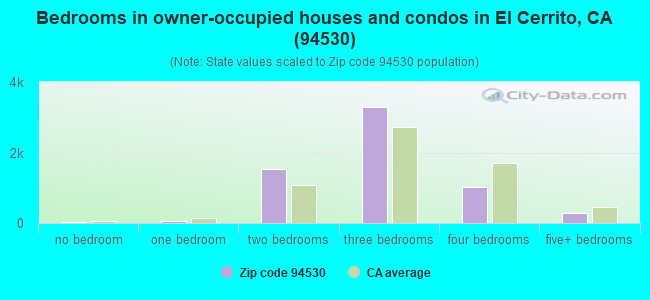
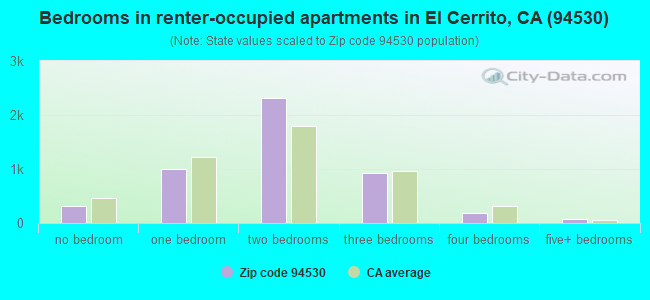
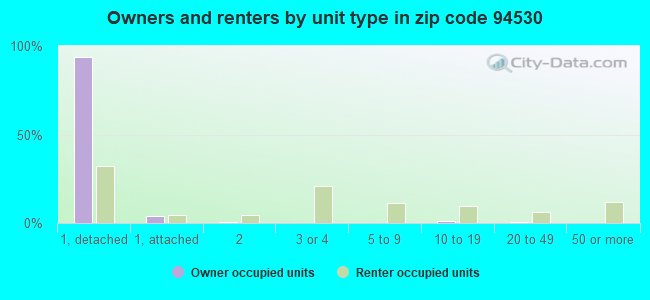
Houses and condos: 11,587 Renter-occupied apartments: 4,820
% of renters here:
44%
State:
44%
March 2022 cost of living index in zip code 94530: 120.9 (high, U.S. average is 100)
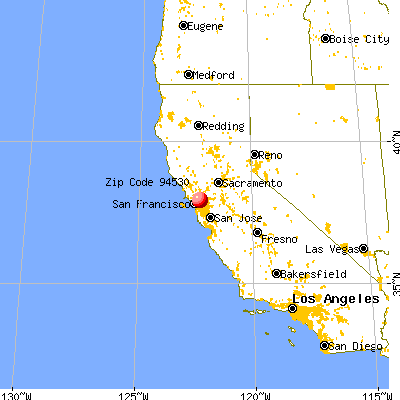
Land area: 4.8 sq. mi. Water area: 0.0 sq. mi.
Population density: 5,443 people per square mile
(average).
OSM Map
General Map
Google Map
MSN Map
OSM Map
General Map
Google Map
MSN Map
OSM Map
General Map
Google Map
MSN Map
OSM Map
General Map
Google Map
MSN Map
Please wait while loading the map...
Real estate property taxes paid for housing units in 2022:
This zip code:
0.8% ($8,822)
California:
0.7% ($4,831)
Median real estate property taxes paid for housing units with mortgages in 2022: $10,330 (0.9%) Median real estate property taxes paid for housing units with no mortgage in 2022: $6,067 (0.5%)
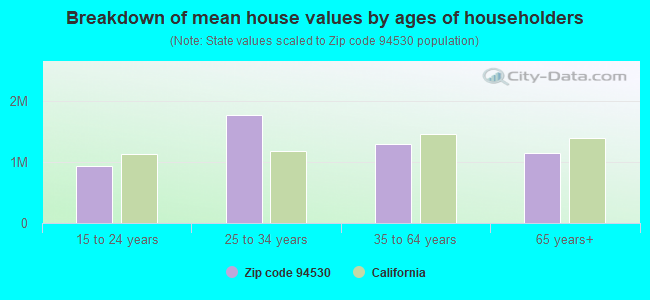
Estimated median house/condo value in 2022: $1,136,341
94530:
$1,136,341
California:
$715,900
According to our research of California and other state lists, there were 10 registered sex offenders living in 94530 zip code as of April 27, 2024. The ratio of all residents to sex offenders in zip code 94530 is 2,521 to 1. The ratio of registered sex offenders to all residents in this zip code is much lower than the state average.
Median resident age:
This zip code:
42.3 years
California median age:
37.9 years
Average household size:
This zip code:
2.4 people
California:
2.8 people
Averages for the 2020 tax year for zip code 94530, filed in 2021:
Average Adjusted Gross Income (AGI) in 2020: $116,410 (Individual Income Tax Returns)
Here:
$116,410
State:
$95,910
Salary/wage: $103,583 (reported on 74.2% of returns)
Here:
$103,583
State:
$77,331
(% of AGI for various income ranges: 1156.8% for AGIs below $25k, 3836.9% for AGIs $25k-50k, 7130.6% for AGIs $50k-75k, 10842.6% for AGIs $75k-100k, 20407.8% for AGIs $100k-200k, 85990.3% for AGIs over 200k)
Taxable interest for individuals: $1,782 (reported on 48.5% of returns)
This zip code:
$1,782
California:
$2,294
(% of AGI for various income ranges: 43.8% for AGIs below $25k, 61.7% for AGIs $25k-50k, 98.8% for AGIs $50k-75k, 128.2% for AGIs $75k-100k, 218.9% for AGIs $100k-200k, 833.5% for AGIs over 200k)
Ordinary dividends: $7,920 (reported on 37.1% of returns)
Here:
$7,920
State:
$10,949
(% of AGI for various income ranges: 75.2% for AGIs below $25k, 145.2% for AGIs $25k-50k, 249.0% for AGIs $50k-75k, 509.3% for AGIs $75k-100k, 861.2% for AGIs $100k-200k, 2985.0% for AGIs over 200k)
Net capital gain/loss in AGI: +$24,774 (reported on 35.1% of returns)
Here:
+$24,774
State:
+$49,306
(% of AGI for various income ranges: 41.6% for AGIs below $25k, 129.4% for AGIs $25k-50k, 244.8% for AGIs $50k-75k, 395.9% for AGIs $75k-100k, 1149.5% for AGIs $100k-200k, 14882.9% for AGIs over 200k)
Profit/loss from business: +$19,694 (reported on 24.1% of returns)
Here:
+$19,694
State:
+$15,671
(% of AGI for various income ranges: 294.4% for AGIs below $25k, 498.7% for AGIs $25k-50k, 466.7% for AGIs $50k-75k, 589.2% for AGIs $75k-100k, 1284.0% for AGIs $100k-200k, 4162.0% for AGIs over 200k)
Taxable individual retirement arrangement distribution: $24,526 (reported on 11.5% of returns)
94530:
$24,526
California:
$23,505
(% of AGI for various income ranges: 77.5% for AGIs below $25k, 152.6% for AGIs $25k-50k, 261.3% for AGIs $50k-75k, 423.4% for AGIs $75k-100k, 1095.4% for AGIs $100k-200k, 2342.3% for AGIs over 200k)
Self-employed (Keogh) retirement plans: $24,697 (reported on 2.4% of returns)
94530:
$24,697
California:
$30,163
(% of AGI for various income ranges: 43.8% for AGIs $25k-50k, 36.4% for AGIs $75k-100k, 117.3% for AGIs $100k-200k, 862.6% for AGIs over 200k)
Total itemized deductions: $33,848 (reported on 20.0% of returns)
Here:
$33,848
State:
$39,517
(% of AGI for various income ranges: 162.9% for AGIs below $25k, 294.3% for AGIs $25k-50k, 609.9% for AGIs $50k-75k, 1225.7% for AGIs $75k-100k, 2167.6% for AGIs $100k-200k, 6543.9% for AGIs over 200k)
Charity contributions: $6,904 (reported on 16.3% of returns)
Here:
$6,904
State:
$12,598
(% of AGI for various income ranges: 4.7% for AGIs below $25k, 23.2% for AGIs $25k-50k, 66.9% for AGIs $50k-75k, 163.7% for AGIs $75k-100k, 312.7% for AGIs $100k-200k, 1398.0% for AGIs over 200k)
Taxes paid: $9,088 (reported on 20.0% of returns)
94530:
$9,088
State:
$8,807
(% of AGI for various income ranges: 38.3% for AGIs below $25k, 66.5% for AGIs $25k-50k, 155.8% for AGIs $50k-75k, 332.9% for AGIs $75k-100k, 643.5% for AGIs $100k-200k, 1685.3% for AGIs over 200k)
Earned income credit: $1,418 (reported on 7.1% of returns)
Here:
$1,418
State:
$2,074
(% of AGI for various income ranges: 47.0% for AGIs below $25k, 43.4% for AGIs $25k-50k)
Percentage of individuals using paid preparers for their 2020 taxes: 90.0%
Here:
90%
State:
92%
(% for various income ranges: 86.7% for AGIs below $25k, 90.6% for AGIs $25k-50k, 88.3% for AGIs $50k-75k, 89.4% for AGIs $75k-100k, 91.6% for AGIs $100k-200k, 93.4% for AGIs over 200k)
Averages for the 2012 tax year for zip code 94530, filed in 2013:
Average Adjusted Gross Income (AGI) in 2012: $80,293 (Individual Income Tax Returns)
Here:
$80,293
State:
$72,726
Salary/wage: $71,095 (reported on 75.1% of returns)
Here:
$71,095
State:
$59,079
(% of AGI for various income ranges: 63.8% for AGIs below $25k, 70.8% for AGIs $25k-50k, 69.6% for AGIs $50k-75k, 67.4% for AGIs $75k-100k, 70.7% for AGIs $100k-200k, 58.9% for AGIs over 200k)
Taxable interest for individuals: $1,451 (reported on 50.7% of returns)
This zip code:
$1,451
California:
$2,146
(% of AGI for various income ranges: 2.0% for AGIs below $25k, 1.0% for AGIs $25k-50k, 0.9% for AGIs $50k-75k, 1.0% for AGIs $75k-100k, 0.7% for AGIs $100k-200k, 0.9% for AGIs over 200k)
Ordinary dividends: $6,759 (reported on 34.7% of returns)
Here:
$6,759
State:
$9,308
(% of AGI for various income ranges: 4.0% for AGIs below $25k, 2.2% for AGIs $25k-50k, 2.4% for AGIs $50k-75k, 2.8% for AGIs $75k-100k, 2.6% for AGIs $100k-200k, 3.6% for AGIs over 200k)
Net capital gain/loss in AGI: +$10,260 (reported on 28.9% of returns)
Here:
+$10,260
State:
+$30,460
(% of AGI for various income ranges: 0.5% for AGIs $25k-50k, 0.9% for AGIs $50k-75k, 0.8% for AGIs $75k-100k, 1.8% for AGIs $100k-200k, 9.8% for AGIs over 200k)
Profit/loss from business: +$22,338 (reported on 22.5% of returns)
Here:
+$22,338
State:
+$17,064
(% of AGI for various income ranges: 16.3% for AGIs below $25k, 7.8% for AGIs $25k-50k, 5.7% for AGIs $50k-75k, 5.2% for AGIs $75k-100k, 5.3% for AGIs $100k-200k, 6.2% for AGIs over 200k)
Taxable individual retirement arrangement distribution: $19,560 (reported on 14.0% of returns)
94530:
$19,560
California:
$19,557
(% of AGI for various income ranges: 4.1% for AGIs below $25k, 2.9% for AGIs $25k-50k, 3.5% for AGIs $50k-75k, 3.2% for AGIs $75k-100k, 3.4% for AGIs $100k-200k, 3.5% for AGIs over 200k)
Self-employment retirement plans: $18,475 (reported on 2.8% of returns)
94530:
$18,475
California:
$24,530
(% of AGI for various income ranges: 0.4% for AGIs $25k-50k, 0.3% for AGIs $50k-75k, 0.4% for AGIs $75k-100k, 0.5% for AGIs $100k-200k, 1.2% for AGIs over 200k)
Total itemized deductions: $28,948 (22% of AGI, reported on 44.3% of returns)
Here:
$28,948
State:
$34,004
Here:
22.1% of AGI
State:
22.7% of AGI
(% of AGI for various income ranges: 17.8% for AGIs below $25k, 11.5% for AGIs $25k-50k, 13.8% for AGIs $50k-75k, 16.6% for AGIs $75k-100k, 17.5% for AGIs $100k-200k, 16.0% for AGIs over 200k)
Charity contributions: $3,297 (reported on 35.7% of returns)
Here:
$3,297
State:
$4,659
(% of AGI for various income ranges: 0.8% for AGIs below $25k, 1.0% for AGIs $25k-50k, 1.1% for AGIs $50k-75k, 1.3% for AGIs $75k-100k, 1.5% for AGIs $100k-200k, 1.9% for AGIs over 200k)
Taxes paid: $12,716 (reported on 44.1% of returns)
94530:
$12,716
State:
$14,448
(% of AGI for various income ranges: 3.9% for AGIs below $25k, 3.0% for AGIs $25k-50k, 4.4% for AGIs $50k-75k, 6.2% for AGIs $75k-100k, 7.9% for AGIs $100k-200k, 9.1% for AGIs over 200k)
Earned income credit: $1,471 (reported on 9.0% of returns)
Here:
$1,471
State:
$2,286
(% of AGI for various income ranges: 3.2% for AGIs below $25k, 0.4% for AGIs $25k-50k)
Percentage of individuals using paid preparers for their 2012 taxes: 51.5%
Here:
52%
State:
64%
(% for various income ranges: 46.9% for AGIs below $25k, 49.6% for AGIs $25k-50k, 50.7% for AGIs $50k-75k, 53.7% for AGIs $75k-100k, 54.7% for AGIs $100k-200k, 64.4% for AGIs over 200k)
Averages for the 2004 tax year for zip code 94530, filed in 2005:
Average Adjusted Gross Income (AGI) in 2004: $62,582 (Individual Income Tax Returns)
Here:
$62,582
State:
$58,600
Salary/wage: $54,739 (reported on 73.6% of returns)
Here:
$54,739
State:
$49,455
(% of AGI for various income ranges: 158.7% for AGIs below $10k, 63.8% for AGIs $10k-25k, 70.0% for AGIs $25k-50k, 70.5% for AGIs $50k-75k, 70.6% for AGIs $75k-100k, 58.3% for AGIs over 100k)
Taxable interest for individuals: $2,286 (reported on 62.3% of returns)
This zip code:
$2,286
California:
$2,365
(% of AGI for various income ranges: 18.2% for AGIs below $10k, 4.2% for AGIs $10k-25k, 2.8% for AGIs $25k-50k, 2.1% for AGIs $50k-75k, 1.8% for AGIs $75k-100k, 2.0% for AGIs over 100k)
Taxable dividends: $4,378 (reported on 40.0% of returns)
Here:
$4,378
State:
$4,746
(% of AGI for various income ranges: 16.9% for AGIs below $10k, 4.0% for AGIs $10k-25k, 2.5% for AGIs $25k-50k, 2.4% for AGIs $50k-75k, 2.2% for AGIs $75k-100k, 2.9% for AGIs over 100k)
Net capital gain/loss: +$11,014 (reported on 33.5% of returns)
Here:
+$11,014
State:
+$23,418
(% of AGI for various income ranges: -4.6% for AGIs below $10k, 1.0% for AGIs $10k-25k, 0.8% for AGIs $25k-50k, 0.9% for AGIs $50k-75k, 1.3% for AGIs $75k-100k, 10.8% for AGIs over 100k)
Profit/loss from business: +$20,836 (reported on 21.6% of returns)
Here:
+$20,836
State:
+$16,826
(% of AGI for various income ranges: 13.9% for AGIs below $10k, 11.1% for AGIs $10k-25k, 6.8% for AGIs $25k-50k, 6.0% for AGIs $50k-75k, 6.3% for AGIs $75k-100k, 7.4% for AGIs over 100k)
IRA payment deduction: $3,070 (reported on 4.4% of returns)
94530:
$3,070
California:
$3,192
(% of AGI for various income ranges: 1.7% for AGIs below $10k, 0.5% for AGIs $10k-25k, 0.4% for AGIs $25k-50k, 0.3% for AGIs $50k-75k, 0.2% for AGIs $75k-100k, 0.1% for AGIs over 100k)
Self-employed pension: $13,696 (reported on 3.5% of returns)
Here:
$13,696
California:
$17,688
(% of AGI for various income ranges: 0.3% for AGIs $10k-25k, 0.4% for AGIs $25k-50k, 0.5% for AGIs $50k-75k, 0.8% for AGIs $75k-100k, 1.0% for AGIs over 100k)
Total itemized deductions: $25,091 (24% of AGI, reported on 43.6% of returns)
Here:
$25,091
State:
$28,113
Here:
24.4% of AGI
State:
25.3% of AGI
(% of AGI for various income ranges: 54.7% for AGIs below $10k, 18.3% for AGIs $10k-25k, 13.9% for AGIs $25k-50k, 16.9% for AGIs $50k-75k, 18.5% for AGIs $75k-100k, 17.9% for AGIs over 100k)
Charity contributions deductions: $3,018 (3% of AGI, reported on 37.2% of returns)
Here:
$3,018
State:
$3,923
Here:
2.8% of AGI
State:
3.3% of AGI
(% of AGI for various income ranges: 1.9% for AGIs below $10k, 1.0% for AGIs $10k-25k, 1.3% for AGIs $25k-50k, 1.7% for AGIs $50k-75k, 1.6% for AGIs $75k-100k, 2.1% for AGIs over 100k)
Total tax: $10,345 (reported on 84.7% of returns)
94530:
$10,345
State:
$10,761
(% of AGI for various income ranges: 8.3% for AGIs below $10k, 5.6% for AGIs $10k-25k, 8.9% for AGIs $25k-50k, 11.0% for AGIs $50k-75k, 12.2% for AGIs $75k-100k, 17.7% for AGIs over 100k)
Earned income credit: $1,137 (reported on 6.8% of returns)
Here:
$1,137
State:
$1,763
Percentage of individuals using paid preparers for their 2004 taxes: 54.1%
Here:
54%
State:
66%
(% for various income ranges: 50.5% for AGIs below $10k, 53.2% for AGIs $10k-25k, 52.0% for AGIs $25k-50k, 52.9% for AGIs $50k-75k, 55.7% for AGIs $75k-100k, 61.3% for AGIs over 100k)
Likely homosexual households (counted as self-reported same-sex unmarried-partner households)
Lesbian couples: 0.3% of all households
Gay men: 0.6% of all households
Household received Food Stamps/SNAP in the past 12 months: 581 Household did not receive Food Stamps/SNAP in the past 12 months: 10,284
Women who had a birth in the past 12 months: 269 (214 now married, 54 unmarried) Women who did not have a birth in the past 12 months: 6,113 (2,768 now married, 3,330 unmarried)
Housing units in zip code 94530 with a mortgage: 3,888 (576 second mortgage, 506 both second mortgage and home equity loan) Houses without a mortgage: 93
Median monthly owner costs for units with a mortgage: $3,591 Median monthly owner costs for units without a mortgage: $916
Residents with income below the poverty level in 2022:
This zip code:
8.9%
Whole state:
12.2%
Residents with income below 50% of the poverty level in 2022:
This zip code:
4.2%
Whole state:
6.2%
Median number of rooms in houses and condos:
Here:
5.9
State:
6.0
Median number of rooms in apartments:
Here:
4.1
State:
3.9
Notable locations in this zip code not listed on our city pages
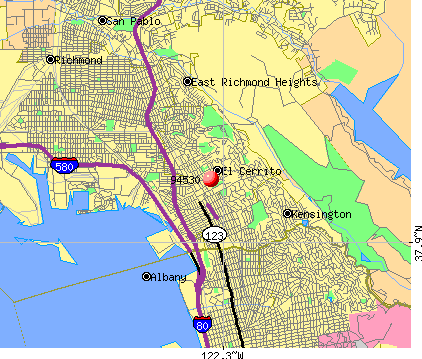
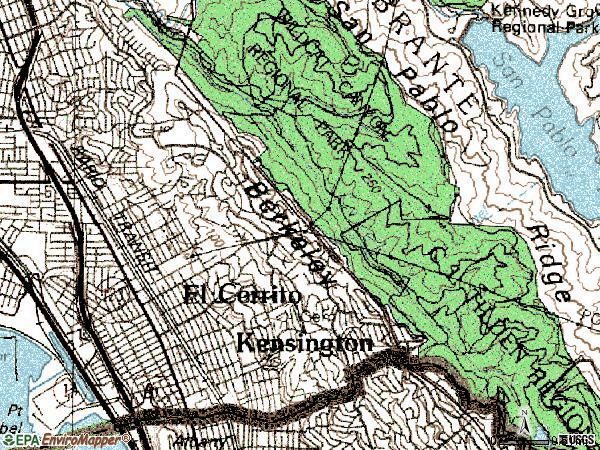
Notable locations in zip code 94530: Camp Herms (A), Mira Vista Country Club (B), Veterans Memorial Building (C), El Cerrito Fire Department Station 72 (D), El Cerrito City Hall (E), El Cerrito Branch Contra Costa County Library (F), El Cerrito Plaza Station (G), El Cerrito Del Norte Station (H), Contra Costa Civic Theatre (I). Display/hide their locations on the map
Churches in zip code 94530 include: Saint Peters Methodist Church (A), Saint Patricks Episcopal Church (B), Saint John the Baptist Catholic Church (C), Saint Jerome Roman Catholic Church (D), Kingdom Hall of Jehovahs Witnesses (E), Grace Lutheran Church (F), El Cerrito United Methodist Church (G), El Cerrito Evangelical Free Church (H), Christ Lutheran Church (I). Display/hide their locations on the map
Parks in zip code 94530 include: Poinsett Park (1), Tassajara Park (2), Cerrito Vista Park (3), Arlington Park (4), Casa Cerrito Park (5), Castro Park (6), El Cerrito Community Swim Center (7), Hillside Natural Area (8), Canyon Trail Park (9). Display/hide their locations on the map
3,259 married couples with children.
1,021 single-parent households (327 men, 694 women).
61.8% of residents of 94530 zip code speak English at home.
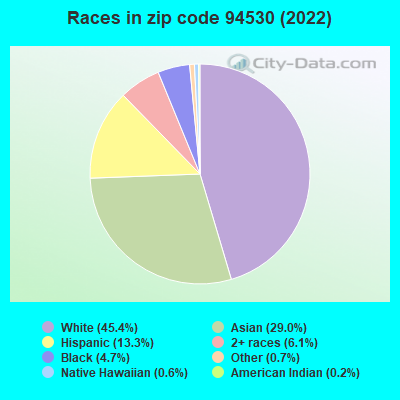
7.2% of residents speak Spanish at home (64% very well, 20% well, 14% not well, 2% not at all).
13.1% of residents speak other Indo-European language at home (72% very well, 17% well, 11% not well, 1% not at all).
15.9% of residents speak Asian or Pacific Island language at home (50% very well, 31% well, 17% not well, 1% not at all).
2.5% of residents speak other language at home (76% very well, 16% well, 1% not well, 7% not at all).
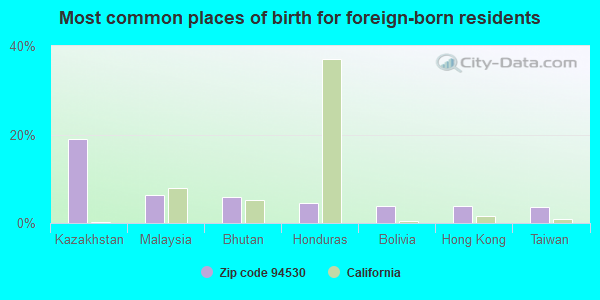
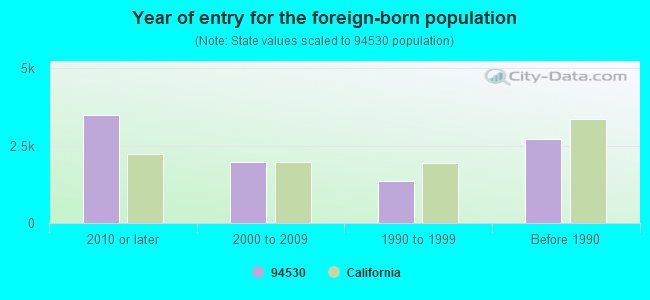
Foreign born population: 8,846 (33.7%) (59.1% of them are naturalized citizens)
This zip code:
33.7%
Whole state:
26.7%
19%Kazakhstan
6%Malaysia
6%Bhutan
5%Honduras
4%Bolivia
4%Hong Kong
4%Taiwan
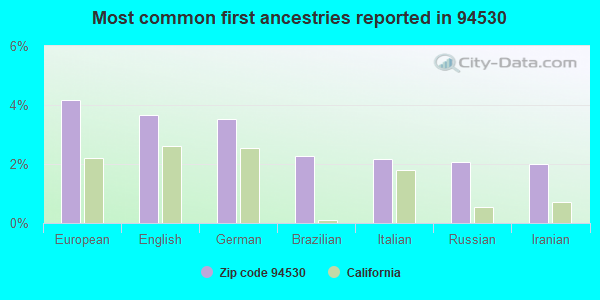
4%European
4%English
4%German
2%Brazilian
2%Italian
2%Russian
2%Iranian
Year of entry for the foreign-born population
3,4892010 or later
1,9632000 to 2009
1,3721990 to 1999
2,703Before 1990
Major facilities with environmental interests located in this zip code:
GREAT AMERICAN DRY CLEANING (215 EL CERRITO PLAZA in EL CERRITO, CA)
STATE MASTER (California - Hazardous Waste Tracking) - HAZARDOU WASTE PROGRAM CRITERIA AND HAZARDOUS AIR POLLUTANT INVENTORY (Inventory of air pollution sources) (Resource Conservation and Recovery Act (tracking hazardous waste)) Small Quantity Generators, between 100 kg and 1000 kg of hazardous waste/month (Resource Conservation and Recovery Act (tracking hazardous waste)) Business SIC classification: DRYCLEANING PLANTS, EXCEPT RUG CLEANING Organizations: THE GREAT AMERICA CLEANERS (CONTACT/OWNER)
, BOB & SANDY KIM (CONTACT/OWNER)
Alternative names: GREAT AMERICA CLEANERS
LONGS DRUG STORES NO 508 (10650 SAN PABLO AVE in EL CERRITO, CA)
STATE MASTER (California - Hazardous Waste Tracking) - HAZARDOU WASTE PROGRAM COMPLIANCE ACTIVITY (Tracking inspections of insecticide, fungicide, and rodenticide, and toxic substances) Small Quantity Generators, between 100 kg and 1000 kg of hazardous waste/month (Resource Conservation and Recovery Act (tracking hazardous waste)) - notification Organizations: LONGS DRUG STORES CAL (CONTACT/OWNER)
Alternative names: LONGS DRUG STORE #508, PAYLESS DRUG STORE-NORTHWEST INC, PAYLESS DRUG STORES NORTHWEST, INC
HONDA OF EL CERRITO (11755 SAN PABLO AVE in EL CERRITO, CA)
STATE MASTER (California - Hazardous Waste Tracking) - HAZARDOU WASTE PROGRAM Small Quantity Generators, between 100 kg and 1000 kg of hazardous waste/month (Resource Conservation and Recovery Act (tracking hazardous waste)) - notification Organizations: EL CERRITO AUTOMOTIVE CO (CONTACT/OWNER)
MADERA ELEMENTARY SCHOOL RICHMOND USD (8500 MADERA DRIVE in EL CERRITO, CA)
COMPLIANCE ACTIVITY (Tracking inspections of insecticide, fungicide, and rodenticide, and toxic substances) (National Center for Education Statistics) - STATE ID-6004840 Organizations: WEST CONTRA COSTA UNIFIED (SCHOOL DISTRICT)
CHEVRON STATION NO 96967 (11319 SAN PABLO AVE in EL CERRITO, CA)
STATE MASTER (California - Hazardous Waste Tracking) - HAZARDOU WASTE PROGRAM Small Quantity Generators, between 100 kg and 1000 kg of hazardous waste/month (Resource Conservation and Recovery Act (tracking hazardous waste)) - notification Organizations: CHEVRON PRODUCTS CO (CONTACT/OWNER)
ALTERNATIVE EDUCATION LEARNING CENTER CHARTER (7628 POTRERO AVENUE in EL CERRITO, CA)
(National Center for Education Statistics) - STATE ID-0730580 Organizations: WEST CONTRA COSTA UNIFIED (SCHOOL DISTRICT)
EL CERRITO SENIOR HIGH (540 ASHBURY AVE. in EL CERRITO, CA)
(National Center for Education Statistics) - STATE ID-0732941 Organizations: WEST CONTRA COSTA UNIFIED (SCHOOL DISTRICT)
FAIRMONT ELEMENTARY (724 KEARNEY ST. in EL CERRITO, CA)
(National Center for Education Statistics) - STATE ID-6004758 Organizations: WEST CONTRA COSTA UNIFIED (SCHOOL DISTRICT)
HARDING ELEMENTARY (7230 FAIRMONT AVE. in EL CERRITO, CA)
(National Center for Education Statistics) - STATE ID-6004782 Organizations: WEST CONTRA COSTA UNIFIED (SCHOOL DISTRICT)
CASTRO ELEMENTARY (7125 DONAL AVE. in EL CERRITO, CA)
(National Center for Education Statistics) - STATE ID-6004642 Organizations: WEST CONTRA COSTA UNIFIED (SCHOOL DISTRICT)
O K CLEANERS (6109 POTRERO AVENUE in EL CERRITO, CA)
CRITERIA AND HAZARDOUS AIR POLLUTANT INVENTORY (Inventory of air pollution sources) (Resource Conservation and Recovery Act (tracking hazardous waste)) Business SIC classification: DRYCLEANING PLANTS, EXCEPT RUG CLEANING Organizations: A&N COMPANY (CONTACT/OWNER)
Alternative names: A&N COMP DRYCLEANERS, UNIQUE CLEANERS
EL CERRITO RECYCLING CENTER (7501 SCHMIDT LANE in EL CERRITO, CA)
Large Quantity Generators, more that 1000 kg of hazardous waste/month (Resource Conservation and Recovery Act (tracking hazardous waste)) Organizations: CITY OF EL CERRITO (CONTACT/OPERATOR)
EL CERRITO MITSUBISHI (11820 SAN PABLO AVENUE in EL CERRITO, CA)
Small Quantity Generators, between 100 kg and 1000 kg of hazardous waste/month (Resource Conservation and Recovery Act (tracking hazardous waste)) - notification Organizations: EL CERRITO AUTOMOTIVE INVESTMENTS LLC (CONTACT/OWNER)
Alternative names: VAL STROUGH EL CERRITO MAZDA, VAL STROUGHS EL CERRITO HONDA, VAL STROUGHS EL CERRITO MAZDA
Housing units lacking complete plumbing facilities: 1.7% Housing units lacking complete kitchen facilities: 2.4%
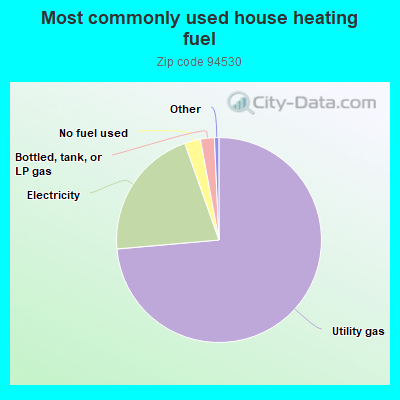
73.6%Utility gas
21.0%Electricity
2.5%No fuel used
2.2%Bottled, tank, or LP gas
Population in 1990: 28,146.
Place of birth for U.S.-born residents:
This state: 11,697
Northeast: 1,603
Midwest: 1,727
South: 1,235
West: 674
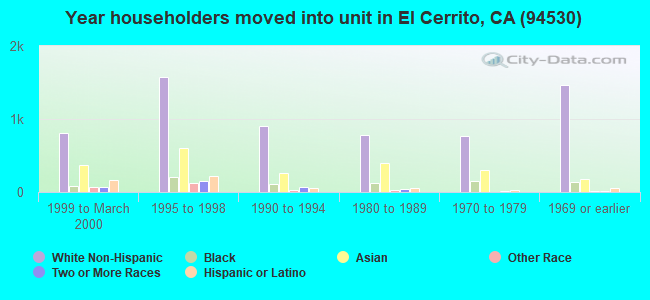
61% of the 94530 zip code residents lived in the same house 5 years ago. Out of people who lived in different houses, 30% lived in this county. Out of people who lived in different counties, 50% lived in California.
86% of the 94530 zip code residents lived in the same house 1 year ago. Out of people who lived in different houses, 33% moved from this county. Out of people who lived in different houses, 48% moved from different county within same state. Out of people who lived in different houses, 10% moved from different state. Out of people who lived in different houses, 9% moved from abroad.
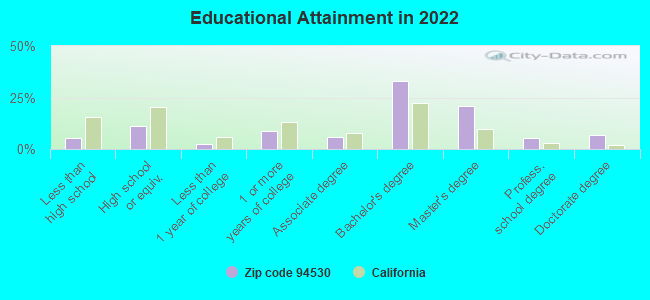
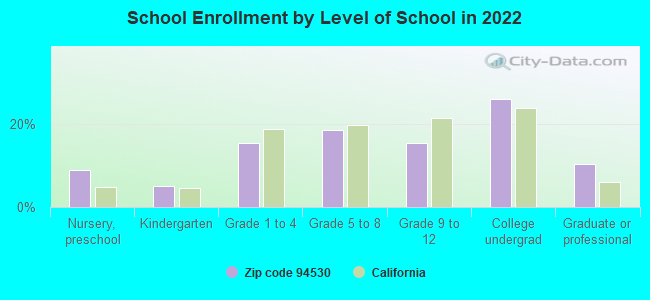
Private vs. public school enrollment:
Students in private schools in grades 1 to 8 (elementary and middle school): 299
Here:
16.0%
California:
10.5%
Students in private schools in grades 9 to 12 (high school): 214
Here:
25.3%
California:
8.5%
Students in private undergraduate colleges: 219
Here:
15.4%
California:
15.9%
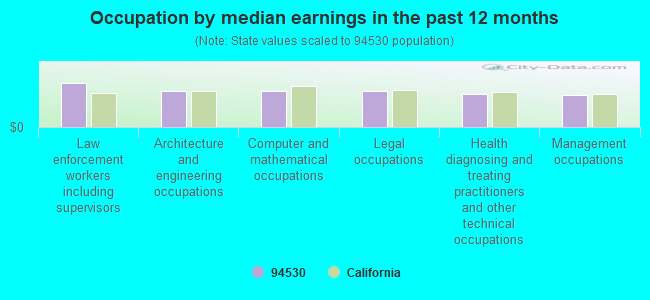
Occupation by median earnings in the past 12 months ($)
155,433Law enforcement workers including supervisors
127,790Architecture and engineering occupations
127,693Computer and mathematical occupations
126,745Legal occupations
117,438Health diagnosing and treating practitioners and other technical occupations
112,538Management occupations
Companies with federal contracts located in this zip code (EL CERRITO, CA):
ARCHITECTURAL SYSTEMS CORPORAT (1 - 20TH STREET, RICHMOND; small business) : $1,465,198 in 11 contractsfrom 2000 to 2002
Contracts for Maintenance, Repair or Alteration of Real Property -- Family Housing Facilities, Hazardous Substance Removal, Cleanup, and Disposal Services and Operational Support, Maintenance, Repair or Alteration of Real Property -- Other Conservation and Development Facilities by Air Force, Navy, Agricultural Research Service (disused code) Signed by year:2000: $338,035; 2001: $914,763; 2002: $212,400; 2003: $0; 2004: $0; 2005: $0; 2006: $0.
Biggest contracts:
$520,000 with Air Force for Maintenance, Repair or Alteration of Real Property -- Family Housing Facilities. Signed on 2001-12-03. Completion date: 2002-09-30.
$328,035 with Navy for Hazardous Substance Removal, Cleanup, and Disposal Services and Operational Support. Signed on 2000-11-28. Completion date: 2000-10-16.
$285,000 with Air Force for Maintenance, Repair or Alteration of Real Property -- Family Housing Facilities. Signed on 2001-02-07. Completion date: 2002-09-29.
$188,000, same as above.Signed on 2002-04-02. Completion date: 2002-09-30.
SEISMOLOGICAL SOCIETY OF AMERI (201 EL CERRITO PLZ) : $137,120 in 48 contractsfrom 2003 to 2006
Contracts for Other Photographic, Mapping, Printing, and Publication Services, Newspapers and Periodicals, , Books and Pamphlets, and moreby Geological Survey, National Oceanic and Atmospheric Administration/Under Secretary for Oceans and Atmosphere, Air Force Signed by year:2000: $0; 2001: $0; 2002: $0; 2003: $3,502; 2004: $66,018; 2005: $59,313; 2006: $8,287.
Biggest contracts:
$8,665 with Geological Survey for Other Photographic, Mapping, Printing, and Publication Services. Signed on 2005-12-22. Completion date: 2006-01-31.
$6,652, same as above.Signed on 2005-10-26. Completion date: 2005-10-27.
$6,392, same as above.Signed on 2006-06-05. Effective on 2006-06-02. Completion date: 2006-12-31.
$6,068 with Geological Survey for Newspapers and Periodicals. Signed on 2004-08-19. Completion date: 2004-09-16.
CORWIN, ROBERT F (406 SEAVIEW DR; small business) : $27,950 in 2 contractsfrom 2004 to 2005
$23,000 with Army for Other Research and Development -- Basic Research (R&D). Taking place in TX. Signed on 2004-08-10. Completion date: 2004-12-31.
$4,950, same as above.Signed on 2005-02-15. Completion date: 2004-12-31.
ADVENTURE ASSOCIATES, INC (601 LEXINGTON AVE; small business) : $11,660 in 2 contractsfrom 2003 to 2004
$6,160 with Army for Training/Curriculum Development. Taking place in OH. Signed on 2003-07-31. Completion date: 2003-08-02.
$5,500 with Army for Lectures For Training. Signed on 2004-07-31. Completion date: 2004-08-02.
Top industries in this zip code by the number of employees in 2005:
2005 - 2018 National Fire Incident Reporting System (NFIRS) incidents
According to the data from the years 2005 - 2018 the average number of fire incidents per year is 53. The highest number of fires - 90 took place in 2005, and the least - 30 in 2018. The data has a decreasing trend.
When looking into fire subcategories, the most incidents belonged to: Structure Fires (50.2%), and Outside Fires (30.4%).
Fire incident types reported to NFIRS in Zip Code 94530


 Nearest zip codes: 94850, 94707, 94706, 94805, 94803, 94708.


 According to the data from the years 2005 - 2018 the average number of fire incidents per year is 53. The highest number of fires - 90 took place in 2005, and the least - 30 in 2018. The data has a decreasing trend.
 When looking into fire subcategories, the most incidents belonged to: Structure Fires (50.2%), and Outside Fires (30.4%).