Estimated zip code population in 2022: 44,018 Zip code population in 2010: 38,559 Zip code population in 2000: 39,080
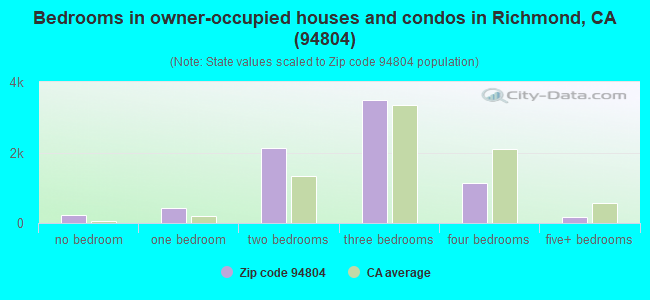
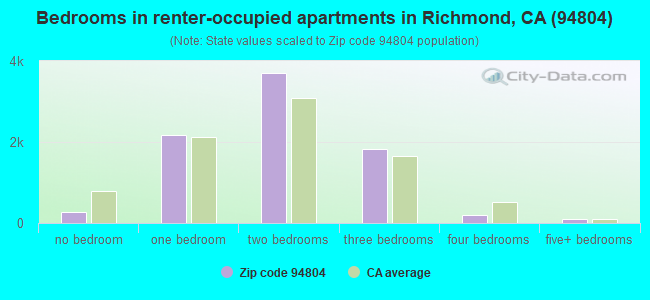
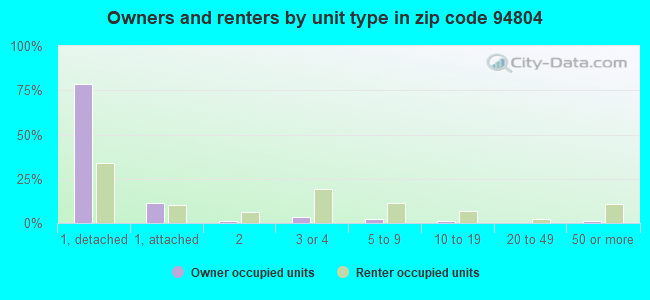
Houses and condos: 16,512 Renter-occupied apartments: 8,318
% of renters here:
52%
State:
44%
March 2022 cost of living index in zip code 94804: 117.7 (more than average, U.S. average is 100)
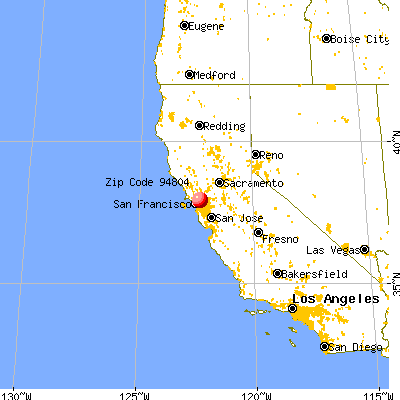
Land area: 6.2 sq. mi. Water area: 2.7 sq. mi.
Population density: 7,138 people per square mile
(high).
OSM Map
General Map
Google Map
MSN Map
OSM Map
General Map
Google Map
MSN Map
OSM Map
General Map
Google Map
MSN Map
OSM Map
General Map
Google Map
MSN Map
Please wait while loading the map...
Real estate property taxes paid for housing units in 2022:
This zip code:
0.9% ($5,469)
California:
0.7% ($4,831)
Median real estate property taxes paid for housing units with mortgages in 2022: $6,109 (0.9%) Median real estate property taxes paid for housing units with no mortgage in 2022: $4,467 (0.7%)
Averages for the 2020 tax year for zip code 94804, filed in 2021:
Average Adjusted Gross Income (AGI) in 2020: $61,591 (Individual Income Tax Returns)
Here:
$61,591
State:
$95,910
Salary/wage: $58,313 (reported on 81.3% of returns)
Here:
$58,313
State:
$77,331
(% of AGI for various income ranges: 1192.5% for AGIs below $25k, 4141.1% for AGIs $25k-50k, 7769.4% for AGIs $50k-75k, 11350.0% for AGIs $75k-100k, 19932.5% for AGIs $100k-200k, 77672.1% for AGIs over 200k)
Taxable interest for individuals: $723 (reported on 28.3% of returns)
This zip code:
$723
California:
$2,294
(% of AGI for various income ranges: 8.6% for AGIs below $25k, 12.4% for AGIs $25k-50k, 31.7% for AGIs $50k-75k, 48.5% for AGIs $75k-100k, 82.1% for AGIs $100k-200k, 414.2% for AGIs over 200k)
Ordinary dividends: $3,674 (reported on 12.9% of returns)
Here:
$3,674
State:
$10,949
(% of AGI for various income ranges: 17.0% for AGIs below $25k, 23.4% for AGIs $25k-50k, 46.8% for AGIs $50k-75k, 106.9% for AGIs $75k-100k, 219.3% for AGIs $100k-200k, 1210.0% for AGIs over 200k)
Net capital gain/loss in AGI: +$11,489 (reported on 13.2% of returns)
Here:
+$11,489
State:
+$49,306
(% of AGI for various income ranges: 9.6% for AGIs below $25k, 17.5% for AGIs $25k-50k, 59.7% for AGIs $50k-75k, 141.3% for AGIs $75k-100k, 414.3% for AGIs $100k-200k, 9272.5% for AGIs over 200k)
Profit/loss from business: +$12,628 (reported on 20.8% of returns)
Here:
+$12,628
State:
+$15,671
(% of AGI for various income ranges: 311.0% for AGIs below $25k, 258.1% for AGIs $25k-50k, 325.1% for AGIs $50k-75k, 423.9% for AGIs $75k-100k, 844.9% for AGIs $100k-200k, 3417.5% for AGIs over 200k)
Taxable individual retirement arrangement distribution: $16,710 (reported on 4.6% of returns)
94804:
$16,710
California:
$23,505
(% of AGI for various income ranges: 31.2% for AGIs below $25k, 44.3% for AGIs $25k-50k, 103.5% for AGIs $50k-75k, 164.5% for AGIs $75k-100k, 405.2% for AGIs $100k-200k, 1247.9% for AGIs over 200k)
Self-employed (Keogh) retirement plans: $17,558 (reported on 0.6% of returns)
94804:
$17,558
California:
$30,163
(% of AGI for various income ranges: 22.6% for AGIs $50k-75k, 43.1% for AGIs $100k-200k, 387.9% for AGIs over 200k)
Total itemized deductions: $27,050 (reported on 14.1% of returns)
Here:
$27,050
State:
$39,517
(% of AGI for various income ranges: 88.0% for AGIs below $25k, 205.0% for AGIs $25k-50k, 566.7% for AGIs $50k-75k, 1207.7% for AGIs $75k-100k, 1888.2% for AGIs $100k-200k, 5700.0% for AGIs over 200k)
Charity contributions: $5,210 (reported on 10.5% of returns)
Here:
$5,210
State:
$12,598
(% of AGI for various income ranges: 5.7% for AGIs below $25k, 29.4% for AGIs $25k-50k, 81.1% for AGIs $50k-75k, 166.9% for AGIs $75k-100k, 237.3% for AGIs $100k-200k, 1164.2% for AGIs over 200k)
Taxes paid: $8,592 (reported on 14.1% of returns)
94804:
$8,592
State:
$8,807
(% of AGI for various income ranges: 22.4% for AGIs below $25k, 56.9% for AGIs $25k-50k, 188.5% for AGIs $50k-75k, 427.9% for AGIs $75k-100k, 636.5% for AGIs $100k-200k, 1490.8% for AGIs over 200k)
Earned income credit: $2,053 (reported on 15.6% of returns)
Here:
$2,053
State:
$2,074
(% of AGI for various income ranges: 106.1% for AGIs below $25k, 65.1% for AGIs $25k-50k, 1.2% for AGIs $50k-75k)
Percentage of individuals using paid preparers for their 2020 taxes: 90.4%
Here:
90%
State:
92%
(% for various income ranges: 88.2% for AGIs below $25k, 90.7% for AGIs $25k-50k, 90.3% for AGIs $50k-75k, 91.2% for AGIs $75k-100k, 92.8% for AGIs $100k-200k, 94.9% for AGIs over 200k)
Averages for the 2012 tax year for zip code 94804, filed in 2013:
Average Adjusted Gross Income (AGI) in 2012: $44,713 (Individual Income Tax Returns)
Here:
$44,713
State:
$72,726
Salary/wage: $42,372 (reported on 83.3% of returns)
Here:
$42,372
State:
$59,079
(% of AGI for various income ranges: 72.5% for AGIs below $25k, 83.3% for AGIs $25k-50k, 82.4% for AGIs $50k-75k, 80.9% for AGIs $75k-100k, 78.4% for AGIs $100k-200k, 66.5% for AGIs over 200k)
Taxable interest for individuals: $699 (reported on 26.6% of returns)
This zip code:
$699
California:
$2,146
(% of AGI for various income ranges: 0.5% for AGIs below $25k, 0.3% for AGIs $25k-50k, 0.6% for AGIs $50k-75k, 0.3% for AGIs $75k-100k, 0.4% for AGIs $100k-200k, 0.5% for AGIs over 200k)
Ordinary dividends: $4,065 (reported on 10.7% of returns)
Here:
$4,065
State:
$9,308
(% of AGI for various income ranges: 0.8% for AGIs below $25k, 0.6% for AGIs $25k-50k, 0.7% for AGIs $50k-75k, 0.9% for AGIs $75k-100k, 1.4% for AGIs $100k-200k, 1.7% for AGIs over 200k)
Net capital gain/loss in AGI: +$7,209 (reported on 8.6% of returns)
Here:
+$7,209
State:
+$30,460
(% of AGI for various income ranges: 0.1% for AGIs $25k-50k, 0.2% for AGIs $50k-75k, 0.6% for AGIs $75k-100k, 1.2% for AGIs $100k-200k, 11.3% for AGIs over 200k)
Profit/loss from business: +$11,819 (reported on 17.7% of returns)
Here:
+$11,819
State:
+$17,064
(% of AGI for various income ranges: 14.3% for AGIs below $25k, 4.0% for AGIs $25k-50k, 2.5% for AGIs $50k-75k, 3.0% for AGIs $75k-100k, 3.3% for AGIs $100k-200k, 4.9% for AGIs over 200k)
Taxable individual retirement arrangement distribution: $13,053 (reported on 5.2% of returns)
94804:
$13,053
California:
$19,557
(% of AGI for various income ranges: 1.4% for AGIs below $25k, 1.1% for AGIs $25k-50k, 1.5% for AGIs $50k-75k, 1.5% for AGIs $75k-100k, 2.0% for AGIs $100k-200k, 1.9% for AGIs over 200k)
Self-employment retirement plans: $21,325 (reported on 0.4% of returns)
94804:
$21,325
California:
$24,530
Total itemized deductions: $21,187 (26% of AGI, reported on 29.1% of returns)
Here:
$21,187
State:
$34,004
Here:
26.0% of AGI
State:
22.7% of AGI
(% of AGI for various income ranges: 9.2% for AGIs below $25k, 10.1% for AGIs $25k-50k, 14.1% for AGIs $50k-75k, 16.7% for AGIs $75k-100k, 17.5% for AGIs $100k-200k, 14.6% for AGIs over 200k)
Charity contributions: $2,648 (reported on 22.1% of returns)
Here:
$2,648
State:
$4,659
(% of AGI for various income ranges: 0.6% for AGIs below $25k, 1.0% for AGIs $25k-50k, 1.6% for AGIs $50k-75k, 1.6% for AGIs $75k-100k, 1.5% for AGIs $100k-200k, 1.3% for AGIs over 200k)
Taxes paid: $7,477 (reported on 29.1% of returns)
94804:
$7,477
State:
$14,448
(% of AGI for various income ranges: 1.9% for AGIs below $25k, 2.6% for AGIs $25k-50k, 4.2% for AGIs $50k-75k, 5.9% for AGIs $75k-100k, 7.3% for AGIs $100k-200k, 8.4% for AGIs over 200k)
Earned income credit: $2,239 (reported on 22.2% of returns)
Here:
$2,239
State:
$2,286
(% of AGI for various income ranges: 7.5% for AGIs below $25k, 1.0% for AGIs $25k-50k)
Percentage of individuals using paid preparers for their 2012 taxes: 56.6%
Here:
57%
State:
64%
(% for various income ranges: 54.5% for AGIs below $25k, 59.0% for AGIs $25k-50k, 58.0% for AGIs $50k-75k, 56.7% for AGIs $75k-100k, 54.7% for AGIs $100k-200k, 63.6% for AGIs over 200k)
Averages for the 2004 tax year for zip code 94804, filed in 2005:
Average Adjusted Gross Income (AGI) in 2004: $43,267 (Individual Income Tax Returns)
Here:
$43,267
State:
$58,600
Salary/wage: $39,111 (reported on 84.9% of returns)
Here:
$39,111
State:
$49,455
(% of AGI for various income ranges: 133.9% for AGIs below $10k, 75.2% for AGIs $10k-25k, 85.8% for AGIs $25k-50k, 85.0% for AGIs $50k-75k, 84.8% for AGIs $75k-100k, 55.8% for AGIs over 100k)
Taxable interest for individuals: $1,024 (reported on 38.1% of returns)
This zip code:
$1,024
California:
$2,365
(% of AGI for various income ranges: 4.1% for AGIs below $10k, 1.4% for AGIs $10k-25k, 0.7% for AGIs $25k-50k, 0.8% for AGIs $50k-75k, 1.1% for AGIs $75k-100k, 0.8% for AGIs over 100k)
Taxable dividends: $2,433 (reported on 14.4% of returns)
Here:
$2,433
State:
$4,746
(% of AGI for various income ranges: 3.7% for AGIs below $10k, 0.9% for AGIs $10k-25k, 0.5% for AGIs $25k-50k, 0.8% for AGIs $50k-75k, 1.0% for AGIs $75k-100k, 0.9% for AGIs over 100k)
Net capital gain/loss: +$7,211 (reported on 11.3% of returns)
Here:
+$7,211
State:
+$23,418
(% of AGI for various income ranges: -1.8% for AGIs below $10k, 0.0% for AGIs $10k-25k, 0.3% for AGIs $25k-50k, 0.4% for AGIs $50k-75k, 1.4% for AGIs $75k-100k, 5.6% for AGIs over 100k)
Profit/loss from business: +$10,736 (reported on 14.4% of returns)
Here:
+$10,736
State:
+$16,826
(% of AGI for various income ranges: 5.8% for AGIs below $10k, 8.1% for AGIs $10k-25k, 3.1% for AGIs $25k-50k, 2.7% for AGIs $50k-75k, 1.8% for AGIs $75k-100k, 3.9% for AGIs over 100k)
IRA payment deduction: $2,929 (reported on 1.7% of returns)
94804:
$2,929
California:
$3,192
(% of AGI for various income ranges: 0.4% for AGIs below $10k, 0.2% for AGIs $10k-25k, 0.1% for AGIs $25k-50k, 0.1% for AGIs $50k-75k, 0.1% for AGIs $75k-100k, 0.1% for AGIs over 100k)
Self-employed pension: $10,739 (reported on 0.8% of returns)
Here:
$10,739
California:
$17,688
(% of AGI for various income ranges: 0.1% for AGIs $10k-25k, 0.1% for AGIs $25k-50k, 0.2% for AGIs $50k-75k, 0.1% for AGIs $75k-100k, 0.4% for AGIs over 100k)
Total itemized deductions: $20,782 (28% of AGI, reported on 36.1% of returns)
Here:
$20,782
State:
$28,113
Here:
27.9% of AGI
State:
25.3% of AGI
(% of AGI for various income ranges: 22.9% for AGIs below $10k, 13.1% for AGIs $10k-25k, 16.7% for AGIs $25k-50k, 21.3% for AGIs $50k-75k, 19.9% for AGIs $75k-100k, 14.9% for AGIs over 100k)
Charity contributions deductions: $2,490 (3% of AGI, reported on 29.8% of returns)
Here:
$2,490
State:
$3,923
Here:
3.1% of AGI
State:
3.3% of AGI
(% of AGI for various income ranges: 1.0% for AGIs below $10k, 1.0% for AGIs $10k-25k, 1.5% for AGIs $25k-50k, 2.2% for AGIs $50k-75k, 2.3% for AGIs $75k-100k, 1.6% for AGIs over 100k)
Total tax: $5,970 (reported on 72.9% of returns)
94804:
$5,970
State:
$10,761
(% of AGI for various income ranges: 5.3% for AGIs below $10k, 4.0% for AGIs $10k-25k, 6.3% for AGIs $25k-50k, 9.1% for AGIs $50k-75k, 11.3% for AGIs $75k-100k, 16.2% for AGIs over 100k)
Earned income credit: $1,730 (reported on 18.2% of returns)
Here:
$1,730
State:
$1,763
Percentage of individuals using paid preparers for their 2004 taxes: 63.8%
Here:
64%
State:
66%
(% for various income ranges: 58.3% for AGIs below $10k, 69.2% for AGIs $10k-25k, 64.8% for AGIs $25k-50k, 63.3% for AGIs $50k-75k, 55.0% for AGIs $75k-100k, 62.1% for AGIs over 100k)
Likely homosexual households (counted as self-reported same-sex unmarried-partner households)
Lesbian couples: 0.4% of all households
Gay men: 0.4% of all households
Household received Food Stamps/SNAP in the past 12 months: 2,831 Household did not receive Food Stamps/SNAP in the past 12 months: 13,271
Women who had a birth in the past 12 months: 813 (556 now married, 257 unmarried) Women who did not have a birth in the past 12 months: 10,582 (3,951 now married, 6,641 unmarried)
Housing units in zip code 94804 with a mortgage: 5,399 (228 second mortgage, 14 home equity loan, 176 both second mortgage and home equity loan) Houses without a mortgage: 146
Median monthly owner costs for units with a mortgage: $2,349 Median monthly owner costs for units without a mortgage: $693
Residents with income below the poverty level in 2022:
This zip code:
16.5%
Whole state:
12.2%
Residents with income below 50% of the poverty level in 2022:
This zip code:
7.0%
Whole state:
6.2%
Median number of rooms in houses and condos:
Here:
5.2
State:
6.0
Median number of rooms in apartments:
Here:
4.1
State:
3.9
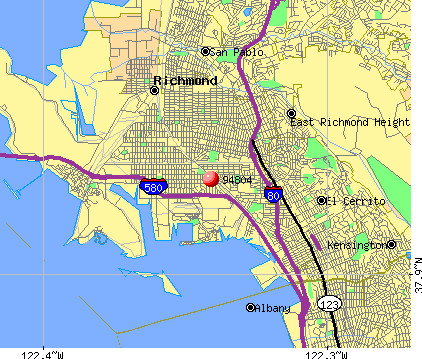
Notable locations in this zip code not listed on our city pages
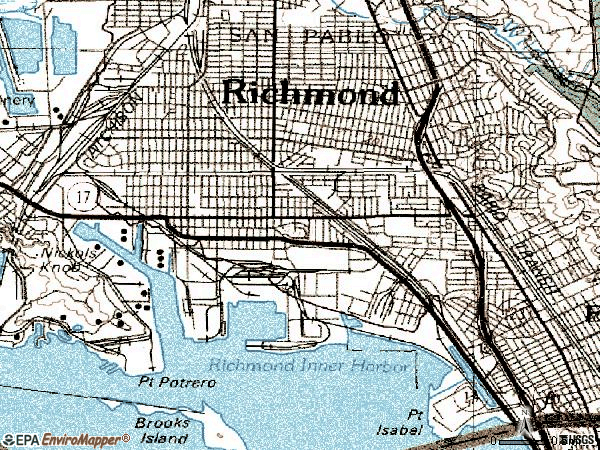
Notable locations in zip code 94804: Channel Marina (A), Richmond Reserve Shipyard (B), Richmond Public Library (C), Richmond Memorial Convention Center (D), Richmond City Hall (E), Richmond Art Center (F), Richmond Fire Department Station 67 (G), East Shore Community Center (H), Bayview Branch Richmond Public Library (I), Richmond Fire Department Station 64 (J), Richmond Fire Department Training Division (K). Display/hide their locations on the map
Churches in zip code 94804 include: Zion Hill Missionary Baptist Church (A), West Contra Costa Christian Center (B), Unity Church of Richmond (C), The House of Prayer (D), Temple Baptist Church (E), Saint Lukes United Methodist Church (F), Saint Luke Baptist Church (G), Saint John Baptist Church (H), Saint James Lutheran Church (I). Display/hide their locations on the map
Parks in zip code 94804 include: Rosie the Riveter WWII Home Front National Historical Park (1), Wendell Playground (2), Boorman Park (3), M L King Memorial Park (4), Marina Park (5), Brooks Island Regional Shoreline (6), Burg Park (7), Central Park (8), Crescent Park (9). Display/hide their locations on the map
4,564 married couples with children.
2,841 single-parent households (575 men, 2,266 women).
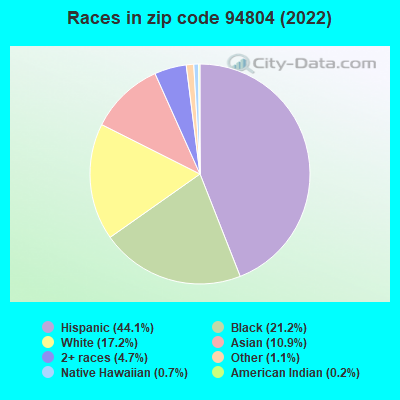
47.7% of residents of 94804 zip code speak English at home.
39.1% of residents speak Spanish at home (58% very well, 18% well, 17% not well, 7% not at all).
3.8% of residents speak other Indo-European language at home (71% very well, 17% well, 12% not well).
7.1% of residents speak Asian or Pacific Island language at home (55% very well, 19% well, 23% not well, 3% not at all).
2.2% of residents speak other language at home (55% very well, 41% well, 3% not well).
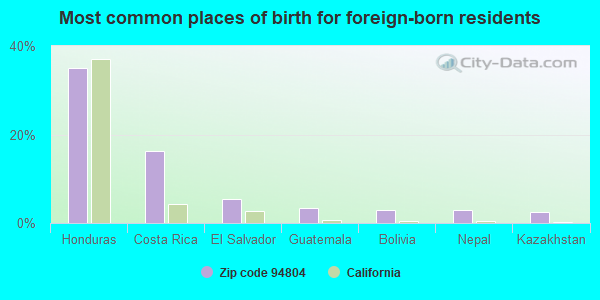
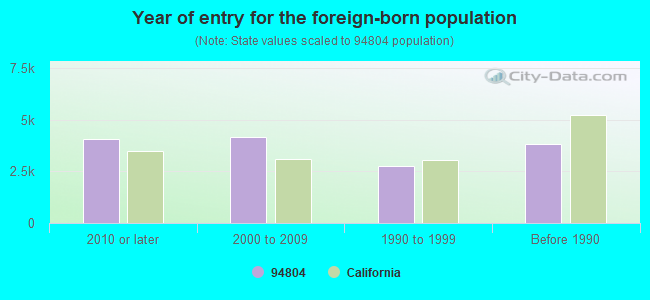
Foreign born population: 14,031 (31.9%) (44.3% of them are naturalized citizens)
Major facilities with environmental interests located in this zip code:
CHEVRON CHEMICAL COMPANY (940 HENSLEY ST. in RICHMOND, CA)
OIL CONTROL (Facility Response Plan for oil discharge) STATE MASTER (California - Hazardous Waste Tracking) - HAZARDOU WASTE PROGRAM COMPLIANCE ACTIVITY (Tracking inspections of insecticide, fungicide, and rodenticide, and toxic substances) CRITERIA AND HAZARDOUS AIR POLLUTANT INVENTORY (Inventory of air pollution sources) HAZARDOUS WASTE BIENNIAL REPORTER (Resource Conservation and Recovery Act (tracking hazardous waste)) - ICIS-, ENFORCEMENT/COMPLIANCE ACTIVITY Large Quantity Generators, more that 1000 kg of hazardous waste/month (Resource Conservation and Recovery Act (tracking hazardous waste)) - ICIS-, ENFORCEMENT/COMPLIANCE ACTIVITY TSD (Resource Conservation and Recovery Act (tracking hazardous waste)) - notification - ICIS-, ENFORCEMENT/COMPLIANCE ACTIVITY HAZARDOUS WASTE BIENNIAL REPORTER (Resource Conservation and Recovery Act (tracking hazardous waste)) Large Quantity Generators, more that 1000 kg of hazardous waste/month (Resource Conservation and Recovery Act (tracking hazardous waste)) - notification TRI REPORTER (Tracking of toxic chemicals releasing facilities) Business SIC classification: PESTICIDES AND AGRICULTURAL CHEMICALS; CHEMICALS AND CHEMICAL PREPARATIONS; INSTRUMENTS FOR MEASURING AND TESTING OF ELECTRICITY AND ELECTRICAL SIGNALS; REFUSE SYSTEMS Business NAICS classification: SOLID WASTE LANDFILL.; APPRENTICESHIP TRAINING. Organizations: CHEVRON U.S.A. INC. (CONTACT/OPERATOR)
Alternative names: CHEVRON CHEMICAL CO (ORTHO DIV), CHEVRON CHEMICAL CO. ORTHO PILOT PLANT, CHEVRON CHEMICAL PLANT, CHEVRON ENVIRONMENTAL LAB, CHEVRON U.S.A., INC. ENVT'L LABORATORY, RICHMOND PLANT - CHEVRON CHEMICAL COMPANY
LOS ANGELES CHEMICAL COMPANY LLC (860 WHARF STREET in RICHMOND, CA)
STATE MASTER (California - Hazardous Waste Tracking) - HAZARDOU WASTE PROGRAM COMPLIANCE ACTIVITY (Tracking inspections of insecticide, fungicide, and rodenticide, and toxic substances) CRITERIA AND HAZARDOUS AIR POLLUTANT INVENTORY (Inventory of air pollution sources) HAZARDOUS WASTE BIENNIAL REPORTER (Resource Conservation and Recovery Act (tracking hazardous waste)) - ICIS-, ENFORCEMENT/COMPLIANCE ACTIVITY Large Quantity Generators, more that 1000 kg of hazardous waste/month (Resource Conservation and Recovery Act (tracking hazardous waste)) - ICIS-, ENFORCEMENT/COMPLIANCE ACTIVITY TRANSPORTER (Resource Conservation and Recovery Act (tracking hazardous waste)) - ICIS-, ENFORCEMENT/COMPLIANCE ACTIVITY TSD (Resource Conservation and Recovery Act (tracking hazardous waste)) - ICIS-, ENFORCEMENT/COMPLIANCE ACTIVITY TRI REPORTER (Tracking of toxic chemicals releasing facilities) Business SIC classification: CHEMICALS AND ALLIED PRODUCTS Organizations: MARILYN TREACY (CONTACT/OPERATOR)
, DAVID MILLER (CONTACT/OWNER)
Alternative names: BAY AREA CHEMICAL (DBA LOS ANGELES CHEMICAL CO), GREAT WESTERN CHEMICAL COMPANY, GREAT WESTERN CHEMICAL CO. (DBA GW INTL. ), GREAT WESTERN CHEMICAL CO. - RICHMOND, LOS ANGELES CHEMICAL L L C, LOS ANGELES CHEMICAL LLC
CHEVRON NO 90103 (901 WEST CUTTING BOULEVARD in RICHMOND, CA)
STATE MASTER (California - Hazardous Waste Tracking) - HAZARDOU WASTE PROGRAM HAZARDOUS WASTE BIENNIAL REPORTER (Resource Conservation and Recovery Act (tracking hazardous waste)) Large Quantity Generators, more that 1000 kg of hazardous waste/month (Resource Conservation and Recovery Act (tracking hazardous waste)) Large Quantity Generators, more that 1000 kg of hazardous waste/month (Resource Conservation and Recovery Act (tracking hazardous waste)) Large Quantity Generators, more that 1000 kg of hazardous waste/month (Resource Conservation and Recovery Act (tracking hazardous waste)) Organizations: CHEVRON STATIONS INC. (CONTACT/OPERATOR)
, CHEVRON PRODUCTS CO (CONTACT/OWNER)
, CHEVRON PRODUCTS CO. (CONTACT/OWNER)
Alternative names: CHEVRON 90103, CHEVRON STATION 90103, CHEVRON STATION #90103
KINDER MORGAN LIQUIDS TERMINALS LLC (1140 CANAL BOULEVARD in RICHMOND, CA)
OIL CONTROL (Facility Response Plan for oil discharge) STATE MASTER (California - Hazardous Waste Tracking) - HAZARDOU WASTE PROGRAM CRITERIA AND HAZARDOUS AIR POLLUTANT INVENTORY (Inventory of air pollution sources) Large Quantity Generators, more that 1000 kg of hazardous waste/month (Resource Conservation and Recovery Act (tracking hazardous waste)) Business SIC classification: SPECIAL WAREHOUSING AND STORAGE; PETROLEUM BULK STATIONS AND TERMINALS Organizations: GATX (CONTACT/GENERAL)
Alternative names: GATX RICHMOND TERMINAL, KINDER MORGAN LIQUID TERMINALS LLC, PPG/GATX TERMINALS CORPORATION, RICHMOND PLANT
CALIFORNIA OILS CORPORATION (1145 HARBOUR WAY S. in RICHMOND, CA)
OIL CONTROL (Facility Response Plan for oil discharge) STATE MASTER (California - Hazardous Waste Tracking) - HAZARDOU WASTE PROGRAM CRITERIA AND HAZARDOUS AIR POLLUTANT INVENTORY (Inventory of air pollution sources) HAZARDOUS WASTE BIENNIAL REPORTER (Resource Conservation and Recovery Act (tracking hazardous waste)) Large Quantity Generators, more that 1000 kg of hazardous waste/month (Resource Conservation and Recovery Act (tracking hazardous waste)) TRI REPORTER (Tracking of toxic chemicals releasing facilities) Business SIC classification: VEGETABLE OIL MILLS, EXCEPT CORN, COTTONSEED, AND SOYBEAN; SHORTENING, TABLE OILS, MARGARINE, AND OTHER EDIBLE FATS AND OILS Business NAICS classification: FATS AND OILS REFINING AND BLENDING. Organizations: CALIFORNIA OIL CORP. (CONTACT/GENERAL)
CASTROL N A INCORPORATED (801 WHARF ST. in RICHMOND, CA)
OIL CONTROL (Facility Response Plan for oil discharge) STATE MASTER (California - Hazardous Waste Tracking) - HAZARDOU WASTE PROGRAM Small Quantity Generators, between 100 kg and 1000 kg of hazardous waste/month (Resource Conservation and Recovery Act (tracking hazardous waste)) - notification TRI REPORTER (Tracking of toxic chemicals releasing facilities) Business SIC classification: LUBRICATING OILS AND GREASES Organizations: CASTROL NORTH AMERICA (CONTACT/GENERAL)
, BP LUBRICANTS USA INC (CONTACT/OPERATOR)
Alternative names: BP LUBRICANTS USA INC, CASTROL NORTH AMERICA INC, CASTROL RICHMOND PLANT
MIRACLE AUTO PAINTING (5327 JACUZZI STREET in RICHMOND, CA)
STATE MASTER (California - Hazardous Waste Tracking) - HAZARDOU WASTE PROGRAM CRITERIA AND HAZARDOUS AIR POLLUTANT INVENTORY (Inventory of air pollution sources) Small Quantity Generators, between 100 kg and 1000 kg of hazardous waste/month (Resource Conservation and Recovery Act (tracking hazardous waste)) - notification Business SIC classification: TOP, BODY, AND UPHOLSTERY REPAIR SHOPS AND PAINT SHOPS Business NAICS classification: AUTOMOTIVE BODY, PAINT, AND INTERIOR REPAIR AND MAINTENANCE. Organizations: RAYMOND CLEMOS (CONTACT/OWNER)
CA DEPT HEALTH SVC LABS RICHMOND CAMPUS (850 MARINA BAY PKWY in RICHMOND, CA)
STATE MASTER (California - Hazardous Waste Tracking) - HAZARDOU WASTE PROGRAM Small Quantity Generators, between 100 kg and 1000 kg of hazardous waste/month (Resource Conservation and Recovery Act (tracking hazardous waste)) - notification Organizations: GARY GASCOIGNE (CONTACT/OPERATOR)
, STATE OF CALIFORNIA (CONTACT/OWNER)
Alternative names: CALIFORNIA D P T HEALTH SERVICES
EBERLINE SERVICES (2030 WRIGHT AVE in RICHMOND, CA)
STATE MASTER (California - Hazardous Waste Tracking) - HAZARDOU WASTE PROGRAM Small Quantity Generators, between 100 kg and 1000 kg of hazardous waste/month (Resource Conservation and Recovery Act (tracking hazardous waste)) - notification Organizations: GLENROSE PARTNERSHIP LP (CONTACT/OWNER)
Alternative names: A E L CORP
LEVIN RICHMOND TERMINAL CORPOR (402 WRIGHT AVENUE in RICHMOND, CA)
STATE MASTER (California - Hazardous Waste Tracking) - HAZARDOU WASTE PROGRAM CRITERIA AND HAZARDOUS AIR POLLUTANT INVENTORY (Inventory of air pollution sources) Small Quantity Generators, between 100 kg and 1000 kg of hazardous waste/month (Resource Conservation and Recovery Act (tracking hazardous waste)) Business SIC classification: MARINE CARGO HANDLING
EQUILON ENTERPRISES LLC (831 23RD ST/GAYNOR in RICHMOND, CA) . Federal Facility
STATE MASTER (California - Hazardous Waste Tracking) - HAZARDOU WASTE PROGRAM Small Quantity Generators, between 100 kg and 1000 kg of hazardous waste/month (Resource Conservation and Recovery Act (tracking hazardous waste)) - notification Organizations: EQUILON ENTERPRISES, LLC (CONTACT/OWNER)
Alternative names: SHELL OIL CO
MARINE SPILL RESPONSE CORP (1314 CANAL BLVD in RICHMOND, CA)
STATE MASTER (California - Hazardous Waste Tracking) - HAZARDOU WASTE PROGRAM Small Quantity Generators, between 100 kg and 1000 kg of hazardous waste/month (Resource Conservation and Recovery Act (tracking hazardous waste)) - notification
FORD ELEMENTARY (2711 MARACOPA AVE. in RICHMOND, CA)
(National Center for Education Statistics) - STATE ID-6004766 Organizations: WEST CONTRA COSTA UNIFIED (SCHOOL DISTRICT)
Housing units lacking complete plumbing facilities: 0.5% Housing units lacking complete kitchen facilities: 0.8%
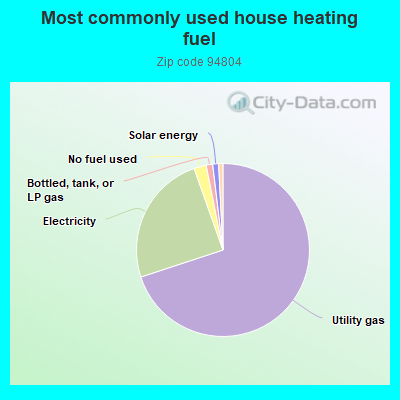
69.8%Utility gas
24.6%Electricity
2.3%No fuel used
1.2%Bottled, tank, or LP gas
1.1%Solar energy
0.8%Other fuel
Population in 1990: 33,990. Population change in the 1990s: +5,090 (+15.0%).
Place of birth for U.S.-born residents:
This state: 23,064
Northeast: 1,439
Midwest: 1,182
South: 2,697
West: 988
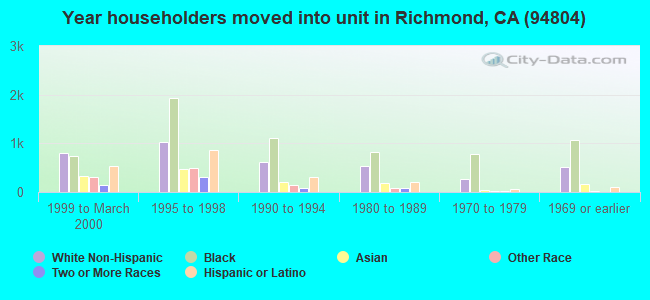
53% of the 94804 zip code residents lived in the same house 5 years ago. Out of people who lived in different houses, 49% lived in this county. Out of people who lived in different counties, 50% lived in California.
90% of the 94804 zip code residents lived in the same house 1 year ago. Out of people who lived in different houses, 41% moved from this county. Out of people who lived in different houses, 50% moved from different county within same state. Out of people who lived in different houses, 6% moved from different state. Out of people who lived in different houses, 3% moved from abroad.
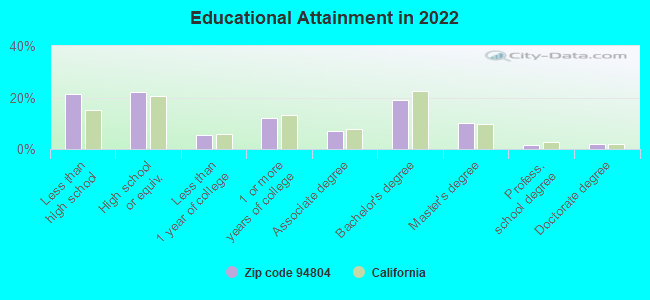
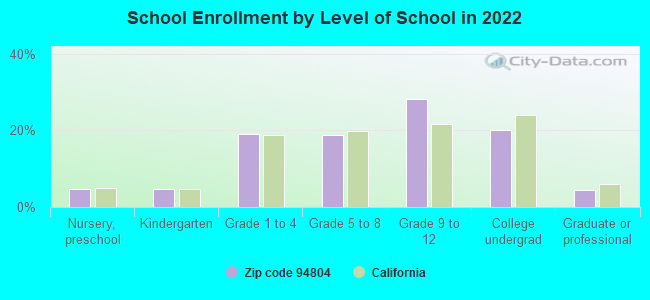
Private vs. public school enrollment:
Students in private schools in grades 1 to 8 (elementary and middle school): 179
Here:
4.5%
California:
10.5%
Students in private schools in grades 9 to 12 (high school): 317
Here:
10.6%
California:
8.5%
Students in private undergraduate colleges: 151
Here:
7.1%
California:
15.9%
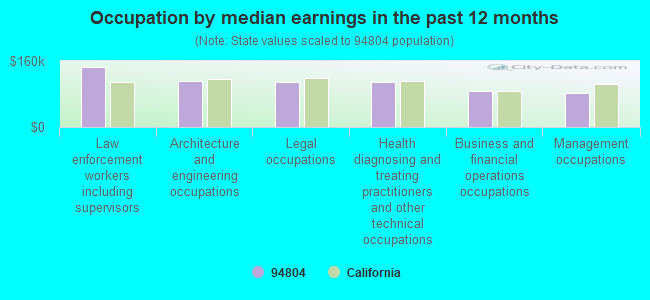
Occupation by median earnings in the past 12 months ($)
146,490Law enforcement workers including supervisors
112,321Architecture and engineering occupations
109,497Legal occupations
109,330Health diagnosing and treating practitioners and other technical occupations
87,005Business and financial operations occupations
82,361Management occupations
Companies with biggest federal contracts located in this zip code (RICHMOND, CA):
BERKELEY RESEARCH ASSOCIATES, (5327 JACUZZI STREET, BLDG; small business) : $14,402,739 in 70 contractsfrom 1999 to 2006
Contracts for Other Defense -- Applied Research and Exploratory Development (R&D), Other Defense -- Management and Support (R&D), Other Defense -- Advanced Development (R&D), Engineering -- Applied Research and Exploratory Development (R&D), and moreby Navy, Army, Department of Defense, National Institute of Standards and Technology, and others Signed by year:2000: $2,094,052; 2001: $1,154,600; 2002: $1,579,500; 2003: $2,584,829; 2004: $2,966,649; 2005: $1,801,804; 2006: $707,305.
Biggest contracts:
$1,444,000 with Navy for Other Defense -- Applied Research and Exploratory Development (R&D). Signed on 1999-12-09. Completion date: 2000-04-30.
$800,000 with Army for Other Defense -- Management and Support (R&D). Taking place in MD. Signed on 2004-09-21. Completion date: 2006-09-21.
$773,000 with Army for Other Defense -- Applied Research and Exploratory Development (R&D). Taking place in VA. Signed on 2003-02-21. Completion date: 2002-12-31.
$727,800, same as above.Signed on 2003-04-24. Completion date: 2004-02-20.
RUBICON PROGRAMS INCORPORATED (154 S 23RD STREET) : $6,040,735 in 16 contractsfrom 1999 to 2006
Contracts for Landscaping/Groundskeeping Services by Department of Veterans Affairs, Army, Navy Signed by year:2000: $1,029,000; 2001: $0; 2002: $1,618,613; 2003: $1,106,723; 2004: $1,187,716; 2005: $97,707; 2006: $69,976.
Biggest contracts:
$1,080,613 with Department of Veterans Affairs for Landscaping/Groundskeeping Services. Signed on 2004-10-01. Completion date: 2005-09-30.
$1,080,613, same as above.Signed on 2002-10-01. Completion date: 2005-09-30.
$1,035,886, same as above.Signed on 2003-01-15. Completion date: 2003-09-15.
$1,029,000, same as above.Signed on 2000-10-15. Completion date: 2001-09-15.
CALIFORNIA DEPARTMENT OF HEALT (850 MARINA BAY PARKWAY) : $780,859 in 16 contractsfrom 1999 to 2006
Contracts for Geriatric (Other Than Medical) -- Applied Research and Exploratory Development (R&D), Laboratory Testing Services, Certifications and Accreditations for products and institutions other than educational institutions, Other Quality Control, Testing and Inspection Services -- Instruments and Laboratory Equipment by Centers for Disease Control and Prevention, Air Force, Army Signed by year:2000: $0; 2001: $0; 2002: $19,800; 2003: $127,000; 2004: $606,048; 2005: $0; 2006: $2,811.
Biggest contracts:
$200,024 with Centers for Disease Control and Prevention for Geriatric (Other Than Medical) -- Applied Research and Exploratory Development (R&D). Signed on 2004-11-02. Completion date: 2005-11-02.
$200,024, same as above.Signed on 2004-11-02. Completion date: 2005-11-02.
$200,000, same as above.Signed on 2004-01-20. Completion date: 2011-09-13.
$39,000, same as above.Signed on 2003-06-15. Completion date: 2011-09-15.
STRATACOR, INC (1315 S 46TH STREET, BLDG; small business) : $148,273 in 2 contractsfrom 2000 to 2001
$77,277 with Army for Operations Research and Quantitative Analysis Services. Signed on 2000-06-01. Completion date: 2001-06-01.
$70,996 with Army for Soil Studies. Signed on 2001-09-07. Completion date: 2002-03-31.
SIMS GROUP USA CORPORATION (600 S 4TH ST) : $54,080 in 2 contractsfrom 2003 to 2005
$44,280 with Navy for Plate, Sheet, Strip, Foil; and Leaf. Taking place in VA. Signed on 2003-02-12. Completion date: 2003-03-26.
$9,800 with Navy for Bars and Rods, Nonferrous Base Metal. Taking place in VA. Signed on 2005-03-16. Completion date: 2005-03-31.
FIRSTENBERG MACHINERY CO, INC (867 S 19TH ST; small business)
$39,500 with Army for Laboratory Equipment and Supplies. Signed on 2005-06-13. Completion date: 2005-06-16.
ARGOSY EDUCATION GROUP INC (999 CANAL BLVD) : $37,560 in 5 contractsfrom 2005 to 2006
Contracts for Educational Services by Army Signed by year:2000: $0; 2001: $0; 2002: $0; 2003: $0; 2004: $0; 2005: $19,760; 2006: $17,800.
Biggest contracts:
$13,010 with Army for Educational Services. Signed on 2005-09-26. Completion date: 2005-09-30.
$13,000, same as above.Signed on 2006-02-21. Completion date: 2006-09-29.
$6,750, same as above.Signed on 2005-07-12. Completion date: 2005-09-30.
$4,800, same as above.Signed on 2006-05-26. Completion date: 2006-09-30.
PARADISE PRODUCTS INC (3117 PIERCE ST; small business) : $20,165 in 6 contractsfrom 2004 to 2005
Contracts for Flags and Pennants, Office Supplies, Kitchen Hand Tools and Utensils by Army, Department of State Signed by year:2000: $0; 2001: $0; 2002: $0; 2003: $0; 2004: $1,482; 2005: $18,683; 2006: $0.
Biggest contracts:
$8,272 with Army for Flags and Pennants. Signed on 2005-01-05. Completion date: 2005-01-21.
$5,000 with Department of State for Office Supplies. Signed on 2005-04-04. Completion date: 2005-06-30.
$3,179, same as above.Signed on 2005-02-11. Completion date: 2005-02-11.
$2,562, same as above.Signed on 2005-02-16. Completion date: 2005-04-16.
$9,850 with Army for Iron and Steel Primary and Semifinished Products. Signed on 2005-09-30. Completion date: 2005-11-01.
$9,850 with U.S. Army Corps of Engineers - civil program financing only for Iron and Steel Primary and Semifinished Products. Signed on 2005-09-30. Completion date: 2005-11-01.
BAY MACHINERY CORPORATION (543 S 8TH ST; small business) : $15,730 in 2 contractsfrom 2004 to 2005
$10,230 with Navy for Earth Moving and Excavating Equipment. Signed on 2005-06-30. Completion date: 2005-07-08.
$5,500 with Navy for Lease or Rental of Equipment -- Construction, Mining, Excavating, and Highway Maintenance Equipment. Signed on 2004-10-07. Completion date: 2004-10-07.
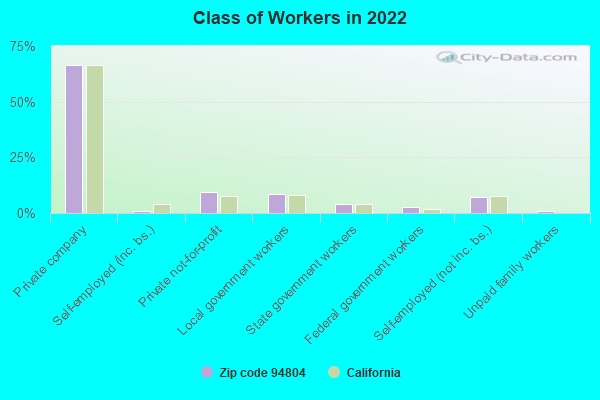
Top industries in this zip code by the number of employees in 2005:
Information: Motion Picture and Video Production (500-999 employees: 1 establishment)
Professional, Scientific, and Technical Services: Research and Development in the Physical, Engineering, and Life Sciences (250-499: 1, 50-99: 1, 20-49: 1, 10-19: 3, 5-9: 2, 1-4: 5)
Administrative and Support and Waste Management and Remediation Services: Janitorial Services (250-499: 1, 5-9: 1, 1-4: 8)
Educational Services: Exam Preparation and Tutoring (250-499: 1)
Health Care and Social Assistance: Offices of Physicians (except Mental Health Specialists) (100-249: 2, 10-19: 1, 5-9: 2, 1-4: 3)
Health Care and Social Assistance: Vocational Rehabilitation Services (100-249: 2, 20-49: 1)
Information: Data Processing, Hosting, and Related Services (100-249: 2)
Construction: Commercial and Institutional Building Construction (100-249: 1, 20-49: 1, 10-19: 2, 5-9: 1, 1-4: 1)
People in group quarters in 2010:
77 people in nursing facilities/skilled-nursing facilities
49 people in residential treatment centers for adults
32 people in workers' group living quarters and job corps centers
30 people in other noninstitutional facilities
28 people in group homes intended for adults
12 people in group homes for juveniles (non-correctional)
People in group quarters in 2000:
85 people in other noninstitutional group quarters
81 people in nursing homes
27 people in homes for the mentally retarded
25 people in hospitals or wards for drug/alcohol abuse
19 people in homes for the physically handicapped
12 people in homes for the mentally ill
10 people in schools, hospitals, or wards for the intellectually disabled
7 people in homes for abused, dependent, and neglected children
2 people in religious group quarters
Fatal accident statistics in 2013:
Fatal accident count: 4
Vehicles involved in fatal accidents: 7
Fatal accidents caused by drunken drivers: 2
Fatalities: 4
Persons involved in fatal accidents: 8
Pedestrians involved in fatal accidents: 1
Fatal accident statistics in 2012:
Fatal accident count: 3
Vehicles involved in fatal accidents: 6
Fatal accidents caused by drunken drivers: 0
Fatalities: 3
Persons involved in fatal accidents: 8
Pedestrians involved in fatal accidents: 1
Home Mortgage Disclosure Act Aggregated Statistics For Year 2009 (Based on 6 full and 10 partial tracts)
A) FHA, FSA/RHS & VA Home Purchase Loans
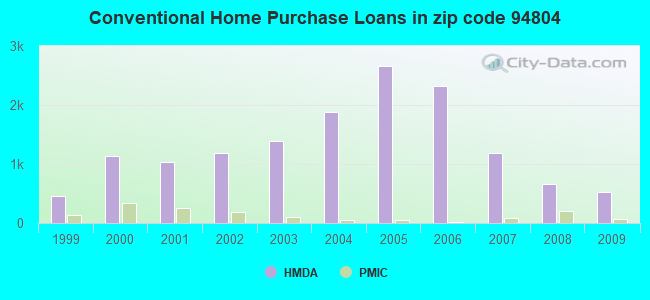
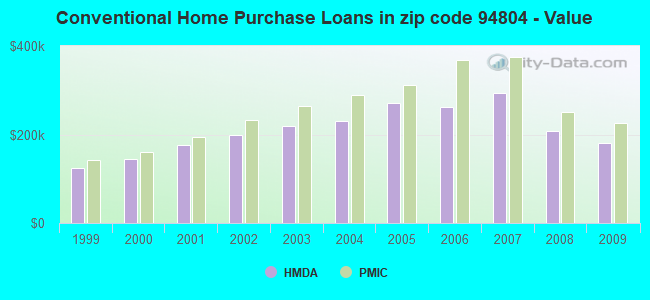
B) Conventional Home Purchase Loans
C) Refinancings
D) Home Improvement Loans
E) Loans on Dwellings For 5+ Families
F) Non-occupant Loans on < 5 Family Dwellings (A B C & D)
G) Loans On Manufactured Home Dwelling (A B C & D)
Number
Average Value
Number
Average Value
Number
Average Value
Number
Average Value
Number
Average Value
Number
Average Value
Number
Average Value
LOANS ORIGINATED
296
$214,966
517
$180,274
581
$221,495
48
$140,477
2
$696,325
174
$147,548
2
$137,000
APPLICATIONS APPROVED, NOT ACCEPTED
43
$211,186
122
$156,046
104
$241,374
18
$101,513
0
$0
49
$113,585
0
$0
APPLICATIONS DENIED
84
$186,183
198
$152,908
573
$237,230
44
$65,084
2
$273,085
148
$158,723
0
$0
APPLICATIONS WITHDRAWN
42
$177,344
101
$160,163
181
$239,782
14
$123,959
0
$0
52
$125,211
0
$0
FILES CLOSED FOR INCOMPLETENESS
17
$182,861
22
$191,862
102
$201,562
9
$39,413
0
$0
14
$184,707
0
$0
Aggregated Statistics For Year 2008 (Based on 6 full and 10 partial tracts)
A) FHA, FSA/RHS & VA Home Purchase Loans
B) Conventional Home Purchase Loans
C) Refinancings
D) Home Improvement Loans
E) Loans on Dwellings For 5+ Families
F) Non-occupant Loans on < 5 Family Dwellings (A B C & D)
G) Loans On Manufactured Home Dwelling (A B C & D)
Number
Average Value
Number
Average Value
Number
Average Value
Number
Average Value
Number
Average Value
Number
Average Value
Number
Average Value
LOANS ORIGINATED
143
$219,824
667
$207,446
423
$250,641
62
$124,491
6
$756,995
262
$177,056
0
$0
APPLICATIONS APPROVED, NOT ACCEPTED
19
$338,541
152
$257,544
189
$276,505
19
$109,408
2
$770,895
47
$195,463
0
$0
APPLICATIONS DENIED
37
$235,261
208
$217,494
773
$292,188
126
$170,282
5
$468,542
166
$231,814
2
$271,375
APPLICATIONS WITHDRAWN
35
$274,689
92
$240,605
224
$287,897
16
$182,342
0
$0
53
$229,612
0
$0
FILES CLOSED FOR INCOMPLETENESS
13
$205,862
42
$285,010
85
$273,524
11
$25,095
2
$918,870
20
$207,054
1
$354,470
Aggregated Statistics For Year 2007 (Based on 6 full and 10 partial tracts)
A) FHA, FSA/RHS & VA Home Purchase Loans
B) Conventional Home Purchase Loans
C) Refinancings
D) Home Improvement Loans
E) Loans on Dwellings For 5+ Families
F) Non-occupant Loans on < 5 Family Dwellings (A B C & D)
G) Loans On Manufactured Home Dwelling (A B C & D)
Number
Average Value
Number
Average Value
Number
Average Value
Number
Average Value
Number
Average Value
Number
Average Value
Number
Average Value
LOANS ORIGINATED
0
$0
1,182
$293,692
1,841
$294,214
281
$202,634
21
$7,142,651
437
$307,241
2
$182,145
APPLICATIONS APPROVED, NOT ACCEPTED
4
$315,320
313
$290,651
514
$300,421
77
$229,826
2
$1,492,050
94
$299,339
0
$0
APPLICATIONS DENIED
2
$301,550
731
$304,101
1,631
$329,352
320
$157,770
2
$831,050
288
$320,785
5
$172,374
APPLICATIONS WITHDRAWN
0
$0
201
$325,004
613
$314,757
57
$177,743
8
$1,392,489
95
$310,592
2
$179,585
FILES CLOSED FOR INCOMPLETENESS
0
$0
87
$322,693
238
$336,637
23
$214,325
0
$0
39
$312,775
0
$0
Aggregated Statistics For Year 2006 (Based on 6 full and 10 partial tracts)
A) FHA, FSA/RHS & VA Home Purchase Loans
B) Conventional Home Purchase Loans
C) Refinancings
D) Home Improvement Loans
E) Loans on Dwellings For 5+ Families
F) Non-occupant Loans on < 5 Family Dwellings (A B C & D)
G) Loans On Manufactured Home Dwelling (A B C & D)
Number
Average Value
Number
Average Value
Number
Average Value
Number
Average Value
Number
Average Value
Number
Average Value
Number
Average Value
LOANS ORIGINATED
2
$295,285
2,324
$261,409
2,762
$294,011
420
$230,467
16
$2,424,438
595
$297,001
6
$88,338
APPLICATIONS APPROVED, NOT ACCEPTED
0
$0
624
$244,493
757
$289,569
86
$212,161
0
$0
172
$284,274
0
$0
APPLICATIONS DENIED
0
$0
1,056
$271,861
1,671
$315,348
395
$214,330
6
$354,082
343
$315,926
6
$209,213
APPLICATIONS WITHDRAWN
2
$373,000
447
$269,494
906
$305,861
101
$224,387
6
$953,087
133
$309,565
2
$235,905
FILES CLOSED FOR INCOMPLETENESS
0
$0
121
$274,965
300
$309,225
26
$211,850
2
$1,117,525
56
$322,478
0
$0
Aggregated Statistics For Year 2005 (Based on 6 full and 10 partial tracts)
A) FHA, FSA/RHS & VA Home Purchase Loans
B) Conventional Home Purchase Loans
C) Refinancings
D) Home Improvement Loans
E) Loans on Dwellings For 5+ Families
F) Non-occupant Loans on < 5 Family Dwellings (A B C & D)
G) Loans On Manufactured Home Dwelling (A B C & D)
Number
Average Value
Number
Average Value
Number
Average Value
Number
Average Value
Number
Average Value
Number
Average Value
Number
Average Value
LOANS ORIGINATED
1
$348,460
2,655
$270,864
3,127
$280,280
424
$230,379
19
$1,522,574
764
$282,667
3
$236,960
APPLICATIONS APPROVED, NOT ACCEPTED
0
$0
504
$247,295
585
$281,055
82
$215,101
2
$596,820
140
$282,953
0
$0
APPLICATIONS DENIED
0
$0
927
$256,285
1,627
$275,026
318
$182,263
6
$594,880
276
$273,835
6
$264,807
APPLICATIONS WITHDRAWN
0
$0
541
$276,707
1,126
$276,932
158
$212,414
0
$0
218
$292,053
5
$307,172
FILES CLOSED FOR INCOMPLETENESS
0
$0
110
$261,570
387
$291,025
17
$210,229
0
$0
60
$287,686
0
$0
Aggregated Statistics For Year 2004 (Based on 6 full and 10 partial tracts)
A) FHA, FSA/RHS & VA Home Purchase Loans
B) Conventional Home Purchase Loans
C) Refinancings
D) Home Improvement Loans
E) Loans on Dwellings For 5+ Families
F) Non-occupant Loans on < 5 Family Dwellings (A B C & D)
G) Loans On Manufactured Home Dwelling (A B C & D)
Number
Average Value
Number
Average Value
Number
Average Value
Number
Average Value
Number
Average Value
Number
Average Value
Number
Average Value
LOANS ORIGINATED
0
$0
1,877
$230,514
3,405
$235,966
348
$182,205
41
$640,139
697
$249,738
4
$206,400
APPLICATIONS APPROVED, NOT ACCEPTED
1
$301,600
370
$237,516
679
$237,471
47
$139,466
0
$0
110
$251,722
0
$0
APPLICATIONS DENIED
2
$293,435
702
$217,491
1,891
$243,680
277
$150,591
7
$631,989
308
$238,013
6
$152,297
APPLICATIONS WITHDRAWN
2
$243,000
291
$226,576
1,155
$231,215
95
$160,104
2
$1,033,945
129
$231,954
0
$0
FILES CLOSED FOR INCOMPLETENESS
0
$0
62
$252,894
423
$250,762
15
$177,167
2
$577,465
63
$242,703
0
$0
Aggregated Statistics For Year 2003 (Based on 6 full and 10 partial tracts)
A) FHA, FSA/RHS & VA Home Purchase Loans
B) Conventional Home Purchase Loans
C) Refinancings
D) Home Improvement Loans
E) Loans on Dwellings For 5+ Families
F) Non-occupant Loans on < 5 Family Dwellings (A B C & D)
Number
Average Value
Number
Average Value
Number
Average Value
Number
Average Value
Number
Average Value
Number
Average Value
LOANS ORIGINATED
48
$266,924
1,391
$219,698
5,093
$195,797
117
$68,461
12
$1,051,722
765
$191,855
APPLICATIONS APPROVED, NOT ACCEPTED
10
$123,674
218
$229,393
877
$196,181
29
$49,361
0
$0
117
$205,967
APPLICATIONS DENIED
10
$388,886
392
$217,297
1,614
$203,084
133
$40,937
9
$530,942
234
$217,787
APPLICATIONS WITHDRAWN
10
$209,370
213
$213,144
1,516
$185,540
31
$54,130
6
$844,580
132
$181,479
FILES CLOSED FOR INCOMPLETENESS
0
$0
58
$216,078
252
$201,308
5
$25,204
2
$280,840
32
$174,427
Aggregated Statistics For Year 2002 (Based on 6 full and 10 partial tracts)
A) FHA, FSA/RHS & VA Home Purchase Loans
B) Conventional Home Purchase Loans
C) Refinancings
D) Home Improvement Loans
E) Loans on Dwellings For 5+ Families
F) Non-occupant Loans on < 5 Family Dwellings (A B C & D)
Number
Average Value
Number
Average Value
Number
Average Value
Number
Average Value
Number
Average Value
Number
Average Value
LOANS ORIGINATED
82
$211,882
1,193
$198,479
3,662
$181,000
104
$74,060
28
$757,201
594
$191,301
APPLICATIONS APPROVED, NOT ACCEPTED
20
$86,889
188
$198,285
694
$168,105
37
$47,845
0
$0
70
$202,639
APPLICATIONS DENIED
15
$145,503
319
$174,053
1,168
$171,448
108
$42,956
10
$618,076
205
$199,972
APPLICATIONS WITHDRAWN
6
$260,462
144
$181,073
1,154
$169,683
42
$55,777
0
$0
122
$161,933
FILES CLOSED FOR INCOMPLETENESS
0
$0
48
$183,241
253
$178,450
3
$58,053
0
$0
27
$144,171
Aggregated Statistics For Year 2001 (Based on 6 full and 10 partial tracts)
A) FHA, FSA/RHS & VA Home Purchase Loans
B) Conventional Home Purchase Loans
C) Refinancings
D) Home Improvement Loans
E) Loans on Dwellings For 5+ Families
F) Non-occupant Loans on < 5 Family Dwellings (A B C & D)
Number
Average Value
Number
Average Value
Number
Average Value
Number
Average Value
Number
Average Value
Number
Average Value
LOANS ORIGINATED
126
$210,269
1,042
$175,454
3,002
$163,377
139
$37,775
18
$566,872
546
$156,567
APPLICATIONS APPROVED, NOT ACCEPTED
9
$161,753
154
$185,698
481
$152,234
32
$41,836
0
$0
99
$156,122
APPLICATIONS DENIED
18
$288,121
306
$156,065
1,082
$151,887
148
$27,692
0
$0
152
$170,801
APPLICATIONS WITHDRAWN
19
$198,677
183
$170,621
879
$137,919
54
$57,356
0
$0
111
$136,836
FILES CLOSED FOR INCOMPLETENESS
6
$129,110
45
$128,868
234
$149,298
6
$48,298
3
$1,004,750
23
$111,360
Aggregated Statistics For Year 2000 (Based on 6 full and 10 partial tracts)
A) FHA, FSA/RHS & VA Home Purchase Loans
B) Conventional Home Purchase Loans
C) Refinancings
D) Home Improvement Loans
E) Loans on Dwellings For 5+ Families
F) Non-occupant Loans on < 5 Family Dwellings (A B C & D)
Number
Average Value
Number
Average Value
Number
Average Value
Number
Average Value
Number
Average Value
Number
Average Value
LOANS ORIGINATED
225
$155,965
1,144
$144,064
1,006
$124,212
133
$34,633
15
$333,415
295
$124,570
APPLICATIONS APPROVED, NOT ACCEPTED
29
$130,894
146
$128,781
258
$114,008
71
$30,052
2
$132,395
36
$134,328
APPLICATIONS DENIED
46
$141,345
446
$138,105
793
$109,148
157
$34,639
4
$161,565
145
$129,139
APPLICATIONS WITHDRAWN
12
$140,862
205
$144,531
481
$111,830
23
$26,453
2
$336,105
59
$127,737
FILES CLOSED FOR INCOMPLETENESS
7
$171,420
44
$126,136
233
$117,210
3
$31,467
4
$523,503
28
$120,865
Aggregated Statistics For Year 1999 (Based on 3 full and 6 partial tracts)
A) FHA, FSA/RHS & VA Home Purchase Loans
B) Conventional Home Purchase Loans
C) Refinancings
D) Home Improvement Loans
E) Loans on Dwellings For 5+ Families
F) Non-occupant Loans on < 5 Family Dwellings (A B C & D)
2005 - 2018 National Fire Incident Reporting System (NFIRS) incidents
Based on the data from the years 2005 - 2018 the average number of fire incidents per year is 122. The highest number of fire incidents - 306 took place in 2005, and the least - 19 in 2016. The data has a declining trend.
When looking into fire subcategories, the most reports belonged to: Structure Fires (43.9%), and Outside Fires (33.7%).
Fire incident types reported to NFIRS in Zip Code 94804


 Nearest zip codes: 94850, 94805, 94530, 94706, 94801, 94710.


 Based on the data from the years 2005 - 2018 the average number of fire incidents per year is 122. The highest number of fire incidents - 306 took place in 2005, and the least - 19 in 2016. The data has a declining trend.
 When looking into fire subcategories, the most reports belonged to: Structure Fires (43.9%), and Outside Fires (33.7%).