Livermore, California Submit your own pictures of this city and show them to the world
OSM Map
General Map
Google Map
MSN Map
OSM Map
General Map
Google Map
MSN Map
OSM Map
General Map
Google Map
MSN Map
OSM Map
General Map
Google Map
MSN Map
Please wait while loading the map...
Population in 2022: 84,701 (100% urban, 0% rural). Population change since 2000: +15.5%Males: 41,816 Females: 42,885
March 2022 cost of living index in Livermore: 121.3 (high, U.S. average is 100) Percentage of residents living in poverty in 2022: 4.3%for White Non-Hispanic residents , 15.1% for Black residents , 6.5% for Hispanic or Latino residents , 12.7% for American Indian residents , 8.4% for Native Hawaiian and other Pacific Islander residents , 12.2% for other race residents , 2.8% for two or more races residents )
Profiles of local businesses
Business Search - 14 Million verified businesses
Data:
Median household income ($)
Median household income (% change since 2000)
Household income diversity
Ratio of average income to average house value (%)
Ratio of average income to average rent
Median household income ($) - White
Median household income ($) - Black or African American
Median household income ($) - Asian
Median household income ($) - Hispanic or Latino
Median household income ($) - American Indian and Alaska Native
Median household income ($) - Multirace
Median household income ($) - Other Race
Median household income for houses/condos with a mortgage ($)
Median household income for apartments without a mortgage ($)
Races - White alone (%)
Races - White alone (% change since 2000)
Races - Black alone (%)
Races - Black alone (% change since 2000)
Races - American Indian alone (%)
Races - American Indian alone (% change since 2000)
Races - Asian alone (%)
Races - Asian alone (% change since 2000)
Races - Hispanic (%)
Races - Hispanic (% change since 2000)
Races - Native Hawaiian and Other Pacific Islander alone (%)
Races - Native Hawaiian and Other Pacific Islander alone (% change since 2000)
Races - Two or more races (%)
Races - Two or more races (% change since 2000)
Races - Other race alone (%)
Races - Other race alone (% change since 2000)
Racial diversity
Unemployment (%)
Unemployment (% change since 2000)
Unemployment (%) - White
Unemployment (%) - Black or African American
Unemployment (%) - Asian
Unemployment (%) - Hispanic or Latino
Unemployment (%) - American Indian and Alaska Native
Unemployment (%) - Multirace
Unemployment (%) - Other Race
Population density (people per square mile)
Population - Males (%)
Population - Females (%)
Population - Males (%) - White
Population - Males (%) - Black or African American
Population - Males (%) - Asian
Population - Males (%) - Hispanic or Latino
Population - Males (%) - American Indian and Alaska Native
Population - Males (%) - Multirace
Population - Males (%) - Other Race
Population - Females (%) - White
Population - Females (%) - Black or African American
Population - Females (%) - Asian
Population - Females (%) - Hispanic or Latino
Population - Females (%) - American Indian and Alaska Native
Population - Females (%) - Multirace
Population - Females (%) - Other Race
Coronavirus confirmed cases (Apr 27, 2024)
Deaths caused by coronavirus (Apr 27, 2024)
Coronavirus confirmed cases (per 100k population) (Apr 27, 2024)
Deaths caused by coronavirus (per 100k population) (Apr 27, 2024)
Daily increase in number of cases (Apr 27, 2024)
Weekly increase in number of cases (Apr 27, 2024)
Cases doubled (in days) (Apr 27, 2024)
Hospitalized patients (Apr 18, 2022)
Negative test results (Apr 18, 2022)
Total test results (Apr 18, 2022)
COVID Vaccine doses distributed (per 100k population) (Sep 19, 2023)
COVID Vaccine doses administered (per 100k population) (Sep 19, 2023)
COVID Vaccine doses distributed (Sep 19, 2023)
COVID Vaccine doses administered (Sep 19, 2023)
Likely homosexual households (%)
Likely homosexual households (% change since 2000)
Likely homosexual households - Lesbian couples (%)
Likely homosexual households - Lesbian couples (% change since 2000)
Likely homosexual households - Gay men (%)
Likely homosexual households - Gay men (% change since 2000)
Cost of living index
Median gross rent ($)
Median contract rent ($)
Median monthly housing costs ($)
Median house or condo value ($)
Median house or condo value ($ change since 2000)
Mean house or condo value by units in structure - 1, detached ($)
Mean house or condo value by units in structure - 1, attached ($)
Mean house or condo value by units in structure - 2 ($)
Mean house or condo value by units in structure by units in structure - 3 or 4 ($)
Mean house or condo value by units in structure - 5 or more ($)
Mean house or condo value by units in structure - Boat, RV, van, etc. ($)
Mean house or condo value by units in structure - Mobile home ($)
Median house or condo value ($) - White
Median house or condo value ($) - Black or African American
Median house or condo value ($) - Asian
Median house or condo value ($) - Hispanic or Latino
Median house or condo value ($) - American Indian and Alaska Native
Median house or condo value ($) - Multirace
Median house or condo value ($) - Other Race
Median resident age
Resident age diversity
Median resident age - Males
Median resident age - Females
Median resident age - White
Median resident age - Black or African American
Median resident age - Asian
Median resident age - Hispanic or Latino
Median resident age - American Indian and Alaska Native
Median resident age - Multirace
Median resident age - Other Race
Median resident age - Males - White
Median resident age - Males - Black or African American
Median resident age - Males - Asian
Median resident age - Males - Hispanic or Latino
Median resident age - Males - American Indian and Alaska Native
Median resident age - Males - Multirace
Median resident age - Males - Other Race
Median resident age - Females - White
Median resident age - Females - Black or African American
Median resident age - Females - Asian
Median resident age - Females - Hispanic or Latino
Median resident age - Females - American Indian and Alaska Native
Median resident age - Females - Multirace
Median resident age - Females - Other Race
Commute - mean travel time to work (minutes)
Travel time to work - Less than 5 minutes (%)
Travel time to work - Less than 5 minutes (% change since 2000)
Travel time to work - 5 to 9 minutes (%)
Travel time to work - 5 to 9 minutes (% change since 2000)
Travel time to work - 10 to 19 minutes (%)
Travel time to work - 10 to 19 minutes (% change since 2000)
Travel time to work - 20 to 29 minutes (%)
Travel time to work - 20 to 29 minutes (% change since 2000)
Travel time to work - 30 to 39 minutes (%)
Travel time to work - 30 to 39 minutes (% change since 2000)
Travel time to work - 40 to 59 minutes (%)
Travel time to work - 40 to 59 minutes (% change since 2000)
Travel time to work - 60 to 89 minutes (%)
Travel time to work - 60 to 89 minutes (% change since 2000)
Travel time to work - 90 or more minutes (%)
Travel time to work - 90 or more minutes (% change since 2000)
Marital status - Never married (%)
Marital status - Now married (%)
Marital status - Separated (%)
Marital status - Widowed (%)
Marital status - Divorced (%)
Median family income ($)
Median family income (% change since 2000)
Median non-family income ($)
Median non-family income (% change since 2000)
Median per capita income ($)
Median per capita income (% change since 2000)
Median family income ($) - White
Median family income ($) - Black or African American
Median family income ($) - Asian
Median family income ($) - Hispanic or Latino
Median family income ($) - American Indian and Alaska Native
Median family income ($) - Multirace
Median family income ($) - Other Race
Median year house/condo built
Median year apartment built
Year house built - Built 2005 or later (%)
Year house built - Built 2000 to 2004 (%)
Year house built - Built 1990 to 1999 (%)
Year house built - Built 1980 to 1989 (%)
Year house built - Built 1970 to 1979 (%)
Year house built - Built 1960 to 1969 (%)
Year house built - Built 1950 to 1959 (%)
Year house built - Built 1940 to 1949 (%)
Year house built - Built 1939 or earlier (%)
Average household size
Household density (households per square mile)
Average household size - White
Average household size - Black or African American
Average household size - Asian
Average household size - Hispanic or Latino
Average household size - American Indian and Alaska Native
Average household size - Multirace
Average household size - Other Race
Occupied housing units (%)
Vacant housing units (%)
Owner occupied housing units (%)
Renter occupied housing units (%)
Vacancy status - For rent (%)
Vacancy status - For sale only (%)
Vacancy status - Rented or sold, not occupied (%)
Vacancy status - For seasonal, recreational, or occasional use (%)
Vacancy status - For migrant workers (%)
Vacancy status - Other vacant (%)
Residents with income below the poverty level (%)
Residents with income below 50% of the poverty level (%)
Children below poverty level (%)
Poor families by family type - Married-couple family (%)
Poor families by family type - Male, no wife present (%)
Poor families by family type - Female, no husband present (%)
Poverty status for native-born residents (%)
Poverty status for foreign-born residents (%)
Poverty among high school graduates not in families (%)
Poverty among people who did not graduate high school not in families (%)
Residents with income below the poverty level (%) - White
Residents with income below the poverty level (%) - Black or African American
Residents with income below the poverty level (%) - Asian
Residents with income below the poverty level (%) - Hispanic or Latino
Residents with income below the poverty level (%) - American Indian and Alaska Native
Residents with income below the poverty level (%) - Multirace
Residents with income below the poverty level (%) - Other Race
Air pollution - Air Quality Index (AQI)
Air pollution - CO
Air pollution - NO2
Air pollution - SO2
Air pollution - Ozone
Air pollution - PM10
Air pollution - PM25
Air pollution - Pb
Crime - Murders per 100,000 population
Crime - Rapes per 100,000 population
Crime - Robberies per 100,000 population
Crime - Assaults per 100,000 population
Crime - Burglaries per 100,000 population
Crime - Thefts per 100,000 population
Crime - Auto thefts per 100,000 population
Crime - Arson per 100,000 population
Crime - City-data.com crime index
Crime - Violent crime index
Crime - Property crime index
Crime - Murders per 100,000 population (5 year average)
Crime - Rapes per 100,000 population (5 year average)
Crime - Robberies per 100,000 population (5 year average)
Crime - Assaults per 100,000 population (5 year average)
Crime - Burglaries per 100,000 population (5 year average)
Crime - Thefts per 100,000 population (5 year average)
Crime - Auto thefts per 100,000 population (5 year average)
Crime - Arson per 100,000 population (5 year average)
Crime - City-data.com crime index (5 year average)
Crime - Violent crime index (5 year average)
Crime - Property crime index (5 year average)
1996 Presidential Elections Results (%) - Democratic Party (Clinton)
1996 Presidential Elections Results (%) - Republican Party (Dole)
1996 Presidential Elections Results (%) - Other
2000 Presidential Elections Results (%) - Democratic Party (Gore)
2000 Presidential Elections Results (%) - Republican Party (Bush)
2000 Presidential Elections Results (%) - Other
2004 Presidential Elections Results (%) - Democratic Party (Kerry)
2004 Presidential Elections Results (%) - Republican Party (Bush)
2004 Presidential Elections Results (%) - Other
2008 Presidential Elections Results (%) - Democratic Party (Obama)
2008 Presidential Elections Results (%) - Republican Party (McCain)
2008 Presidential Elections Results (%) - Other
2012 Presidential Elections Results (%) - Democratic Party (Obama)
2012 Presidential Elections Results (%) - Republican Party (Romney)
2012 Presidential Elections Results (%) - Other
2016 Presidential Elections Results (%) - Democratic Party (Clinton)
2016 Presidential Elections Results (%) - Republican Party (Trump)
2016 Presidential Elections Results (%) - Other
2020 Presidential Elections Results (%) - Democratic Party (Biden)
2020 Presidential Elections Results (%) - Republican Party (Trump)
2020 Presidential Elections Results (%) - Other
Ancestries Reported - Arab (%)
Ancestries Reported - Czech (%)
Ancestries Reported - Danish (%)
Ancestries Reported - Dutch (%)
Ancestries Reported - English (%)
Ancestries Reported - French (%)
Ancestries Reported - French Canadian (%)
Ancestries Reported - German (%)
Ancestries Reported - Greek (%)
Ancestries Reported - Hungarian (%)
Ancestries Reported - Irish (%)
Ancestries Reported - Italian (%)
Ancestries Reported - Lithuanian (%)
Ancestries Reported - Norwegian (%)
Ancestries Reported - Polish (%)
Ancestries Reported - Portuguese (%)
Ancestries Reported - Russian (%)
Ancestries Reported - Scotch-Irish (%)
Ancestries Reported - Scottish (%)
Ancestries Reported - Slovak (%)
Ancestries Reported - Subsaharan African (%)
Ancestries Reported - Swedish (%)
Ancestries Reported - Swiss (%)
Ancestries Reported - Ukrainian (%)
Ancestries Reported - United States (%)
Ancestries Reported - Welsh (%)
Ancestries Reported - West Indian (%)
Ancestries Reported - Other (%)
Educational Attainment - No schooling completed (%)
Educational Attainment - Less than high school (%)
Educational Attainment - High school or equivalent (%)
Educational Attainment - Less than 1 year of college (%)
Educational Attainment - 1 or more years of college (%)
Educational Attainment - Associate degree (%)
Educational Attainment - Bachelor's degree (%)
Educational Attainment - Master's degree (%)
Educational Attainment - Professional school degree (%)
Educational Attainment - Doctorate degree (%)
School Enrollment - Nursery, preschool (%)
School Enrollment - Kindergarten (%)
School Enrollment - Grade 1 to 4 (%)
School Enrollment - Grade 5 to 8 (%)
School Enrollment - Grade 9 to 12 (%)
School Enrollment - College undergrad (%)
School Enrollment - Graduate or professional (%)
School Enrollment - Not enrolled in school (%)
School enrollment - Public schools (%)
School enrollment - Private schools (%)
School enrollment - Not enrolled (%)
Median number of rooms in houses and condos
Median number of rooms in apartments
Housing units lacking complete plumbing facilities (%)
Housing units lacking complete kitchen facilities (%)
Density of houses
Urban houses (%)
Rural houses (%)
Households with people 60 years and over (%)
Households with people 65 years and over (%)
Households with people 75 years and over (%)
Households with one or more nonrelatives (%)
Households with no nonrelatives (%)
Population in households (%)
Family households (%)
Nonfamily households (%)
Population in families (%)
Family households with own children (%)
Median number of bedrooms in owner occupied houses
Mean number of bedrooms in owner occupied houses
Median number of bedrooms in renter occupied houses
Mean number of bedrooms in renter occupied houses
Median number of vehichles in owner occupied houses
Mean number of vehichles in owner occupied houses
Median number of vehichles in renter occupied houses
Mean number of vehichles in renter occupied houses
Mortgage status - with mortgage (%)
Mortgage status - with second mortgage (%)
Mortgage status - with home equity loan (%)
Mortgage status - with both second mortgage and home equity loan (%)
Mortgage status - without a mortgage (%)
Average family size
Average family size - White
Average family size - Black or African American
Average family size - Asian
Average family size - Hispanic or Latino
Average family size - American Indian and Alaska Native
Average family size - Multirace
Average family size - Other Race
Geographical mobility - Same house 1 year ago (%)
Geographical mobility - Moved within same county (%)
Geographical mobility - Moved from different county within same state (%)
Geographical mobility - Moved from different state (%)
Geographical mobility - Moved from abroad (%)
Place of birth - Born in state of residence (%)
Place of birth - Born in other state (%)
Place of birth - Native, outside of US (%)
Place of birth - Foreign born (%)
Housing units in structures - 1, detached (%)
Housing units in structures - 1, attached (%)
Housing units in structures - 2 (%)
Housing units in structures - 3 or 4 (%)
Housing units in structures - 5 to 9 (%)
Housing units in structures - 10 to 19 (%)
Housing units in structures - 20 to 49 (%)
Housing units in structures - 50 or more (%)
Housing units in structures - Mobile home (%)
Housing units in structures - Boat, RV, van, etc. (%)
House/condo owner moved in on average (years ago)
Renter moved in on average (years ago)
Year householder moved into unit - Moved in 1999 to March 2000 (%)
Year householder moved into unit - Moved in 1995 to 1998 (%)
Year householder moved into unit - Moved in 1990 to 1994 (%)
Year householder moved into unit - Moved in 1980 to 1989 (%)
Year householder moved into unit - Moved in 1970 to 1979 (%)
Year householder moved into unit - Moved in 1969 or earlier (%)
Means of transportation to work - Drove car alone (%)
Means of transportation to work - Carpooled (%)
Means of transportation to work - Public transportation (%)
Means of transportation to work - Bus or trolley bus (%)
Means of transportation to work - Streetcar or trolley car (%)
Means of transportation to work - Subway or elevated (%)
Means of transportation to work - Railroad (%)
Means of transportation to work - Ferryboat (%)
Means of transportation to work - Taxicab (%)
Means of transportation to work - Motorcycle (%)
Means of transportation to work - Bicycle (%)
Means of transportation to work - Walked (%)
Means of transportation to work - Other means (%)
Working at home (%)
Industry diversity
Most Common Industries - Agriculture, forestry, fishing and hunting, and mining (%)
Most Common Industries - Agriculture, forestry, fishing and hunting (%)
Most Common Industries - Mining, quarrying, and oil and gas extraction (%)
Most Common Industries - Construction (%)
Most Common Industries - Manufacturing (%)
Most Common Industries - Wholesale trade (%)
Most Common Industries - Retail trade (%)
Most Common Industries - Transportation and warehousing, and utilities (%)
Most Common Industries - Transportation and warehousing (%)
Most Common Industries - Utilities (%)
Most Common Industries - Information (%)
Most Common Industries - Finance and insurance, and real estate and rental and leasing (%)
Most Common Industries - Finance and insurance (%)
Most Common Industries - Real estate and rental and leasing (%)
Most Common Industries - Professional, scientific, and management, and administrative and waste management services (%)
Most Common Industries - Professional, scientific, and technical services (%)
Most Common Industries - Management of companies and enterprises (%)
Most Common Industries - Administrative and support and waste management services (%)
Most Common Industries - Educational services, and health care and social assistance (%)
Most Common Industries - Educational services (%)
Most Common Industries - Health care and social assistance (%)
Most Common Industries - Arts, entertainment, and recreation, and accommodation and food services (%)
Most Common Industries - Arts, entertainment, and recreation (%)
Most Common Industries - Accommodation and food services (%)
Most Common Industries - Other services, except public administration (%)
Most Common Industries - Public administration (%)
Occupation diversity
Most Common Occupations - Management, business, science, and arts occupations (%)
Most Common Occupations - Management, business, and financial occupations (%)
Most Common Occupations - Management occupations (%)
Most Common Occupations - Business and financial operations occupations (%)
Most Common Occupations - Computer, engineering, and science occupations (%)
Most Common Occupations - Computer and mathematical occupations (%)
Most Common Occupations - Architecture and engineering occupations (%)
Most Common Occupations - Life, physical, and social science occupations (%)
Most Common Occupations - Education, legal, community service, arts, and media occupations (%)
Most Common Occupations - Community and social service occupations (%)
Most Common Occupations - Legal occupations (%)
Most Common Occupations - Education, training, and library occupations (%)
Most Common Occupations - Arts, design, entertainment, sports, and media occupations (%)
Most Common Occupations - Healthcare practitioners and technical occupations (%)
Most Common Occupations - Health diagnosing and treating practitioners and other technical occupations (%)
Most Common Occupations - Health technologists and technicians (%)
Most Common Occupations - Service occupations (%)
Most Common Occupations - Healthcare support occupations (%)
Most Common Occupations - Protective service occupations (%)
Most Common Occupations - Fire fighting and prevention, and other protective service workers including supervisors (%)
Most Common Occupations - Law enforcement workers including supervisors (%)
Most Common Occupations - Food preparation and serving related occupations (%)
Most Common Occupations - Building and grounds cleaning and maintenance occupations (%)
Most Common Occupations - Personal care and service occupations (%)
Most Common Occupations - Sales and office occupations (%)
Most Common Occupations - Sales and related occupations (%)
Most Common Occupations - Office and administrative support occupations (%)
Most Common Occupations - Natural resources, construction, and maintenance occupations (%)
Most Common Occupations - Farming, fishing, and forestry occupations (%)
Most Common Occupations - Construction and extraction occupations (%)
Most Common Occupations - Installation, maintenance, and repair occupations (%)
Most Common Occupations - Production, transportation, and material moving occupations (%)
Most Common Occupations - Production occupations (%)
Most Common Occupations - Transportation occupations (%)
Most Common Occupations - Material moving occupations (%)
People in Group quarters - Institutionalized population (%)
People in Group quarters - Correctional institutions (%)
People in Group quarters - Federal prisons and detention centers (%)
People in Group quarters - Halfway houses (%)
People in Group quarters - Local jails and other confinement facilities (including police lockups) (%)
People in Group quarters - Military disciplinary barracks (%)
People in Group quarters - State prisons (%)
People in Group quarters - Other types of correctional institutions (%)
People in Group quarters - Nursing homes (%)
People in Group quarters - Hospitals/wards, hospices, and schools for the handicapped (%)
People in Group quarters - Hospitals/wards and hospices for chronically ill (%)
People in Group quarters - Hospices or homes for chronically ill (%)
People in Group quarters - Military hospitals or wards for chronically ill (%)
People in Group quarters - Other hospitals or wards for chronically ill (%)
People in Group quarters - Hospitals or wards for drug/alcohol abuse (%)
People in Group quarters - Mental (Psychiatric) hospitals or wards (%)
People in Group quarters - Schools, hospitals, or wards for the mentally retarded (%)
People in Group quarters - Schools, hospitals, or wards for the physically handicapped (%)
People in Group quarters - Institutions for the deaf (%)
People in Group quarters - Institutions for the blind (%)
People in Group quarters - Orthopedic wards and institutions for the physically handicapped (%)
People in Group quarters - Wards in general hospitals for patients who have no usual home elsewhere (%)
People in Group quarters - Wards in military hospitals for patients who have no usual home elsewhere (%)
People in Group quarters - Juvenile institutions (%)
People in Group quarters - Long-term care (%)
People in Group quarters - Homes for abused, dependent, and neglected children (%)
People in Group quarters - Residential treatment centers for emotionally disturbed children (%)
People in Group quarters - Training schools for juvenile delinquents (%)
People in Group quarters - Short-term care, detention or diagnostic centers for delinquent children (%)
People in Group quarters - Type of juvenile institution unknown (%)
People in Group quarters - Noninstitutionalized population (%)
People in Group quarters - College dormitories (includes college quarters off campus) (%)
People in Group quarters - Military quarters (%)
People in Group quarters - On base (%)
People in Group quarters - Barracks, unaccompanied personnel housing (UPH), (Enlisted/Officer), ;and similar group living quarters for military personnel (%)
People in Group quarters - Transient quarters for temporary residents (%)
People in Group quarters - Military ships (%)
People in Group quarters - Group homes (%)
People in Group quarters - Homes or halfway houses for drug/alcohol abuse (%)
People in Group quarters - Homes for the mentally ill (%)
People in Group quarters - Homes for the mentally retarded (%)
People in Group quarters - Homes for the physically handicapped (%)
People in Group quarters - Other group homes (%)
People in Group quarters - Religious group quarters (%)
People in Group quarters - Dormitories (%)
People in Group quarters - Agriculture workers' dormitories on farms (%)
People in Group quarters - Job Corps and vocational training facilities (%)
People in Group quarters - Other workers' dormitories (%)
People in Group quarters - Crews of maritime vessels (%)
People in Group quarters - Other nonhousehold living situations (%)
People in Group quarters - Other noninstitutional group quarters (%)
Residents speaking English at home (%)
Residents speaking English at home - Born in the United States (%)
Residents speaking English at home - Native, born elsewhere (%)
Residents speaking English at home - Foreign born (%)
Residents speaking Spanish at home (%)
Residents speaking Spanish at home - Born in the United States (%)
Residents speaking Spanish at home - Native, born elsewhere (%)
Residents speaking Spanish at home - Foreign born (%)
Residents speaking other language at home (%)
Residents speaking other language at home - Born in the United States (%)
Residents speaking other language at home - Native, born elsewhere (%)
Residents speaking other language at home - Foreign born (%)
Class of Workers - Employee of private company (%)
Class of Workers - Self-employed in own incorporated business (%)
Class of Workers - Private not-for-profit wage and salary workers (%)
Class of Workers - Local government workers (%)
Class of Workers - State government workers (%)
Class of Workers - Federal government workers (%)
Class of Workers - Self-employed workers in own not incorporated business and Unpaid family workers (%)
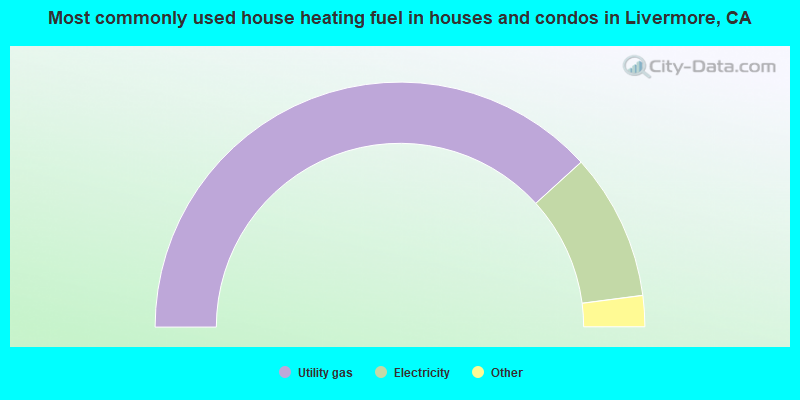
House heating fuel used in houses and condos - Utility gas (%)
House heating fuel used in houses and condos - Bottled, tank, or LP gas (%)
House heating fuel used in houses and condos - Electricity (%)
House heating fuel used in houses and condos - Fuel oil, kerosene, etc. (%)
House heating fuel used in houses and condos - Coal or coke (%)
House heating fuel used in houses and condos - Wood (%)
House heating fuel used in houses and condos - Solar energy (%)
House heating fuel used in houses and condos - Other fuel (%)
House heating fuel used in houses and condos - No fuel used (%)
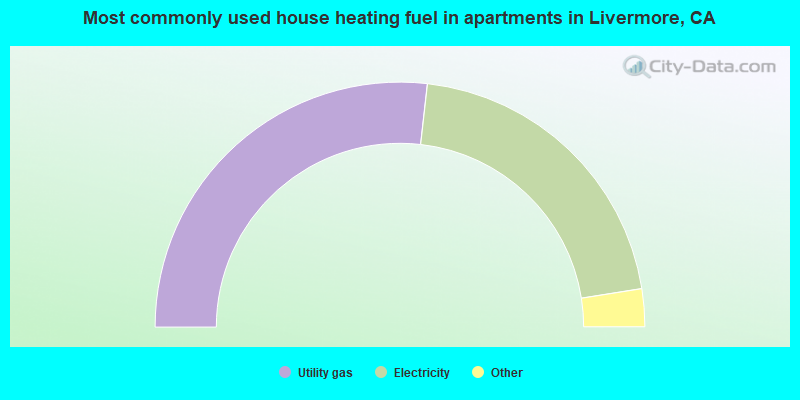
House heating fuel used in apartments - Utility gas (%)
House heating fuel used in apartments - Bottled, tank, or LP gas (%)
House heating fuel used in apartments - Electricity (%)
House heating fuel used in apartments - Fuel oil, kerosene, etc. (%)
House heating fuel used in apartments - Coal or coke (%)
House heating fuel used in apartments - Wood (%)
House heating fuel used in apartments - Solar energy (%)
House heating fuel used in apartments - Other fuel (%)
House heating fuel used in apartments - No fuel used (%)
Armed forces status - In Armed Forces (%)
Armed forces status - Civilian (%)
Armed forces status - Civilian - Veteran (%)
Armed forces status - Civilian - Nonveteran (%)
Fatal accidents locations in years 2005-2021
Fatal accidents locations in 2005
Fatal accidents locations in 2006
Fatal accidents locations in 2007
Fatal accidents locations in 2008
Fatal accidents locations in 2009
Fatal accidents locations in 2010
Fatal accidents locations in 2011
Fatal accidents locations in 2012
Fatal accidents locations in 2013
Fatal accidents locations in 2014
Fatal accidents locations in 2015
Fatal accidents locations in 2016
Fatal accidents locations in 2017
Fatal accidents locations in 2018
Fatal accidents locations in 2019
Fatal accidents locations in 2020
Fatal accidents locations in 2021
Alcohol use - People drinking some alcohol every month (%)
Alcohol use - People not drinking at all (%)
Alcohol use - Average days/month drinking alcohol
Alcohol use - Average drinks/week
Alcohol use - Average days/year people drink much
Audiometry - Average condition of hearing (%)
Audiometry - People that can hear a whisper from across a quiet room (%)
Audiometry - People that can hear normal voice from across a quiet room (%)
Audiometry - Ears ringing, roaring, buzzing (%)
Audiometry - Had a job exposure to loud noise (%)
Audiometry - Had off-work exposure to loud noise (%)
Blood Pressure & Cholesterol - Has high blood pressure (%)
Blood Pressure & Cholesterol - Checking blood pressure at home (%)
Blood Pressure & Cholesterol - Frequently checking blood cholesterol (%)
Blood Pressure & Cholesterol - Has high cholesterol level (%)
Consumer Behavior - Money monthly spent on food at supermarket/grocery store
Consumer Behavior - Money monthly spent on food at other stores
Consumer Behavior - Money monthly spent on eating out
Consumer Behavior - Money monthly spent on carryout/delivered foods
Consumer Behavior - Income spent on food at supermarket/grocery store (%)
Consumer Behavior - Income spent on food at other stores (%)
Consumer Behavior - Income spent on eating out (%)
Consumer Behavior - Income spent on carryout/delivered foods (%)
Current Health Status - General health condition (%)
Current Health Status - Blood donors (%)
Current Health Status - Has blood ever tested for HIV virus (%)
Current Health Status - Left-handed people (%)
Dermatology - People using sunscreen (%)
Diabetes - Diabetics (%)
Diabetes - Had a blood test for high blood sugar (%)
Diabetes - People taking insulin (%)
Diet Behavior & Nutrition - Diet health (%)
Diet Behavior & Nutrition - Milk product consumption (# of products/month)
Diet Behavior & Nutrition - Meals not home prepared (#/week)
Diet Behavior & Nutrition - Meals from fast food or pizza place (#/week)
Diet Behavior & Nutrition - Ready-to-eat foods (#/month)
Diet Behavior & Nutrition - Frozen meals/pizza (#/month)
Drug Use - People that ever used marijuana or hashish (%)
Drug Use - Ever used hard drugs (%)
Drug Use - Ever used any form of cocaine (%)
Drug Use - Ever used heroin (%)
Drug Use - Ever used methamphetamine (%)
Health Insurance - People covered by health insurance (%)
Kidney Conditions-Urology - Avg. # of times urinating at night
Medical Conditions - People with asthma (%)
Medical Conditions - People with anemia (%)
Medical Conditions - People with psoriasis (%)
Medical Conditions - People with overweight (%)
Medical Conditions - Elderly people having difficulties in thinking or remembering (%)
Medical Conditions - People who ever received blood transfusion (%)
Medical Conditions - People having trouble seeing even with glass/contacts (%)
Medical Conditions - People with arthritis (%)
Medical Conditions - People with gout (%)
Medical Conditions - People with congestive heart failure (%)
Medical Conditions - People with coronary heart disease (%)
Medical Conditions - People with angina pectoris (%)
Medical Conditions - People who ever had heart attack (%)
Medical Conditions - People who ever had stroke (%)
Medical Conditions - People with emphysema (%)
Medical Conditions - People with thyroid problem (%)
Medical Conditions - People with chronic bronchitis (%)
Medical Conditions - People with any liver condition (%)
Medical Conditions - People who ever had cancer or malignancy (%)
Mental Health - People who have little interest in doing things (%)
Mental Health - People feeling down, depressed, or hopeless (%)
Mental Health - People who have trouble sleeping or sleeping too much (%)
Mental Health - People feeling tired or having little energy (%)
Mental Health - People with poor appetite or overeating (%)
Mental Health - People feeling bad about themself (%)
Mental Health - People who have trouble concentrating on things (%)
Mental Health - People moving or speaking slowly or too fast (%)
Mental Health - People having thoughts they would be better off dead (%)
Oral Health - Average years since last visit a dentist
Oral Health - People embarrassed because of mouth (%)
Oral Health - People with gum disease (%)
Oral Health - General health of teeth and gums (%)
Oral Health - Average days a week using dental floss/device
Oral Health - Average days a week using mouthwash for dental problem
Oral Health - Average number of teeth
Pesticide Use - Households using pesticides to control insects (%)
Pesticide Use - Households using pesticides to kill weeds (%)
Physical Activity - People doing vigorous-intensity work activities (%)
Physical Activity - People doing moderate-intensity work activities (%)
Physical Activity - People walking or bicycling (%)
Physical Activity - People doing vigorous-intensity recreational activities (%)
Physical Activity - People doing moderate-intensity recreational activities (%)
Physical Activity - Average hours a day doing sedentary activities
Physical Activity - Average hours a day watching TV or videos
Physical Activity - Average hours a day using computer
Physical Functioning - People having limitations keeping them from working (%)
Physical Functioning - People limited in amount of work they can do (%)
Physical Functioning - People that need special equipment to walk (%)
Physical Functioning - People experiencing confusion/memory problems (%)
Physical Functioning - People requiring special healthcare equipment (%)
Prescription Medications - Average number of prescription medicines taking
Preventive Aspirin Use - Adults 40+ taking low-dose aspirin (%)
Reproductive Health - Vaginal deliveries (%)
Reproductive Health - Cesarean deliveries (%)
Reproductive Health - Deliveries resulted in a live birth (%)
Reproductive Health - Pregnancies resulted in a delivery (%)
Reproductive Health - Women breastfeeding newborns (%)
Reproductive Health - Women that had a hysterectomy (%)
Reproductive Health - Women that had both ovaries removed (%)
Reproductive Health - Women that have ever taken birth control pills (%)
Reproductive Health - Women taking birth control pills (%)
Reproductive Health - Women that have ever used Depo-Provera or injectables (%)
Reproductive Health - Women that have ever used female hormones (%)
Sexual Behavior - People 18+ that ever had sex (vaginal, anal, or oral) (%)
Sexual Behavior - Males 18+ that ever had vaginal sex with a woman (%)
Sexual Behavior - Males 18+ that ever performed oral sex on a woman (%)
Sexual Behavior - Males 18+ that ever had anal sex with a woman (%)
Sexual Behavior - Males 18+ that ever had any sex with a man (%)
Sexual Behavior - Females 18+ that ever had vaginal sex with a man (%)
Sexual Behavior - Females 18+ that ever performed oral sex on a man (%)
Sexual Behavior - Females 18+ that ever had anal sex with a man (%)
Sexual Behavior - Females 18+ that ever had any kind of sex with a woman (%)
Sexual Behavior - Average age people first had sex
Sexual Behavior - Average number of female sex partners in lifetime (males 18+)
Sexual Behavior - Average number of female vaginal sex partners in lifetime (males 18+)
Sexual Behavior - Average age people first performed oral sex on a woman (18+)
Sexual Behavior - Average number of woman performed oral sex on in lifetime (18+)
Sexual Behavior - Average number of male sex partners in lifetime (males 18+)
Sexual Behavior - Average number of male anal sex partners in lifetime (males 18+)
Sexual Behavior - Average age people first performed oral sex on a man (18+)
Sexual Behavior - Average number of male oral sex partners in lifetime (18+)
Sexual Behavior - People using protection when performing oral sex (%)
Sexual Behavior - Average number of times people have vaginal or anal sex a year
Sexual Behavior - People having sex without condom (%)
Sexual Behavior - Average number of male sex partners in lifetime (females 18+)
Sexual Behavior - Average number of male vaginal sex partners in lifetime (females 18+)
Sexual Behavior - Average number of female sex partners in lifetime (females 18+)
Sexual Behavior - Circumcised males 18+ (%)
Sleep Disorders - Average hours sleeping at night
Sleep Disorders - People that has trouble sleeping (%)
Smoking-Cigarette Use - People smoking cigarettes (%)
Taste & Smell - People 40+ having problems with smell (%)
Taste & Smell - People 40+ having problems with taste (%)
Taste & Smell - People 40+ that ever had wisdom teeth removed (%)
Taste & Smell - People 40+ that ever had tonsils teeth removed (%)
Taste & Smell - People 40+ that ever had a loss of consciousness because of a head injury (%)
Taste & Smell - People 40+ that ever had a broken nose or other serious injury to face or skull (%)
Taste & Smell - People 40+ that ever had two or more sinus infections (%)
Weight - Average height (inches)
Weight - Average weight (pounds)
Weight - Average BMI
Weight - People that are obese (%)
Weight - People that ever were obese (%)
Weight - People trying to lose weight (%)
43,892 51.8% White alone 18,209 21.5% Asian alone 15,805 18.7% Hispanic 5,020 5.9% Two or more races 1,509 1.8% Black alone 271 0.3% Other race alone 16 0.02% Native Hawaiian and Other
According to our research of California and other state lists, there were 42 registered sex offenders living in Livermore, California as of April 27, 2024 . The ratio of all residents to sex offenders in Livermore is 2,122 to 1.The ratio of registered sex offenders to all residents in this city is much lower than the state average.
The City-Data.com crime index weighs serious crimes and violent crimes more heavily. Higher means more crime, U.S. average is 246.1. It adjusts for the number of visitors and daily workers commuting into cities.
- means the value is smaller than the state average.
- means the value is about the same as the state average.
- means the value is bigger than the state average.
Crime rate in Livermore detailed stats: murders, rapes, robberies, assaults, burglaries, thefts, arson Officers per 1,000 residents here:
0.97California average:
2.30
Latest news from Livermore, CA collected exclusively by city-data.com from local newspapers, TV, and radio stations
Ancestries: English (4.8%), European (4.7%), American (4.6%), Irish (4.1%), German (4.0%), Italian (3.5%).
Current Local Time:
Land area: 23.9 square miles.
Population density: 3,540 people per square mile (average).
16,732 residents are foreign born (10.4% Asia , 5.2% Latin America , 2.2% Europe ).
This city:
19.6%California:
26.5%
Median real estate property taxes paid for housing units with mortgages in 2022: $8,812 (0.8%)Median real estate property taxes paid for housing units with no mortgage in 2022: $5,710 (0.5%)
Nearest city with pop. 200,000+: Fremont, CA
Nearest city with pop. 1,000,000+: Los Angeles, CA
Nearest cities:
Latitude: 37.69 N, Longitude: 121.76 W
Daytime population change due to commuting: +13,850 (+16.3%)Workers who live and work in this city: 21,655 (50.0%)
Livermore tourist attractions:
Single-family new house construction building permits:
2022: 25 buildings , average cost: $375,5002021: 36 buildings , average cost: $288,6002020: 56 buildings , average cost: $314,2002019: 53 buildings , average cost: $284,3002018: 124 buildings , average cost: $311,7002017: 308 buildings , average cost: $240,7002016: 261 buildings , average cost: $260,3002015: 334 buildings , average cost: $257,7002014: 71 buildings , average cost: $271,1002013: 112 buildings , average cost: $229,5002012: 102 buildings , average cost: $239,8002011: 60 buildings , average cost: $280,3002010: 78 buildings , average cost: $243,8002009: 93 buildings , average cost: $215,3002008: 62 buildings , average cost: $276,6002007: 142 buildings , average cost: $308,6002006: 163 buildings , average cost: $325,8002005: 258 buildings , average cost: $361,8002004: 327 buildings , average cost: $360,4002003: 324 buildings , average cost: $334,1002002: 529 buildings , average cost: $303,3002001: 386 buildings , average cost: $266,6002000: 456 buildings , average cost: $221,5001999: 316 buildings , average cost: $199,5001998: 632 buildings , average cost: $207,2001997: 829 buildings , average cost: $175,700Unemployment in December 2023:
Population change in the 1990s: +15,812 (+27.5%).
Most common occupations in Livermore, CA (%)
Both Males Females
Other management occupations, except farmers and farm managers (8.2%)
Cooks and food preparation workers (5.9%)
Computer specialists (4.0%)
Engineers (2.9%)
Cashiers (2.8%)
Retail sales workers, except cashiers (2.8%)
Building and grounds cleaning and maintenance occupations (2.2%)
Other management occupations, except farmers and farm managers (9.6%)
Cooks and food preparation workers (6.8%)
Computer specialists (6.1%)
Engineers (5.0%)
Vehicle and mobile equipment mechanics, installers, and repairers (3.0%)
Electrical equipment mechanics and other installation, maintenance, and repair workers, including supervisors (2.9%)
Top executives (2.8%)
Other management occupations, except farmers and farm managers (6.5%)
Cooks and food preparation workers (4.9%)
Secretaries and administrative assistants (4.3%)
Cashiers (3.3%)
Information and record clerks, except customer service representatives (3.1%)
Bookkeeping, accounting, and auditing clerks (3.0%)
Other office and administrative support workers, including supervisors (2.9%)
Earthquake activity:
Livermore-area historical earthquake activity is significantly above California state average. It is 7823% greater than the overall U.S. average. On 4/18/1906 at 13:12:21, a magnitude 7.9 (7.9 UK, Class: Major, Intensity: VIII - XII) earthquake occurred 70.9 miles away from the city center, causing $524,000,000 total damage On 10/18/1989 at 00:04:15, a magnitude 7.1 (6.5 MB, 7.1 MS, 6.9 MW, 7.0 ML) earthquake occurred 39.8 miles away from Livermore center, causing 62 deaths ( 62 shaking deaths) and 3757 injuries, causing $1,305,032,704 total damage On 7/21/1952 at 11:52:14, a magnitude 7.7 (7.7 UK) earthquake occurred 241.3 miles away from Livermore center, causing $50,000,000 total damage On 11/4/1927 at 13:51:53, a magnitude 7.5 (7.5 UK) earthquake occurred 195.9 miles away from Livermore center On 1/31/1922 at 13:17:28, a magnitude 7.6 (7.6 UK) earthquake occurred 291.0 miles away from Livermore center On 12/21/1932 at 06:10:09, a magnitude 7.2 (7.2 UK) earthquake occurred 208.3 miles away from the city center Magnitude types: body-wave magnitude (MB), local magnitude (ML), surface-wave magnitude (MS), moment magnitude (MW) Natural disasters: The number of natural disasters in Alameda County (20) is greater than the US average (15).Major Disasters (Presidential) Declared: 14Emergencies Declared: 2Floods: 13, Storms: 7, Mudslides: 6, Winter Storms: 6, Landslides: 4, Fires: 2, Drought: 1, Earthquake: 1, Freeze: 1, Hurricane: 1, Tornado: 1, Other: 1 (Note: some incidents may be assigned to more than one category). Main business address for: FORMFACTOR INC SEMICONDUCTORS & RELATED DEVICES ), MCGRATH RENTCORP SERVICES-EQUIPMENT RENTAL & LEASING, NEC ), ADEPT TECHNOLOGY INC SPECIAL INDUSTRY MACHINERY, NEC ).
Hospitals and medical centers in Livermore: KINDRED NURSING AND HEALTHCARE - LIVERMORE (76 FENTON STREET)
LIVERMORE MANOR CONV HOSP (788 HOLMES ST)
SILVER OAK MANOR (788 HOLMES STREET)
VALLEY MEMORIAL HOSPITAL SNF (1111 E. STANLEY BLVD)
LIVERMORE DIALYSIS CENTER (3201 DOOLAN ROAD SUITE 175)
Amtrak station: LIVERMORE (720 LAS FLORES DR.) - Bus Station
.
Services: fully wheelchair accessible, enclosed waiting area, public restrooms, public payphones, full-service food facilities, free short-term parking, free long-term parking, call for taxi service, intercity bus service, public transit connection.
College/University in Livermore: Las Positas College Full-time enrollment: 5,112; Location: 3000 Campus Hill Drive; Public; Website: www.laspositascollege.edu)
Other colleges/universities with over 2000 students near Livermore:
Ohlone College (about 14 miles; Fremont, CA ; Full-time enrollment: 6,153)
California State University-East Bay (about 17 miles; Hayward, CA ; FT enrollment: 12,956)
Wyotech-Fremont (about 18 miles; Fremont, CA ; FT enrollment: 2,383)
Chabot College (about 20 miles; Hayward, CA ; FT enrollment: 7,610)
Saint Mary's College of California (about 22 miles; Moraga, CA ; FT enrollment: 4,200)
Los Medanos College (about 23 miles; Pittsburg, CA ; FT enrollment: 5,289)
Merritt College (about 24 miles; Oakland, CA ; FT enrollment: 2,842)
Public high schools in Livermore: LIVERMORE HIGH Students: 1,477, Location: 600 MAPLE ST., Grades: 9-12)VINEYARD ALTERNATIVE Students: 55, Location: 1401 ALMOND AVE., Grades: 1-12)DEL VALLE CONTINUATION HIGH Students: 33, Location: 2253 FIFTH ST., Grades: 7-12)TRI-VALLEY ROP Location: 1040 FLORENCE RD., Grades: 9-12)LIVERMORE VALLEY CHARTER PREPARATORY HIGH Location: 2451 PORTOLA AVE., Grades: 9-12, Charter school )GRANADA HIGH Location: 400 WALL ST., Grades: 9-12)
Biggest public elementary/middle schools in Livermore: WILLIAM MENDENHALL MIDDLE Students: 809, Location: 1701 EL PADRO DR., Grades: 6-8)EAST AVENUE MIDDLE Students: 687, Location: 3951 E. AVE., Grades: 6-8)LIVERMORE VALLEY CHARTER Students: 671, Location: 3142 CONSTITUTION DR, Grades: KG-8, Charter school )ANDREW N. CHRISTENSEN MIDDLE Students: 606, Location: 5757 HAGGIN OAKS AVE., Grades: 6-8)JUNCTION K-8 Students: 547, Location: 298 JUNCTION AVE., Grades: KG-8)EMMA C. SMITH ELEMENTARY Students: 476, Location: 391 ONTARIO DR., Grades: KG-5)ARROYO SECO ELEMENTARY Students: 439, Location: 5280 IRENE WAY, Grades: KG-5)LEO R. CROCE ELEMENTARY Students: 417, Location: 5650 SCENIC AVE., Grades: KG-5)ALTAMONT CREEK ELEMENTARY Students: 375, Location: 6500 GARAVENTA RANCH RD., Grades: KG-5)RANCHO LAS POSITAS ELEMENTARY Students: 355, Location: 401 E. JACK LONDON BLVD., Grades: KG-5)Private elementary/middle schools in Livermore: VALLEY MONTESSORI SCHOOL Students: 462, Location: 1273 N LIVERMORE AVE, Grades: UG-8)
OUR SAVIOR LUTHERAN SCHOOL Students: 281, Location: 1385 S LIVERMORE AVE, Grades: PK-8)
ST MICHAEL SCHOOL Students: 243, Location: 345 CHURCH ST, Grades: KG-8)
SUNSET CHRISTIAN SCHOOL Students: 64, Location: 2200 ARROYO RD, Grades: PK-3)
See full list of schools located in Livermore Library in Livermore: LIVERMORE PUBLIC LIBRARY Operating income: $5,263,310; Location: 1188 S. LIVERMORE AVE.; 239,130 books ; 6,550 e-books ; 5,912 audio materials ; 9,463 video materials ; 1 state licensed databases ; 39 other licensed databases ; 381 print serial subscriptions ; 22 electronic serial subscriptions )
User-submitted facts and corrections:
Arroyo Mocho Elementary School is no longer open!
Please add church to church section: United Christian Church 1886 College Ave, Livermore CA 94550 Ph: 925-449-6820 - Website: www.UCCLiv.org email: revdocmaw at sbcglobal.net
The elementary school Arroyo Mocho has been closed. Livermore has two zip codes: 94550 and 94551. added by do not display
Largest employer in Livermore: Lawrence Livermore National Laboratory with approximately 8,000 full time employees. Operated by the University of California for the Department of Energy and NNSA. website http://www.llnl.gov
Notable locations in Livermore: (A) , First Street Business Park (B) , Retzlaff Vineyards (C) , Springtown Golf Course (D) , Livermore Water Reclaimation Plant (E) , Las Positas Golf Course (F) , Livermore Public Library (G) , Livermore City Hall (H) , Las Positas Learning Resources Center (I) , Livermore - Pleasanton Fire Department Station 8 (J) , Livermore - Pleasanton Fire Department Station 7 (K) , Livermore - Pleasanton Fire Department Station 6 (L) , Alameda County Fire Department Station 8 (M) , Livermore - Pleasanton Fire Department Station 10 (N) , Livermore - Pleasanton Fire Department Station 9 (O) . Display/hide their locations on the map
Shopping Centers: (1) , Lincoln Shopping Center (2) , Livermore Arcade Shopping Center (3) , Livermore Center Shopping Center (4) , Millers Outpost Shopping Center (5) , Nob Hill Shopping Center (6) , Peppertree Plaza Shopping Center (7) , Plaza 580 Shopping Center (8) , The Village at Livermore Shopping Center (9) . Display/hide their locations on the map
Main business address in Livermore include: (A) , MCGRATH RENTCORP (B) , ADEPT TECHNOLOGY INC (C) . Display/hide their locations on the map
Churches in Livermore include: (A) , Trinity Southern Baptist Church (B) , Saint Michaels Roman Catholic Church (C) , Reorganized Church of Jesus Christ of Latter Day Saints (D) , First Presbyterian Church (E) , First Baptist Church (F) , Christian and Missionary Alliance Church (G) . Display/hide their locations on the map
Cemeteries: (1) , Saint Michaels Cemetery (2) , Roselawn Cemetery (3) . Display/hide their locations on the map
Creek: (A) . Display/hide its location on the map
Parks in Livermore include: (1) , William Payne Sports Park (2) , Robertson Park (3) , Civic Center Park (4) , Al Caffodio Park (5) , Almond Park (6) , Big Trees Park (7) , Bill Clark Park (8) , Bothwell Recreation Center (9) . Display/hide their locations on the map
Tourist attraction: (1) . Display/hide its approximate location on the map
Hotels: (1) , Arbors (3550 Pacific Avenue Ofc) (2) . Display/hide their approximate locations on the map
Birthplace of: James Wesley Rawles - Survivalist-fiction author and blogger, Jean Quan - California politician, Chad La Tourette - Distance swimmer., Glen Plake - Alpine skier, Mark Davis (pitcher) - Baseball player and coach, Martin Harrison - Football player, Bobby Rock - Rock drummer, Brad Stisser - Soccer player, Bill Mooneyham - Baseball player, Bryan Shaw - Baseball player.
Alameda County has a predicted average indoor radon screening level between 2 and 4 pCi/L (pico curies per liter) - Moderate Potential Drinking water stations with addresses in Livermore and their reported violations in the past:
THE JUNCTION WATER SYSTEM (Address: 45405 San Antonio Valley Road Population served: 50, Groundwater):
Past monitoring violations:
One routine major monitoring violation
Population served: 44, Groundwater):
Past health violations:
MCL, Monthly (TCR) - In AUG-2007, Contaminant: Coliform. Follow-up actions: St Public Notif requested (AUG-28-2007), St Violation/Reminder Notice (AUG-28-2007), St Compliance achieved (SEP-25-2007)
Drinking water stations with addresses in Livermore that have no violations reported:
CALIFORNIA WATER SERVICE - LIVERMORE (Population served: 55,800, Primary Water Source Type: Purch surface water)
Average household size: This city:
2.8 peopleCalifornia:
2.9 people
Percentage of family households: This city:
73.1%Whole state:
68.7%
Percentage of households with unmarried partners: This city:
6.1%Whole state:
7.2%
Likely homosexual households (counted as self-reported same-sex unmarried-partner households)
Lesbian couples: 0.4% of all households Gay men: 0.3% of all households
People in group quarters in Livermore in 2010:
233 people in other noninstitutional facilities
121 people in nursing facilities/skilled-nursing facilities
71 people in group homes intended for adults
62 people in workers' group living quarters and job corps centers
18 people in emergency and transitional shelters (with sleeping facilities) for people experiencing homelessness
5 people in residential treatment centers for adults
People in group quarters in Livermore in 2000:
128 people in nursing homes
42 people in other noninstitutional group quarters
23 people in other group homes
8 people in religious group quarters
Banks with most branches in Livermore (2011 data):
Wells Fargo Bank, National Association: Livermore - Las Positas Branch, Livermore Branch, Livermore Branch. Info updated 2011/04/05: Bank assets: $1,161,490.0 mil, Deposits: $905,653.0 mil, headquarters in Sioux Falls, SD, positive income , 6395 total offices , Holding Company: Wells Fargo & Company
Bank of America, National Association: North Livermore Branch at 4213 First Street, branch established on 1998/11/16; Livermore Branch at 1748 Railroad Avenue, branch established on 1917/01/27. Info updated 2009/11/18: Bank assets: $1,451,969.3 mil, Deposits: $1,077,176.8 mil, headquarters in Charlotte, NC, positive income , 5782 total offices , Holding Company: Bank Of America Corporation
JPMorgan Chase Bank, National Association: Livermore Branch at 275 South K Street, branch established on 1889/01/01; Livermore - Vasco Road Branch at 1702 N Vasco Road, branch established on 2005/03/07. Info updated 2011/11/10: Bank assets: $1,811,678.0 mil, Deposits: $1,190,738.0 mil, headquarters in Columbus, OH, positive income , International Specialization, 5577 total offices , Holding Company: Jpmorgan Chase & Co.
U.S. Bank National Association: Livermore Branch at 2125 Second Street, branch established on 1982/03/15; First Street Safeway Branch at 1554 First Street, branch established on 2003/11/10. Info updated 2012/01/30: Bank assets: $330,470.8 mil, Deposits: $236,091.5 mil, headquarters in Cincinnati, OH, positive income , 3121 total offices , Holding Company: U.S. Bancorp
Bank of the West: Livermore Branch at 2287 Second Street, branch established on 1964/04/16. Info updated 2009/11/16: Bank assets: $62,408.3 mil, Deposits: $43,995.2 mil, headquarters in San Francisco, CA, positive income , 647 total offices , Holding Company: Bnp Paribas
Westamerica Bank: Livermore Branch at 1480 First Street, branch established on 1999/12/01. Info updated 2011/06/21: Bank assets: $4,998.1 mil, Deposits: $4,253.2 mil, headquarters in San Rafael, CA, positive income , Commercial Lending Specialization, 98 total offices , Holding Company: Westamerica Bancorporation
Citibank, National Association: 2150 Portola Avenue Branch at 2150 Portola Avenue, Ste A, branch established on 2002/11/13. Info updated 2012/01/10: Bank assets: $1,288,658.0 mil, Deposits: $882,541.0 mil, headquarters in Sioux Falls, SD, positive income , International Specialization, 1048 total offices , Holding Company: Citigroup Inc.
Union Bank, National Association: Livermore Instore Branch at 2000 Portola Avenue, branch established on 2000/04/24. Info updated 2011/09/01: Bank assets: $88,967.5 mil, Deposits: $65,286.4 mil, headquarters in San Francisco, CA, positive income , Commercial Lending Specialization, 403 total offices , Holding Company: Mitsubishi Ufj Financial Group, Inc.
Tri-Valley Bank: Livermore Branch at 1756 First Street, branch established on 2005/09/26. Info updated 2009/06/05: Bank assets: $77.6 mil, Deposits: $66.6 mil, headquarters in San Ramon, CA, negative income in the last year , Commercial Lending Specialization, 2 total offices
4 other banks with 4 local branches
For population 15 years and over in Livermore:
Never married: 27.4%Now married: 59.1%Separated: 1.1%Widowed: 4.9%Divorced: 7.5% For population 25 years and over in Livermore:
High school or higher: 93.8%Bachelor's degree or higher: 54.6%Graduate or professional degree: 21.4%Unemployed: 2.5%Mean travel time to work (commute): 20.6 minutes
Education Gini index (Inequality in education) Here:
12.9California average:
15.5
Religion statistics for Livermore, CA (based on Alameda County data)
Religion Adherents Congregations Catholic 231,500 53 Evangelical Protestant 123,422 538 Other 87,110 227 Mainline Protestant 40,185 181 Black Protestant 20,716 76 Orthodox 6,640 16 None 1,000,698 -
Source: Clifford Grammich, Kirk Hadaway, Richard Houseal, Dale E.Jones, Alexei Krindatch, Richie Stanley and Richard H.Taylor. 2012. 2010 U.S.Religion Census: Religious Congregations & Membership Study. Association of Statisticians of American Religious Bodies. Jones, Dale E., et al. 2002. Congregations and Membership in the United States 2000. Nashville, TN: Glenmary Research Center. Graphs represent county-level data
Food Environment Statistics: Number of grocery stores : 364Alameda County :
2.50 / 10,000 pop.California :
2.14 / 10,000 pop.
Number of supercenters and club stores : 5Alameda County :
0.03 / 10,000 pop.California :
0.04 / 10,000 pop.
Number of convenience stores (no gas) : 97Here :
0.67 / 10,000 pop.California :
0.62 / 10,000 pop.
Number of convenience stores (with gas) : 232Here :
1.60 / 10,000 pop.California :
1.49 / 10,000 pop.
Number of full-service restaurants : 1,299This county :
8.94 / 10,000 pop.California :
7.42 / 10,000 pop.
Adult diabetes rate : This county :
6.9%State :
7.3%
Adult obesity rate : Alameda County :
19.3%California :
21.3%
Low-income preschool obesity rate : This county :
16.6%California :
17.9%
Health and Nutrition: Healthy diet rate : Livermore:
50.7%California:
49.4%
Average overall health of teeth and gums : Livermore:
49.8%California:
48.0%
Average BMI : Livermore:
28.4California:
28.1
People feeling badly about themselves : This city:
20.8%California:
20.2%
People not drinking alcohol at all : Livermore:
9.4%State:
11.2%
Average hours sleeping at night : Overweight people : Livermore:
33.8%State:
31.5%
General health condition : Here:
58.6%California:
56.4%
Average condition of hearing : Here:
81.1%California:
80.9%
More about Health and Nutrition of Livermore, CA Residents
Local government employment and payroll (March 2022)
Function
Full-time employees
Monthly full-time payroll
Average yearly full-time wage
Part-time employees
Monthly part-time payroll
Police Protection - Officers
87 $1,151,797 $158,869 0 $0 Police - Other
66 $547,303 $99,510 11 $68,850 Streets and Highways
63 $668,508 $127,335 7 $37,431 Sewerage
51 $507,040 $119,304 3 $13,705 Other Government Administration
29 $355,375 $147,052 12 $20,332 Financial Administration
20 $227,007 $136,204 3 $29,042 Local Libraries
20 $187,306 $112,384 67 $118,407 Housing and Community Development (Local)
14 $195,506 $167,577 0 $0 Water Supply
13 $125,385 $115,740 3 $16,145 Parks and Recreation
13 $108,895 $100,518 3 $12,175 Other and Unallocable
12 $128,581 $128,581 0 $0 Airports
9 $88,216 $117,621 6 $11,974 Judicial and Legal
8 $122,595 $183,893 2 $11,273 Health
4 $47,660 $142,980 5 $22,994
Totals for Government
409 $4,461,174 $130,890 122 $362,328
Livermore government finances - Expenditure in 2018 (per resident):
Construction - Regular Highways: $10,916,000 ($128.88)
Housing and Community Development: $5,249,000 ($61.97)General - Other: $2,925,000 ($34.53)Sewerage: $2,524,000 ($29.80)Central Staff Services: $2,288,000 ($27.01)Solid Waste Management: $853,000 ($10.07)Air Transportation: $166,000 ($1.96)Current Operations - Police Protection: $41,505,000 ($490.02)
Sewerage: $20,352,000 ($240.28)Local Fire Protection: $19,611,000 ($231.53)Central Staff Services: $19,560,000 ($230.93)Regular Highways: $15,031,000 ($177.46)Water Utilities: $12,584,000 ($148.57)Protective Inspection and Regulation - Other: $9,418,000 ($111.19)Housing and Community Development: $8,046,000 ($94.99)Libraries: $4,679,000 ($55.24)Parks and Recreation: $3,886,000 ($45.88)Air Transportation: $2,513,000 ($29.67)Judicial and Legal Services: $1,337,000 ($15.78)Health - Other: $821,000 ($9.69)Solid Waste Management: $682,000 ($8.05)General - Interest on Debt: $2,982,000 ($35.21)
Intergovernmental to Local - Other - Water Utilities: $16,242,000 ($191.76)
Other - General - Other: $5,329,000 ($62.92)Other - Financial Administration: $617,000 ($7.28)Other - Housing and Community Development: $530,000 ($6.26)Other - Local Fire Protection: $322,000 ($3.80)Other - Health - Other: $276,000 ($3.26)Other - Natural Resources - Other: $116,000 ($1.37)Other Capital Outlay - General - Other: $6,112,000 ($72.16)
Water Utilities: $1,380,000 ($16.29)Air Transportation: $491,000 ($5.80)Parks and Recreation: $479,000 ($5.66)Water Utilities - Interest on Debt: $34,000 ($0.40)
Livermore government finances - Revenue in 2018 (per resident):
Charges - Sewerage: $25,170,000 ($297.16)
Other: $13,522,000 ($159.64)Parks and Recreation: $7,104,000 ($83.87)Housing and Community Development: $3,711,000 ($43.81)Air Transportation: $2,905,000 ($34.30)Regular Highways: $1,184,000 ($13.98)Solid Waste Management: $423,000 ($4.99)Federal Intergovernmental - Other: $2,788,000 ($32.92)
Housing and Community Development: $272,000 ($3.21)Local Intergovernmental - Other: $2,000 ($0.02)
Miscellaneous - Special Assessments: $12,876,000 ($152.02)
General Revenue - Other: $10,486,000 ($123.80)Donations From Private Sources: $8,709,000 ($102.82)Rents: $2,599,000 ($30.68)Fines and Forfeits: $2,354,000 ($27.79)Interest Earnings: $1,895,000 ($22.37)Revenue - Water Utilities: $15,739,000 ($185.82)
State Intergovernmental - Other: $3,139,000 ($37.06)
Highways: $2,296,000 ($27.11)General Local Government Support: $210,000 ($2.48)Tax - Property: $40,400,000 ($476.97)
General Sales and Gross Receipts: $33,866,000 ($399.83)Occupation and Business License - Other: $7,330,000 ($86.54)Other License: $5,499,000 ($64.92)Public Utilities Sales: $5,125,000 ($60.51)Other Selective Sales: $3,529,000 ($41.66)Documentary and Stock Transfer: $913,000 ($10.78)Other: $845,000 ($9.98)
Livermore government finances - Debt in 2018 (per resident):
Long Term Debt - Beginning Outstanding - Unspecified Public Purpose: $148,483,000 ($1753.03)
Outstanding Unspecified Public Purpose: $143,954,000 ($1699.55)Retired Unspecified Public Purpose: $8,587,000 ($101.38)Issue, Unspecified Public Purpose: $4,058,000 ($47.91)Beginning Outstanding - Public Debt for Private Purpose: $538,000 ($6.35)Outstanding Nonguaranteed - Industrial Revenue: $418,000 ($4.94)Retired Nonguaranteed - Public Debt for Private Purpose: $120,000 ($1.42)
Livermore government finances - Cash and Securities in 2018 (per resident):
Bond Funds - Cash and Securities: $47,080,000 ($555.84)
Other Funds - Cash and Securities: $156,318,000 ($1845.53)
Sinking Funds - Cash and Securities: $2,149,000 ($25.37)
6.77% of this county's 2021 resident taxpayers lived in other counties in 2020 ($121,106 average adjusted gross income )
Here:
6.77%California average:
5.19%
0.01% of residents moved from foreign countries ($76 average AGI )Alameda County:
0.01%California average:
0.03%
Top counties from which taxpayers relocated into this county between 2020 and 2021:
8.96% of this county's 2020 resident taxpayers moved to other counties in 2021 ($131,786 average adjusted gross income )
Here:
8.96%California average:
6.14%
0.01% of residents moved to foreign countries ($103 average AGI )Alameda County:
0.01%California average:
0.02%
Top counties to which taxpayers relocated from this county between 2020 and 2021:
Businesses in Livermore, CA
Name Count Name Count
24 Hour Fitness 1 Jamba Juice 2 7-Eleven 6 KFC 2 AT&T 2 Kohl's 1 Applebee's 1 Kroger 1 Audi 1 La Quinta 1 AutoZone 1 Lane Furniture 1 Baja Fresh Mexican Grill 1 Little Caesars Pizza 1 Baskin-Robbins 1 Lowe's 1 Best Western 1 Marriott 2 Big O Tires 1 MasterBrand Cabinets 5 Blockbuster 2 McDonald's 3 Budget Car Rental 1 Motel 6 1 Burger King 2 Nike 1 CVS 2 OfficeMax 1 Carl\s Jr. 3 Panda Express 2 Circle K 1 Payless 1 Cold Stone Creamery 1 Penske 1 Comfort Inn 1 Pizza Hut 1 Costco 1 Popeyes 1 Curves 1 Quality 1 DHL 1 Quiznos 2 Dairy Queen 1 RadioShack 2 Dennys 1 Rite Aid 2 Discount Tire 1 Sears 1 Domino's Pizza 1 Sprint Nextel 1 Extended Stay America 1 Starbucks 10 FedEx 9 Subaru 1 Ford 1 T-Mobile 3 GNC 3 Taco Bell 2 GameStop 2 Target 1 H&R Block 2 Toyota 1 Hawthorn 1 Trader Joe's 1 Hilton 3 U-Haul 4 Holiday Inn 1 UPS 12 Home Depot 1 Verizon Wireless 1 Honda 1 Vons 2 IHOP 1 Walmart 1 Jack In The Box 3 Wendy's 1
Strongest AM radio stations in Livermore:
KGO (810 AM; 50 kW; SAN FRANCISCO, CA; Owner: KGO-AM RADIO, INC.)
KTCT (1050 AM; 50 kW; SAN MATEO, CA; Owner: SUSQUEHANNA RADIO CORP.)
KFAX (1100 AM; 50 kW; SAN FRANCISCO, CA; Owner: GOLDEN GATE BROADCASTING CO, INC.)
KNBR (680 AM; 50 kW; SAN FRANCISCO, CA; Owner: KNBR LICO, INC.)
KLOK (1170 AM; 50 kW; SAN JOSE, CA; Owner: ENTRAVISION HOLDINGS, LLC)
KTRB (860 AM; 50 kW; MODESTO, CA; Owner: PAPPAS RADIO OF CALIFORNIA, A CALIFORNIA LIMITED PARTNERSHIP)
KYCY (1550 AM; 50 kW; SAN FRANCISCO, CA; Owner: INFINITY BROADCASTING OPERATIONS, INC.)
KIQI (1010 AM; 35 kW; SAN FRANCISCO, CA; Owner: RADIO UNICA OF SAN FRANCISCO LICENSE CORP.)
KCBC (770 AM; 50 kW; RIVERBANK, CA; Owner: KIERTRON, INC.)
KCBS (740 AM; 50 kW; SAN FRANCISCO, CA; Owner: INFINITY BROADCASTING OPERATIONS, INC.)
KNEW (910 AM; 20 kW; OAKLAND, CA; Owner: AMFM RADIO LICENSES, L.L.C.)
KHTK (1140 AM; 50 kW; SACRAMENTO, CA; Owner: INFINITY RADIO SUBSIDIARY OPERATIONS INC.)
KATD (990 AM; 10 kW; PITTSBURG, CA; Owner: RADIO UNICA OF SACRAMENTO LICENSE CORP.)
Strongest FM radio stations in Livermore:
KKSF-FM1 (103.7 FM; PLEASANTON, ETC., CA; Owner: AMFM RADIO LICENSES, L.L.C.)
KZBR-FM2 (95.7 FM; LIVERMORE, ETC., CA; Owner: BONNEVILLE HOLDING COMPANY)
KFRC-FM3 (99.7 FM; WALNUT CREEK, CA; Owner: INFINITY KFRC-FM, INC.)
KZBR-FM1 (95.7 FM; WALNUT CREEK, CA; Owner: BONNEVILLE HOLDING COMPANY)
KBLX-FM2 (102.9 FM; PLEASANTON, CA; Owner: ICBC BROADCAST HOLDINGS -CA, INC.)
KSOL-FM3 (98.9 FM; PLEASANTON, CA; Owner: TMS LICENSE CALIFORNIA, INC)
KISQ-FM3 (98.1 FM; CONCORD, CA; Owner: AMFM RADIO LICENSES, L.L.C.)
KMEL-FM1 (106.1 FM; CONCORD, CA; Owner: AMFM RADIO LICENSES, L.L.C.)
K238AC (95.5 FM; SALIDA, CA; Owner: FAMILY STATIONS, INC.)
K208CT (89.5 FM; LIVERMORE, CA; Owner: EDUCATIONAL MEDIA FOUNDATION)
KBAA (94.5 FM; GILROY, CA; Owner: INFINITY RADIO OPERATIONS INC.)
KUOP (91.3 FM; STOCKTON, CA; Owner: UNIVERSITY OF THE PACIFIC)
KKIQ (101.7 FM; LIVERMORE, CA; Owner: KKIQ,INC.)
KSQL (99.1 FM; SANTA CRUZ, CA; Owner: TMS LICENSE CALIFORNIA, INC)
KKUP (91.5 FM; CUPERTINO, CA; Owner: ASSURANCE SCIENCES FOUNDATION)
KBRG (100.3 FM; SAN JOSE, CA; Owner: ENTRAVISION HOLDINGS, LLC)
KOSO (93.1 FM; PATTERSON, CA; Owner: CAPSTAR TX LIMITED PARTNERSHIP)
KFJC (89.7 FM; LOS ALTOS, CA; Owner: FOOTHILL-DE ANZA COMM. COLLEGE DIST.)
KFJO (92.1 FM; WALNUT CREEK, CA; Owner: CHASE RADIO PROPERTIES, L.L.C.)
KLLC (97.3 FM; SAN FRANCISCO, CA; Owner: INFINITY BROADCASTING OPERATIONS, INC.)
TV broadcast stations around Livermore:
KBIT-CA (Channel 28; SAN FRANCISCO, ETC., CA; Owner: POLAR BROADCASTING, INC.)
KQED (Channel 9; SAN FRANCISCO, CA; Owner: KQED, INC.)
KICU-TV (Channel 36; SAN JOSE, CA; Owner: KTVU PARTNERSHIP)
KOVR (Channel 13; STOCKTON, CA; Owner: SCI - SACRAMENTO LICENSEE, LLC)
KXTV (Channel 10; SACRAMENTO, CA; Owner: KXTV, INC.)
KCRA-TV (Channel 3; SACRAMENTO, CA; Owner: KCRA HEARST-ARGYLE TELEVISION, INC.)
KUVS (Channel 19; MODESTO, CA; Owner: KUVS LICENSE PARTNERSHIP, G.P.)
KSPX (Channel 29; SACRAMENTO, CA; Owner: PAXSON SACRAMENTO LICENSE, INC.)
KTXL (Channel 40; SACRAMENTO, CA; Owner: CHANNEL 40, INC.)
KTEH (Channel 54; SAN JOSE, CA; Owner: KTEH FOUNDATION)
KQCA (Channel 58; STOCKTON, CA; Owner: KCRA HEARST-ARGYLE TELEVISION, INC.)
KVIE (Channel 6; SACRAMENTO, CA; Owner: KVIE, INC.)
KMAX-TV (Channel 31; SACRAMENTO, CA; Owner: UPN STATIONS GROUP INC.)
KDTV (Channel 14; SAN FRANCISCO, CA; Owner: KDTV LICENSE PARTNERSHIP, G.P.)
KSTS (Channel 48; SAN JOSE, CA; Owner: TELEMUNDO OF NORTHERN CALIFORNIA LICENSE CORP.)
KGO-TV (Channel 7; SAN FRANCISCO, CA; Owner: KGO TELEVISION, INC.)
KPIX-TV (Channel 5; SAN FRANCISCO, CA; Owner: CBS BROADCASTING INC.)
KTVU (Channel 2; OAKLAND, CA; Owner: KTVU PARTNERSHIP)
KRON-TV (Channel 4; SAN FRANCISCO, CA; Owner: YOUNG BROADCASTING OF SAN FRANCISCO, INC.)
KMTP-TV (Channel 32; SAN FRANCISCO, CA; Owner: MINORITY TELEVISION PROJECT)
KBHK-TV (Channel 44; SAN FRANCISCO, CA; Owner: VIACOM TELEVISION STATIONS GROUP OF SAN FRANCISCO INC.)
KTNC-TV (Channel 42; CONCORD, CA; Owner: KTNC LICENSE, LLC)
KBWB (Channel 20; SAN FRANCISCO, CA; Owner: KBWB LICENSE, INC.)
KFSF (Channel 66; VALLEJO, CA; Owner: TELEFUTURA SAN FRANCISCO LLC)
KCNS (Channel 38; SAN FRANCISCO, CA; Owner: WRAY, INC.)
National Bridge Inventory (NBI) Statistics 74 Number of bridges919ft / 280m Total length $5,512,000 Total costs3,590,117 Total average daily traffic389,660 Total average daily truck traffic
New bridges - historical statistics
2 1900-1909 2 1920-1929 3 1930-1939 1 1940-1949 2 1950-1959 15 1960-1969 18 1970-1979 11 1980-1989 5 1990-1999 8 2000-2009 7 2010-2019
See full National Bridge Inventory statistics for Livermore, CA
Home Mortgage Disclosure Act Aggregated Statistics For Year 2009(Based on 6 full and 7 partial tracts) A) FHA, FSA/RHS & VA B) Conventional C) Refinancings D) Home Improvement Loans E) Loans on Dwellings For 5+ Families F) Non-occupant Loans on G) Loans On Manufactured Number Average Value Number Average Value Number Average Value Number Average Value Number Average Value Number Average Value Number Average Value
LOANS ORIGINATED 313 $380,431 446 $332,059 2,332 $317,153 85 $209,650 4 $7,084,142 128 $233,435 2 $77,990 APPLICATIONS APPROVED, NOT ACCEPTED 32 $358,693 61 $336,416 222 $370,528 8 $139,628 0 $0 21 $266,633 2 $129,160 APPLICATIONS DENIED 35 $339,461 64 $347,608 504 $382,047 15 $163,265 0 $0 50 $283,724 8 $67,014 APPLICATIONS WITHDRAWN 29 $358,702 41 $331,546 336 $355,841 12 $158,622 0 $0 22 $285,548 2 $64,785 FILES CLOSED FOR INCOMPLETENESS 9 $375,399 12 $299,674 111 $374,594 4 $27,735 1 $1,091,200 7 $210,764 0 $0
Aggregated Statistics For Year 2008(Based on 6 full and 7 partial tracts) A) FHA, FSA/RHS & VA B) Conventional C) Refinancings D) Home Improvement Loans E) Loans on Dwellings For 5+ Families F) Non-occupant Loans on G) Loans On Manufactured Number Average Value Number Average Value Number Average Value Number Average Value Number Average Value Number Average Value Number Average Value
LOANS ORIGINATED 148 $413,843 575 $354,920 895 $336,268 107 $152,132 3 $913,920 131 $287,705 6 $91,708 APPLICATIONS APPROVED, NOT ACCEPTED 15 $371,623 116 $335,028 206 $375,601 14 $213,155 1 $269,470 25 $284,578 12 $88,862 APPLICATIONS DENIED 24 $414,946 136 $335,005 417 $379,034 84 $209,590 0 $0 59 $316,655 20 $77,750 APPLICATIONS WITHDRAWN 18 $399,121 78 $332,208 225 $381,322 24 $180,180 1 $3,186,020 34 $297,846 2 $53,035 FILES CLOSED FOR INCOMPLETENESS 5 $459,390 23 $329,918 78 $353,717 12 $171,497 0 $0 10 $330,824 0 $0
Aggregated Statistics For Year 2007(Based on 6 full and 7 partial tracts) A) FHA, FSA/RHS & VA B) Conventional C) Refinancings D) Home Improvement Loans E) Loans on Dwellings For 5+ Families F) Non-occupant Loans on G) Loans On Manufactured Number Average Value Number Average Value Number Average Value Number Average Value Number Average Value Number Average Value Number Average Value
LOANS ORIGINATED 0 $0 919 $411,345 1,654 $376,099 204 $228,561 6 $1,019,067 204 $322,693 8 $102,266 APPLICATIONS APPROVED, NOT ACCEPTED 0 $0 184 $367,974 377 $388,306 49 $200,418 0 $0 38 $322,804 8 $75,584 APPLICATIONS DENIED 1 $84,910 239 $376,477 806 $425,145 111 $277,245 0 $0 73 $352,972 12 $82,958 APPLICATIONS WITHDRAWN 0 $0 102 $367,759 326 $405,694 25 $199,656 0 $0 36 $337,476 1 $72,900 FILES CLOSED FOR INCOMPLETENESS 0 $0 34 $374,158 129 $407,039 8 $277,126 0 $0 4 $330,500 0 $0
Aggregated Statistics For Year 2006(Based on 6 full and 7 partial tracts) A) FHA, FSA/RHS & VA B) Conventional C) Refinancings D) Home Improvement Loans E) Loans on Dwellings For 5+ Families F) Non-occupant Loans on G) Loans On Manufactured Number Average Value Number Average Value Number Average Value Number Average Value Number Average Value Number Average Value Number Average Value
LOANS ORIGINATED 1 $118,940 1,427 $408,618 2,324 $391,061 292 $264,514 5 $1,846,000 301 $359,820 14 $80,086 APPLICATIONS APPROVED, NOT ACCEPTED 0 $0 253 $411,714 442 $366,768 63 $231,896 2 $500,000 57 $330,263 8 $88,066 APPLICATIONS DENIED 0 $0 481 $376,717 761 $428,497 118 $238,993 0 $0 78 $377,586 9 $181,279 APPLICATIONS WITHDRAWN 0 $0 171 $395,179 523 $413,235 46 $311,888 0 $0 50 $371,457 0 $0 FILES CLOSED FOR INCOMPLETENESS 0 $0 42 $387,385 130 $416,747 15 $193,550 0 $0 6 $366,167 0 $0
Aggregated Statistics For Year 2005(Based on 6 full and 7 partial tracts) A) FHA, FSA/RHS & VA B) Conventional C) Refinancings D) Home Improvement Loans E) Loans on Dwellings For 5+ Families F) Non-occupant Loans on G) Loans On Manufactured Number Average Value Number Average Value Number Average Value Number Average Value Number Average Value Number Average Value Number Average Value
LOANS ORIGINATED 1 $54,000 2,001 $392,978 3,039 $384,599 323 $267,696 7 $1,136,946 365 $350,716 5 $79,546 APPLICATIONS APPROVED, NOT ACCEPTED 0 $0 280 $410,094 424 $378,567 32 $247,009 0 $0 44 $333,760 3 $240,400 APPLICATIONS DENIED 0 $0 420 $386,805 769 $417,554 102 $235,957 0 $0 86 $382,717 17 $88,396 APPLICATIONS WITHDRAWN 0 $0 244 $401,750 619 $384,699 84 $249,185 0 $0 41 $360,631 6 $246,883 FILES CLOSED FOR INCOMPLETENESS 0 $0 64 $409,840 156 $379,348 13 $300,101 0 $0 7 $363,661 0 $0
Aggregated Statistics For Year 2004(Based on 6 full and 7 partial tracts) A) FHA, FSA/RHS & VA B) Conventional C) Refinancings D) Home Improvement Loans E) Loans on Dwellings For 5+ Families F) Non-occupant Loans on G) Loans On Manufactured Number Average Value Number Average Value Number Average Value Number Average Value Number Average Value Number Average Value Number Average Value
LOANS ORIGINATED 2 $237,865 2,137 $365,391 3,484 $323,151 265 $233,966 2 $790,000 394 $266,607 12 $89,747 APPLICATIONS APPROVED, NOT ACCEPTED 0 $0 310 $359,682 480 $330,043 35 $125,353 1 $895,000 48 $312,160 5 $155,092 APPLICATIONS DENIED 1 $109,120 325 $380,506 764 $332,977 98 $204,721 0 $0 72 $264,164 5 $163,588 APPLICATIONS WITHDRAWN 1 $138,420 256 $388,622 668 $319,471 62 $199,610 1 $274,720 40 $336,456 3 $180,907 FILES CLOSED FOR INCOMPLETENESS 1 $48,560 66 $384,886 152 $348,251 18 $131,913 0 $0 8 $304,711 0 $0
Aggregated Statistics For Year 2003(Based on 6 full and 7 partial tracts) A) FHA, FSA/RHS & VA B) Conventional C) Refinancings D) Home Improvement Loans E) Loans on Dwellings For 5+ Families F) Non-occupant Loans on Number Average Value Number Average Value Number Average Value Number Average Value Number Average Value Number Average Value
LOANS ORIGINATED 6 $201,740 1,807 $313,222 7,684 $268,165 85 $88,597 7 $3,569,763 513 $223,439 APPLICATIONS APPROVED, NOT ACCEPTED 2 $42,000 195 $336,944 915 $276,085 29 $64,816 0 $0 73 $252,828 APPLICATIONS DENIED 1 $64,330 188 $301,323 887 $293,174 64 $59,022 0 $0 63 $262,332 APPLICATIONS WITHDRAWN 1 $286,280 188 $328,091 970 $270,947 13 $91,625 1 $545,600 33 $234,633 FILES CLOSED FOR INCOMPLETENESS 0 $0 30 $349,902 201 $294,984 7 $128,143 0 $0 14 $194,342
Aggregated Statistics For Year 2002(Based on 1 partial tract) A) FHA, FSA/RHS & VA B) Conventional C) Refinancings D) Home Improvement Loans F) Non-occupant Loans on Number Average Value Number Average Value Number Average Value Number Average Value Number Average Value
LOANS ORIGINATED 1 $328,890 108 $231,441 413 $243,774 3 $73,163 18 $211,247 APPLICATIONS APPROVED, NOT ACCEPTED 1 $30,660 10 $238,724 52 $236,296 1 $20,900 1 $96,160 APPLICATIONS DENIED 0 $0 11 $182,055 43 $255,142 2 $11,150 3 $326,567 APPLICATIONS WITHDRAWN 3 $172,807 9 $245,738 61 $248,221 5 $67,450 2 $136,225 FILES CLOSED FOR INCOMPLETENESS 0 $0 4 $221,930 15 $243,601 0 $0 1 $273,840
Aggregated Statistics For Year 2001(Based on 1 partial tract) A) FHA, FSA/RHS & VA B) Conventional C) Refinancings D) Home Improvement Loans E) Loans on Dwellings For 5+ Families F) Non-occupant Loans on Number Average Value Number Average Value Number Average Value Number Average Value Number Average Value Number Average Value
LOANS ORIGINATED 2 $198,935 124 $229,775 443 $231,596 17 $59,228 1 $3,414,320 26 $209,522 APPLICATIONS APPROVED, NOT ACCEPTED 0 $0 19 $196,754 46 $240,820 1 $8,360 0 $0 1 $82,920 APPLICATIONS DENIED 0 $0 22 $168,277 62 $229,517 4 $58,358 0 $0 1 $172,810 APPLICATIONS WITHDRAWN 0 $0 17 $243,388 68 $233,684 1 $6,970 1 $20,764,640 2 $190,925 FILES CLOSED FOR INCOMPLETENESS 0 $0 3 $290,567 17 $252,446 0 $0 0 $0 1 $156,780
Aggregated Statistics For Year 2000(Based on 1 partial tract) A) FHA, FSA/RHS & VA B) Conventional C) Refinancings D) Home Improvement Loans F) Non-occupant Loans on Number Average Value Number Average Value Number Average Value Number Average Value Number Average Value
LOANS ORIGINATED 1 $147,720 164 $200,143 93 $176,021 17 $47,301 8 $166,796 APPLICATIONS APPROVED, NOT ACCEPTED 0 $0 24 $220,595 14 $168,825 3 $34,143 3 $201,840 APPLICATIONS DENIED 1 $145,630 24 $125,482 31 $159,882 7 $62,314 1 $69,680 APPLICATIONS WITHDRAWN 0 $0 13 $179,292 24 $147,025 1 $10,450 1 $34,840 FILES CLOSED FOR INCOMPLETENESS 0 $0 8 $184,826 10 $202,490 0 $0 0 $0
Aggregated Statistics For Year 1999(Based on 2 full and 4 partial tracts) A) FHA, FSA/RHS & VA B) Conventional C) Refinancings D) Home Improvement Loans E) Loans on Dwellings For 5+ Families F) Non-occupant Loans on Number Average Value Number Average Value Number Average Value Number Average Value Number Average Value Number Average Value
LOANS ORIGINATED 55 $188,505 1,511 $197,713 1,846 $182,082 185 $32,726 8 $306,345 177 $153,347 APPLICATIONS APPROVED, NOT ACCEPTED 7 $153,836 161 $191,170 278 $186,044 54 $33,744 1 $1,969,230 17 $159,855 APPLICATIONS DENIED 7 $140,570 182 $189,225 366 $159,622 66 $27,414 4 $464,708 11 $185,718 APPLICATIONS WITHDRAWN 6 $169,962 178 $169,732 373 $160,827 10 $83,916 2 $1,669,045 26 $150,972 FILES CLOSED FOR INCOMPLETENESS 1 $104,490 75 $203,352 156 $181,821 2 $44,560 3 $3,029,760 9 $176,227
Detailed mortgage data for all 13 tracts in Livermore, CA
Private Mortgage Insurance Companies Aggregated Statistics For Year 2009(Based on 6 full and 7 partial tracts) A) Conventional B) Refinancings Number Average Value Number Average Value
LOANS ORIGINATED 53 $344,970 15 $394,968 APPLICATIONS APPROVED, NOT ACCEPTED 10 $367,237 13 $418,720 APPLICATIONS DENIED 7 $278,657 5 $298,128 APPLICATIONS WITHDRAWN 3 $419,327 0 $0 FILES CLOSED FOR INCOMPLETENESS 2 $405,475 1 $388,000
Aggregated Statistics For Year 2008(Based on 6 full and 7 partial tracts) A) Conventional B) Refinancings C) Non-occupant Loans on Number Average Value Number Average Value Number Average Value
LOANS ORIGINATED 91 $368,672 11 $403,269 0 $0 APPLICATIONS APPROVED, NOT ACCEPTED 23 $445,211 20 $441,824 1 $357,660 APPLICATIONS DENIED 12 $500,219 7 $401,787 3 $425,780 APPLICATIONS WITHDRAWN 5 $442,038 2 $552,195 1 $575,000 FILES CLOSED FOR INCOMPLETENESS 1 $445,650 1 $193,140 0 $0
Aggregated Statistics For Year 2007(Based on 6 full and 7 partial tracts) A) Conventional B) Refinancings C) Non-occupant Loans on Number Average Value Number Average Value Number Average Value
LOANS ORIGINATED 31 $466,029 19 $486,874 2 $413,000 APPLICATIONS APPROVED, NOT ACCEPTED 4 $477,965 9 $466,411 1 $357,660 APPLICATIONS DENIED 0 $0 0 $0 0 $0 APPLICATIONS WITHDRAWN 1 $466,490 5 $590,930 0 $0 FILES CLOSED FOR INCOMPLETENESS 0 $0 1 $433,410 0 $0
Aggregated Statistics For Year 2006(Based on 5 full and 6 partial tracts) A) Conventional B) Refinancings C) Non-occupant Loans on Number Average Value Number Average Value Number Average Value
LOANS ORIGINATED 7 $471,704 9 $541,156 1 $839,240 APPLICATIONS APPROVED, NOT ACCEPTED 4 $477,715 6 $450,237 1 $359,860 APPLICATIONS DENIED 0 $0 3 $580,667 0 $0 APPLICATIONS WITHDRAWN 2 $413,670 2 $563,605 1 $339,340 FILES CLOSED FOR INCOMPLETENESS 0 $0 0 $0 0 $0
Aggregated Statistics For Year 2005(Based on 6 full and 6 partial tracts) A) Conventional B) Refinancings C) Non-occupant Loans on Number Average Value Number Average Value Number Average Value
LOANS ORIGINATED 10 $323,193 17 $489,967 2 $279,325 APPLICATIONS APPROVED, NOT ACCEPTED 0 $0 3 $407,070 0 $0 APPLICATIONS DENIED 2 $257,000 0 $0 0 $0 APPLICATIONS WITHDRAWN 0 $0 1 $221,430 0 $0 FILES CLOSED FOR INCOMPLETENESS 0 $0 0 $0 0 $0
Aggregated Statistics For Year 2004(Based on 6 full and 7 partial tracts) A) Conventional B) Refinancings C) Non-occupant Loans on Number Average Value Number Average Value Number Average Value
LOANS ORIGINATED 33 $375,017 16 $334,854 4 $280,058 APPLICATIONS APPROVED, NOT ACCEPTED 4 $321,322 12 $337,450 2 $353,000 APPLICATIONS DENIED 1 $246,670 0 $0 0 $0 APPLICATIONS WITHDRAWN 2 $482,885 2 $359,370 0 $0 FILES CLOSED FOR INCOMPLETENESS 0 $0 0 $0 0 $0
Aggregated Statistics For Year 2003(Based on 6 full and 7 partial tracts) A) Conventional B) Refinancings C) Non-occupant Loans on Number Average Value Number Average Value Number Average Value
LOANS ORIGINATED 54 $340,292 74 $323,571 3 $263,310 APPLICATIONS APPROVED, NOT ACCEPTED 9 $323,597 29 $296,670 2 $284,495 APPLICATIONS DENIED 0 $0 2 $332,965 0 $0 APPLICATIONS WITHDRAWN 3 $373,317 4 $335,075 0 $0 FILES CLOSED FOR INCOMPLETENESS 0 $0 0 $0 0 $0
Aggregated Statistics For Year 2002(Based on 1 partial tract) A) Conventional B) Refinancings Number Average Value Number Average Value
LOANS ORIGINATED 8 $332,984 5 $330,422 APPLICATIONS APPROVED, NOT ACCEPTED 1 $278,720 1 $370,000 APPLICATIONS DENIED 0 $0 0 $0 APPLICATIONS WITHDRAWN 0 $0 0 $0 FILES CLOSED FOR INCOMPLETENESS 1 $202,070 0 $0
Aggregated Statistics For Year 2001(Based on 1 partial tract) A) Conventional B) Refinancings Number Average Value Number Average Value
LOANS ORIGINATED 14 $301,914 6 $311,005 APPLICATIONS APPROVED, NOT ACCEPTED 1 $161,660 2 $346,660 APPLICATIONS DENIED 1 $187,440 0 $0 APPLICATIONS WITHDRAWN 1 $313,560 0 $0 FILES CLOSED FOR INCOMPLETENESS 0 $0 0 $0
Aggregated Statistics For Year 2000(Based on 1 partial tract) A) Conventional B) Refinancings C) Non-occupant Loans on Number Average Value Number Average Value Number Average Value
LOANS ORIGINATED 17 $287,286 8 $261,388 1 $209,040 APPLICATIONS APPROVED, NOT ACCEPTED 2 $254,680 1 $282,200 0 $0 APPLICATIONS DENIED 0 $0 0 $0 0 $0 APPLICATIONS WITHDRAWN 0 $0 0 $0 0 $0 FILES CLOSED FOR INCOMPLETENESS 0 $0 0 $0 0 $0
Aggregated Statistics For Year 1999(Based on 2 full and 4 partial tracts) A) Conventional B) Refinancings C) Non-occupant Loans on Number Average Value Number Average Value Number Average Value
LOANS ORIGINATED 229 $224,719 82 $192,695 8 $184,402 APPLICATIONS APPROVED, NOT ACCEPTED 20 $213,396 40 $185,406 2 $164,385 APPLICATIONS DENIED 3 $253,943 1 $267,600 0 $0 APPLICATIONS WITHDRAWN 10 $203,381 5 $204,734 3 $155,103 FILES CLOSED FOR INCOMPLETENESS 2 $192,710 3 $167,027 0 $0
Fire-safe hotels and motels in Livermore, California:
Residence Inn By Marriott, 1000 Airway Blvd, Livermore, California 94551 Phone: (800) 331-3131, Fax: (925) 373-7252
Extended Stay America - Livermore - Airway Blvd, 2380 Nissen Dr, Livermore, California 94550 Phone: (925) 373-1700, Fax: (925) 373-1710
Home2Suites by Hilton, 2625 Constitution Dr, Livermore, California 94551 Phone: (925) 960-1242, Fax: (925) 960-1252
Hilton Garden Inn Livermore, 2801 Constitution Dr, Livermore, California 94551 Phone: (925) 292-2000, Fax: (925) 292-2100
Courtyard By Marriott Livermore, 2929 Constitution Dr, Livermore, California 94550 Phone: (925) 243-1000, Fax: (925) 243-1010
Hawthorn Suites by Wyndham, 1700 N Livermore Ave, Livermore, California 94551 Phone: (925) 606-6060, Fax: (925) 606-8050
Holiday Inn Express Hotel & Suites, 3000 Constitution Dr, Livermore, California 94551 Phone: (925) 961-9600, Fax: (925) 961-9500
Quality Inn & Suites Livermore, 5959 Preston Ave, Livermore, California 94551 Phone: (925) 606-7171, Fax: (925) 606-7172
2 other hotels and motels
All 10 fire-safe hotels and motels in Livermore, California
Most common first names in Livermore, CA among deceased individuals Name Count Lived (average)
John 265 75.1 years Mary 254 80.0 years William 223 74.9 years Robert 195 70.1 years James 169 73.0 years George 136 74.8 years Charles 130 72.2 years Helen 109 80.1 years Margaret 98 77.8 years Frank 95 75.8 years
Most common last names in Livermore, CA among deceased individuals Last name Count Lived (average)
Smith 97 75.1 years Johnson 66 72.8 years Miller 54 72.2 years Anderson 51 75.9 years Brown 43 75.3 years Martin 38 74.3 years Silva 37 79.5 years Davis 34 73.9 years Wilson 34 72.8 years King 33 74.6 years
Livermore compared to California state average:
Median household income above state average. Median house value above state average. Unemployed percentage significantly below state average. Black race population percentage below state average. Hispanic race population percentage below state average. Median age above state average. Length of stay since moving in significantly below state average. Percentage of population with a bachelor's degree or higher above state average.
#7 on the list of "Top 101 cities with largest percentage of females in industries: construction (population 50,000+)"
#15 on the list of "Top 101 cities with largest percentage of females in occupations: business and financial operations occupations (population 50,000+)"
#15 on the list of "Top 101 cities with the lowest number of murders per 100,000 residents (population 50,000+)"
#26 on the list of "Top 101 cities with the largest humidity differences during a year (population 50,000+)"
#27 on the list of "Top 101 cities with the most people below the poverty level, excluding cities with 15% or more of residents in college and with the median age below 28 (population 50,000+)"
#27 on the list of "Top 101 cities with the largest differences between morning and afternoon humidity (population 50,000+)"
#27 on the list of "Top 101 cities with largest percentage of males in industries: construction (population 50,000+)"
#29 on the list of "Top 101 cities with the most local government spending on highway construction per resident (population 10,000+)"
#32 on the list of "Top 101 cities with largest percentage of females in industries: professional, scientific, and technical services (population 50,000+)"
#34 on the list of "Top 101 cities with the smallest percentage of high school students in private schools (3,000+ students)"
#36 on the list of "Top 101 cities with largest percentage of males in occupations: life, physical, and social science occupations (population 50,000+)"
#44 on the list of "Top 101 cities with largest percentage of males in industries: professional, scientific, and technical services (population 50,000+)"
#47 on the list of "Top 101 cities with the highest maximum monthly sunshine amount (population 50,000+)"
#52 on the list of "Top 101 cities with largest percentage of females in industries: management of companies and enterprises (population 50,000+)"
#53 on the list of "Top 101 cities with the most people below 50% of the poverty level, excluding cities with 15% or more of residents in college and with the median age below 28 (population 50,000+)"
#55 on the list of "Top 101 cities with largest percentage of females in occupations: management occupations (population 50,000+)"
#60 on the list of "Top 101 cities with the largest sunshine amount differences during a year (population 50,000+)"
#62 on the list of "Top 101 cities with largest percentage of males in occupations: architecture and engineering occupations (population 50,000+)"
#64 on the list of "Top 101 cities with largest percentage of males in occupations: sales and related occupations (population 50,000+)"
#64 on the list of "Top 101 cities with the lowest number of police officers per 1000 residents (population 50,000+)"
#11 on the list of "Top 101 counties with the lowest Ozone (1-hour) air pollution readings in 2012 (ppm)"
#17 on the list of "Top 101 counties with highest percentage of residents voting for Obama (Democrat) in the 2012 Presidential Election (pop. 50,000+)"
#18 on the list of "Top 101 counties with the most Other congregations"
#21 on the list of "Top 101 counties with the highest surface withdrawal of fresh water for public supply (pop. 50,000+)"
#22 on the list of "Top 101 counties with the highest percentage of residents that exercised in the past month"
Top Patent Applicants
Muriel Y. Ishikawa (1005)
Victoria Y.h. Wood (627)
Lowell L. Wood, Jr. (67)
Victoria Y. H. Wood (59)
Amit Gupta (52)
Gregory Scott Brewer (50)
Douglas A. Buchberger, Jr. (50)
Matthew J. Everett (44)
Brian James Buck (44)
Nisha Talagala (40)
Total of 4948 patent applications in 2008-2024.

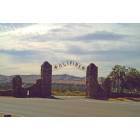
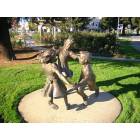
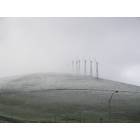
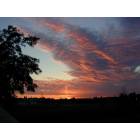
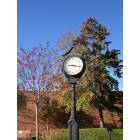
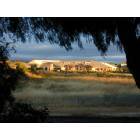
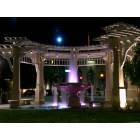
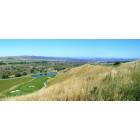
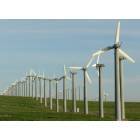
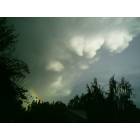
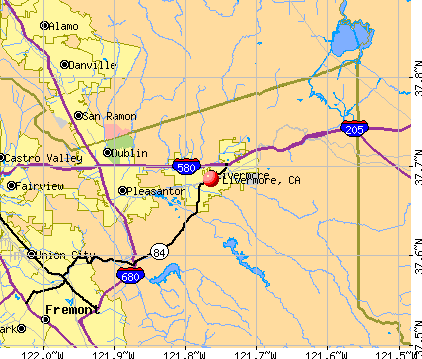


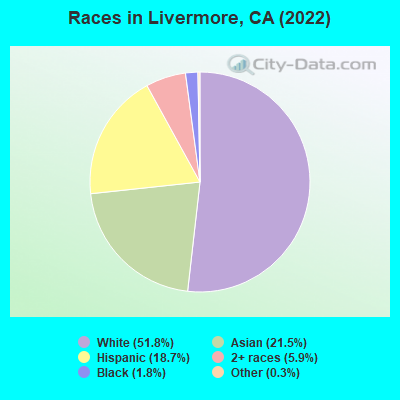
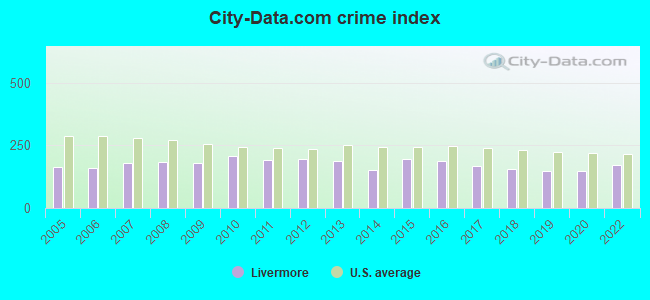
 Recent articles from our blog. Our writers, many of them Ph.D. graduates or candidates, create easy-to-read articles on a wide variety of topics.

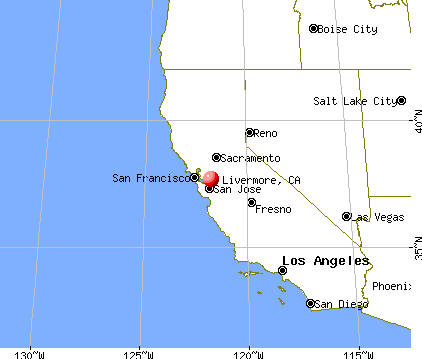
 (15.5 miles
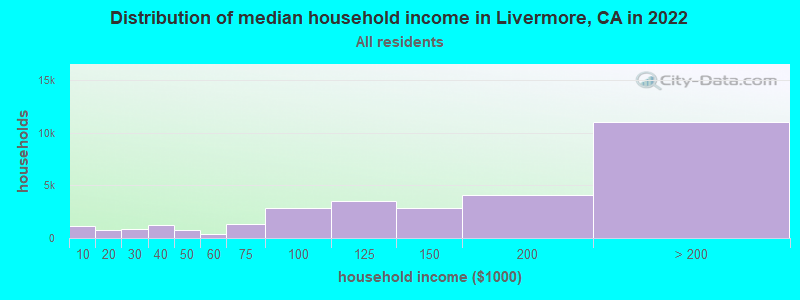
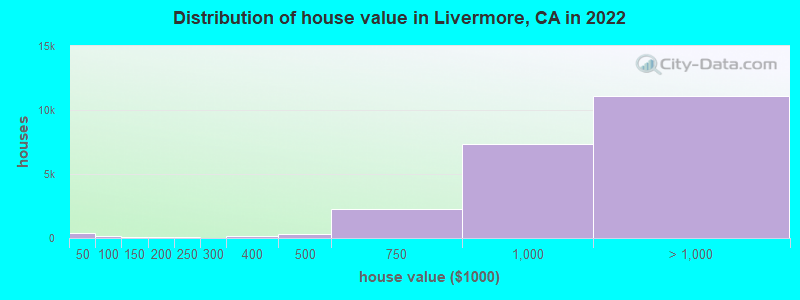
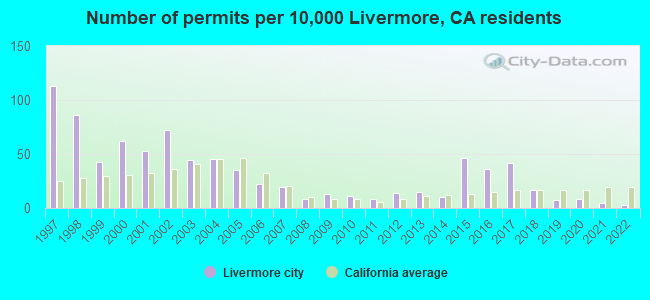
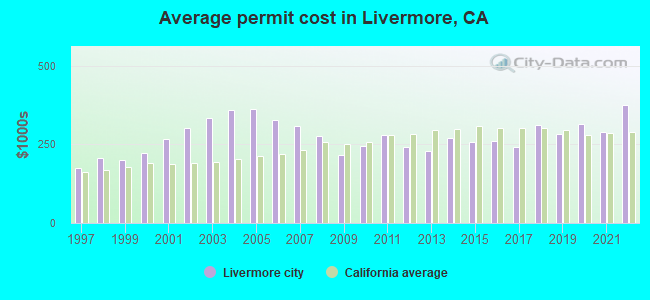
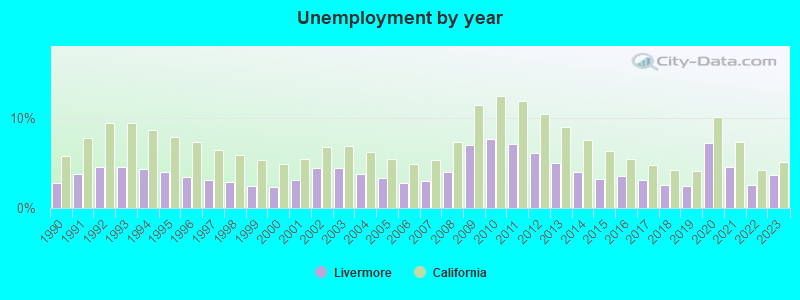
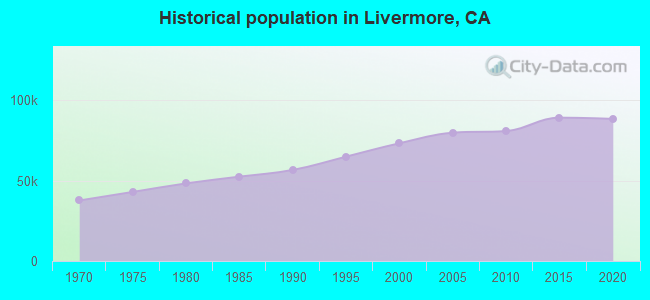
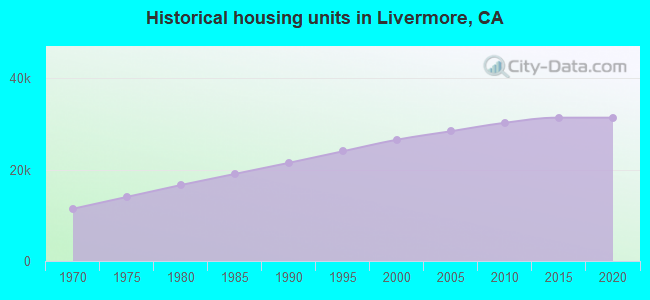
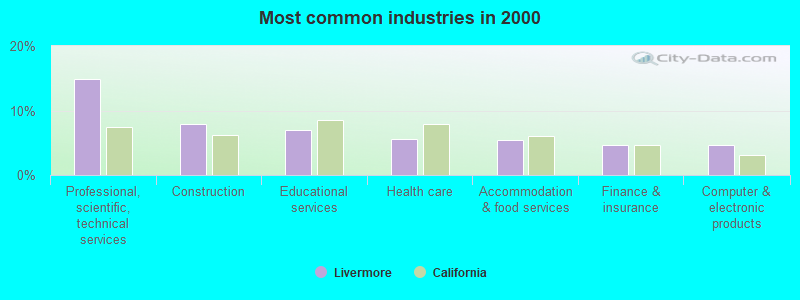
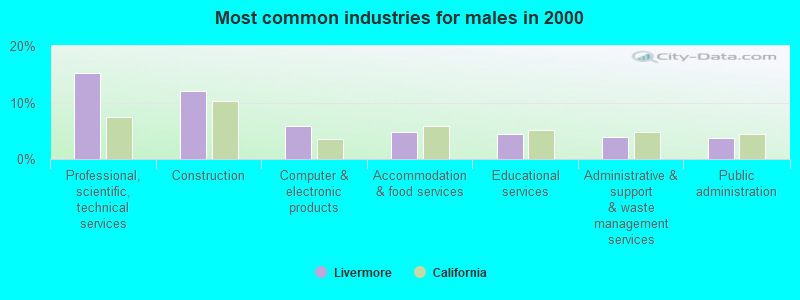
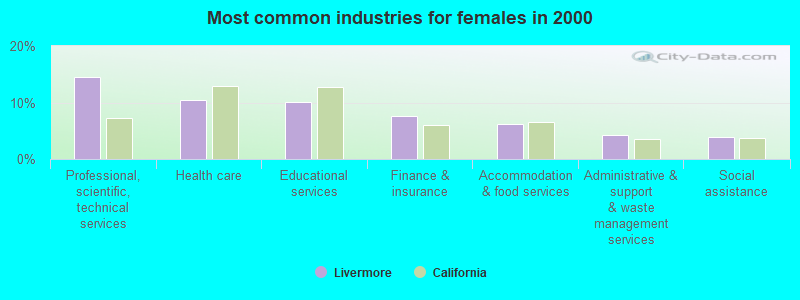
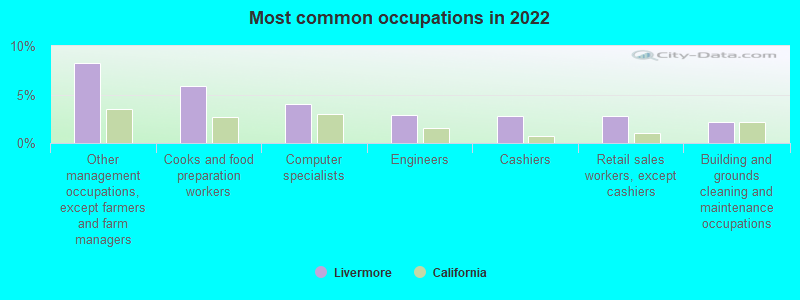
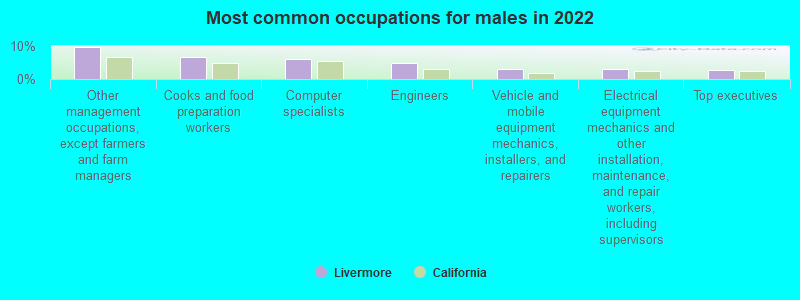
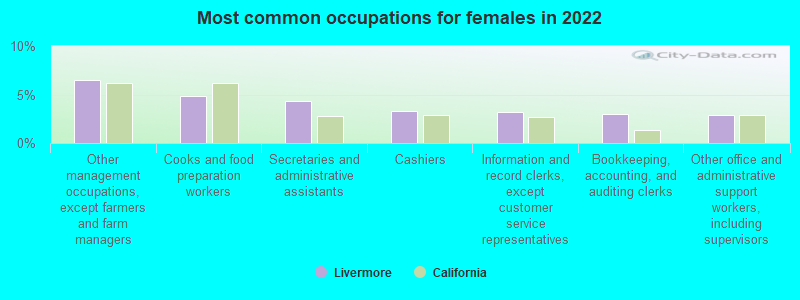
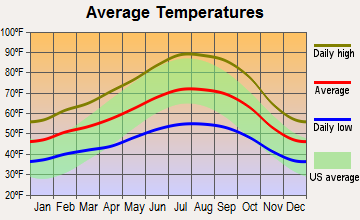
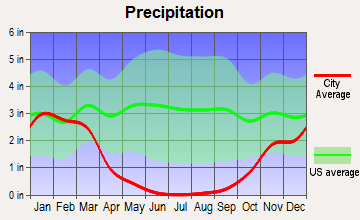
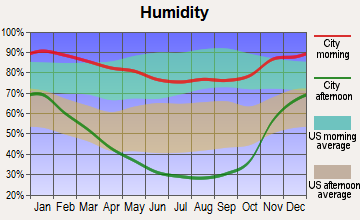
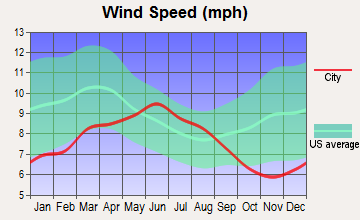
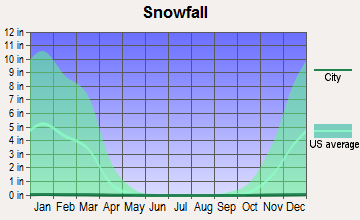
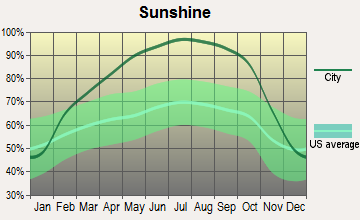
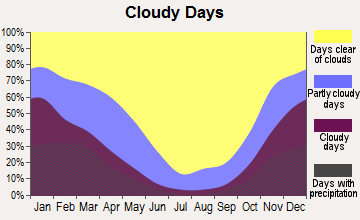
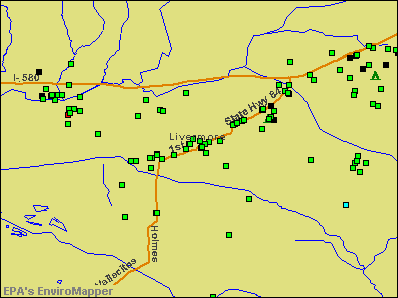

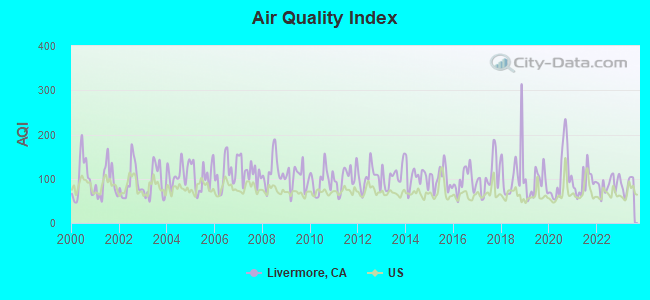
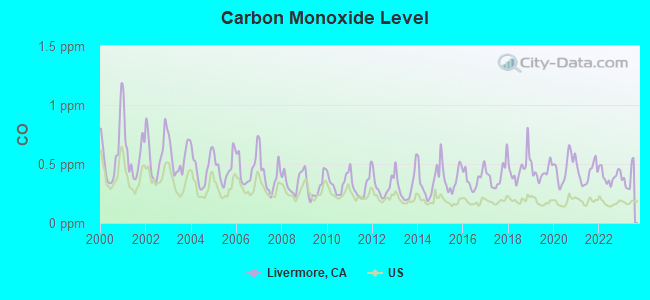
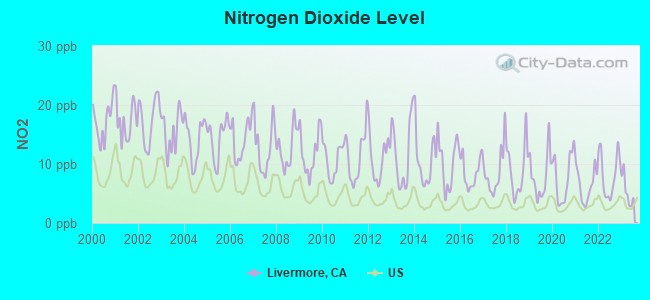
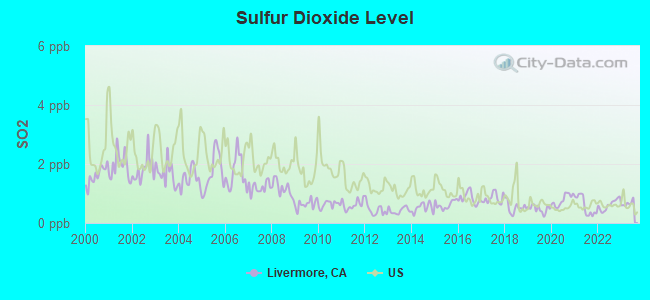
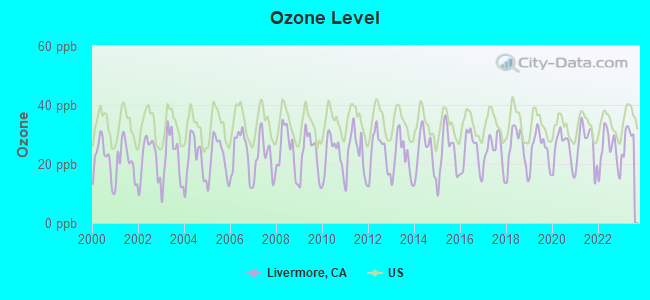
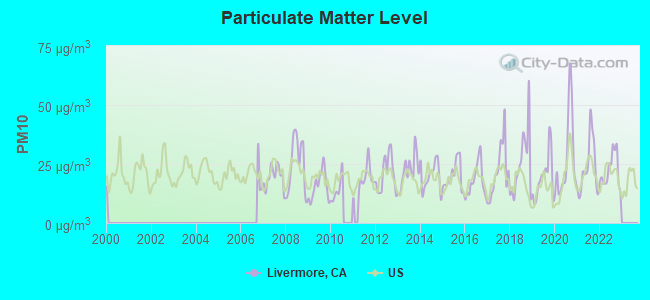
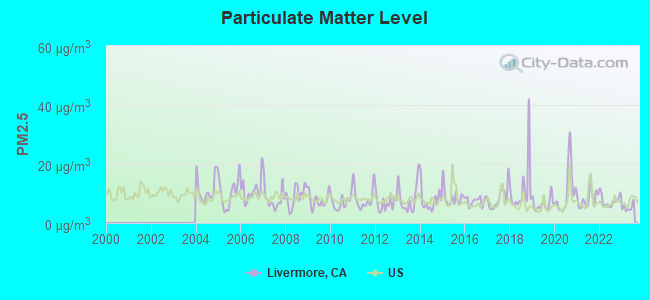
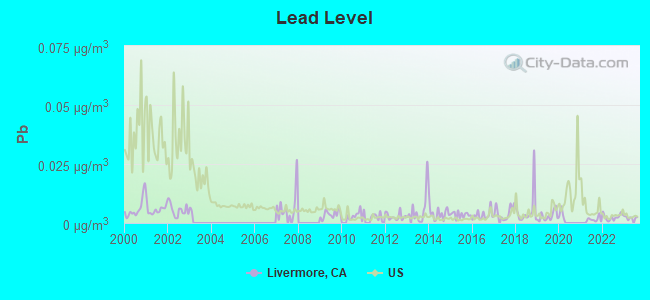

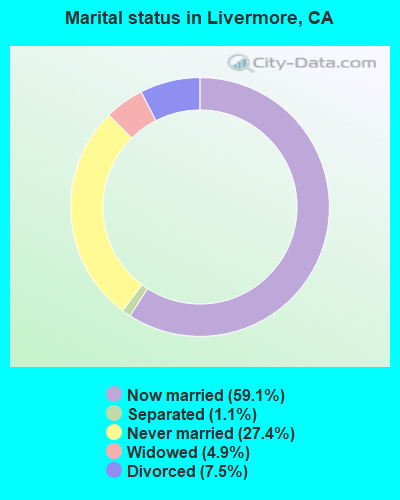
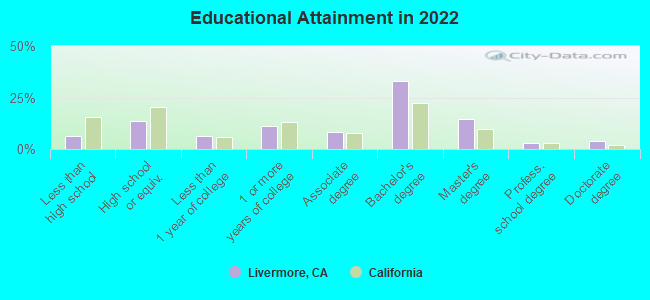
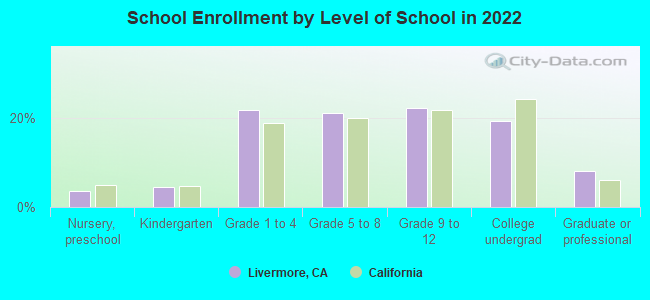
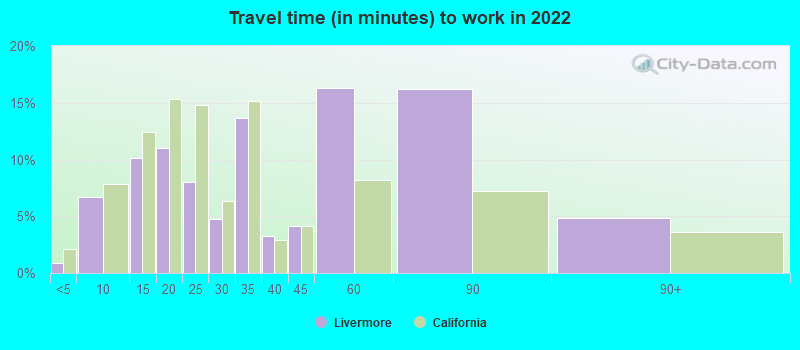
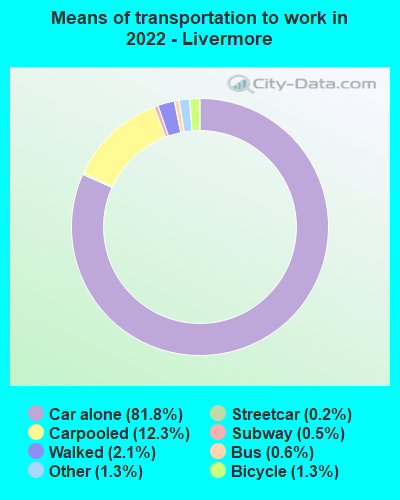
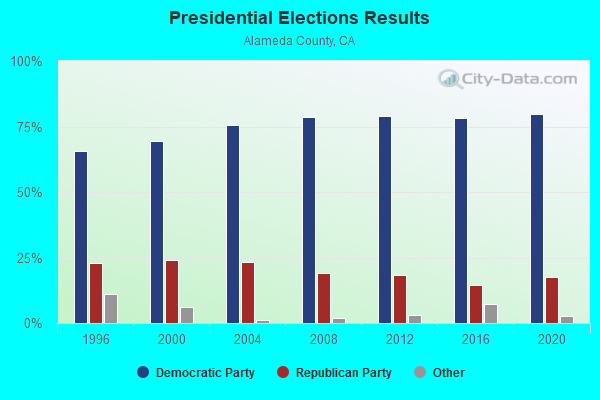
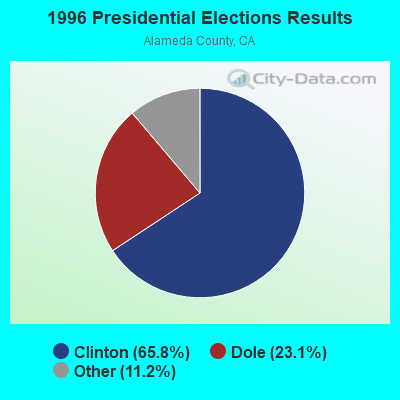
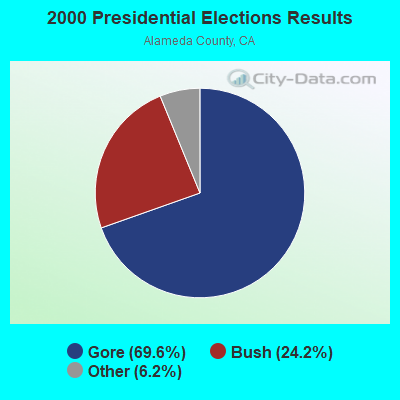
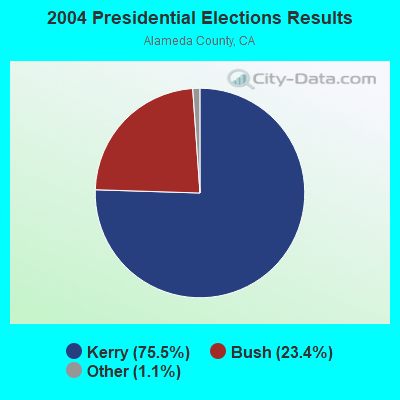
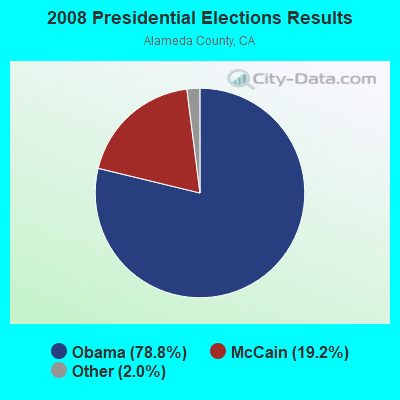

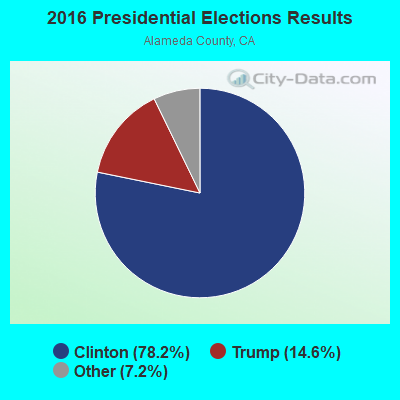
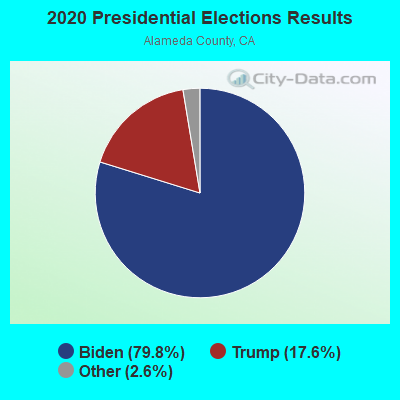
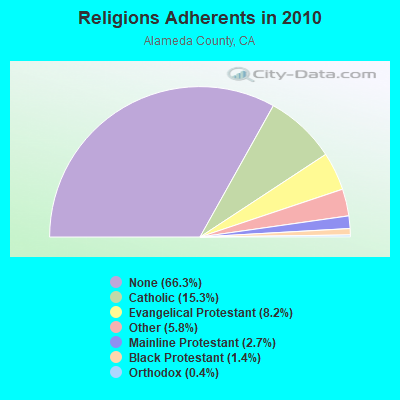
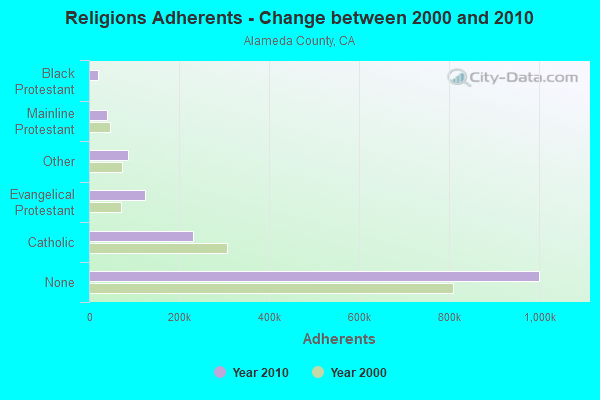
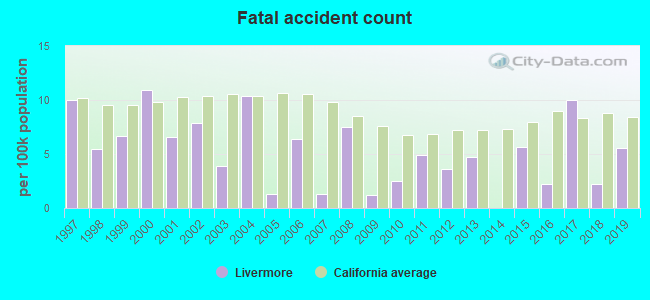
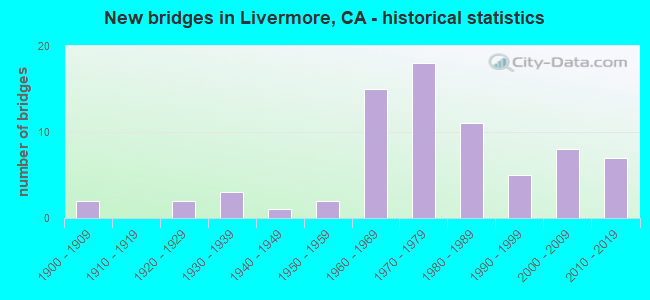
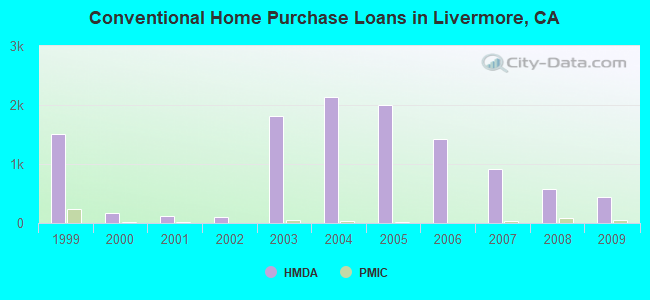
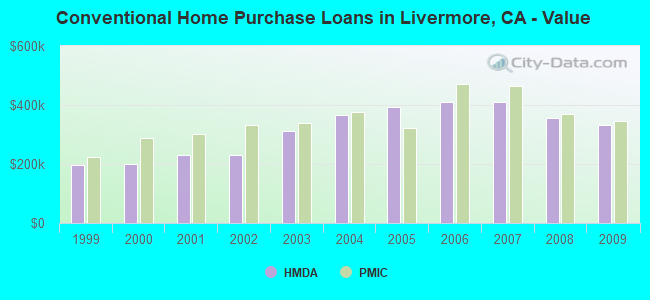
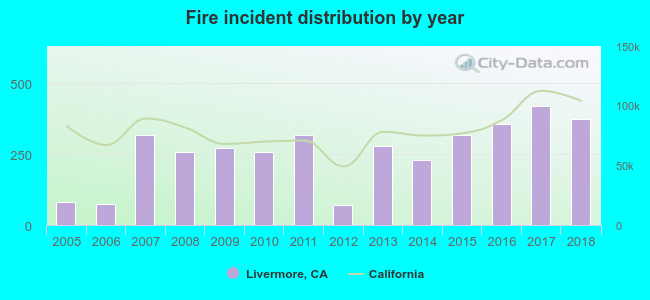 According to the data from the years 2005 - 2018 the average number of fires per year is 259. The highest number of reported fires - 421 took place in 2017, and the least - 71 in 2012. The data has a growing trend.
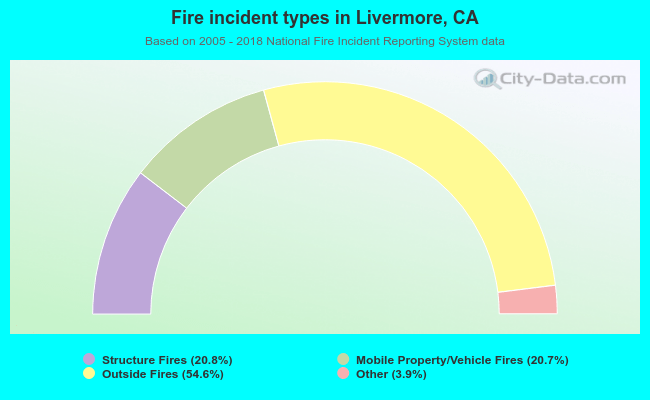 When looking into fire subcategories, the most incidents belonged to: Outside Fires (54.6%), and Structure Fires (20.8%).