Pleasant Hill, California Submit your own pictures of this city and show them to the world
OSM Map
General Map
Google Map
MSN Map
OSM Map
General Map
Google Map
MSN Map
OSM Map
General Map
Google Map
MSN Map
OSM Map
General Map
Google Map
MSN Map
Please wait while loading the map...
Population in 2022: 33,913 (100% urban, 0% rural). Population change since 2000: +3.3%Males: 16,693 Females: 17,220
March 2022 cost of living index in Pleasant Hill: 122.3 (high, U.S. average is 100) Percentage of residents living in poverty in 2022: 6.4%for White Non-Hispanic residents , 1.6% for Black residents , 14.1% for Hispanic or Latino residents , 7.9% for Native Hawaiian and other Pacific Islander residents , 10.6% for other race residents , 9.2% for two or more races residents )
Profiles of local businesses
Business Search - 14 Million verified businesses
Data:
Median household income ($)
Median household income (% change since 2000)
Household income diversity
Ratio of average income to average house value (%)
Ratio of average income to average rent
Median household income ($) - White
Median household income ($) - Black or African American
Median household income ($) - Asian
Median household income ($) - Hispanic or Latino
Median household income ($) - American Indian and Alaska Native
Median household income ($) - Multirace
Median household income ($) - Other Race
Median household income for houses/condos with a mortgage ($)
Median household income for apartments without a mortgage ($)
Races - White alone (%)
Races - White alone (% change since 2000)
Races - Black alone (%)
Races - Black alone (% change since 2000)
Races - American Indian alone (%)
Races - American Indian alone (% change since 2000)
Races - Asian alone (%)
Races - Asian alone (% change since 2000)
Races - Hispanic (%)
Races - Hispanic (% change since 2000)
Races - Native Hawaiian and Other Pacific Islander alone (%)
Races - Native Hawaiian and Other Pacific Islander alone (% change since 2000)
Races - Two or more races (%)
Races - Two or more races (% change since 2000)
Races - Other race alone (%)
Races - Other race alone (% change since 2000)
Racial diversity
Unemployment (%)
Unemployment (% change since 2000)
Unemployment (%) - White
Unemployment (%) - Black or African American
Unemployment (%) - Asian
Unemployment (%) - Hispanic or Latino
Unemployment (%) - American Indian and Alaska Native
Unemployment (%) - Multirace
Unemployment (%) - Other Race
Population density (people per square mile)
Population - Males (%)
Population - Females (%)
Population - Males (%) - White
Population - Males (%) - Black or African American
Population - Males (%) - Asian
Population - Males (%) - Hispanic or Latino
Population - Males (%) - American Indian and Alaska Native
Population - Males (%) - Multirace
Population - Males (%) - Other Race
Population - Females (%) - White
Population - Females (%) - Black or African American
Population - Females (%) - Asian
Population - Females (%) - Hispanic or Latino
Population - Females (%) - American Indian and Alaska Native
Population - Females (%) - Multirace
Population - Females (%) - Other Race
Coronavirus confirmed cases (Apr 27, 2024)
Deaths caused by coronavirus (Apr 27, 2024)
Coronavirus confirmed cases (per 100k population) (Apr 27, 2024)
Deaths caused by coronavirus (per 100k population) (Apr 27, 2024)
Daily increase in number of cases (Apr 27, 2024)
Weekly increase in number of cases (Apr 27, 2024)
Cases doubled (in days) (Apr 27, 2024)
Hospitalized patients (Apr 18, 2022)
Negative test results (Apr 18, 2022)
Total test results (Apr 18, 2022)
COVID Vaccine doses distributed (per 100k population) (Sep 19, 2023)
COVID Vaccine doses administered (per 100k population) (Sep 19, 2023)
COVID Vaccine doses distributed (Sep 19, 2023)
COVID Vaccine doses administered (Sep 19, 2023)
Likely homosexual households (%)
Likely homosexual households (% change since 2000)
Likely homosexual households - Lesbian couples (%)
Likely homosexual households - Lesbian couples (% change since 2000)
Likely homosexual households - Gay men (%)
Likely homosexual households - Gay men (% change since 2000)
Cost of living index
Median gross rent ($)
Median contract rent ($)
Median monthly housing costs ($)
Median house or condo value ($)
Median house or condo value ($ change since 2000)
Mean house or condo value by units in structure - 1, detached ($)
Mean house or condo value by units in structure - 1, attached ($)
Mean house or condo value by units in structure - 2 ($)
Mean house or condo value by units in structure by units in structure - 3 or 4 ($)
Mean house or condo value by units in structure - 5 or more ($)
Mean house or condo value by units in structure - Boat, RV, van, etc. ($)
Mean house or condo value by units in structure - Mobile home ($)
Median house or condo value ($) - White
Median house or condo value ($) - Black or African American
Median house or condo value ($) - Asian
Median house or condo value ($) - Hispanic or Latino
Median house or condo value ($) - American Indian and Alaska Native
Median house or condo value ($) - Multirace
Median house or condo value ($) - Other Race
Median resident age
Resident age diversity
Median resident age - Males
Median resident age - Females
Median resident age - White
Median resident age - Black or African American
Median resident age - Asian
Median resident age - Hispanic or Latino
Median resident age - American Indian and Alaska Native
Median resident age - Multirace
Median resident age - Other Race
Median resident age - Males - White
Median resident age - Males - Black or African American
Median resident age - Males - Asian
Median resident age - Males - Hispanic or Latino
Median resident age - Males - American Indian and Alaska Native
Median resident age - Males - Multirace
Median resident age - Males - Other Race
Median resident age - Females - White
Median resident age - Females - Black or African American
Median resident age - Females - Asian
Median resident age - Females - Hispanic or Latino
Median resident age - Females - American Indian and Alaska Native
Median resident age - Females - Multirace
Median resident age - Females - Other Race
Commute - mean travel time to work (minutes)
Travel time to work - Less than 5 minutes (%)
Travel time to work - Less than 5 minutes (% change since 2000)
Travel time to work - 5 to 9 minutes (%)
Travel time to work - 5 to 9 minutes (% change since 2000)
Travel time to work - 10 to 19 minutes (%)
Travel time to work - 10 to 19 minutes (% change since 2000)
Travel time to work - 20 to 29 minutes (%)
Travel time to work - 20 to 29 minutes (% change since 2000)
Travel time to work - 30 to 39 minutes (%)
Travel time to work - 30 to 39 minutes (% change since 2000)
Travel time to work - 40 to 59 minutes (%)
Travel time to work - 40 to 59 minutes (% change since 2000)
Travel time to work - 60 to 89 minutes (%)
Travel time to work - 60 to 89 minutes (% change since 2000)
Travel time to work - 90 or more minutes (%)
Travel time to work - 90 or more minutes (% change since 2000)
Marital status - Never married (%)
Marital status - Now married (%)
Marital status - Separated (%)
Marital status - Widowed (%)
Marital status - Divorced (%)
Median family income ($)
Median family income (% change since 2000)
Median non-family income ($)
Median non-family income (% change since 2000)
Median per capita income ($)
Median per capita income (% change since 2000)
Median family income ($) - White
Median family income ($) - Black or African American
Median family income ($) - Asian
Median family income ($) - Hispanic or Latino
Median family income ($) - American Indian and Alaska Native
Median family income ($) - Multirace
Median family income ($) - Other Race
Median year house/condo built
Median year apartment built
Year house built - Built 2005 or later (%)
Year house built - Built 2000 to 2004 (%)
Year house built - Built 1990 to 1999 (%)
Year house built - Built 1980 to 1989 (%)
Year house built - Built 1970 to 1979 (%)
Year house built - Built 1960 to 1969 (%)
Year house built - Built 1950 to 1959 (%)
Year house built - Built 1940 to 1949 (%)
Year house built - Built 1939 or earlier (%)
Average household size
Household density (households per square mile)
Average household size - White
Average household size - Black or African American
Average household size - Asian
Average household size - Hispanic or Latino
Average household size - American Indian and Alaska Native
Average household size - Multirace
Average household size - Other Race
Occupied housing units (%)
Vacant housing units (%)
Owner occupied housing units (%)
Renter occupied housing units (%)
Vacancy status - For rent (%)
Vacancy status - For sale only (%)
Vacancy status - Rented or sold, not occupied (%)
Vacancy status - For seasonal, recreational, or occasional use (%)
Vacancy status - For migrant workers (%)
Vacancy status - Other vacant (%)
Residents with income below the poverty level (%)
Residents with income below 50% of the poverty level (%)
Children below poverty level (%)
Poor families by family type - Married-couple family (%)
Poor families by family type - Male, no wife present (%)
Poor families by family type - Female, no husband present (%)
Poverty status for native-born residents (%)
Poverty status for foreign-born residents (%)
Poverty among high school graduates not in families (%)
Poverty among people who did not graduate high school not in families (%)
Residents with income below the poverty level (%) - White
Residents with income below the poverty level (%) - Black or African American
Residents with income below the poverty level (%) - Asian
Residents with income below the poverty level (%) - Hispanic or Latino
Residents with income below the poverty level (%) - American Indian and Alaska Native
Residents with income below the poverty level (%) - Multirace
Residents with income below the poverty level (%) - Other Race
Air pollution - Air Quality Index (AQI)
Air pollution - CO
Air pollution - NO2
Air pollution - SO2
Air pollution - Ozone
Air pollution - PM10
Air pollution - PM25
Air pollution - Pb
Crime - Murders per 100,000 population
Crime - Rapes per 100,000 population
Crime - Robberies per 100,000 population
Crime - Assaults per 100,000 population
Crime - Burglaries per 100,000 population
Crime - Thefts per 100,000 population
Crime - Auto thefts per 100,000 population
Crime - Arson per 100,000 population
Crime - City-data.com crime index
Crime - Violent crime index
Crime - Property crime index
Crime - Murders per 100,000 population (5 year average)
Crime - Rapes per 100,000 population (5 year average)
Crime - Robberies per 100,000 population (5 year average)
Crime - Assaults per 100,000 population (5 year average)
Crime - Burglaries per 100,000 population (5 year average)
Crime - Thefts per 100,000 population (5 year average)
Crime - Auto thefts per 100,000 population (5 year average)
Crime - Arson per 100,000 population (5 year average)
Crime - City-data.com crime index (5 year average)
Crime - Violent crime index (5 year average)
Crime - Property crime index (5 year average)
1996 Presidential Elections Results (%) - Democratic Party (Clinton)
1996 Presidential Elections Results (%) - Republican Party (Dole)
1996 Presidential Elections Results (%) - Other
2000 Presidential Elections Results (%) - Democratic Party (Gore)
2000 Presidential Elections Results (%) - Republican Party (Bush)
2000 Presidential Elections Results (%) - Other
2004 Presidential Elections Results (%) - Democratic Party (Kerry)
2004 Presidential Elections Results (%) - Republican Party (Bush)
2004 Presidential Elections Results (%) - Other
2008 Presidential Elections Results (%) - Democratic Party (Obama)
2008 Presidential Elections Results (%) - Republican Party (McCain)
2008 Presidential Elections Results (%) - Other
2012 Presidential Elections Results (%) - Democratic Party (Obama)
2012 Presidential Elections Results (%) - Republican Party (Romney)
2012 Presidential Elections Results (%) - Other
2016 Presidential Elections Results (%) - Democratic Party (Clinton)
2016 Presidential Elections Results (%) - Republican Party (Trump)
2016 Presidential Elections Results (%) - Other
2020 Presidential Elections Results (%) - Democratic Party (Biden)
2020 Presidential Elections Results (%) - Republican Party (Trump)
2020 Presidential Elections Results (%) - Other
Ancestries Reported - Arab (%)
Ancestries Reported - Czech (%)
Ancestries Reported - Danish (%)
Ancestries Reported - Dutch (%)
Ancestries Reported - English (%)
Ancestries Reported - French (%)
Ancestries Reported - French Canadian (%)
Ancestries Reported - German (%)
Ancestries Reported - Greek (%)
Ancestries Reported - Hungarian (%)
Ancestries Reported - Irish (%)
Ancestries Reported - Italian (%)
Ancestries Reported - Lithuanian (%)
Ancestries Reported - Norwegian (%)
Ancestries Reported - Polish (%)
Ancestries Reported - Portuguese (%)
Ancestries Reported - Russian (%)
Ancestries Reported - Scotch-Irish (%)
Ancestries Reported - Scottish (%)
Ancestries Reported - Slovak (%)
Ancestries Reported - Subsaharan African (%)
Ancestries Reported - Swedish (%)
Ancestries Reported - Swiss (%)
Ancestries Reported - Ukrainian (%)
Ancestries Reported - United States (%)
Ancestries Reported - Welsh (%)
Ancestries Reported - West Indian (%)
Ancestries Reported - Other (%)
Educational Attainment - No schooling completed (%)
Educational Attainment - Less than high school (%)
Educational Attainment - High school or equivalent (%)
Educational Attainment - Less than 1 year of college (%)
Educational Attainment - 1 or more years of college (%)
Educational Attainment - Associate degree (%)
Educational Attainment - Bachelor's degree (%)
Educational Attainment - Master's degree (%)
Educational Attainment - Professional school degree (%)
Educational Attainment - Doctorate degree (%)
School Enrollment - Nursery, preschool (%)
School Enrollment - Kindergarten (%)
School Enrollment - Grade 1 to 4 (%)
School Enrollment - Grade 5 to 8 (%)
School Enrollment - Grade 9 to 12 (%)
School Enrollment - College undergrad (%)
School Enrollment - Graduate or professional (%)
School Enrollment - Not enrolled in school (%)
School enrollment - Public schools (%)
School enrollment - Private schools (%)
School enrollment - Not enrolled (%)
Median number of rooms in houses and condos
Median number of rooms in apartments
Housing units lacking complete plumbing facilities (%)
Housing units lacking complete kitchen facilities (%)
Density of houses
Urban houses (%)
Rural houses (%)
Households with people 60 years and over (%)
Households with people 65 years and over (%)
Households with people 75 years and over (%)
Households with one or more nonrelatives (%)
Households with no nonrelatives (%)
Population in households (%)
Family households (%)
Nonfamily households (%)
Population in families (%)
Family households with own children (%)
Median number of bedrooms in owner occupied houses
Mean number of bedrooms in owner occupied houses
Median number of bedrooms in renter occupied houses
Mean number of bedrooms in renter occupied houses
Median number of vehichles in owner occupied houses
Mean number of vehichles in owner occupied houses
Median number of vehichles in renter occupied houses
Mean number of vehichles in renter occupied houses
Mortgage status - with mortgage (%)
Mortgage status - with second mortgage (%)
Mortgage status - with home equity loan (%)
Mortgage status - with both second mortgage and home equity loan (%)
Mortgage status - without a mortgage (%)
Average family size
Average family size - White
Average family size - Black or African American
Average family size - Asian
Average family size - Hispanic or Latino
Average family size - American Indian and Alaska Native
Average family size - Multirace
Average family size - Other Race
Geographical mobility - Same house 1 year ago (%)
Geographical mobility - Moved within same county (%)
Geographical mobility - Moved from different county within same state (%)
Geographical mobility - Moved from different state (%)
Geographical mobility - Moved from abroad (%)
Place of birth - Born in state of residence (%)
Place of birth - Born in other state (%)
Place of birth - Native, outside of US (%)
Place of birth - Foreign born (%)
Housing units in structures - 1, detached (%)
Housing units in structures - 1, attached (%)
Housing units in structures - 2 (%)
Housing units in structures - 3 or 4 (%)
Housing units in structures - 5 to 9 (%)
Housing units in structures - 10 to 19 (%)
Housing units in structures - 20 to 49 (%)
Housing units in structures - 50 or more (%)
Housing units in structures - Mobile home (%)
Housing units in structures - Boat, RV, van, etc. (%)
House/condo owner moved in on average (years ago)
Renter moved in on average (years ago)
Year householder moved into unit - Moved in 1999 to March 2000 (%)
Year householder moved into unit - Moved in 1995 to 1998 (%)
Year householder moved into unit - Moved in 1990 to 1994 (%)
Year householder moved into unit - Moved in 1980 to 1989 (%)
Year householder moved into unit - Moved in 1970 to 1979 (%)
Year householder moved into unit - Moved in 1969 or earlier (%)
Means of transportation to work - Drove car alone (%)
Means of transportation to work - Carpooled (%)
Means of transportation to work - Public transportation (%)
Means of transportation to work - Bus or trolley bus (%)
Means of transportation to work - Streetcar or trolley car (%)
Means of transportation to work - Subway or elevated (%)
Means of transportation to work - Railroad (%)
Means of transportation to work - Ferryboat (%)
Means of transportation to work - Taxicab (%)
Means of transportation to work - Motorcycle (%)
Means of transportation to work - Bicycle (%)
Means of transportation to work - Walked (%)
Means of transportation to work - Other means (%)
Working at home (%)
Industry diversity
Most Common Industries - Agriculture, forestry, fishing and hunting, and mining (%)
Most Common Industries - Agriculture, forestry, fishing and hunting (%)
Most Common Industries - Mining, quarrying, and oil and gas extraction (%)
Most Common Industries - Construction (%)
Most Common Industries - Manufacturing (%)
Most Common Industries - Wholesale trade (%)
Most Common Industries - Retail trade (%)
Most Common Industries - Transportation and warehousing, and utilities (%)
Most Common Industries - Transportation and warehousing (%)
Most Common Industries - Utilities (%)
Most Common Industries - Information (%)
Most Common Industries - Finance and insurance, and real estate and rental and leasing (%)
Most Common Industries - Finance and insurance (%)
Most Common Industries - Real estate and rental and leasing (%)
Most Common Industries - Professional, scientific, and management, and administrative and waste management services (%)
Most Common Industries - Professional, scientific, and technical services (%)
Most Common Industries - Management of companies and enterprises (%)
Most Common Industries - Administrative and support and waste management services (%)
Most Common Industries - Educational services, and health care and social assistance (%)
Most Common Industries - Educational services (%)
Most Common Industries - Health care and social assistance (%)
Most Common Industries - Arts, entertainment, and recreation, and accommodation and food services (%)
Most Common Industries - Arts, entertainment, and recreation (%)
Most Common Industries - Accommodation and food services (%)
Most Common Industries - Other services, except public administration (%)
Most Common Industries - Public administration (%)
Occupation diversity
Most Common Occupations - Management, business, science, and arts occupations (%)
Most Common Occupations - Management, business, and financial occupations (%)
Most Common Occupations - Management occupations (%)
Most Common Occupations - Business and financial operations occupations (%)
Most Common Occupations - Computer, engineering, and science occupations (%)
Most Common Occupations - Computer and mathematical occupations (%)
Most Common Occupations - Architecture and engineering occupations (%)
Most Common Occupations - Life, physical, and social science occupations (%)
Most Common Occupations - Education, legal, community service, arts, and media occupations (%)
Most Common Occupations - Community and social service occupations (%)
Most Common Occupations - Legal occupations (%)
Most Common Occupations - Education, training, and library occupations (%)
Most Common Occupations - Arts, design, entertainment, sports, and media occupations (%)
Most Common Occupations - Healthcare practitioners and technical occupations (%)
Most Common Occupations - Health diagnosing and treating practitioners and other technical occupations (%)
Most Common Occupations - Health technologists and technicians (%)
Most Common Occupations - Service occupations (%)
Most Common Occupations - Healthcare support occupations (%)
Most Common Occupations - Protective service occupations (%)
Most Common Occupations - Fire fighting and prevention, and other protective service workers including supervisors (%)
Most Common Occupations - Law enforcement workers including supervisors (%)
Most Common Occupations - Food preparation and serving related occupations (%)
Most Common Occupations - Building and grounds cleaning and maintenance occupations (%)
Most Common Occupations - Personal care and service occupations (%)
Most Common Occupations - Sales and office occupations (%)
Most Common Occupations - Sales and related occupations (%)
Most Common Occupations - Office and administrative support occupations (%)
Most Common Occupations - Natural resources, construction, and maintenance occupations (%)
Most Common Occupations - Farming, fishing, and forestry occupations (%)
Most Common Occupations - Construction and extraction occupations (%)
Most Common Occupations - Installation, maintenance, and repair occupations (%)
Most Common Occupations - Production, transportation, and material moving occupations (%)
Most Common Occupations - Production occupations (%)
Most Common Occupations - Transportation occupations (%)
Most Common Occupations - Material moving occupations (%)
People in Group quarters - Institutionalized population (%)
People in Group quarters - Correctional institutions (%)
People in Group quarters - Federal prisons and detention centers (%)
People in Group quarters - Halfway houses (%)
People in Group quarters - Local jails and other confinement facilities (including police lockups) (%)
People in Group quarters - Military disciplinary barracks (%)
People in Group quarters - State prisons (%)
People in Group quarters - Other types of correctional institutions (%)
People in Group quarters - Nursing homes (%)
People in Group quarters - Hospitals/wards, hospices, and schools for the handicapped (%)
People in Group quarters - Hospitals/wards and hospices for chronically ill (%)
People in Group quarters - Hospices or homes for chronically ill (%)
People in Group quarters - Military hospitals or wards for chronically ill (%)
People in Group quarters - Other hospitals or wards for chronically ill (%)
People in Group quarters - Hospitals or wards for drug/alcohol abuse (%)
People in Group quarters - Mental (Psychiatric) hospitals or wards (%)
People in Group quarters - Schools, hospitals, or wards for the mentally retarded (%)
People in Group quarters - Schools, hospitals, or wards for the physically handicapped (%)
People in Group quarters - Institutions for the deaf (%)
People in Group quarters - Institutions for the blind (%)
People in Group quarters - Orthopedic wards and institutions for the physically handicapped (%)
People in Group quarters - Wards in general hospitals for patients who have no usual home elsewhere (%)
People in Group quarters - Wards in military hospitals for patients who have no usual home elsewhere (%)
People in Group quarters - Juvenile institutions (%)
People in Group quarters - Long-term care (%)
People in Group quarters - Homes for abused, dependent, and neglected children (%)
People in Group quarters - Residential treatment centers for emotionally disturbed children (%)
People in Group quarters - Training schools for juvenile delinquents (%)
People in Group quarters - Short-term care, detention or diagnostic centers for delinquent children (%)
People in Group quarters - Type of juvenile institution unknown (%)
People in Group quarters - Noninstitutionalized population (%)
People in Group quarters - College dormitories (includes college quarters off campus) (%)
People in Group quarters - Military quarters (%)
People in Group quarters - On base (%)
People in Group quarters - Barracks, unaccompanied personnel housing (UPH), (Enlisted/Officer), ;and similar group living quarters for military personnel (%)
People in Group quarters - Transient quarters for temporary residents (%)
People in Group quarters - Military ships (%)
People in Group quarters - Group homes (%)
People in Group quarters - Homes or halfway houses for drug/alcohol abuse (%)
People in Group quarters - Homes for the mentally ill (%)
People in Group quarters - Homes for the mentally retarded (%)
People in Group quarters - Homes for the physically handicapped (%)
People in Group quarters - Other group homes (%)
People in Group quarters - Religious group quarters (%)
People in Group quarters - Dormitories (%)
People in Group quarters - Agriculture workers' dormitories on farms (%)
People in Group quarters - Job Corps and vocational training facilities (%)
People in Group quarters - Other workers' dormitories (%)
People in Group quarters - Crews of maritime vessels (%)
People in Group quarters - Other nonhousehold living situations (%)
People in Group quarters - Other noninstitutional group quarters (%)
Residents speaking English at home (%)
Residents speaking English at home - Born in the United States (%)
Residents speaking English at home - Native, born elsewhere (%)
Residents speaking English at home - Foreign born (%)
Residents speaking Spanish at home (%)
Residents speaking Spanish at home - Born in the United States (%)
Residents speaking Spanish at home - Native, born elsewhere (%)
Residents speaking Spanish at home - Foreign born (%)
Residents speaking other language at home (%)
Residents speaking other language at home - Born in the United States (%)
Residents speaking other language at home - Native, born elsewhere (%)
Residents speaking other language at home - Foreign born (%)
Class of Workers - Employee of private company (%)
Class of Workers - Self-employed in own incorporated business (%)
Class of Workers - Private not-for-profit wage and salary workers (%)
Class of Workers - Local government workers (%)
Class of Workers - State government workers (%)
Class of Workers - Federal government workers (%)
Class of Workers - Self-employed workers in own not incorporated business and Unpaid family workers (%)
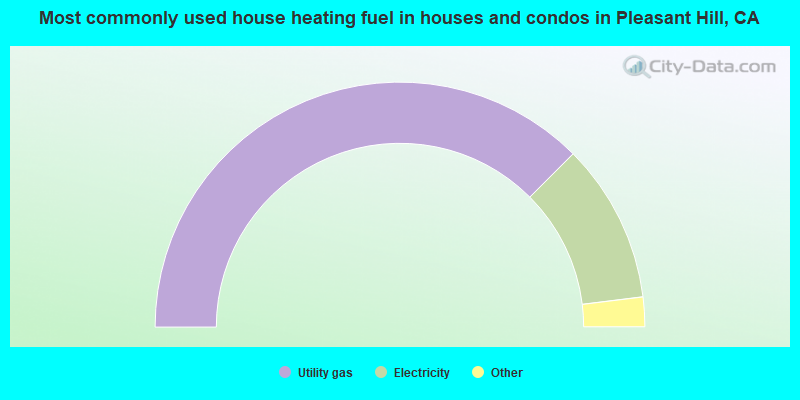
House heating fuel used in houses and condos - Utility gas (%)
House heating fuel used in houses and condos - Bottled, tank, or LP gas (%)
House heating fuel used in houses and condos - Electricity (%)
House heating fuel used in houses and condos - Fuel oil, kerosene, etc. (%)
House heating fuel used in houses and condos - Coal or coke (%)
House heating fuel used in houses and condos - Wood (%)
House heating fuel used in houses and condos - Solar energy (%)
House heating fuel used in houses and condos - Other fuel (%)
House heating fuel used in houses and condos - No fuel used (%)
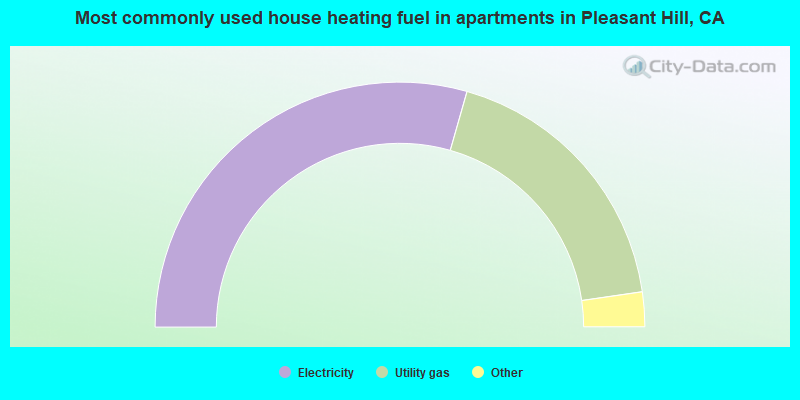
House heating fuel used in apartments - Utility gas (%)
House heating fuel used in apartments - Bottled, tank, or LP gas (%)
House heating fuel used in apartments - Electricity (%)
House heating fuel used in apartments - Fuel oil, kerosene, etc. (%)
House heating fuel used in apartments - Coal or coke (%)
House heating fuel used in apartments - Wood (%)
House heating fuel used in apartments - Solar energy (%)
House heating fuel used in apartments - Other fuel (%)
House heating fuel used in apartments - No fuel used (%)
Armed forces status - In Armed Forces (%)
Armed forces status - Civilian (%)
Armed forces status - Civilian - Veteran (%)
Armed forces status - Civilian - Nonveteran (%)
Fatal accidents locations in years 2005-2021
Fatal accidents locations in 2005
Fatal accidents locations in 2006
Fatal accidents locations in 2007
Fatal accidents locations in 2008
Fatal accidents locations in 2009
Fatal accidents locations in 2010
Fatal accidents locations in 2011
Fatal accidents locations in 2012
Fatal accidents locations in 2013
Fatal accidents locations in 2014
Fatal accidents locations in 2015
Fatal accidents locations in 2016
Fatal accidents locations in 2017
Fatal accidents locations in 2018
Fatal accidents locations in 2019
Fatal accidents locations in 2020
Fatal accidents locations in 2021
Alcohol use - People drinking some alcohol every month (%)
Alcohol use - People not drinking at all (%)
Alcohol use - Average days/month drinking alcohol
Alcohol use - Average drinks/week
Alcohol use - Average days/year people drink much
Audiometry - Average condition of hearing (%)
Audiometry - People that can hear a whisper from across a quiet room (%)
Audiometry - People that can hear normal voice from across a quiet room (%)
Audiometry - Ears ringing, roaring, buzzing (%)
Audiometry - Had a job exposure to loud noise (%)
Audiometry - Had off-work exposure to loud noise (%)
Blood Pressure & Cholesterol - Has high blood pressure (%)
Blood Pressure & Cholesterol - Checking blood pressure at home (%)
Blood Pressure & Cholesterol - Frequently checking blood cholesterol (%)
Blood Pressure & Cholesterol - Has high cholesterol level (%)
Consumer Behavior - Money monthly spent on food at supermarket/grocery store
Consumer Behavior - Money monthly spent on food at other stores
Consumer Behavior - Money monthly spent on eating out
Consumer Behavior - Money monthly spent on carryout/delivered foods
Consumer Behavior - Income spent on food at supermarket/grocery store (%)
Consumer Behavior - Income spent on food at other stores (%)
Consumer Behavior - Income spent on eating out (%)
Consumer Behavior - Income spent on carryout/delivered foods (%)
Current Health Status - General health condition (%)
Current Health Status - Blood donors (%)
Current Health Status - Has blood ever tested for HIV virus (%)
Current Health Status - Left-handed people (%)
Dermatology - People using sunscreen (%)
Diabetes - Diabetics (%)
Diabetes - Had a blood test for high blood sugar (%)
Diabetes - People taking insulin (%)
Diet Behavior & Nutrition - Diet health (%)
Diet Behavior & Nutrition - Milk product consumption (# of products/month)
Diet Behavior & Nutrition - Meals not home prepared (#/week)
Diet Behavior & Nutrition - Meals from fast food or pizza place (#/week)
Diet Behavior & Nutrition - Ready-to-eat foods (#/month)
Diet Behavior & Nutrition - Frozen meals/pizza (#/month)
Drug Use - People that ever used marijuana or hashish (%)
Drug Use - Ever used hard drugs (%)
Drug Use - Ever used any form of cocaine (%)
Drug Use - Ever used heroin (%)
Drug Use - Ever used methamphetamine (%)
Health Insurance - People covered by health insurance (%)
Kidney Conditions-Urology - Avg. # of times urinating at night
Medical Conditions - People with asthma (%)
Medical Conditions - People with anemia (%)
Medical Conditions - People with psoriasis (%)
Medical Conditions - People with overweight (%)
Medical Conditions - Elderly people having difficulties in thinking or remembering (%)
Medical Conditions - People who ever received blood transfusion (%)
Medical Conditions - People having trouble seeing even with glass/contacts (%)
Medical Conditions - People with arthritis (%)
Medical Conditions - People with gout (%)
Medical Conditions - People with congestive heart failure (%)
Medical Conditions - People with coronary heart disease (%)
Medical Conditions - People with angina pectoris (%)
Medical Conditions - People who ever had heart attack (%)
Medical Conditions - People who ever had stroke (%)
Medical Conditions - People with emphysema (%)
Medical Conditions - People with thyroid problem (%)
Medical Conditions - People with chronic bronchitis (%)
Medical Conditions - People with any liver condition (%)
Medical Conditions - People who ever had cancer or malignancy (%)
Mental Health - People who have little interest in doing things (%)
Mental Health - People feeling down, depressed, or hopeless (%)
Mental Health - People who have trouble sleeping or sleeping too much (%)
Mental Health - People feeling tired or having little energy (%)
Mental Health - People with poor appetite or overeating (%)
Mental Health - People feeling bad about themself (%)
Mental Health - People who have trouble concentrating on things (%)
Mental Health - People moving or speaking slowly or too fast (%)
Mental Health - People having thoughts they would be better off dead (%)
Oral Health - Average years since last visit a dentist
Oral Health - People embarrassed because of mouth (%)
Oral Health - People with gum disease (%)
Oral Health - General health of teeth and gums (%)
Oral Health - Average days a week using dental floss/device
Oral Health - Average days a week using mouthwash for dental problem
Oral Health - Average number of teeth
Pesticide Use - Households using pesticides to control insects (%)
Pesticide Use - Households using pesticides to kill weeds (%)
Physical Activity - People doing vigorous-intensity work activities (%)
Physical Activity - People doing moderate-intensity work activities (%)
Physical Activity - People walking or bicycling (%)
Physical Activity - People doing vigorous-intensity recreational activities (%)
Physical Activity - People doing moderate-intensity recreational activities (%)
Physical Activity - Average hours a day doing sedentary activities
Physical Activity - Average hours a day watching TV or videos
Physical Activity - Average hours a day using computer
Physical Functioning - People having limitations keeping them from working (%)
Physical Functioning - People limited in amount of work they can do (%)
Physical Functioning - People that need special equipment to walk (%)
Physical Functioning - People experiencing confusion/memory problems (%)
Physical Functioning - People requiring special healthcare equipment (%)
Prescription Medications - Average number of prescription medicines taking
Preventive Aspirin Use - Adults 40+ taking low-dose aspirin (%)
Reproductive Health - Vaginal deliveries (%)
Reproductive Health - Cesarean deliveries (%)
Reproductive Health - Deliveries resulted in a live birth (%)
Reproductive Health - Pregnancies resulted in a delivery (%)
Reproductive Health - Women breastfeeding newborns (%)
Reproductive Health - Women that had a hysterectomy (%)
Reproductive Health - Women that had both ovaries removed (%)
Reproductive Health - Women that have ever taken birth control pills (%)
Reproductive Health - Women taking birth control pills (%)
Reproductive Health - Women that have ever used Depo-Provera or injectables (%)
Reproductive Health - Women that have ever used female hormones (%)
Sexual Behavior - People 18+ that ever had sex (vaginal, anal, or oral) (%)
Sexual Behavior - Males 18+ that ever had vaginal sex with a woman (%)
Sexual Behavior - Males 18+ that ever performed oral sex on a woman (%)
Sexual Behavior - Males 18+ that ever had anal sex with a woman (%)
Sexual Behavior - Males 18+ that ever had any sex with a man (%)
Sexual Behavior - Females 18+ that ever had vaginal sex with a man (%)
Sexual Behavior - Females 18+ that ever performed oral sex on a man (%)
Sexual Behavior - Females 18+ that ever had anal sex with a man (%)
Sexual Behavior - Females 18+ that ever had any kind of sex with a woman (%)
Sexual Behavior - Average age people first had sex
Sexual Behavior - Average number of female sex partners in lifetime (males 18+)
Sexual Behavior - Average number of female vaginal sex partners in lifetime (males 18+)
Sexual Behavior - Average age people first performed oral sex on a woman (18+)
Sexual Behavior - Average number of woman performed oral sex on in lifetime (18+)
Sexual Behavior - Average number of male sex partners in lifetime (males 18+)
Sexual Behavior - Average number of male anal sex partners in lifetime (males 18+)
Sexual Behavior - Average age people first performed oral sex on a man (18+)
Sexual Behavior - Average number of male oral sex partners in lifetime (18+)
Sexual Behavior - People using protection when performing oral sex (%)
Sexual Behavior - Average number of times people have vaginal or anal sex a year
Sexual Behavior - People having sex without condom (%)
Sexual Behavior - Average number of male sex partners in lifetime (females 18+)
Sexual Behavior - Average number of male vaginal sex partners in lifetime (females 18+)
Sexual Behavior - Average number of female sex partners in lifetime (females 18+)
Sexual Behavior - Circumcised males 18+ (%)
Sleep Disorders - Average hours sleeping at night
Sleep Disorders - People that has trouble sleeping (%)
Smoking-Cigarette Use - People smoking cigarettes (%)
Taste & Smell - People 40+ having problems with smell (%)
Taste & Smell - People 40+ having problems with taste (%)
Taste & Smell - People 40+ that ever had wisdom teeth removed (%)
Taste & Smell - People 40+ that ever had tonsils teeth removed (%)
Taste & Smell - People 40+ that ever had a loss of consciousness because of a head injury (%)
Taste & Smell - People 40+ that ever had a broken nose or other serious injury to face or skull (%)
Taste & Smell - People 40+ that ever had two or more sinus infections (%)
Weight - Average height (inches)
Weight - Average weight (pounds)
Weight - Average BMI
Weight - People that are obese (%)
Weight - People that ever were obese (%)
Weight - People trying to lose weight (%)
18,798 54.7% White alone 5,987 17.4% Asian alone 4,862 14.2% Hispanic 2,331 6.8% Two or more races 1,340 3.9% Black alone 378 1.1% Other race alone 244 0.7% Native Hawaiian and Other 17 0.05% American Indian alone
According to our research of California and other state lists, there were 16 registered sex offenders living in Pleasant Hill, California as of April 27, 2024 . The ratio of all residents to sex offenders in Pleasant Hill is 2,202 to 1.The ratio of registered sex offenders to all residents in this city is much lower than the state average.
Officers per 1,000 residents here:
1.23California average:
2.30
Latest news from Pleasant Hill, CA collected exclusively by city-data.com from local newspapers, TV, and radio stations
Ancestries: English (4.4%), German (4.3%), Irish (4.2%), American (3.8%), Iranian (3.3%), European (3.1%).
Current Local Time:
Land area: 7.09 square miles.
Population density: 4,785 people per square mile (average).
6,631 residents are foreign born (11.7% Asia , 3.5% Europe , 2.2% Latin America ).
This city:
19.3%California:
26.5%
Median real estate property taxes paid for housing units with mortgages in 2022: $7,929 (0.7%)Median real estate property taxes paid for housing units with no mortgage in 2022: $5,113 (0.5%)
Nearest city with pop. 50,000+: Central Contra Costa, CA (2.7 miles
Nearest city with pop. 1,000,000+: Los Angeles, CA
Nearest cities:
Latitude: 37.95 N, Longitude: 122.07 W
Daytime population change due to commuting: -802 (-2.3%)Workers who live and work in this city: 6,239 (34.2%)
Area code commonly used in this area: 925
Single-family new house construction building permits:
2021: 11 buildings , average cost: $374,3002020: 14 buildings , average cost: $327,4002019: 20 buildings , average cost: $319,4002018: 37 buildings , average cost: $339,4002017: 2 buildings , average cost: $351,6002016: 6 buildings , average cost: $400,4002015: 3 buildings , average cost: $386,7002014: 2 buildings , average cost: $370,4002013: 3 buildings , average cost: $269,3002012: 3 buildings , average cost: $301,2002011: 6 buildings , average cost: $311,5002010: 2 buildings , average cost: $234,1002008: 1 building , cost: $476,4002007: 6 buildings , average cost: $371,1002006: 3 buildings , average cost: $303,2002005: 12 buildings , average cost: $271,2002004: 3 buildings , average cost: $371,7002003: 3 buildings , average cost: $275,1002002: 112 buildings , average cost: $200,3002001: 48 buildings , average cost: $173,0002000: 49 buildings , average cost: $219,5001999: 66 buildings , average cost: $234,5001998: 47 buildings , average cost: $244,3001997: 63 buildings , average cost: $244,400Unemployment in December 2023:
Population change in the 1990s: +723 (+2.3%).
Most common occupations in Pleasant Hill, CA (%)
Both Males Females
Other management occupations, except farmers and farm managers (5.3%)
Computer specialists (5.3%)
Other office and administrative support workers, including supervisors (4.3%)
Other sales and related occupations, including supervisors (4.2%)
Sales representatives, services, wholesale and manufacturing (3.8%)
Retail sales workers, except cashiers (3.6%)
Preschool, kindergarten, elementary, and middle school teachers (3.0%)
Computer specialists (6.7%)
Other management occupations, except farmers and farm managers (5.7%)
Sales representatives, services, wholesale and manufacturing (5.0%)
Other sales and related occupations, including supervisors (4.8%)
Retail sales workers, except cashiers (4.5%)
Engineers (4.4%)
Top executives (3.1%)
Other office and administrative support workers, including supervisors (7.2%)
Secretaries and administrative assistants (5.6%)
Other management occupations, except farmers and farm managers (4.8%)
Preschool, kindergarten, elementary, and middle school teachers (4.7%)
Computer specialists (3.7%)
Registered nurses (3.7%)
Other sales and related occupations, including supervisors (3.6%)
Earthquake activity:
Pleasant Hill-area historical earthquake activity is significantly above California state average. It is 7674% greater than the overall U.S. average. On 4/18/1906 at 13:12:21, a magnitude 7.9 (7.9 UK, Class: Major, Intensity: VIII - XII) earthquake occurred 50.7 miles away from Pleasant Hill center, causing $524,000,000 total damage On 10/18/1989 at 00:04:15, a magnitude 7.1 (6.5 MB, 7.1 MS, 6.9 MW, 7.0 ML) earthquake occurred 60.5 miles away from the city center, causing 62 deaths ( 62 shaking deaths) and 3757 injuries, causing $1,305,032,704 total damage On 11/4/1927 at 13:51:53, a magnitude 7.5 (7.5 UK) earthquake occurred 217.9 miles away from the city center On 7/21/1952 at 11:52:14, a magnitude 7.7 (7.7 UK) earthquake occurred 266.2 miles away from the city center, causing $50,000,000 total damage On 1/31/1922 at 13:17:28, a magnitude 7.6 (7.6 UK) earthquake occurred 266.1 miles away from Pleasant Hill center On 4/25/1992 at 18:06:04, a magnitude 7.2 (6.3 MB, 7.1 MS, 7.2 MW, 7.1 MW, Depth: 9.4 mi) earthquake occurred 197.4 miles away from Pleasant Hill center, causing $75,000,000 total damage Magnitude types: body-wave magnitude (MB), local magnitude (ML), surface-wave magnitude (MS), moment magnitude (MW) Natural disasters: The number of natural disasters in Contra Costa County (18) is near the US average (15).Major Disasters (Presidential) Declared: 11Emergencies Declared: 3Floods: 13, Storms: 7, Winter Storms: 7, Mudslides: 5, Landslides: 4, Drought: 1, Earthquake: 1, Hurricane: 1, Tornado: 1, Wind: 1, Other: 1 (Note: some incidents may be assigned to more than one category). Hospitals and medical centers in Pleasant Hill: HOSPICE OF THE EAST BAY (3470 BUSKIRK AVENUE) OAK PARK CONVALESCENT HOSPITAL (1625 OAK PARK BLVD.)
SUN VALLEY MANOR (540 PATTERSON BLVD)
WINDSOR ROSEWOOD CARE CENTER (1911 OAK PARK BLVD.)
FMC DIABLO CONCORD (508 CONTRA COSTA BLVD #D)
Amtrak stations near Pleasant Hill: 6 miles: MARTINEZ (401 FERRY ST.) Services: ticket office, fully wheelchair accessible, enclosed waiting area, public restrooms, public payphones, full-service food facilities, free short-term parking, free long-term parking, call for taxi service, public transit connection.
14 miles: BERKELEY (3RD ST. & UNIVERSITY AVE.) Services: partially wheelchair accessible, public payphones, free short-term parking, free long-term parking, call for taxi service, public transit connection.
15 miles: EMERYVILLE (5885 LANDREGAN ST.) Services: ticket office, fully wheelchair accessible, enclosed waiting area, public restrooms, public payphones, snack bar, free short-term parking, free long-term parking, call for taxi service, public transit connection.
Colleges/Universities in Pleasant Hill: Diablo Valley College Full-time enrollment: 13,015; Location: 321 Golf Club Rd; Public; Website: www.dvc.edu)
John F Kennedy University Full-time enrollment: 961; Location: 100 Ellinwood Way; Private, not-for-profit; Website: www.jfku.edu; Offers Doctor's degree )
Paul Mitchell the School-East Bay Full-time enrollment: 458; Location: 100 Crescent Dr., Suite D; Private, for-profit; Website: school.paulmitchell.edu/east-bay-ca)
Carrington College California-Pleasant Hill Full-time enrollment: 367; Location: 380 Civic Dr., Ste. 300; Private, for-profit; Website: www.carrington.edu)
Other colleges/universities with over 2000 students near Pleasant Hill:
Saint Mary's College of California (about 8 miles; Moraga, CA ; Full-time enrollment: 4,200)
University of California-Berkeley (about 12 miles; Berkeley, CA ; FT enrollment: 37,127)
Los Medanos College (about 13 miles; Pittsburg, CA ; FT enrollment: 5,289)
Berkeley City College (about 13 miles; Berkeley, CA ; FT enrollment: 3,146)
Merritt College (about 13 miles; Oakland, CA ; FT enrollment: 2,842)
Contra Costa College (about 15 miles; San Pablo, CA ; FT enrollment: 4,249)
Laney College (about 15 miles; Oakland, CA ; FT enrollment: 5,668)
Public high schools in Pleasant Hill:
Private high schools in Pleasant Hill:
Public elementary/middle schools in Pleasant Hill: PLEASANT HILL MIDDLE Students: 792, Location: 1 SANTA BARBARA RD., Grades: 6-8)VALLEY VIEW MIDDLE Students: 717, Location: 181 VIKING DR., Grades: 6-8)STRANDWOOD ELEMENTARY Students: 383, Location: 416 GLADYS DR., Grades: KG-5)PLEASANT HILL ELEMENTARY Students: 374, Location: 2097 OAK PARK BLVD., Grades: KG-5)VALHALLA ELEMENTARY Students: 349, Location: 530 KIKI DR., Grades: KG-5)GREGORY GARDENS ELEMENTARY Students: 239, Location: 1 CORRITONE CT., Grades: KG-5)FAIR OAKS ELEMENTARY Students: 183, Location: 2400 LISA LN., Grades: KG-5)SEQUOIA ELEMENTARY Location: 277 BOYD RD., Grades: KG-5)
SEQUOIA MIDDLE Location: 265 BOYD RD., Grades: 6-8)
Private elementary/middle school in Pleasant Hill: CHRIST THE KING CATHOLIC SCHOOL Students: 324, Location: 195 B BRANDON RD, Grades: KG-8)
See full list of schools located in Pleasant Hill Library in Pleasant Hill: CONTRA COSTA COUNTY LIBRARY Operating income: $26,374,959; Location: 1750 OAK PARK BOULEVARD; 1,295,780 books ; 16,252 e-books ; 72,375 audio materials ; 81,221 video materials ; 30 local licensed databases ; 18 other licensed databases ; 4,739 print serial subscriptions )
Notable locations in Pleasant Hill: (A) , Meadowbrook Golf Club (B) , Pleasant Hill City Hall (C) , Central Branch Contra Costa County Library (D) , Contra Costa County Fire Protection District Station 5 (E) , Contra Costa County Fire Protection District Station 2 (F) . Display/hide their locations on the map
Shopping Centers: (1) , Pleasant Hill Plaza Shopping Center (2) , Gregory Village Shopping Center (3) , College Square Shopping Center (4) . Display/hide their locations on the map
Churches in Pleasant Hill include: (A) , Christ the King Roman Catholic Church (B) , Saint Andrew's Presbyterian Church (C) , Church of Jesus Christ of Latter Day Saints (D) . Display/hide their locations on the map
Parks in Pleasant Hill include: (1) , Viking Field (2) , Chilpancingo Park (3) , Dinosaur Hill Park (4) , Las Juntas Park (5) , Paso Nogal Park (6) , Pinewood Park (7) , Pleasant Hill Park (8) , Pleasant Oaks Park (9) . Display/hide their locations on the map
Tourist attractions:
Contra Costa County has a predicted average indoor radon screening level between 2 and 4 pCi/L (pico curies per liter) - Moderate Potential Drinking water stations with addresses in Pleasant Hill and their reported violations in the past:
WEST WIND WINERY (Population served: 100, Groundwater):
Past health violations:
MCL, Monthly (TCR) - Between APR-2013 and JUN-2013, Contaminant: Coliform. Follow-up actions: St AO (w/o penalty) issued (JUL-25-2013), St Compliance achieved (AUG-31-2013)
Average household size: This city:
2.4 peopleCalifornia:
2.9 people
Percentage of family households: This city:
60.4%Whole state:
68.7%
Percentage of households with unmarried partners: This city:
6.9%Whole state:
7.2%
Likely homosexual households (counted as self-reported same-sex unmarried-partner households)
Lesbian couples: 0.6% of all households Gay men: 0.5% of all households
People in group quarters in Pleasant Hill in 2010:
291 people in nursing facilities/skilled-nursing facilities
71 people in residential treatment centers for adults
31 people in group homes intended for adults
26 people in workers' group living quarters and job corps centers
23 people in other noninstitutional facilities
21 people in group homes for juveniles (non-correctional)
People in group quarters in Pleasant Hill in 2000:
305 people in nursing homes
103 people in other noninstitutional group quarters
29 people in homes or halfway houses for drug/alcohol abuse
15 people in homes for the mentally retarded
8 people in religious group quarters
Banks with branches in Pleasant Hill (2011 data):
Wells Fargo Bank, National Association: Pleasant Hill Plaza Branch, Pleasant Hill Branch, Crossroads Branch. Info updated 2011/04/05: Bank assets: $1,161,490.0 mil, Deposits: $905,653.0 mil, headquarters in Sioux Falls, SD, positive income , 6395 total offices , Holding Company: Wells Fargo & Company
Citibank, National Association: 2255 Contra Costa Blvd Branch at 2255 Contra Costa Blvd, branch established on 1936/02/01; Pleasant Hill Branch at 700 Contra Costa Boulevard, branch established on 1921/01/01. Info updated 2012/01/10: Bank assets: $1,288,658.0 mil, Deposits: $882,541.0 mil, headquarters in Sioux Falls, SD, positive income , International Specialization, 1048 total offices , Holding Company: Citigroup Inc.
U.S. Bank National Association: Sunvalley Safeway Branch at 707 Contra Costa Boulevard, branch established on 2012/02/17; Pleasant Hill Albertsons Branch at 155 Crescent Plaza, branch established on 2000/03/21. Info updated 2012/01/30: Bank assets: $330,470.8 mil, Deposits: $236,091.5 mil, headquarters in Cincinnati, OH, positive income , 3121 total offices , Holding Company: U.S. Bancorp
California Bank & Trust: Contra Costa Branch at 620 Contra Costa Boulevard, branch established on 1971/11/09. Info updated 2009/07/20: Bank assets: $10,894.1 mil, Deposits: $9,193.9 mil, headquarters in San Diego, CA, positive income , Commercial Lending Specialization, 109 total offices , Holding Company: Zions Bancorporation
JPMorgan Chase Bank, National Association: 1898 Contra Costa Blvd Branch at 1898 Contra Costa Blvd, branch established on 1919/01/01. Info updated 2011/11/10: Bank assets: $1,811,678.0 mil, Deposits: $1,190,738.0 mil, headquarters in Columbus, OH, positive income , International Specialization, 5577 total offices , Holding Company: Jpmorgan Chase & Co.
Union Bank, National Association: Pleasant Hill Branch at 1902 Contra Costa Blvd, branch established on 1962/01/12. Info updated 2011/09/01: Bank assets: $88,967.5 mil, Deposits: $65,286.4 mil, headquarters in San Francisco, CA, positive income , Commercial Lending Specialization, 403 total offices , Holding Company: Mitsubishi Ufj Financial Group, Inc.
Bank of America, National Association: Pleasant Hill Branch at 2178 Contra Costa, branch established on 1954/11/22. Info updated 2009/11/18: Bank assets: $1,451,969.3 mil, Deposits: $1,077,176.8 mil, headquarters in Charlotte, NC, positive income , 5782 total offices , Holding Company: Bank Of America Corporation
For population 15 years and over in Pleasant Hill:
Never married: 32.5%Now married: 51.5%Separated: 1.1%Widowed: 4.0%Divorced: 10.9% For population 25 years and over in Pleasant Hill:
High school or higher: 94.8%Bachelor's degree or higher: 56.0%Graduate or professional degree: 21.4%Unemployed: 3.7%Mean travel time to work (commute): 23.2 minutes
Education Gini index (Inequality in education) Here:
11.1California average:
15.5
Religion statistics for Pleasant Hill, CA (based on Contra Costa County data)
Religion Adherents Congregations Catholic 228,400 34 Evangelical Protestant 81,120 352 Other 48,553 123 Mainline Protestant 32,693 101 Black Protestant 10,395 34 Orthodox 2,435 8 None 645,429 -
Source: Clifford Grammich, Kirk Hadaway, Richard Houseal, Dale E.Jones, Alexei Krindatch, Richie Stanley and Richard H.Taylor. 2012. 2010 U.S.Religion Census: Religious Congregations & Membership Study. Association of Statisticians of American Religious Bodies. Jones, Dale E., et al. 2002. Congregations and Membership in the United States 2000. Nashville, TN: Glenmary Research Center. Graphs represent county-level data
Food Environment Statistics: Number of grocery stores : 181Here :
1.78 / 10,000 pop.State :
2.14 / 10,000 pop.
Number of supercenters and club stores : 5Contra Costa County :
0.05 / 10,000 pop.California :
0.04 / 10,000 pop.
Number of convenience stores (no gas) : 52Contra Costa County :
0.51 / 10,000 pop.California :
0.62 / 10,000 pop.
Number of convenience stores (with gas) : 178This county :
1.75 / 10,000 pop.California :
1.49 / 10,000 pop.
Number of full-service restaurants : 683Contra Costa County :
6.73 / 10,000 pop.State :
7.42 / 10,000 pop.
Adult diabetes rate : This county :
7.1%California :
7.3%
Adult obesity rate : Contra Costa County :
22.2%California :
21.3%
Low-income preschool obesity rate : This county :
16.8%California :
17.9%
Health and Nutrition: Healthy diet rate : Here:
54.7%California:
49.4%
Average overall health of teeth and gums : Pleasant Hill:
54.1%State:
48.0%
People feeling badly about themselves : Pleasant Hill:
18.5%California:
20.2%
People not drinking alcohol at all : This city:
9.8%California:
11.2%
Average hours sleeping at night : Pleasant Hill:
6.9California:
6.8
Overweight people : Pleasant Hill:
33.1%California:
31.5%
General health condition : Pleasant Hill:
61.0%California:
56.4%
Average condition of hearing : Pleasant Hill:
81.2%State:
80.9%
More about Health and Nutrition of Pleasant Hill, CA Residents
Local government employment and payroll (March 2022)
Function
Full-time employees
Monthly full-time payroll
Average yearly full-time wage
Part-time employees
Monthly part-time payroll
Police Protection - Officers
44 $637,284 $173,805 0 $0 Other Government Administration
26 $235,198 $108,553 4 $1,650 Streets and Highways
21 $177,680 $101,531 0 $0 Police - Other
13 $117,438 $108,404 0 $0 Financial Administration
8 $80,258 $120,387 1 $786
Totals for Government
112 $1,247,858 $133,699 5 $2,436
Pleasant Hill government finances - Expenditure in 2017 (per resident):
Construction - Regular Highways: $3,723,000 ($109.78)
Housing and Community Development: $2,354,000 ($69.41)Central Staff Services: $886,000 ($26.13)Police Protection: $682,000 ($20.11)Current Operations - Regular Highways: $12,061,000 ($355.65)
Police Protection: $10,389,000 ($306.34)Central Staff Services: $7,110,000 ($209.65)Protective Inspection and Regulation - Other: $1,487,000 ($43.85)Financial Administration: $1,058,000 ($31.20)Water Utilities: $228,000 ($6.72)Health - Other: $196,000 ($5.78)Housing and Community Development: $173,000 ($5.10)Solid Waste Management: $129,000 ($3.80)Parks and Recreation: $4,000 ($0.12)General - Interest on Debt: $62,000 ($1.83)
Intergovernmental to Local - Other - General - Other: $1,256,000 ($37.04)
Other - Libraries: $198,000 ($5.84)Other - Health - Other: $196,000 ($5.78)Other - Regular Highways: $148,000 ($4.36)Other Capital Outlay - Regular Highways: $39,000 ($1.15)
Pleasant Hill government finances - Revenue in 2017 (per resident):
Charges - Other: $1,012,000 ($29.84)
Regular Highways: $907,000 ($26.74)Federal Intergovernmental - Other: $1,246,000 ($36.74)
Miscellaneous - General Revenue - Other: $514,000 ($15.16)
Fines and Forfeits: $196,000 ($5.78)Donations From Private Sources: $149,000 ($4.39)Interest Earnings: $122,000 ($3.60)Sale of Property: $6,000 ($0.18)Revenue - Water Utilities: $134,000 ($3.95)
State Intergovernmental - Other: $1,172,000 ($34.56)
Highways: $568,000 ($16.75)General Local Government Support: $23,000 ($0.68)Tax - General Sales and Gross Receipts: $9,642,000 ($284.32)
Property: $6,089,000 ($179.55)Occupation and Business License - Other: $2,570,000 ($75.78)Other Selective Sales: $2,222,000 ($65.52)Public Utilities Sales: $2,075,000 ($61.19)Other License: $774,000 ($22.82)Documentary and Stock Transfer: $252,000 ($7.43)
Pleasant Hill government finances - Debt in 2017 (per resident):
Long Term Debt - Outstanding Nonguaranteed - Industrial Revenue: $11,068,000 ($326.36)
Beginning Outstanding - Public Debt for Private Purpose: $11,068,000 ($326.36)Beginning Outstanding - Unspecified Public Purpose: $2,540,000 ($74.90)Retired Unspecified Public Purpose: $1,668,000 ($49.18)Outstanding Unspecified Public Purpose: $872,000 ($25.71)
Pleasant Hill government finances - Cash and Securities in 2017 (per resident):
Bond Funds - Cash and Securities: $1,343,000 ($39.60)
Other Funds - Cash and Securities: $24,238,000 ($714.71)
Sinking Funds - Cash and Securities: $11,068,000 ($326.36)
6.37% of this county's 2021 resident taxpayers lived in other counties in 2020 ($134,084 average adjusted gross income )
Here:
6.37%California average:
5.19%
0.01% of residents moved from foreign countries ($98 average AGI )Contra Costa County:
0.01%California average:
0.03%
Top counties from which taxpayers relocated into this county between 2020 and 2021:
7.09% of this county's 2020 resident taxpayers moved to other counties in 2021 ($123,334 average adjusted gross income )
Here:
7.09%California average:
6.14%
0.01% of residents moved to foreign countries ($92 average AGI )Contra Costa County:
0.01%California average:
0.02%
Top counties to which taxpayers relocated from this county between 2020 and 2021:
Businesses in Pleasant Hill, CA
Name Count Name Count
7-Eleven 4 Marshalls 1 AT&T 3 MasterBrand Cabinets 5 Ace Hardware 1 McDonald's 2 Barnes & Noble 1 Men's Wearhouse 1 Bed Bath & Beyond 1 New Balance 1 Big O Tires 1 Nike 3 Blockbuster 1 Office Depot 1 Burger King 1 Outback 1 CVS 1 Outback Steakhouse 1 Casual Male XL 1 Panda Express 1 Chipotle 1 Payless 1 Cold Stone Creamery 1 Pizza Hut 1 Curves 1 Plato's Closet 1 DHL 1 Quiznos 1 Dennys 1 RadioShack 1 Extended Stay America 1 Rite Aid 1 FedEx 6 SAS Shoes 1 GNC 1 Safeway 3 GameStop 2 Sprint Nextel 1 Goodwill 1 Staples 1 H&R Block 1 Starbucks 4 JCPenney 2 T-Mobile 2 Jamba Juice 1 T.J.Maxx 1 Jones New York 1 Taco Bell 2 KFC 1 Target 1 Kmart 1 Toys"R"Us 2 Kohl's 1 UPS 4 La-Z-Boy 1 Verizon Wireless 2 Lane Furniture 1 Vons 3 LensCrafters 1 Walgreens 1 Marriott 2 YMCA 2
Strongest AM radio stations in Pleasant Hill:
KTRB (860 AM; 50 kW; MODESTO, CA; Owner: PAPPAS RADIO OF CALIFORNIA, A CALIFORNIA LIMITED PARTNERSHIP)
KIQI (1010 AM; 35 kW; SAN FRANCISCO, CA; Owner: RADIO UNICA OF SAN FRANCISCO LICENSE CORP.)
KNEW (910 AM; 20 kW; OAKLAND, CA; Owner: AMFM RADIO LICENSES, L.L.C.)
KTCT (1050 AM; 50 kW; SAN MATEO, CA; Owner: SUSQUEHANNA RADIO CORP.)
KABN (1480 AM; 5 kW; CONCORD, CA; Owner: CONCORD AREA BROADCASTING CORP.)
KFAX (1100 AM; 50 kW; SAN FRANCISCO, CA; Owner: GOLDEN GATE BROADCASTING CO, INC.)
KCBS (740 AM; 50 kW; SAN FRANCISCO, CA; Owner: INFINITY BROADCASTING OPERATIONS, INC.)
KNBR (680 AM; 50 kW; SAN FRANCISCO, CA; Owner: KNBR LICO, INC.)
KGO (810 AM; 50 kW; SAN FRANCISCO, CA; Owner: KGO-AM RADIO, INC.)
KATD (990 AM; 10 kW; PITTSBURG, CA; Owner: RADIO UNICA OF SACRAMENTO LICENSE CORP.)
KFRC (610 AM; 5 kW; SAN FRANCISCO, CA; Owner: INFINITY BROADCASTING CORPORATION OF LOS ANGELES)
KDYA (1190 AM; 10 kW; VALLEJO, CA; Owner: BAYBRIDGE COMMUNICATIONS, L.L.C.)
KYCY (1550 AM; 50 kW; SAN FRANCISCO, CA; Owner: INFINITY BROADCASTING OPERATIONS, INC.)
Strongest FM radio stations in Pleasant Hill:
KDFC-FM1 (102.1 FM; LAFAYETTE, CA; Owner: BONNEVILLE HOLDING COMPANY)
KOIT-FM2 (96.5 FM; MARTINEZ, ETC., CA; Owner: BONNEVILLE HOLDING CO. C/O KOIT(FM))
KIOI-FM1 (101.3 FM; WALNUT CREEK, CA; Owner: AMFM RADIO LICENSES, L.L.C.)
KFJO (92.1 FM; WALNUT CREEK, CA; Owner: CHASE RADIO PROPERTIES, L.L.C.)
KKSF-FM1 (103.7 FM; PLEASANTON, ETC., CA; Owner: AMFM RADIO LICENSES, L.L.C.)
KBLX-FM2 (102.9 FM; PLEASANTON, CA; Owner: ICBC BROADCAST HOLDINGS -CA, INC.)
KSOL-FM3 (98.9 FM; PLEASANTON, CA; Owner: TMS LICENSE CALIFORNIA, INC)
KFRC-FM3 (99.7 FM; WALNUT CREEK, CA; Owner: INFINITY KFRC-FM, INC.)
KZBR-FM1 (95.7 FM; WALNUT CREEK, CA; Owner: BONNEVILLE HOLDING COMPANY)
KISQ-FM3 (98.1 FM; CONCORD, CA; Owner: AMFM RADIO LICENSES, L.L.C.)
KMEL-FM1 (106.1 FM; CONCORD, CA; Owner: AMFM RADIO LICENSES, L.L.C.)
KLLC (97.3 FM; SAN FRANCISCO, CA; Owner: INFINITY BROADCASTING OPERATIONS, INC.)
K209BZ (89.7 FM; CONCORD, CA; Owner: YOUR CHRISTIAN COMPANION NETWORK, INC.)
KVHS (90.5 FM; CONCORD, CA; Owner: CLAYTON VALLEY HIGH SCHOOL)
KALX (90.7 FM; BERKELEY, CA; Owner: UNIVERSITY OF CALIFORNIA)
KSFB-FM (100.7 FM; SAN RAFAEL, CA; Owner: GOLDEN GATE BROADCASTING COMPANY, INC.)
KZBR-FM2 (95.7 FM; LIVERMORE, ETC., CA; Owner: BONNEVILLE HOLDING COMPANY)
KOIT-FM (96.5 FM; SAN FRANCISCO, CA; Owner: BONNEVILLE HOLDING COMPANY)
KKSF (103.7 FM; SAN FRANCISCO, CA; Owner: AMFM RADIO LICENSES, L.L.C.)
KUIC (95.3 FM; VACAVILLE, CA; Owner: KUIC, INC.)
TV broadcast stations around Pleasant Hill:
KTNC-TV (Channel 42; CONCORD, CA; Owner: KTNC LICENSE, LLC)
KQED (Channel 9; SAN FRANCISCO, CA; Owner: KQED, INC.)
KGO-TV (Channel 7; SAN FRANCISCO, CA; Owner: KGO TELEVISION, INC.)
KPIX-TV (Channel 5; SAN FRANCISCO, CA; Owner: CBS BROADCASTING INC.)
KOVR (Channel 13; STOCKTON, CA; Owner: SCI - SACRAMENTO LICENSEE, LLC)
KXTV (Channel 10; SACRAMENTO, CA; Owner: KXTV, INC.)
KSPX (Channel 29; SACRAMENTO, CA; Owner: PAXSON SACRAMENTO LICENSE, INC.)
KCRA-TV (Channel 3; SACRAMENTO, CA; Owner: KCRA HEARST-ARGYLE TELEVISION, INC.)
KTXL (Channel 40; SACRAMENTO, CA; Owner: CHANNEL 40, INC.)
KUVS (Channel 19; MODESTO, CA; Owner: KUVS LICENSE PARTNERSHIP, G.P.)
KTVU (Channel 2; OAKLAND, CA; Owner: KTVU PARTNERSHIP)
KQCA (Channel 58; STOCKTON, CA; Owner: KCRA HEARST-ARGYLE TELEVISION, INC.)
KVIE (Channel 6; SACRAMENTO, CA; Owner: KVIE, INC.)
KMAX-TV (Channel 31; SACRAMENTO, CA; Owner: UPN STATIONS GROUP INC.)
KRON-TV (Channel 4; SAN FRANCISCO, CA; Owner: YOUNG BROADCASTING OF SAN FRANCISCO, INC.)
KMTP-TV (Channel 32; SAN FRANCISCO, CA; Owner: MINORITY TELEVISION PROJECT)
KBHK-TV (Channel 44; SAN FRANCISCO, CA; Owner: VIACOM TELEVISION STATIONS GROUP OF SAN FRANCISCO INC.)
KBWB (Channel 20; SAN FRANCISCO, CA; Owner: KBWB LICENSE, INC.)
KFSF (Channel 66; VALLEJO, CA; Owner: TELEFUTURA SAN FRANCISCO LLC)
KCNS (Channel 38; SAN FRANCISCO, CA; Owner: WRAY, INC.)
KFTL (Channel 64; STOCKTON, CA; Owner: FAMILY STATIONS, INC.)
KCSM-TV (Channel 60; SAN MATEO, CA; Owner: SAN MATEO COUNTY COMMUNITY COLLEGE DISTRICT)
KBIT-CA (Channel 28; SAN FRANCISCO, ETC., CA; Owner: POLAR BROADCASTING, INC.)
National Bridge Inventory (NBI) Statistics 26 Number of bridges315ft / 96.2m Total length $156,000 Total costs972,530 Total average daily traffic35,100 Total average daily truck traffic
New bridges - historical statistics
1 1930-1939 1 1940-1949 4 1950-1959 6 1960-1969 2 1970-1979 3 1980-1989 8 1990-1999 1 2010-2019
See full National Bridge Inventory statistics for Pleasant Hill, CA
Home Mortgage Disclosure Act Aggregated Statistics For Year 2009(Based on 3 full and 4 partial tracts) A) FHA, FSA/RHS & VA B) Conventional C) Refinancings D) Home Improvement Loans E) Loans on Dwellings For 5+ Families F) Non-occupant Loans on Number Average Value Number Average Value Number Average Value Number Average Value Number Average Value Number Average Value
LOANS ORIGINATED 100 $402,122 183 $329,261 1,066 $304,803 43 $200,321 3 $4,052,000 57 $246,661 APPLICATIONS APPROVED, NOT ACCEPTED 9 $416,420 27 $321,066 117 $342,779 8 $141,122 0 $0 13 $256,580 APPLICATIONS DENIED 12 $434,667 26 $313,898 264 $366,410 15 $150,903 0 $0 17 $241,906 APPLICATIONS WITHDRAWN 19 $348,277 32 $322,012 156 $345,682 12 $242,823 0 $0 13 $195,036 FILES CLOSED FOR INCOMPLETENESS 5 $258,594 7 $273,117 55 $350,234 8 $101,700 0 $0 7 $276,573
Aggregated Statistics For Year 2008(Based on 3 full and 4 partial tracts) A) FHA, FSA/RHS & VA B) Conventional C) Refinancings D) Home Improvement Loans E) Loans on Dwellings For 5+ Families F) Non-occupant Loans on G) Loans On Manufactured Number Average Value Number Average Value Number Average Value Number Average Value Number Average Value Number Average Value Number Average Value
LOANS ORIGINATED 39 $400,862 223 $348,297 423 $325,763 50 $159,488 1 $1,450,270 62 $269,463 0 $0 APPLICATIONS APPROVED, NOT ACCEPTED 4 $309,622 49 $345,626 93 $345,370 17 $93,369 1 $1,350,000 13 $254,538 3 $114,073 APPLICATIONS DENIED 6 $405,875 56 $369,756 210 $397,393 25 $181,887 0 $0 23 $319,230 0 $0 APPLICATIONS WITHDRAWN 5 $444,984 40 $376,934 95 $351,445 5 $193,128 1 $5,342,220 11 $319,068 0 $0 FILES CLOSED FOR INCOMPLETENESS 3 $352,527 12 $343,255 40 $392,551 4 $162,428 0 $0 2 $281,890 0 $0
Aggregated Statistics For Year 2007(Based on 3 full and 4 partial tracts) A) FHA, FSA/RHS & VA B) Conventional C) Refinancings D) Home Improvement Loans E) Loans on Dwellings For 5+ Families F) Non-occupant Loans on G) Loans On Manufactured Number Average Value Number Average Value Number Average Value Number Average Value Number Average Value Number Average Value Number Average Value
LOANS ORIGINATED 0 $0 398 $380,306 704 $353,247 120 $216,062 6 $2,397,383 93 $318,781 1 $135,000 APPLICATIONS APPROVED, NOT ACCEPTED 0 $0 78 $356,943 182 $342,958 23 $218,225 0 $0 25 $330,794 0 $0 APPLICATIONS DENIED 0 $0 93 $407,862 301 $401,687 83 $224,437 0 $0 39 $369,896 1 $205,890 APPLICATIONS WITHDRAWN 1 $369,560 58 $392,429 134 $366,650 19 $170,285 0 $0 17 $373,754 0 $0 FILES CLOSED FOR INCOMPLETENESS 0 $0 13 $417,264 63 $386,230 11 $229,392 0 $0 8 $337,095 0 $0
Aggregated Statistics For Year 2006(Based on 3 full and 4 partial tracts) B) Conventional C) Refinancings D) Home Improvement Loans E) Loans on Dwellings For 5+ Families F) Non-occupant Loans on G) Loans On Manufactured Number Average Value Number Average Value Number Average Value Number Average Value Number Average Value Number Average Value
LOANS ORIGINATED 526 $386,861 979 $371,133 165 $242,404 2 $1,995,870 138 $350,448 0 $0 APPLICATIONS APPROVED, NOT ACCEPTED 100 $332,688 178 $365,500 23 $288,913 0 $0 21 $320,109 2 $34,045 APPLICATIONS DENIED 139 $365,611 301 $391,214 80 $219,244 0 $0 33 $393,755 3 $116,733 APPLICATIONS WITHDRAWN 75 $377,619 203 $378,254 36 $199,344 1 $2,267,730 20 $359,346 0 $0 FILES CLOSED FOR INCOMPLETENESS 17 $393,896 54 $393,902 7 $288,140 0 $0 7 $420,874 0 $0
Aggregated Statistics For Year 2005(Based on 3 full and 4 partial tracts) B) Conventional C) Refinancings D) Home Improvement Loans E) Loans on Dwellings For 5+ Families F) Non-occupant Loans on G) Loans On Manufactured Number Average Value Number Average Value Number Average Value Number Average Value Number Average Value Number Average Value
LOANS ORIGINATED 776 $385,380 1,337 $356,777 171 $283,697 4 $3,233,038 164 $335,391 1 $75,590 APPLICATIONS APPROVED, NOT ACCEPTED 105 $351,149 160 $338,347 20 $221,280 0 $0 25 $289,575 3 $119,530 APPLICATIONS DENIED 145 $374,573 337 $364,374 74 $262,734 0 $0 38 $356,559 2 $113,500 APPLICATIONS WITHDRAWN 81 $400,468 281 $365,910 34 $221,901 0 $0 35 $306,677 0 $0 FILES CLOSED FOR INCOMPLETENESS 31 $414,779 52 $363,406 12 $222,221 0 $0 3 $363,877 0 $0
Aggregated Statistics For Year 2004(Based on 3 full and 4 partial tracts) A) FHA, FSA/RHS & VA B) Conventional C) Refinancings D) Home Improvement Loans E) Loans on Dwellings For 5+ Families F) Non-occupant Loans on G) Loans On Manufactured Number Average Value Number Average Value Number Average Value Number Average Value Number Average Value Number Average Value Number Average Value
LOANS ORIGINATED 1 $374,700 788 $332,190 1,471 $294,796 148 $199,709 5 $4,021,082 179 $266,840 1 $46,990 APPLICATIONS APPROVED, NOT ACCEPTED 1 $241,050 105 $313,908 201 $290,552 24 $136,415 0 $0 27 $264,577 0 $0 APPLICATIONS DENIED 2 $246,000 132 $324,365 290 $314,738 47 $185,246 0 $0 36 $265,152 2 $82,425 APPLICATIONS WITHDRAWN 0 $0 82 $312,552 285 $304,261 21 $178,897 0 $0 22 $267,998 0 $0 FILES CLOSED FOR INCOMPLETENESS 0 $0 17 $363,011 70 $334,477 4 $113,385 0 $0 5 $200,766 0 $0
Aggregated Statistics For Year 2003(Based on 3 full and 4 partial tracts) A) FHA, FSA/RHS & VA B) Conventional C) Refinancings D) Home Improvement Loans E) Loans on Dwellings For 5+ Families F) Non-occupant Loans on Number Average Value Number Average Value Number Average Value Number Average Value Number Average Value Number Average Value
LOANS ORIGINATED 3 $206,750 782 $286,262 3,657 $244,174 44 $75,548 2 $7,236,280 263 $209,357 APPLICATIONS APPROVED, NOT ACCEPTED 0 $0 103 $280,748 402 $236,613 8 $45,164 0 $0 38 $211,329 APPLICATIONS DENIED 0 $0 99 $282,020 402 $256,025 28 $52,523 0 $0 32 $220,727 APPLICATIONS WITHDRAWN 0 $0 99 $265,382 552 $233,092 14 $105,471 0 $0 25 $180,238 FILES CLOSED FOR INCOMPLETENESS 0 $0 25 $298,530 104 $270,462 4 $58,802 0 $0 9 $209,342
Aggregated Statistics For Year 2002(Based on 3 full and 4 partial tracts) A) FHA, FSA/RHS & VA B) Conventional C) Refinancings D) Home Improvement Loans E) Loans on Dwellings For 5+ Families F) Non-occupant Loans on Number Average Value Number Average Value Number Average Value Number Average Value Number Average Value Number Average Value
LOANS ORIGINATED 5 $188,230 856 $258,207 2,631 $237,041 44 $98,687 3 $7,762,263 201 $200,274 APPLICATIONS APPROVED, NOT ACCEPTED 0 $0 90 $262,885 319 $224,183 20 $53,826 0 $0 25 $197,410 APPLICATIONS DENIED 0 $0 85 $241,368 274 $230,911 23 $90,583 1 $5,998,800 23 $225,677 APPLICATIONS WITHDRAWN 0 $0 120 $240,304 380 $230,175 12 $78,733 0 $0 29 $214,441 FILES CLOSED FOR INCOMPLETENESS 0 $0 37 $273,890 98 $270,119 2 $27,600 0 $0 11 $203,004
Aggregated Statistics For Year 2001(Based on 3 full and 4 partial tracts) A) FHA, FSA/RHS & VA B) Conventional C) Refinancings D) Home Improvement Loans E) Loans on Dwellings For 5+ Families F) Non-occupant Loans on Number Average Value Number Average Value Number Average Value Number Average Value Number Average Value Number Average Value
LOANS ORIGINATED 6 $186,845 688 $222,068 2,123 $219,007 110 $54,886 4 $1,776,228 159 $192,526 APPLICATIONS APPROVED, NOT ACCEPTED 3 $160,157 113 $216,569 245 $212,987 21 $55,944 0 $0 10 $158,213 APPLICATIONS DENIED 2 $171,965 74 $219,369 274 $220,235 40 $58,570 0 $0 12 $212,588 APPLICATIONS WITHDRAWN 3 $189,033 59 $220,256 327 $195,359 32 $50,675 1 $668,880 22 $185,739 FILES CLOSED FOR INCOMPLETENESS 3 $136,213 14 $215,884 106 $215,370 5 $50,922 0 $0 6 $224,200
Aggregated Statistics For Year 2000(Based on 3 full and 4 partial tracts) A) FHA, FSA/RHS & VA B) Conventional C) Refinancings D) Home Improvement Loans E) Loans on Dwellings For 5+ Families F) Non-occupant Loans on Number Average Value Number Average Value Number Average Value Number Average Value Number Average Value Number Average Value
LOANS ORIGINATED 23 $156,236 782 $201,589 532 $172,504 119 $44,245 1 $1,406,060 82 $175,018 APPLICATIONS APPROVED, NOT ACCEPTED 1 $260,870 75 $207,369 82 $154,366 37 $52,858 0 $0 5 $167,974 APPLICATIONS DENIED 2 $160,295 117 $183,616 188 $160,279 33 $47,874 0 $0 13 $146,692 APPLICATIONS WITHDRAWN 1 $315,760 70 $199,810 128 $159,310 17 $48,036 0 $0 6 $215,252 FILES CLOSED FOR INCOMPLETENESS 0 $0 14 $187,567 62 $195,855 6 $99,313 2 $2,561,525 1 $112,620
Aggregated Statistics For Year 1999(Based on 3 full and 4 partial tracts) A) FHA, FSA/RHS & VA B) Conventional C) Refinancings D) Home Improvement Loans E) Loans on Dwellings For 5+ Families F) Non-occupant Loans on Number Average Value Number Average Value Number Average Value Number Average Value Number Average Value Number Average Value
LOANS ORIGINATED 36 $155,224 786 $175,455 877 $165,397 101 $41,939 2 $2,001,545 80 $141,092 APPLICATIONS APPROVED, NOT ACCEPTED 2 $163,815 72 $176,033 131 $159,804 25 $31,804 0 $0 9 $134,294 APPLICATIONS DENIED 6 $158,270 89 $169,690 193 $156,598 44 $28,978 1 $116,370 13 $151,856 APPLICATIONS WITHDRAWN 8 $140,254 78 $169,092 218 $162,490 9 $53,846 1 $1,985,170 14 $151,131 FILES CLOSED FOR INCOMPLETENESS 2 $168,770 21 $169,816 69 $174,231 2 $10,270 1 $2,281,800 4 $120,850
Detailed HMDA statistics for the following Tracts:
3211.02
, 3212.00 , 3220.00 , 3230.00 , 3240.00 , 3250.00 , 3260.00
Private Mortgage Insurance Companies Aggregated Statistics For Year 2009(Based on 3 full and 4 partial tracts) A) Conventional B) Refinancings Number Average Value Number Average Value
LOANS ORIGINATED 28 $359,751 6 $445,955 APPLICATIONS APPROVED, NOT ACCEPTED 13 $386,276 5 $383,454 APPLICATIONS DENIED 7 $280,869 3 $313,797 APPLICATIONS WITHDRAWN 5 $434,318 2 $321,590 FILES CLOSED FOR INCOMPLETENESS 1 $279,690 0 $0
Aggregated Statistics For Year 2008(Based on 3 full and 4 partial tracts) A) Conventional B) Refinancings C) Non-occupant Loans on D) Loans On Manufactured Number Average Value Number Average Value Number Average Value Number Average Value
LOANS ORIGINATED 43 $395,634 7 $379,050 1 $225,090 0 $0 APPLICATIONS APPROVED, NOT ACCEPTED 8 $428,021 9 $375,802 2 $396,855 0 $0 APPLICATIONS DENIED 3 $553,403 2 $364,460 3 $427,473 0 $0 APPLICATIONS WITHDRAWN 7 $217,474 2 $226,500 1 $127,150 1 $84,000 FILES CLOSED FOR INCOMPLETENESS 3 $337,720 0 $0 0 $0 0 $0
Aggregated Statistics For Year 2007(Based on 2 full and 4 partial tracts) A) Conventional B) Refinancings C) Non-occupant Loans on Number Average Value Number Average Value Number Average Value
LOANS ORIGINATED 9 $392,828 8 $450,574 0 $0 APPLICATIONS APPROVED, NOT ACCEPTED 1 $350,240 3 $481,707 0 $0 APPLICATIONS DENIED 0 $0 0 $0 0 $0 APPLICATIONS WITHDRAWN 5 $174,054 0 $0 1 $459,000 FILES CLOSED FOR INCOMPLETENESS 0 $0 0 $0 0 $0
Aggregated Statistics For Year 2006(Based on 2 full and 4 partial tracts) A) Conventional B) Refinancings Number Average Value Number Average Value
LOANS ORIGINATED 4 $570,282 6 $584,358 APPLICATIONS APPROVED, NOT ACCEPTED 0 $0 1 $572,770 APPLICATIONS DENIED 0 $0 0 $0 APPLICATIONS WITHDRAWN 3 $317,853 0 $0 FILES CLOSED FOR INCOMPLETENESS 0 $0 0 $0
Aggregated Statistics For Year 2005(Based on 3 full and 4 partial tracts) A) Conventional B) Refinancings C) Non-occupant Loans on Number Average Value Number Average Value Number Average Value
LOANS ORIGINATED 5 $490,486 9 $406,110 2 $442,705 APPLICATIONS APPROVED, NOT ACCEPTED 3 $471,467 1 $285,030 0 $0 APPLICATIONS DENIED 1 $369,000 1 $468,660 0 $0 APPLICATIONS WITHDRAWN 2 $271,525 0 $0 0 $0 FILES CLOSED FOR INCOMPLETENESS 0 $0 0 $0 0 $0
Aggregated Statistics For Year 2004(Based on 3 full and 4 partial tracts) A) Conventional B) Refinancings C) Non-occupant Loans on Number Average Value Number Average Value Number Average Value
LOANS ORIGINATED 12 $383,692 9 $321,468 0 $0 APPLICATIONS APPROVED, NOT ACCEPTED 5 $329,920 4 $251,222 0 $0 APPLICATIONS DENIED 0 $0 0 $0 0 $0 APPLICATIONS WITHDRAWN 3 $237,003 0 $0 1 $357,290 FILES CLOSED FOR INCOMPLETENESS 0 $0 0 $0 0 $0
Aggregated Statistics For Year 2003(Based on 3 full and 4 partial tracts) A) Conventional B) Refinancings C) Non-occupant Loans on Number Average Value Number Average Value Number Average Value
LOANS ORIGINATED 26 $310,792 18 $299,229 1 $297,000 APPLICATIONS APPROVED, NOT ACCEPTED 10 $254,706 6 $310,387 2 $288,505 APPLICATIONS DENIED 0 $0 0 $0 0 $0 APPLICATIONS WITHDRAWN 5 $240,252 3 $235,127 0 $0 FILES CLOSED FOR INCOMPLETENESS 0 $0 0 $0 0 $0
Aggregated Statistics For Year 2002(Based on 3 full and 4 partial tracts) A) Conventional B) Refinancings C) Non-occupant Loans on Number Average Value Number Average Value Number Average Value
LOANS ORIGINATED 53 $291,465 20 $327,104 5 $301,302 APPLICATIONS APPROVED, NOT ACCEPTED 15 $236,391 9 $297,298 1 $298,940 APPLICATIONS DENIED 2 $332,040 1 $560,860 0 $0 APPLICATIONS WITHDRAWN 2 $181,610 3 $237,063 0 $0 FILES CLOSED FOR INCOMPLETENESS 0 $0 0 $0 0 $0
Aggregated Statistics For Year 2001(Based on 3 full and 4 partial tracts) A) Conventional B) Refinancings C) Non-occupant Loans on Number Average Value Number Average Value Number Average Value
LOANS ORIGINATED 49 $260,172 17 $274,376 2 $275,360 APPLICATIONS APPROVED, NOT ACCEPTED 10 $300,379 6 $262,160 0 $0 APPLICATIONS DENIED 5 $295,740 2 $293,450 0 $0 APPLICATIONS WITHDRAWN 1 $584,300 1 $225,930 0 $0 FILES CLOSED FOR INCOMPLETENESS 1 $223,410 0 $0 0 $0
Aggregated Statistics For Year 2000(Based on 3 full and 4 partial tracts) A) Conventional B) Refinancings C) Non-occupant Loans on Number Average Value Number Average Value Number Average Value
LOANS ORIGINATED 89 $236,317 23 $231,126 3 $212,190 APPLICATIONS APPROVED, NOT ACCEPTED 19 $191,957 4 $235,710 1 $194,000 APPLICATIONS DENIED 3 $246,987 1 $238,000 0 $0 APPLICATIONS WITHDRAWN 4 $168,702 0 $0 0 $0 FILES CLOSED FOR INCOMPLETENESS 0 $0 1 $450,000 0 $0
Aggregated Statistics For Year 1999(Based on 3 full and 4 partial tracts) A) Conventional B) Refinancings C) Non-occupant Loans on Number Average Value Number Average Value Number Average Value
LOANS ORIGINATED 123 $207,154 49 $174,400 3 $108,897 APPLICATIONS APPROVED, NOT ACCEPTED 16 $178,602 18 $181,684 1 $131,000 APPLICATIONS DENIED 7 $197,980 4 $255,090 0 $0 APPLICATIONS WITHDRAWN 1 $82,910 4 $99,172 0 $0 FILES CLOSED FOR INCOMPLETENESS 2 $105,130 1 $180,000 0 $0
Detailed PMIC statistics for the following Tracts:
3211.02
, 3212.00 , 3220.00 , 3230.00 , 3240.00 , 3250.00 , 3260.00 Fire-safe hotels and motels in Pleasant Hill, California:
Residence Inn By Marriott Pleasant Hill, 700 Ellinwood Way, Pleasant Hill, California 94523 Phone: (925) 689-1010, Fax: (925) 689-1098
Extended Stay America - Pleasant Hill - Buskirk Ave, 3220 Buskirk Ave, Pleasant Hill, California 94523 Phone: (925) 945-6788, Fax: (925) 945-6864
Pleasant Hill Courtyard By Marriott, 2250 Contra Costa Blvd, Pleasant Hill, California 94523 Phone: (925) 691-1444, Fax: (925) 691-0616
Hyatt House Pleasant Hill, 2611 Contra Costa Blvd, Pleasant Hill, California 94523 Phone: (925) 934-3343, Fax: (925) 934-5973
Homewood Suites Pleasant Hill Concord, 650 Ellinwood Way, Pleasant hill, California 94523 Phone: (925) 483-9850
All 5 fire-safe hotels and motels in Pleasant Hill, California
Most common first names in Pleasant Hill, CA among deceased individuals Name Count Lived (average)
John 180 77.1 years Mary 156 81.2 years Robert 135 72.3 years William 132 75.6 years James 101 72.6 years Margaret 86 80.8 years Helen 84 81.9 years George 74 77.7 years Ruth 70 81.0 years Charles 70 73.5 years
Most common last names in Pleasant Hill, CA among deceased individuals Last name Count Lived (average)
Smith 58 75.1 years Johnson 36 78.3 years Anderson 33 78.1 years Williams 33 78.2 years Brown 29 79.9 years Miller 27 73.7 years Wilson 26 79.7 years Davis 25 76.0 years Peterson 21 76.9 years Jones 21 78.2 years
Pleasant Hill compared to California state average:
Median household income above state average. Unemployed percentage significantly below state average. Hispanic race population percentage below state average. Median age significantly above state average. Length of stay since moving in significantly above state average. Percentage of population with a bachelor's degree or higher above state average. Pleasant Hill on our top lists :
#97 on the list of "Top 101 cities with the most residents born in Afghanistan (population 500+)"
#98 on the list of "Top 101 cities with largest percentage of females in occupations: construction and extraction occupations (population 5,000+)"
#99 on the list of "Top 101 cities with the most residents born in Iran (population 500+)"
#10 on the list of "Top 101 counties with the largest increase in the number of infant deaths per 1000 residents 2000-2006 to 2007-2013 (pop. 50,000+)"
#15 on the list of "Top 101 counties with the lowest Sulfur Oxides Annual air pollution readings in 2012 (µg/m3 )"
#17 on the list of "Top 101 counties with the highest Nitrogen Dioxide air pollution readings in 2012 (ppm)"
#31 on the list of "Top 101 counties with the highest percentage of residents that drank alcohol in the past 30 days"
#34 on the list of "Top 101 counties with the highest surface withdrawal of fresh water for public supply (pop. 50,000+)"
Top Patent Applicants
Sven Ivar Hommeltoft (48)
Steven T. Mitchell (45)
Manoj C. Desai (34)
Tamer Ibrahim (31)
Timothy J. Fultz (29)
Kate Leeann Bechtel (26)
Emerando M. Delos Reyes (22)
Cary Glen Noel (21)
Timothy Verrall (21)
Paul A. Barsanti (20)
Total of 826 patent applications in 2008-2024.
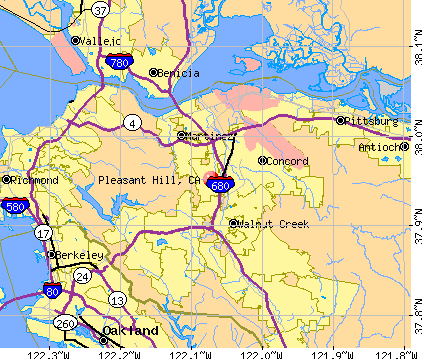


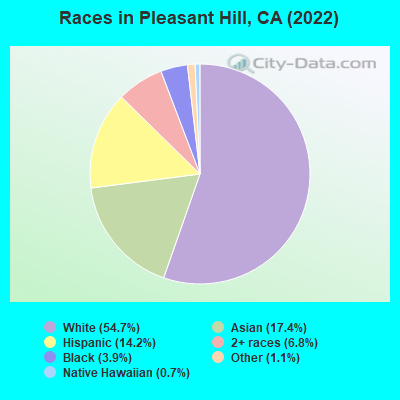
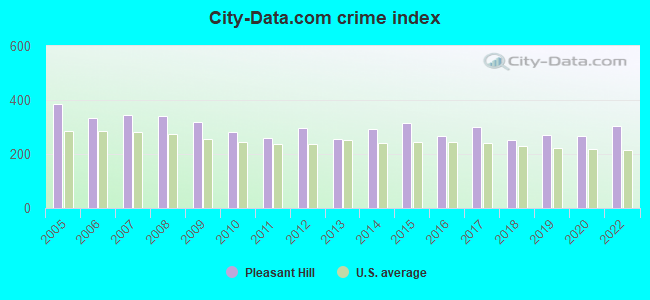
 Recent articles from our blog. Our writers, many of them Ph.D. graduates or candidates, create easy-to-read articles on a wide variety of topics.

 , pop. 459,252).
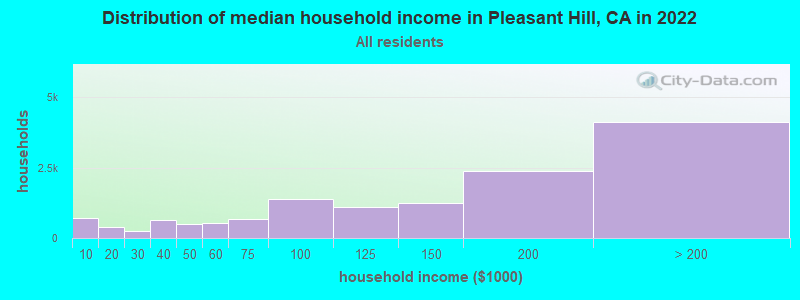
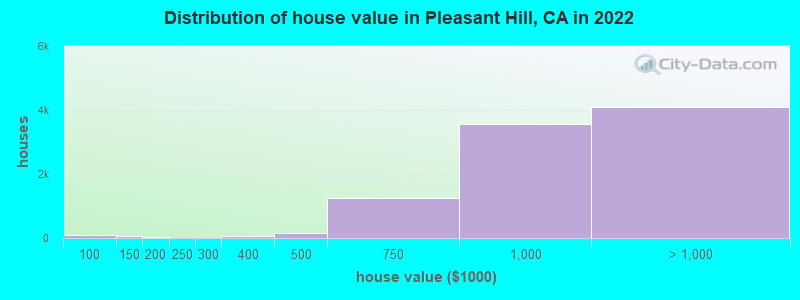

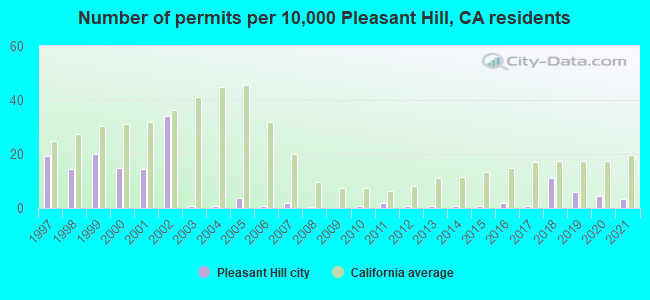
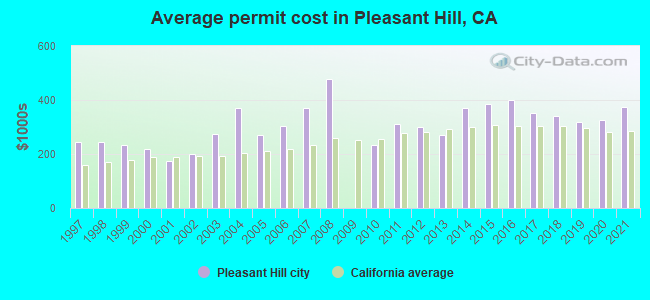
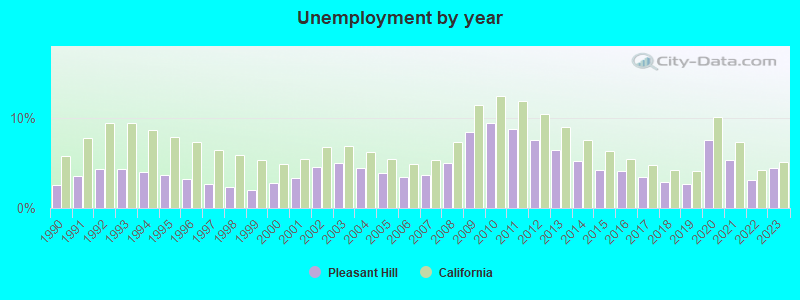
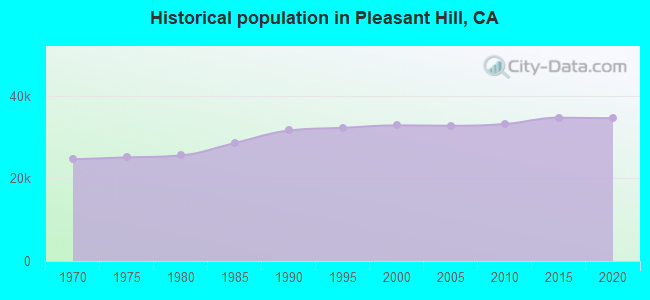
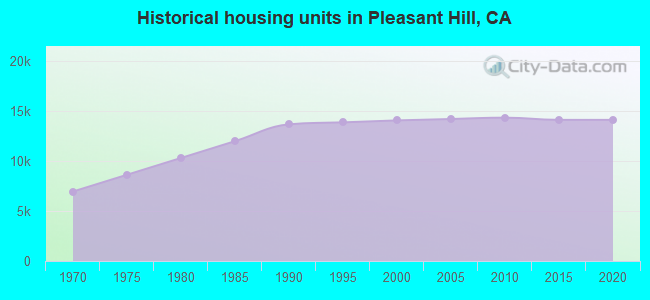
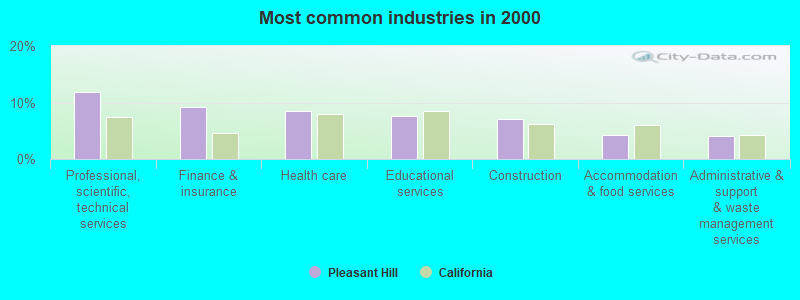
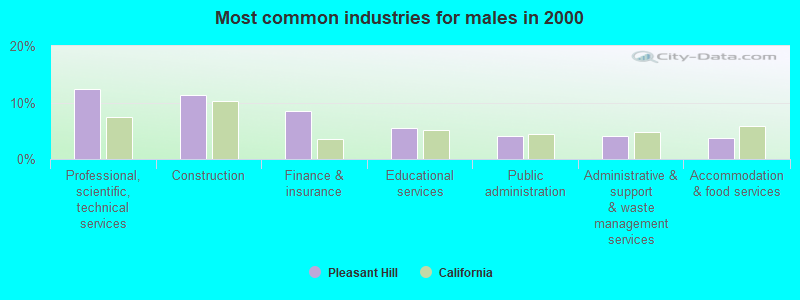
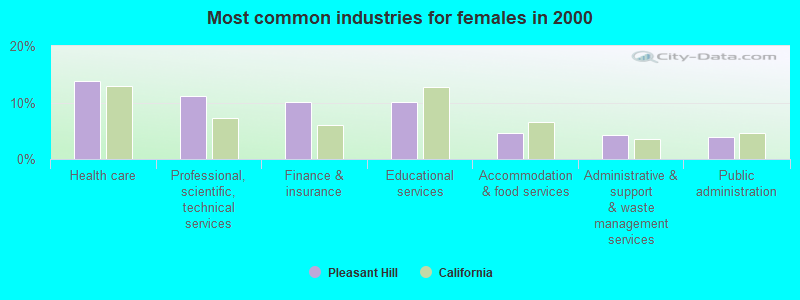
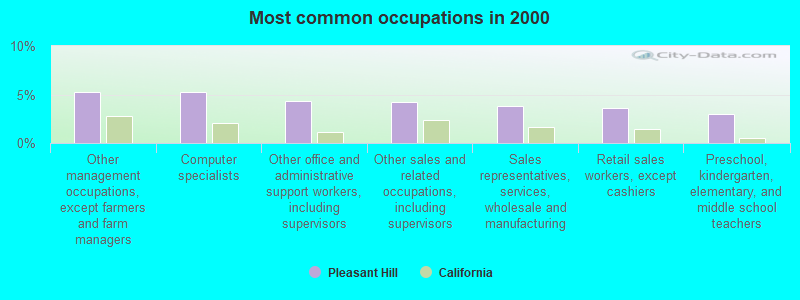
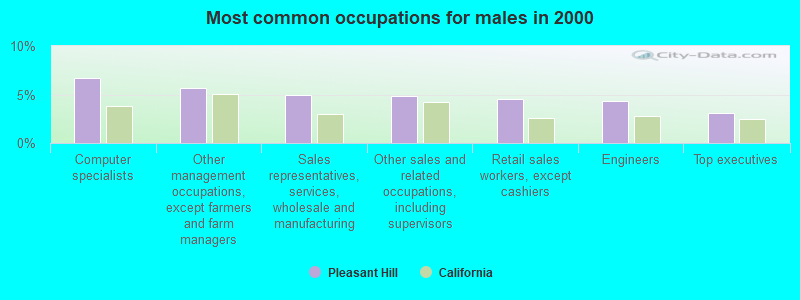
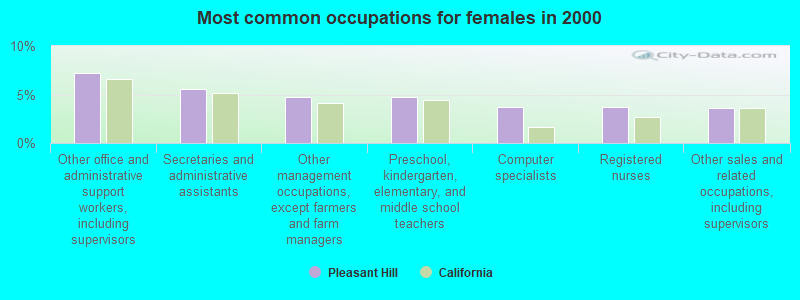
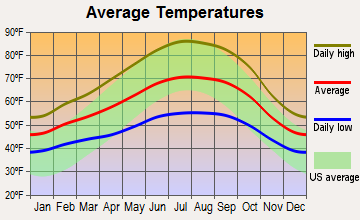
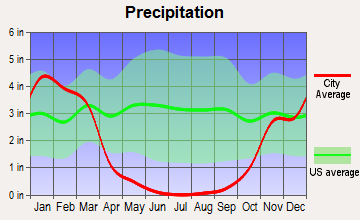
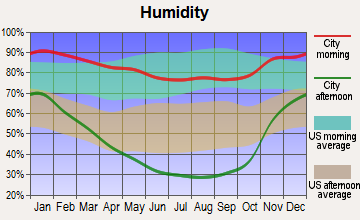
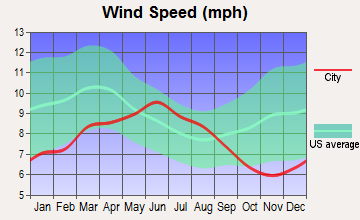
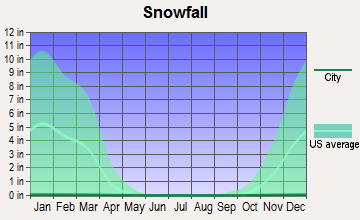
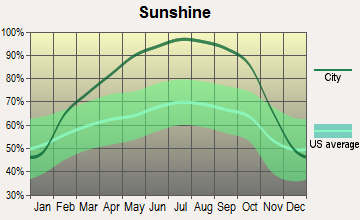
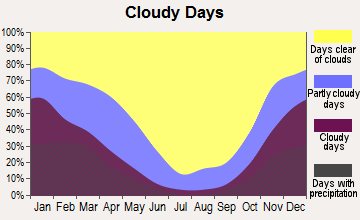
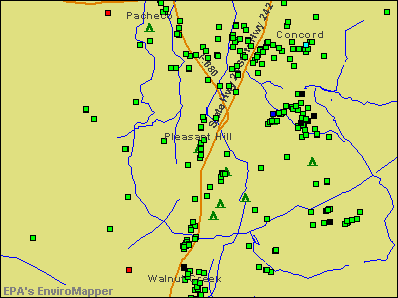

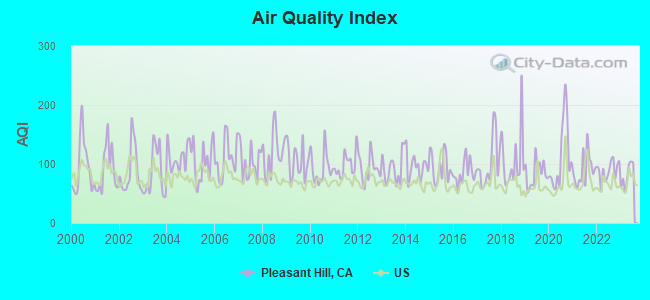
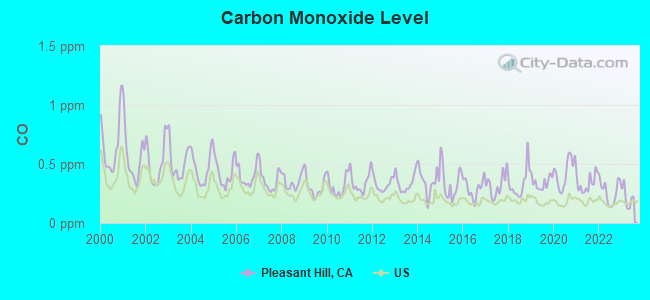
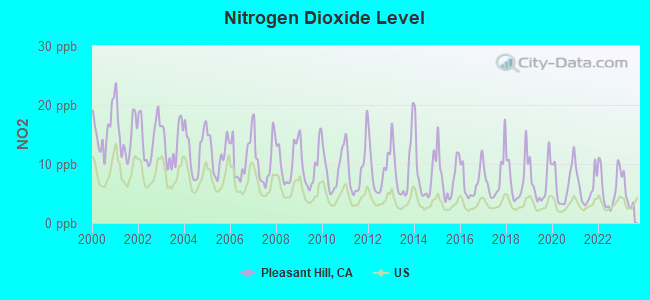
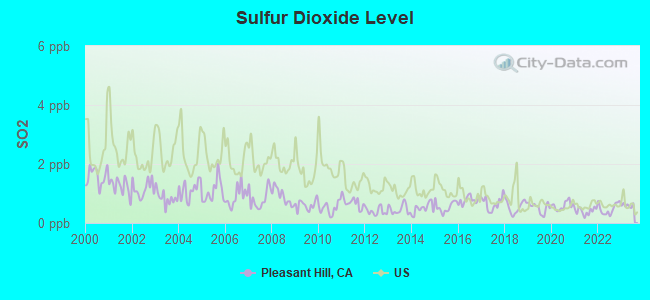
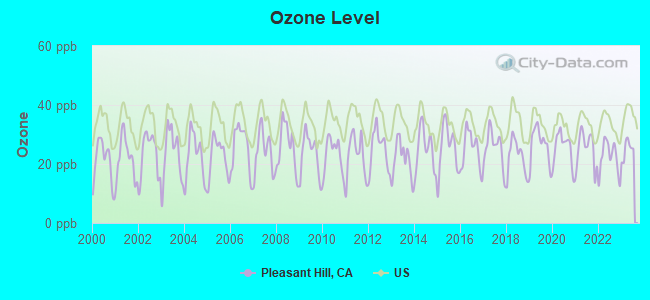
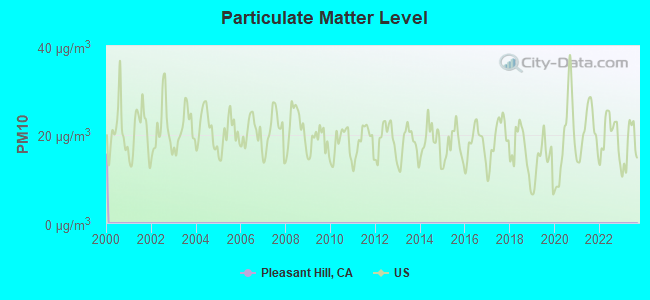
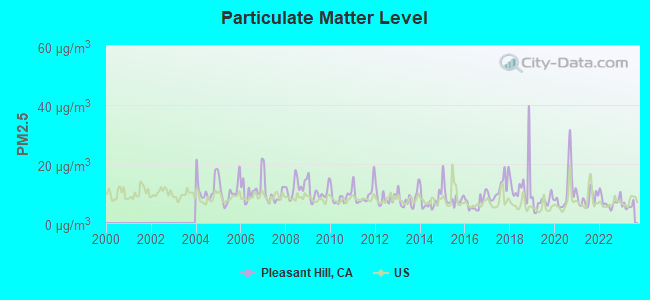
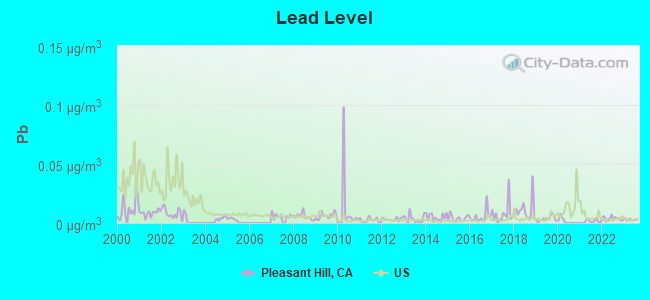

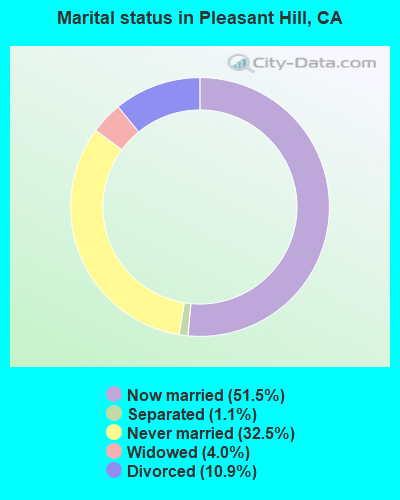
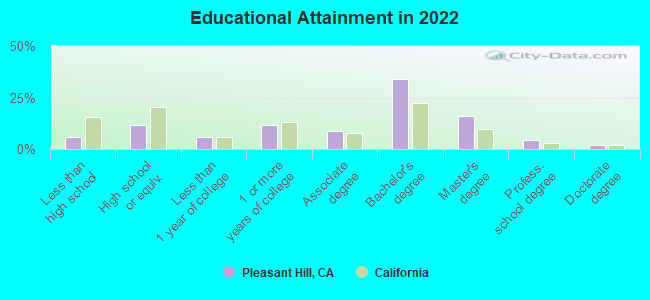
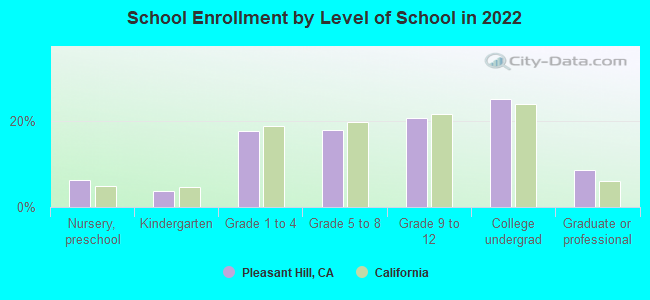
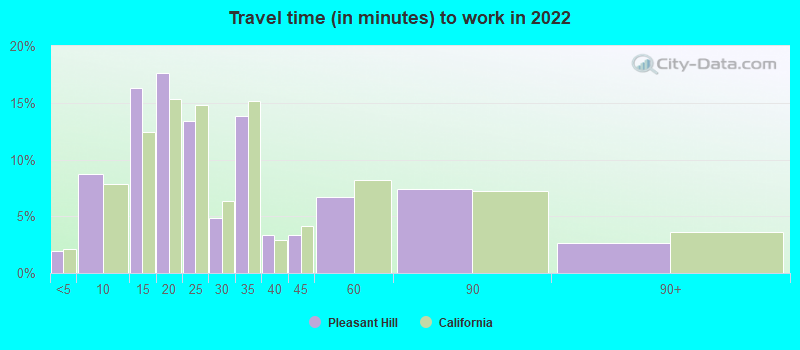
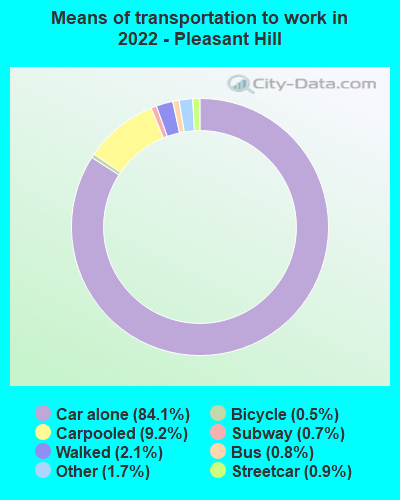


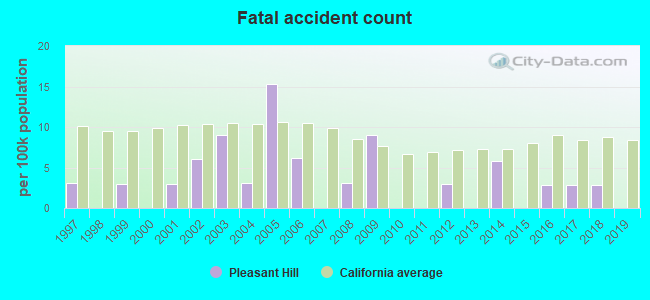
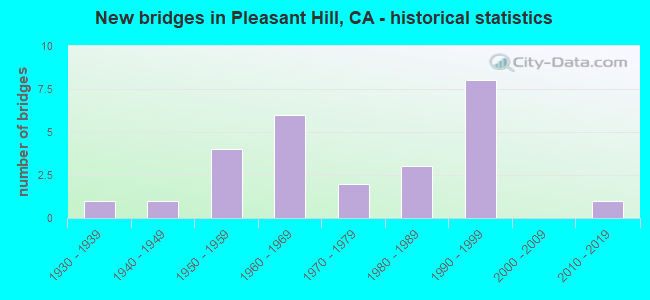
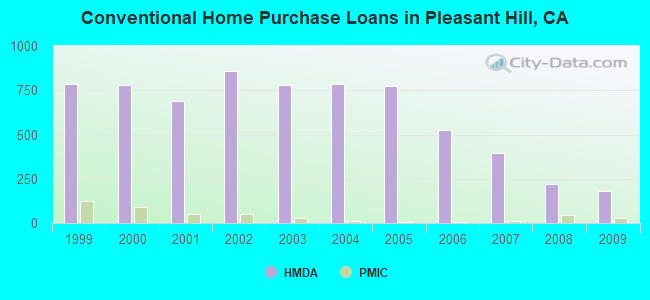
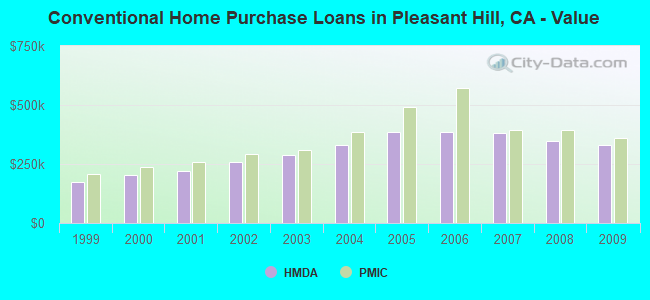
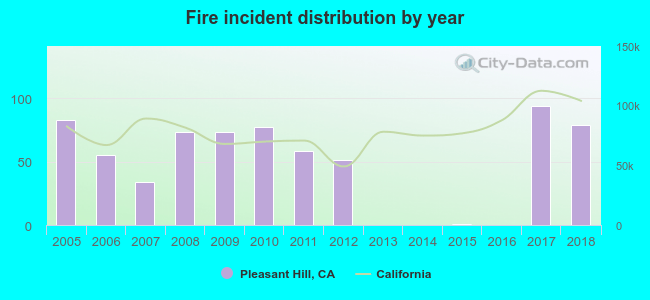 According to the data from the years 2005 - 2018 the average number of fires per year is 48. The highest number of fires - 94 took place in 2017, and the least - 0 in 2013. The data has a dropping trend.
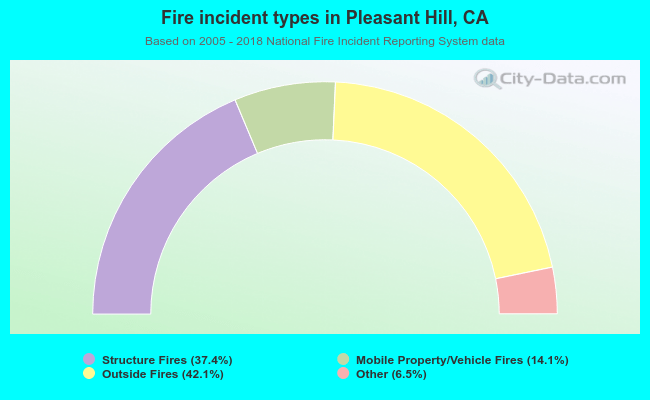 When looking into fire subcategories, the most reports belonged to: Outside Fires (42.1%), and Structure Fires (37.4%).