Housing density: 2,068 houses/condos per square mile
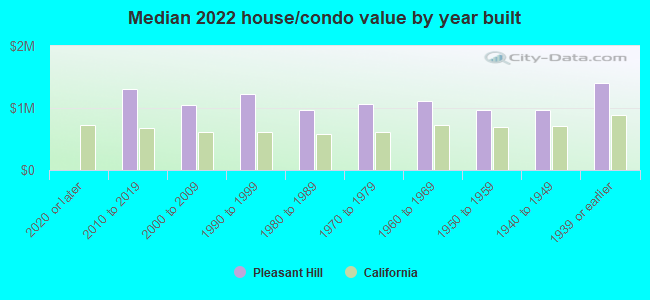
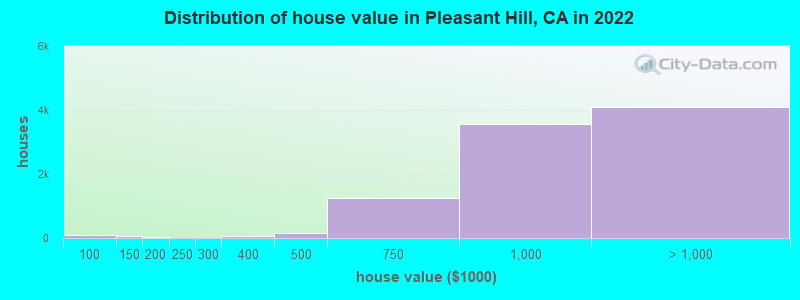
Median price asked for vacant for-sale houses and condos in 2022: $998,609.
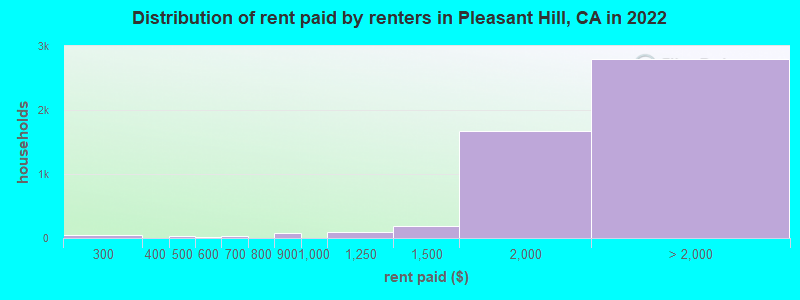
Median contract rent in 2022: over $2,000 (lower quartile is $1,764, upper quartile is over $2,000)
Median rent asked for vacant for-rent units in 2022: $1,966
Median gross rent in Pleasant Hill, CA in 2022: over $2,000
Housing units in Pleasant Hill with a mortgage: 6,893 (1,001 second mortgage, 12 home equity loan, 949 both second mortgage and home equity loan) Houses without a mortgage: 149
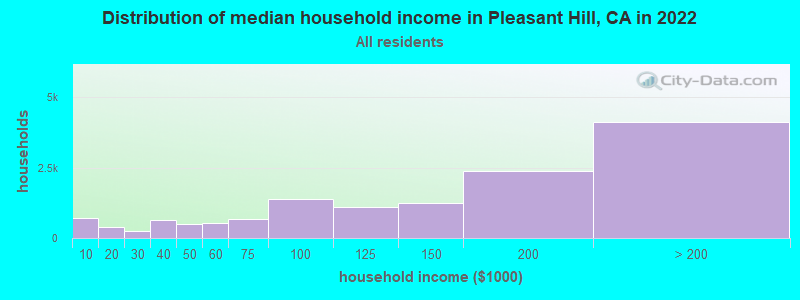
Median household income for houses/condos with a mortgage: $189,096
Median household income for apartments without a mortgage: $102,238
Median monthly housing costs: $2,610
Compare current foreclosures near Pleasant Hill, CA:
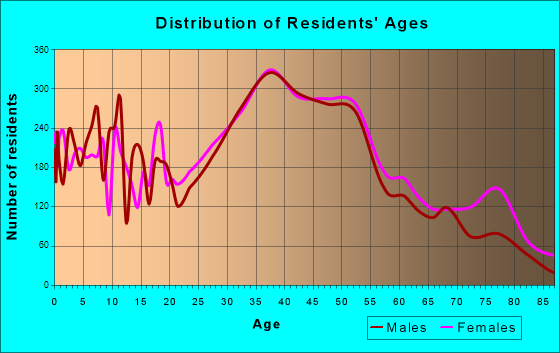
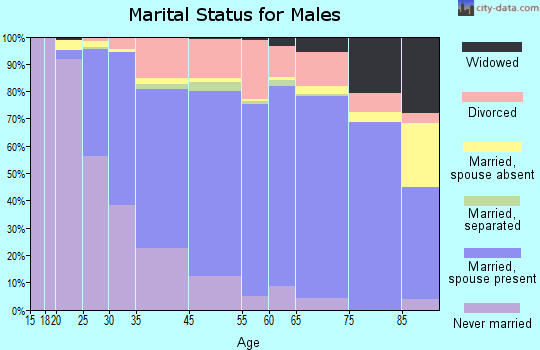
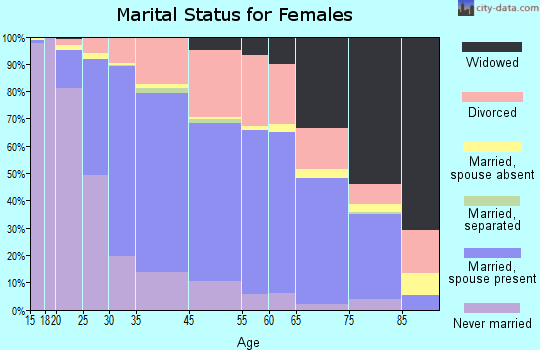
4,644 married couples with children.
1,276 single-parent households (292 men, 984 women).
73.4% of residents of Pleasant Hill speak English at home.
6.9% of residents speak Spanish at home (82% speak English very well, 12% speak English well, 5% speak English not well, 1% don't speak English at all).
8.7% of residents speak other Indo-European language at home (78% speak English very well, 15% speak English well, 6% speak English not well).
10.1% of residents speak Asian or Pacific Island language at home (44% speak English very well, 40% speak English well, 13% speak English not well, 3% don't speak English at all).
0.9% of residents speak other language at home (77% speak English very well, 15% speak English well, 8% speak English not well).
Foreign born population: 7,013 (20.4%)
(68.4% of them are naturalized citizens)
Percentage of workers working in this county: 71.6% Number of people working at home: 4,156 (22.8% of all workers)
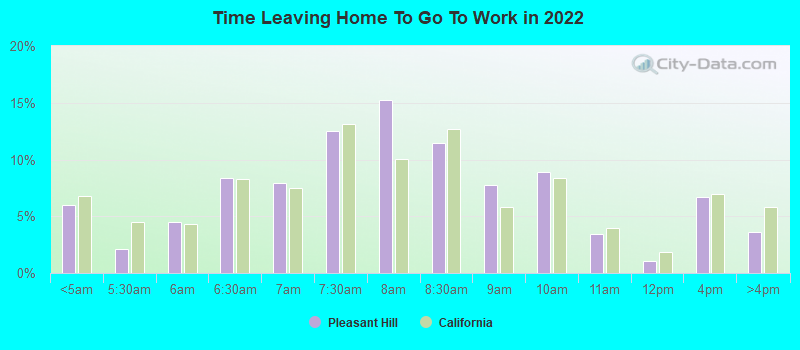
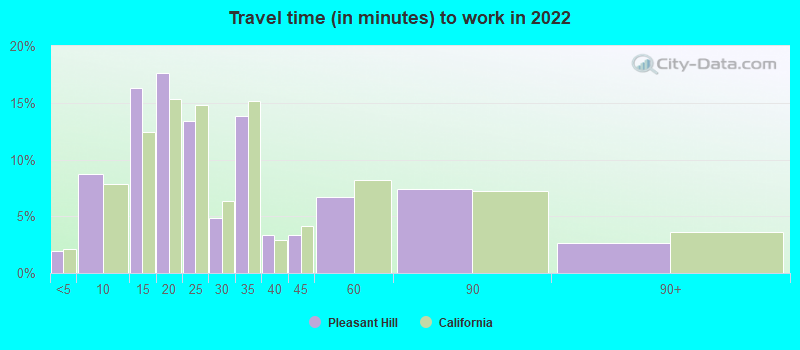
Travel time to work (commute)
Less than 5 minutes: 348
5 to 9 minutes: 983
10 to 14 minutes: 2,104
15 to 19 minutes: 2,109
20 to 24 minutes: 1,540
25 to 29 minutes: 889
30 to 34 minutes: 1,273
35 to 39 minutes: 396
40 to 44 minutes: 858
45 to 59 minutes: 1,642
60 to 89 minutes: 1,850
90 or more minutes: 401
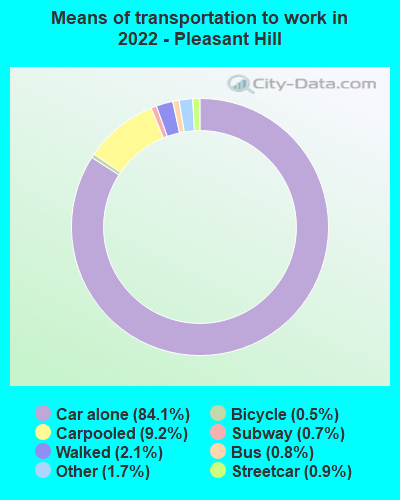
Means of transportation to work:
Drove a car alone: 10,938 (62.6%)
Carpooled: 1,345 (7.7%)
Bus: 79 (0.5%)
Subway or elevated rail: 74 (0.4%)
Long-distance train or commuter rail: 73 (0.4%)
Taxi: 241 (1.4%)
Bicycle: 44 (0.3%)
Walked: 393 (2.3%)
Worked at home: 4,156 (23.8%)
Unemployment by race in 2022
Unemployment rate for White non-Hispanic residents
3.3%Males
1.8%Females
Unemployment rate for Black residents
0.6%Males
Unemployment rate for Asian residents
1.0%Males
11.1%Females
Unemployment rate for other race residents
12.6%Males
Unemployment rate for two or more race residents
1.3%Males
3.8%Females
Unemployment rate for Hispanic or Latino residents
4.5%Males
5.1%Females
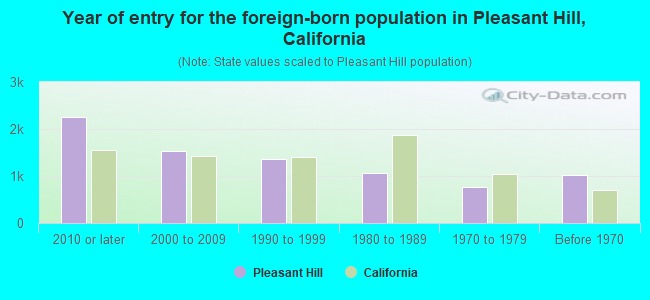
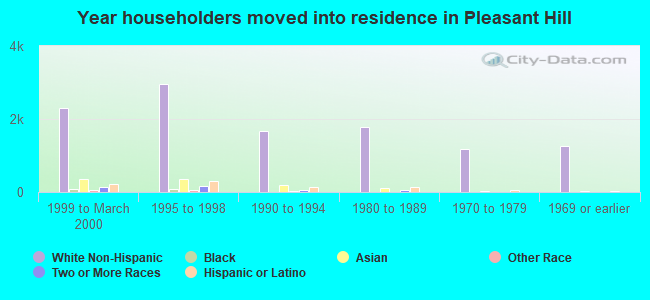
Year of entry for the foreign-born population in Pleasant Hill, California
2,2482010 or later
1,5252000 to 2009
1,3681990 to 1999
1,0581980 to 1989
7661970 to 1979
1,028Before 1970
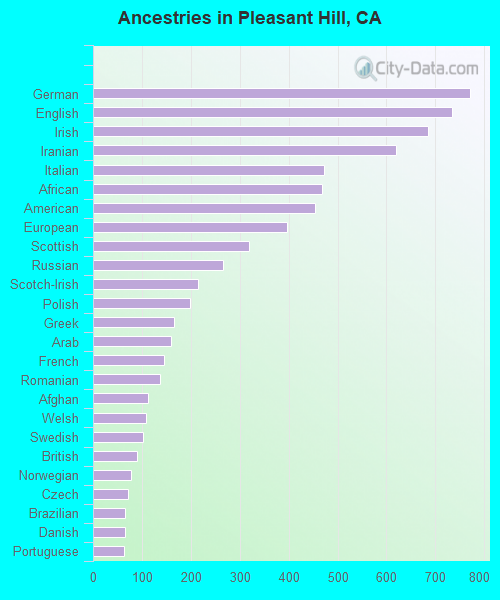
First ancestries reported:
German: 771 (5.0%)
English: 733 (4.8%)
Irish: 685 (4.5%)
Iranian: 619 (4.0%)
Italian: 472 (3.1%)
African: 469 (3.1%)
American: 454 (3.0%)
European: 396 (2.6%)
Scottish: 318 (2.1%)
Russian: 265 (1.7%)
Scotch-Irish: 215 (1.4%)
Polish: 199 (1.3%)
Greek: 165 (1.1%)
Arab: 160 (1.0%)
French: 145 (0.9%)
Romanian: 137 (0.9%)
Afghan: 113 (0.7%)
Welsh: 109 (0.7%)
Swedish: 103 (0.7%)
British: 89 (0.6%)
Norwegian: 78 (0.5%)
Czech: 72 (0.5%)
Brazilian: 65 (0.4%)
Danish: 65 (0.4%)
Portuguese: 64 (0.4%)
Ukrainian: 62 (0.4%)
Maltese: 60 (0.4%)
Belgian: 58 (0.4%)
Northern European: 56 (0.4%)
Scandinavian: 53 (0.3%)
Eastern European: 51 (0.3%)
West Indian: 41 (0.3%)
Albanian: 37 (0.2%)
Israeli: 34 (0.2%)
Dutch: 32 (0.2%)
Canadian: 27 (0.2%)
Serbian: 24 (0.2%)
Yugoslavian: 23 (0.2%)
Palestinian: 22 (0.1%)
Bulgarian: 18 (0.1%)
Lebanese: 18 (0.1%)
Armenian: 17 (0.1%)
Egyptian: 12 (0.08%)
Turkish: 12 (0.08%)
Swiss: 11 (0.07%)
Hungarian: 9 (0.06%)
French Canadian: 8 (0.05%)
Ethiopian: 5 (0.03%)
Icelander: 3 (0.02%)
Croatian: 3 (0.02%)
Most common places of birth for foreign-born residents (%):
India
Pleasant Hill:
9.0% (594)
California:
5.2% (539,184)
Philippines
Pleasant Hill:
8.7% (577)
California:
7.8% (818,297)
Iran
Pleasant Hill:
8.6% (573)
California:
2.0% (206,004)
Vietnam
Pleasant Hill:
6.7% (446)
California:
4.9% (512,335)
China, excluding Hong Kong and Taiwan
Pleasant Hill:
6.4% (425)
California:
6.6% (684,672)
Other Eastern Asia
Pleasant Hill:
4.3% (284)
California:
0.0% (5,043)
Afghanistan
Pleasant Hill:
4.0% (264)
California:
0.5% (53,260)
Taiwan
Pleasant Hill:
3.6% (240)
California:
1.7% (176,274)
Other Middle Africa
Pleasant Hill:
3.3% (220)
California:
0.0% (1,431)
Czechoslovakia (includes Czech Republic and Slovakia)
Pleasant Hill:
3.3% (220)
California:
0.1% (9,241)
Hong Kong
Pleasant Hill:
2.5% (168)
California:
1.0% (105,215)
El Salvador
Pleasant Hill:
2.5% (167)
California:
4.2% (440,287)
Mexico
Pleasant Hill:
2.5% (166)
California:
37.2% (3,881,193)
Canada
Pleasant Hill:
2.1% (140)
California:
1.2% (127,477)
Peru
Pleasant Hill:
2.1% (137)
California:
0.7% (74,025)
Germany
Pleasant Hill:
2.0% (131)
California:
0.7% (73,304)
Belarus
Pleasant Hill:
1.9% (129)
California:
0.1% (11,157)
Ukraine
Pleasant Hill:
1.8% (119)
California:
0.6% (60,761)
Brazil
Pleasant Hill:
1.8% (119)
California:
0.5% (53,222)
Place of birth for U.S.-born residents:
This state: 20,171
Other state: 6,384
Northeast: 1,728
Midwest: 2,074
South: 1,396
West: 1,187
87.8% of Pleasant Hill residents lived in the same house 1 years ago. Out of people who lived in different houses, 33.6% lived in this county. Out of people who lived in different counties, 76.9% lived in California.
Pleasant Hill:
87.8%
State average:
88.9%
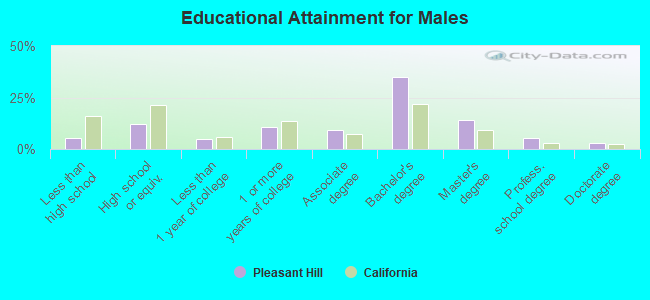
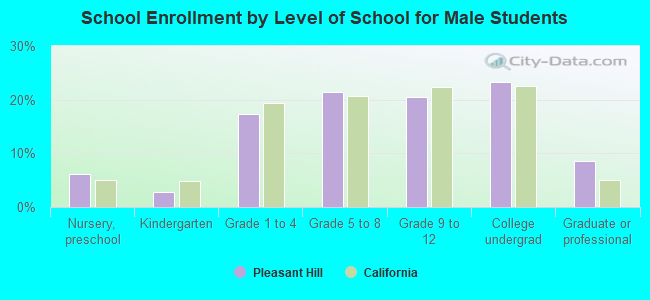
Education attainment for males 25 years and older:
No schooling: 231
Nursery to 4th grade: 84
5th and 6th grade: 114
7th and 8th grade: 9
9th grade: 2
10th grade: 11
11th grade: 37
12th grade, no diploma: 170
High school graduate (or equivalency): 1,446
Less than 1 year of college: 576
Some college more than 1 year, no degree: 1,292
Associate degree: 1,114
Bachelor's degree: 4,187
Master's degree: 1,660
Professional school degree: 659
Doctorate degree: 337
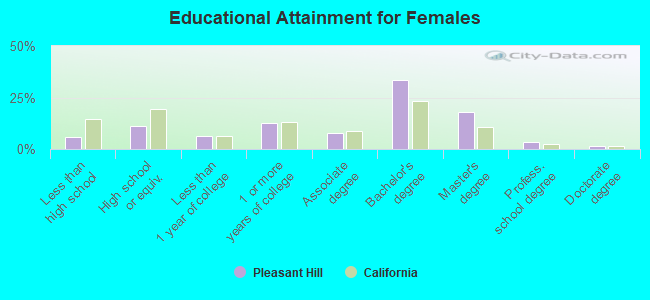
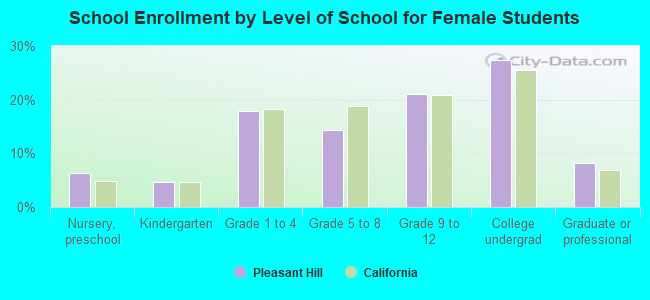
Education attainment for females 25 years and older:
No schooling: 371
Nursery to 4th grade: 19
5th and 6th grade: 17
7th and 8th grade: 16
9th grade: 26
10th grade: 8
11th grade: 40
12th grade, no diploma: 273
High school graduate (or equivalency): 1,480
Less than 1 year of college: 844
Some college more than 1 year, no degree: 1,643
Associate degree: 1,041
Bachelor's degree: 4,363
Master's degree: 2,325
Professional school degree: 418
Doctorate degree: 171
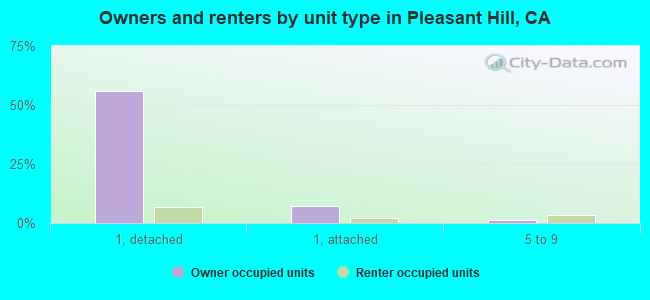
Housing units in structures:
One, detached: 8,694
One, attached: 1,374
Two: 228
3 or 4: 962
5 to 9: 746
10 to 19: 278
20 to 49: 871
50 or more: 1,447
Mobile homes: 51
Housing units lacking complete plumbing facilities in 2022: 0.1%
Housing units lacking complete kitchen facilities in 2022: 3.4%
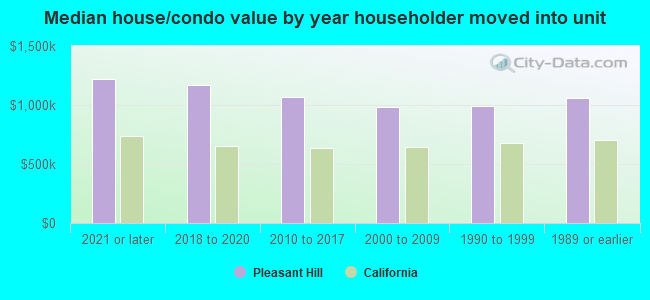
House/condo owner moved in on average 15 years ago