Martinez, California Submit your own pictures of this city and show them to the world
OSM Map
General Map
Google Map
MSN Map
OSM Map
General Map
Google Map
MSN Map
OSM Map
General Map
Google Map
MSN Map
OSM Map
General Map
Google Map
MSN Map
Please wait while loading the map...
Population in 2022: 36,447 (100% urban, 0% rural). Population change since 2000: +1.6%Males: 18,207 Females: 18,240
March 2022 cost of living index in Martinez: 119.0 (more than average, U.S. average is 100) Percentage of residents living in poverty in 2022: 5.3%for White Non-Hispanic residents , 14.1% for Black residents , 3.1% for Hispanic or Latino residents , 7.8% for other race residents , 2.7% for two or more races residents )
Profiles of local businesses
Business Search - 14 Million verified businesses
Data:
Median household income ($)
Median household income (% change since 2000)
Household income diversity
Ratio of average income to average house value (%)
Ratio of average income to average rent
Median household income ($) - White
Median household income ($) - Black or African American
Median household income ($) - Asian
Median household income ($) - Hispanic or Latino
Median household income ($) - American Indian and Alaska Native
Median household income ($) - Multirace
Median household income ($) - Other Race
Median household income for houses/condos with a mortgage ($)
Median household income for apartments without a mortgage ($)
Races - White alone (%)
Races - White alone (% change since 2000)
Races - Black alone (%)
Races - Black alone (% change since 2000)
Races - American Indian alone (%)
Races - American Indian alone (% change since 2000)
Races - Asian alone (%)
Races - Asian alone (% change since 2000)
Races - Hispanic (%)
Races - Hispanic (% change since 2000)
Races - Native Hawaiian and Other Pacific Islander alone (%)
Races - Native Hawaiian and Other Pacific Islander alone (% change since 2000)
Races - Two or more races (%)
Races - Two or more races (% change since 2000)
Races - Other race alone (%)
Races - Other race alone (% change since 2000)
Racial diversity
Unemployment (%)
Unemployment (% change since 2000)
Unemployment (%) - White
Unemployment (%) - Black or African American
Unemployment (%) - Asian
Unemployment (%) - Hispanic or Latino
Unemployment (%) - American Indian and Alaska Native
Unemployment (%) - Multirace
Unemployment (%) - Other Race
Population density (people per square mile)
Population - Males (%)
Population - Females (%)
Population - Males (%) - White
Population - Males (%) - Black or African American
Population - Males (%) - Asian
Population - Males (%) - Hispanic or Latino
Population - Males (%) - American Indian and Alaska Native
Population - Males (%) - Multirace
Population - Males (%) - Other Race
Population - Females (%) - White
Population - Females (%) - Black or African American
Population - Females (%) - Asian
Population - Females (%) - Hispanic or Latino
Population - Females (%) - American Indian and Alaska Native
Population - Females (%) - Multirace
Population - Females (%) - Other Race
Coronavirus confirmed cases (Apr 27, 2024)
Deaths caused by coronavirus (Apr 27, 2024)
Coronavirus confirmed cases (per 100k population) (Apr 27, 2024)
Deaths caused by coronavirus (per 100k population) (Apr 27, 2024)
Daily increase in number of cases (Apr 27, 2024)
Weekly increase in number of cases (Apr 27, 2024)
Cases doubled (in days) (Apr 27, 2024)
Hospitalized patients (Apr 18, 2022)
Negative test results (Apr 18, 2022)
Total test results (Apr 18, 2022)
COVID Vaccine doses distributed (per 100k population) (Sep 19, 2023)
COVID Vaccine doses administered (per 100k population) (Sep 19, 2023)
COVID Vaccine doses distributed (Sep 19, 2023)
COVID Vaccine doses administered (Sep 19, 2023)
Likely homosexual households (%)
Likely homosexual households (% change since 2000)
Likely homosexual households - Lesbian couples (%)
Likely homosexual households - Lesbian couples (% change since 2000)
Likely homosexual households - Gay men (%)
Likely homosexual households - Gay men (% change since 2000)
Cost of living index
Median gross rent ($)
Median contract rent ($)
Median monthly housing costs ($)
Median house or condo value ($)
Median house or condo value ($ change since 2000)
Mean house or condo value by units in structure - 1, detached ($)
Mean house or condo value by units in structure - 1, attached ($)
Mean house or condo value by units in structure - 2 ($)
Mean house or condo value by units in structure by units in structure - 3 or 4 ($)
Mean house or condo value by units in structure - 5 or more ($)
Mean house or condo value by units in structure - Boat, RV, van, etc. ($)
Mean house or condo value by units in structure - Mobile home ($)
Median house or condo value ($) - White
Median house or condo value ($) - Black or African American
Median house or condo value ($) - Asian
Median house or condo value ($) - Hispanic or Latino
Median house or condo value ($) - American Indian and Alaska Native
Median house or condo value ($) - Multirace
Median house or condo value ($) - Other Race
Median resident age
Resident age diversity
Median resident age - Males
Median resident age - Females
Median resident age - White
Median resident age - Black or African American
Median resident age - Asian
Median resident age - Hispanic or Latino
Median resident age - American Indian and Alaska Native
Median resident age - Multirace
Median resident age - Other Race
Median resident age - Males - White
Median resident age - Males - Black or African American
Median resident age - Males - Asian
Median resident age - Males - Hispanic or Latino
Median resident age - Males - American Indian and Alaska Native
Median resident age - Males - Multirace
Median resident age - Males - Other Race
Median resident age - Females - White
Median resident age - Females - Black or African American
Median resident age - Females - Asian
Median resident age - Females - Hispanic or Latino
Median resident age - Females - American Indian and Alaska Native
Median resident age - Females - Multirace
Median resident age - Females - Other Race
Commute - mean travel time to work (minutes)
Travel time to work - Less than 5 minutes (%)
Travel time to work - Less than 5 minutes (% change since 2000)
Travel time to work - 5 to 9 minutes (%)
Travel time to work - 5 to 9 minutes (% change since 2000)
Travel time to work - 10 to 19 minutes (%)
Travel time to work - 10 to 19 minutes (% change since 2000)
Travel time to work - 20 to 29 minutes (%)
Travel time to work - 20 to 29 minutes (% change since 2000)
Travel time to work - 30 to 39 minutes (%)
Travel time to work - 30 to 39 minutes (% change since 2000)
Travel time to work - 40 to 59 minutes (%)
Travel time to work - 40 to 59 minutes (% change since 2000)
Travel time to work - 60 to 89 minutes (%)
Travel time to work - 60 to 89 minutes (% change since 2000)
Travel time to work - 90 or more minutes (%)
Travel time to work - 90 or more minutes (% change since 2000)
Marital status - Never married (%)
Marital status - Now married (%)
Marital status - Separated (%)
Marital status - Widowed (%)
Marital status - Divorced (%)
Median family income ($)
Median family income (% change since 2000)
Median non-family income ($)
Median non-family income (% change since 2000)
Median per capita income ($)
Median per capita income (% change since 2000)
Median family income ($) - White
Median family income ($) - Black or African American
Median family income ($) - Asian
Median family income ($) - Hispanic or Latino
Median family income ($) - American Indian and Alaska Native
Median family income ($) - Multirace
Median family income ($) - Other Race
Median year house/condo built
Median year apartment built
Year house built - Built 2005 or later (%)
Year house built - Built 2000 to 2004 (%)
Year house built - Built 1990 to 1999 (%)
Year house built - Built 1980 to 1989 (%)
Year house built - Built 1970 to 1979 (%)
Year house built - Built 1960 to 1969 (%)
Year house built - Built 1950 to 1959 (%)
Year house built - Built 1940 to 1949 (%)
Year house built - Built 1939 or earlier (%)
Average household size
Household density (households per square mile)
Average household size - White
Average household size - Black or African American
Average household size - Asian
Average household size - Hispanic or Latino
Average household size - American Indian and Alaska Native
Average household size - Multirace
Average household size - Other Race
Occupied housing units (%)
Vacant housing units (%)
Owner occupied housing units (%)
Renter occupied housing units (%)
Vacancy status - For rent (%)
Vacancy status - For sale only (%)
Vacancy status - Rented or sold, not occupied (%)
Vacancy status - For seasonal, recreational, or occasional use (%)
Vacancy status - For migrant workers (%)
Vacancy status - Other vacant (%)
Residents with income below the poverty level (%)
Residents with income below 50% of the poverty level (%)
Children below poverty level (%)
Poor families by family type - Married-couple family (%)
Poor families by family type - Male, no wife present (%)
Poor families by family type - Female, no husband present (%)
Poverty status for native-born residents (%)
Poverty status for foreign-born residents (%)
Poverty among high school graduates not in families (%)
Poverty among people who did not graduate high school not in families (%)
Residents with income below the poverty level (%) - White
Residents with income below the poverty level (%) - Black or African American
Residents with income below the poverty level (%) - Asian
Residents with income below the poverty level (%) - Hispanic or Latino
Residents with income below the poverty level (%) - American Indian and Alaska Native
Residents with income below the poverty level (%) - Multirace
Residents with income below the poverty level (%) - Other Race
Air pollution - Air Quality Index (AQI)
Air pollution - CO
Air pollution - NO2
Air pollution - SO2
Air pollution - Ozone
Air pollution - PM10
Air pollution - PM25
Air pollution - Pb
Crime - Murders per 100,000 population
Crime - Rapes per 100,000 population
Crime - Robberies per 100,000 population
Crime - Assaults per 100,000 population
Crime - Burglaries per 100,000 population
Crime - Thefts per 100,000 population
Crime - Auto thefts per 100,000 population
Crime - Arson per 100,000 population
Crime - City-data.com crime index
Crime - Violent crime index
Crime - Property crime index
Crime - Murders per 100,000 population (5 year average)
Crime - Rapes per 100,000 population (5 year average)
Crime - Robberies per 100,000 population (5 year average)
Crime - Assaults per 100,000 population (5 year average)
Crime - Burglaries per 100,000 population (5 year average)
Crime - Thefts per 100,000 population (5 year average)
Crime - Auto thefts per 100,000 population (5 year average)
Crime - Arson per 100,000 population (5 year average)
Crime - City-data.com crime index (5 year average)
Crime - Violent crime index (5 year average)
Crime - Property crime index (5 year average)
1996 Presidential Elections Results (%) - Democratic Party (Clinton)
1996 Presidential Elections Results (%) - Republican Party (Dole)
1996 Presidential Elections Results (%) - Other
2000 Presidential Elections Results (%) - Democratic Party (Gore)
2000 Presidential Elections Results (%) - Republican Party (Bush)
2000 Presidential Elections Results (%) - Other
2004 Presidential Elections Results (%) - Democratic Party (Kerry)
2004 Presidential Elections Results (%) - Republican Party (Bush)
2004 Presidential Elections Results (%) - Other
2008 Presidential Elections Results (%) - Democratic Party (Obama)
2008 Presidential Elections Results (%) - Republican Party (McCain)
2008 Presidential Elections Results (%) - Other
2012 Presidential Elections Results (%) - Democratic Party (Obama)
2012 Presidential Elections Results (%) - Republican Party (Romney)
2012 Presidential Elections Results (%) - Other
2016 Presidential Elections Results (%) - Democratic Party (Clinton)
2016 Presidential Elections Results (%) - Republican Party (Trump)
2016 Presidential Elections Results (%) - Other
2020 Presidential Elections Results (%) - Democratic Party (Biden)
2020 Presidential Elections Results (%) - Republican Party (Trump)
2020 Presidential Elections Results (%) - Other
Ancestries Reported - Arab (%)
Ancestries Reported - Czech (%)
Ancestries Reported - Danish (%)
Ancestries Reported - Dutch (%)
Ancestries Reported - English (%)
Ancestries Reported - French (%)
Ancestries Reported - French Canadian (%)
Ancestries Reported - German (%)
Ancestries Reported - Greek (%)
Ancestries Reported - Hungarian (%)
Ancestries Reported - Irish (%)
Ancestries Reported - Italian (%)
Ancestries Reported - Lithuanian (%)
Ancestries Reported - Norwegian (%)
Ancestries Reported - Polish (%)
Ancestries Reported - Portuguese (%)
Ancestries Reported - Russian (%)
Ancestries Reported - Scotch-Irish (%)
Ancestries Reported - Scottish (%)
Ancestries Reported - Slovak (%)
Ancestries Reported - Subsaharan African (%)
Ancestries Reported - Swedish (%)
Ancestries Reported - Swiss (%)
Ancestries Reported - Ukrainian (%)
Ancestries Reported - United States (%)
Ancestries Reported - Welsh (%)
Ancestries Reported - West Indian (%)
Ancestries Reported - Other (%)
Educational Attainment - No schooling completed (%)
Educational Attainment - Less than high school (%)
Educational Attainment - High school or equivalent (%)
Educational Attainment - Less than 1 year of college (%)
Educational Attainment - 1 or more years of college (%)
Educational Attainment - Associate degree (%)
Educational Attainment - Bachelor's degree (%)
Educational Attainment - Master's degree (%)
Educational Attainment - Professional school degree (%)
Educational Attainment - Doctorate degree (%)
School Enrollment - Nursery, preschool (%)
School Enrollment - Kindergarten (%)
School Enrollment - Grade 1 to 4 (%)
School Enrollment - Grade 5 to 8 (%)
School Enrollment - Grade 9 to 12 (%)
School Enrollment - College undergrad (%)
School Enrollment - Graduate or professional (%)
School Enrollment - Not enrolled in school (%)
School enrollment - Public schools (%)
School enrollment - Private schools (%)
School enrollment - Not enrolled (%)
Median number of rooms in houses and condos
Median number of rooms in apartments
Housing units lacking complete plumbing facilities (%)
Housing units lacking complete kitchen facilities (%)
Density of houses
Urban houses (%)
Rural houses (%)
Households with people 60 years and over (%)
Households with people 65 years and over (%)
Households with people 75 years and over (%)
Households with one or more nonrelatives (%)
Households with no nonrelatives (%)
Population in households (%)
Family households (%)
Nonfamily households (%)
Population in families (%)
Family households with own children (%)
Median number of bedrooms in owner occupied houses
Mean number of bedrooms in owner occupied houses
Median number of bedrooms in renter occupied houses
Mean number of bedrooms in renter occupied houses
Median number of vehichles in owner occupied houses
Mean number of vehichles in owner occupied houses
Median number of vehichles in renter occupied houses
Mean number of vehichles in renter occupied houses
Mortgage status - with mortgage (%)
Mortgage status - with second mortgage (%)
Mortgage status - with home equity loan (%)
Mortgage status - with both second mortgage and home equity loan (%)
Mortgage status - without a mortgage (%)
Average family size
Average family size - White
Average family size - Black or African American
Average family size - Asian
Average family size - Hispanic or Latino
Average family size - American Indian and Alaska Native
Average family size - Multirace
Average family size - Other Race
Geographical mobility - Same house 1 year ago (%)
Geographical mobility - Moved within same county (%)
Geographical mobility - Moved from different county within same state (%)
Geographical mobility - Moved from different state (%)
Geographical mobility - Moved from abroad (%)
Place of birth - Born in state of residence (%)
Place of birth - Born in other state (%)
Place of birth - Native, outside of US (%)
Place of birth - Foreign born (%)
Housing units in structures - 1, detached (%)
Housing units in structures - 1, attached (%)
Housing units in structures - 2 (%)
Housing units in structures - 3 or 4 (%)
Housing units in structures - 5 to 9 (%)
Housing units in structures - 10 to 19 (%)
Housing units in structures - 20 to 49 (%)
Housing units in structures - 50 or more (%)
Housing units in structures - Mobile home (%)
Housing units in structures - Boat, RV, van, etc. (%)
House/condo owner moved in on average (years ago)
Renter moved in on average (years ago)
Year householder moved into unit - Moved in 1999 to March 2000 (%)
Year householder moved into unit - Moved in 1995 to 1998 (%)
Year householder moved into unit - Moved in 1990 to 1994 (%)
Year householder moved into unit - Moved in 1980 to 1989 (%)
Year householder moved into unit - Moved in 1970 to 1979 (%)
Year householder moved into unit - Moved in 1969 or earlier (%)
Means of transportation to work - Drove car alone (%)
Means of transportation to work - Carpooled (%)
Means of transportation to work - Public transportation (%)
Means of transportation to work - Bus or trolley bus (%)
Means of transportation to work - Streetcar or trolley car (%)
Means of transportation to work - Subway or elevated (%)
Means of transportation to work - Railroad (%)
Means of transportation to work - Ferryboat (%)
Means of transportation to work - Taxicab (%)
Means of transportation to work - Motorcycle (%)
Means of transportation to work - Bicycle (%)
Means of transportation to work - Walked (%)
Means of transportation to work - Other means (%)
Working at home (%)
Industry diversity
Most Common Industries - Agriculture, forestry, fishing and hunting, and mining (%)
Most Common Industries - Agriculture, forestry, fishing and hunting (%)
Most Common Industries - Mining, quarrying, and oil and gas extraction (%)
Most Common Industries - Construction (%)
Most Common Industries - Manufacturing (%)
Most Common Industries - Wholesale trade (%)
Most Common Industries - Retail trade (%)
Most Common Industries - Transportation and warehousing, and utilities (%)
Most Common Industries - Transportation and warehousing (%)
Most Common Industries - Utilities (%)
Most Common Industries - Information (%)
Most Common Industries - Finance and insurance, and real estate and rental and leasing (%)
Most Common Industries - Finance and insurance (%)
Most Common Industries - Real estate and rental and leasing (%)
Most Common Industries - Professional, scientific, and management, and administrative and waste management services (%)
Most Common Industries - Professional, scientific, and technical services (%)
Most Common Industries - Management of companies and enterprises (%)
Most Common Industries - Administrative and support and waste management services (%)
Most Common Industries - Educational services, and health care and social assistance (%)
Most Common Industries - Educational services (%)
Most Common Industries - Health care and social assistance (%)
Most Common Industries - Arts, entertainment, and recreation, and accommodation and food services (%)
Most Common Industries - Arts, entertainment, and recreation (%)
Most Common Industries - Accommodation and food services (%)
Most Common Industries - Other services, except public administration (%)
Most Common Industries - Public administration (%)
Occupation diversity
Most Common Occupations - Management, business, science, and arts occupations (%)
Most Common Occupations - Management, business, and financial occupations (%)
Most Common Occupations - Management occupations (%)
Most Common Occupations - Business and financial operations occupations (%)
Most Common Occupations - Computer, engineering, and science occupations (%)
Most Common Occupations - Computer and mathematical occupations (%)
Most Common Occupations - Architecture and engineering occupations (%)
Most Common Occupations - Life, physical, and social science occupations (%)
Most Common Occupations - Education, legal, community service, arts, and media occupations (%)
Most Common Occupations - Community and social service occupations (%)
Most Common Occupations - Legal occupations (%)
Most Common Occupations - Education, training, and library occupations (%)
Most Common Occupations - Arts, design, entertainment, sports, and media occupations (%)
Most Common Occupations - Healthcare practitioners and technical occupations (%)
Most Common Occupations - Health diagnosing and treating practitioners and other technical occupations (%)
Most Common Occupations - Health technologists and technicians (%)
Most Common Occupations - Service occupations (%)
Most Common Occupations - Healthcare support occupations (%)
Most Common Occupations - Protective service occupations (%)
Most Common Occupations - Fire fighting and prevention, and other protective service workers including supervisors (%)
Most Common Occupations - Law enforcement workers including supervisors (%)
Most Common Occupations - Food preparation and serving related occupations (%)
Most Common Occupations - Building and grounds cleaning and maintenance occupations (%)
Most Common Occupations - Personal care and service occupations (%)
Most Common Occupations - Sales and office occupations (%)
Most Common Occupations - Sales and related occupations (%)
Most Common Occupations - Office and administrative support occupations (%)
Most Common Occupations - Natural resources, construction, and maintenance occupations (%)
Most Common Occupations - Farming, fishing, and forestry occupations (%)
Most Common Occupations - Construction and extraction occupations (%)
Most Common Occupations - Installation, maintenance, and repair occupations (%)
Most Common Occupations - Production, transportation, and material moving occupations (%)
Most Common Occupations - Production occupations (%)
Most Common Occupations - Transportation occupations (%)
Most Common Occupations - Material moving occupations (%)
People in Group quarters - Institutionalized population (%)
People in Group quarters - Correctional institutions (%)
People in Group quarters - Federal prisons and detention centers (%)
People in Group quarters - Halfway houses (%)
People in Group quarters - Local jails and other confinement facilities (including police lockups) (%)
People in Group quarters - Military disciplinary barracks (%)
People in Group quarters - State prisons (%)
People in Group quarters - Other types of correctional institutions (%)
People in Group quarters - Nursing homes (%)
People in Group quarters - Hospitals/wards, hospices, and schools for the handicapped (%)
People in Group quarters - Hospitals/wards and hospices for chronically ill (%)
People in Group quarters - Hospices or homes for chronically ill (%)
People in Group quarters - Military hospitals or wards for chronically ill (%)
People in Group quarters - Other hospitals or wards for chronically ill (%)
People in Group quarters - Hospitals or wards for drug/alcohol abuse (%)
People in Group quarters - Mental (Psychiatric) hospitals or wards (%)
People in Group quarters - Schools, hospitals, or wards for the mentally retarded (%)
People in Group quarters - Schools, hospitals, or wards for the physically handicapped (%)
People in Group quarters - Institutions for the deaf (%)
People in Group quarters - Institutions for the blind (%)
People in Group quarters - Orthopedic wards and institutions for the physically handicapped (%)
People in Group quarters - Wards in general hospitals for patients who have no usual home elsewhere (%)
People in Group quarters - Wards in military hospitals for patients who have no usual home elsewhere (%)
People in Group quarters - Juvenile institutions (%)
People in Group quarters - Long-term care (%)
People in Group quarters - Homes for abused, dependent, and neglected children (%)
People in Group quarters - Residential treatment centers for emotionally disturbed children (%)
People in Group quarters - Training schools for juvenile delinquents (%)
People in Group quarters - Short-term care, detention or diagnostic centers for delinquent children (%)
People in Group quarters - Type of juvenile institution unknown (%)
People in Group quarters - Noninstitutionalized population (%)
People in Group quarters - College dormitories (includes college quarters off campus) (%)
People in Group quarters - Military quarters (%)
People in Group quarters - On base (%)
People in Group quarters - Barracks, unaccompanied personnel housing (UPH), (Enlisted/Officer), ;and similar group living quarters for military personnel (%)
People in Group quarters - Transient quarters for temporary residents (%)
People in Group quarters - Military ships (%)
People in Group quarters - Group homes (%)
People in Group quarters - Homes or halfway houses for drug/alcohol abuse (%)
People in Group quarters - Homes for the mentally ill (%)
People in Group quarters - Homes for the mentally retarded (%)
People in Group quarters - Homes for the physically handicapped (%)
People in Group quarters - Other group homes (%)
People in Group quarters - Religious group quarters (%)
People in Group quarters - Dormitories (%)
People in Group quarters - Agriculture workers' dormitories on farms (%)
People in Group quarters - Job Corps and vocational training facilities (%)
People in Group quarters - Other workers' dormitories (%)
People in Group quarters - Crews of maritime vessels (%)
People in Group quarters - Other nonhousehold living situations (%)
People in Group quarters - Other noninstitutional group quarters (%)
Residents speaking English at home (%)
Residents speaking English at home - Born in the United States (%)
Residents speaking English at home - Native, born elsewhere (%)
Residents speaking English at home - Foreign born (%)
Residents speaking Spanish at home (%)
Residents speaking Spanish at home - Born in the United States (%)
Residents speaking Spanish at home - Native, born elsewhere (%)
Residents speaking Spanish at home - Foreign born (%)
Residents speaking other language at home (%)
Residents speaking other language at home - Born in the United States (%)
Residents speaking other language at home - Native, born elsewhere (%)
Residents speaking other language at home - Foreign born (%)
Class of Workers - Employee of private company (%)
Class of Workers - Self-employed in own incorporated business (%)
Class of Workers - Private not-for-profit wage and salary workers (%)
Class of Workers - Local government workers (%)
Class of Workers - State government workers (%)
Class of Workers - Federal government workers (%)
Class of Workers - Self-employed workers in own not incorporated business and Unpaid family workers (%)
House heating fuel used in houses and condos - Utility gas (%)
House heating fuel used in houses and condos - Bottled, tank, or LP gas (%)
House heating fuel used in houses and condos - Electricity (%)
House heating fuel used in houses and condos - Fuel oil, kerosene, etc. (%)
House heating fuel used in houses and condos - Coal or coke (%)
House heating fuel used in houses and condos - Wood (%)
House heating fuel used in houses and condos - Solar energy (%)
House heating fuel used in houses and condos - Other fuel (%)
House heating fuel used in houses and condos - No fuel used (%)
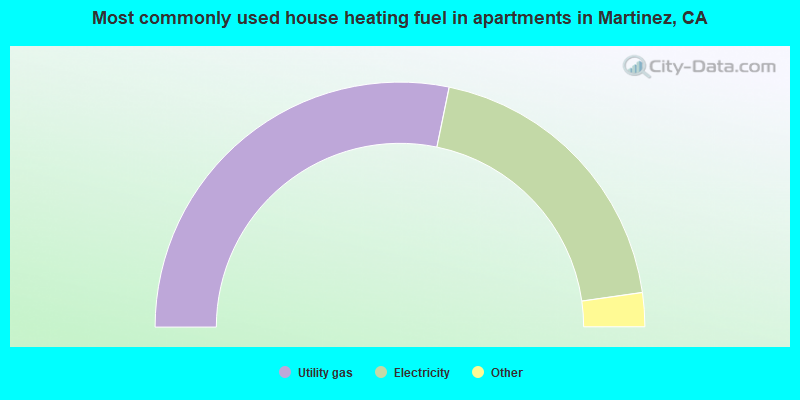
House heating fuel used in apartments - Utility gas (%)
House heating fuel used in apartments - Bottled, tank, or LP gas (%)
House heating fuel used in apartments - Electricity (%)
House heating fuel used in apartments - Fuel oil, kerosene, etc. (%)
House heating fuel used in apartments - Coal or coke (%)
House heating fuel used in apartments - Wood (%)
House heating fuel used in apartments - Solar energy (%)
House heating fuel used in apartments - Other fuel (%)
House heating fuel used in apartments - No fuel used (%)
Armed forces status - In Armed Forces (%)
Armed forces status - Civilian (%)
Armed forces status - Civilian - Veteran (%)
Armed forces status - Civilian - Nonveteran (%)
Fatal accidents locations in years 2005-2021
Fatal accidents locations in 2005
Fatal accidents locations in 2006
Fatal accidents locations in 2007
Fatal accidents locations in 2008
Fatal accidents locations in 2009
Fatal accidents locations in 2010
Fatal accidents locations in 2011
Fatal accidents locations in 2012
Fatal accidents locations in 2013
Fatal accidents locations in 2014
Fatal accidents locations in 2015
Fatal accidents locations in 2016
Fatal accidents locations in 2017
Fatal accidents locations in 2018
Fatal accidents locations in 2019
Fatal accidents locations in 2020
Fatal accidents locations in 2021
Alcohol use - People drinking some alcohol every month (%)
Alcohol use - People not drinking at all (%)
Alcohol use - Average days/month drinking alcohol
Alcohol use - Average drinks/week
Alcohol use - Average days/year people drink much
Audiometry - Average condition of hearing (%)
Audiometry - People that can hear a whisper from across a quiet room (%)
Audiometry - People that can hear normal voice from across a quiet room (%)
Audiometry - Ears ringing, roaring, buzzing (%)
Audiometry - Had a job exposure to loud noise (%)
Audiometry - Had off-work exposure to loud noise (%)
Blood Pressure & Cholesterol - Has high blood pressure (%)
Blood Pressure & Cholesterol - Checking blood pressure at home (%)
Blood Pressure & Cholesterol - Frequently checking blood cholesterol (%)
Blood Pressure & Cholesterol - Has high cholesterol level (%)
Consumer Behavior - Money monthly spent on food at supermarket/grocery store
Consumer Behavior - Money monthly spent on food at other stores
Consumer Behavior - Money monthly spent on eating out
Consumer Behavior - Money monthly spent on carryout/delivered foods
Consumer Behavior - Income spent on food at supermarket/grocery store (%)
Consumer Behavior - Income spent on food at other stores (%)
Consumer Behavior - Income spent on eating out (%)
Consumer Behavior - Income spent on carryout/delivered foods (%)
Current Health Status - General health condition (%)
Current Health Status - Blood donors (%)
Current Health Status - Has blood ever tested for HIV virus (%)
Current Health Status - Left-handed people (%)
Dermatology - People using sunscreen (%)
Diabetes - Diabetics (%)
Diabetes - Had a blood test for high blood sugar (%)
Diabetes - People taking insulin (%)
Diet Behavior & Nutrition - Diet health (%)
Diet Behavior & Nutrition - Milk product consumption (# of products/month)
Diet Behavior & Nutrition - Meals not home prepared (#/week)
Diet Behavior & Nutrition - Meals from fast food or pizza place (#/week)
Diet Behavior & Nutrition - Ready-to-eat foods (#/month)
Diet Behavior & Nutrition - Frozen meals/pizza (#/month)
Drug Use - People that ever used marijuana or hashish (%)
Drug Use - Ever used hard drugs (%)
Drug Use - Ever used any form of cocaine (%)
Drug Use - Ever used heroin (%)
Drug Use - Ever used methamphetamine (%)
Health Insurance - People covered by health insurance (%)
Kidney Conditions-Urology - Avg. # of times urinating at night
Medical Conditions - People with asthma (%)
Medical Conditions - People with anemia (%)
Medical Conditions - People with psoriasis (%)
Medical Conditions - People with overweight (%)
Medical Conditions - Elderly people having difficulties in thinking or remembering (%)
Medical Conditions - People who ever received blood transfusion (%)
Medical Conditions - People having trouble seeing even with glass/contacts (%)
Medical Conditions - People with arthritis (%)
Medical Conditions - People with gout (%)
Medical Conditions - People with congestive heart failure (%)
Medical Conditions - People with coronary heart disease (%)
Medical Conditions - People with angina pectoris (%)
Medical Conditions - People who ever had heart attack (%)
Medical Conditions - People who ever had stroke (%)
Medical Conditions - People with emphysema (%)
Medical Conditions - People with thyroid problem (%)
Medical Conditions - People with chronic bronchitis (%)
Medical Conditions - People with any liver condition (%)
Medical Conditions - People who ever had cancer or malignancy (%)
Mental Health - People who have little interest in doing things (%)
Mental Health - People feeling down, depressed, or hopeless (%)
Mental Health - People who have trouble sleeping or sleeping too much (%)
Mental Health - People feeling tired or having little energy (%)
Mental Health - People with poor appetite or overeating (%)
Mental Health - People feeling bad about themself (%)
Mental Health - People who have trouble concentrating on things (%)
Mental Health - People moving or speaking slowly or too fast (%)
Mental Health - People having thoughts they would be better off dead (%)
Oral Health - Average years since last visit a dentist
Oral Health - People embarrassed because of mouth (%)
Oral Health - People with gum disease (%)
Oral Health - General health of teeth and gums (%)
Oral Health - Average days a week using dental floss/device
Oral Health - Average days a week using mouthwash for dental problem
Oral Health - Average number of teeth
Pesticide Use - Households using pesticides to control insects (%)
Pesticide Use - Households using pesticides to kill weeds (%)
Physical Activity - People doing vigorous-intensity work activities (%)
Physical Activity - People doing moderate-intensity work activities (%)
Physical Activity - People walking or bicycling (%)
Physical Activity - People doing vigorous-intensity recreational activities (%)
Physical Activity - People doing moderate-intensity recreational activities (%)
Physical Activity - Average hours a day doing sedentary activities
Physical Activity - Average hours a day watching TV or videos
Physical Activity - Average hours a day using computer
Physical Functioning - People having limitations keeping them from working (%)
Physical Functioning - People limited in amount of work they can do (%)
Physical Functioning - People that need special equipment to walk (%)
Physical Functioning - People experiencing confusion/memory problems (%)
Physical Functioning - People requiring special healthcare equipment (%)
Prescription Medications - Average number of prescription medicines taking
Preventive Aspirin Use - Adults 40+ taking low-dose aspirin (%)
Reproductive Health - Vaginal deliveries (%)
Reproductive Health - Cesarean deliveries (%)
Reproductive Health - Deliveries resulted in a live birth (%)
Reproductive Health - Pregnancies resulted in a delivery (%)
Reproductive Health - Women breastfeeding newborns (%)
Reproductive Health - Women that had a hysterectomy (%)
Reproductive Health - Women that had both ovaries removed (%)
Reproductive Health - Women that have ever taken birth control pills (%)
Reproductive Health - Women taking birth control pills (%)
Reproductive Health - Women that have ever used Depo-Provera or injectables (%)
Reproductive Health - Women that have ever used female hormones (%)
Sexual Behavior - People 18+ that ever had sex (vaginal, anal, or oral) (%)
Sexual Behavior - Males 18+ that ever had vaginal sex with a woman (%)
Sexual Behavior - Males 18+ that ever performed oral sex on a woman (%)
Sexual Behavior - Males 18+ that ever had anal sex with a woman (%)
Sexual Behavior - Males 18+ that ever had any sex with a man (%)
Sexual Behavior - Females 18+ that ever had vaginal sex with a man (%)
Sexual Behavior - Females 18+ that ever performed oral sex on a man (%)
Sexual Behavior - Females 18+ that ever had anal sex with a man (%)
Sexual Behavior - Females 18+ that ever had any kind of sex with a woman (%)
Sexual Behavior - Average age people first had sex
Sexual Behavior - Average number of female sex partners in lifetime (males 18+)
Sexual Behavior - Average number of female vaginal sex partners in lifetime (males 18+)
Sexual Behavior - Average age people first performed oral sex on a woman (18+)
Sexual Behavior - Average number of woman performed oral sex on in lifetime (18+)
Sexual Behavior - Average number of male sex partners in lifetime (males 18+)
Sexual Behavior - Average number of male anal sex partners in lifetime (males 18+)
Sexual Behavior - Average age people first performed oral sex on a man (18+)
Sexual Behavior - Average number of male oral sex partners in lifetime (18+)
Sexual Behavior - People using protection when performing oral sex (%)
Sexual Behavior - Average number of times people have vaginal or anal sex a year
Sexual Behavior - People having sex without condom (%)
Sexual Behavior - Average number of male sex partners in lifetime (females 18+)
Sexual Behavior - Average number of male vaginal sex partners in lifetime (females 18+)
Sexual Behavior - Average number of female sex partners in lifetime (females 18+)
Sexual Behavior - Circumcised males 18+ (%)
Sleep Disorders - Average hours sleeping at night
Sleep Disorders - People that has trouble sleeping (%)
Smoking-Cigarette Use - People smoking cigarettes (%)
Taste & Smell - People 40+ having problems with smell (%)
Taste & Smell - People 40+ having problems with taste (%)
Taste & Smell - People 40+ that ever had wisdom teeth removed (%)
Taste & Smell - People 40+ that ever had tonsils teeth removed (%)
Taste & Smell - People 40+ that ever had a loss of consciousness because of a head injury (%)
Taste & Smell - People 40+ that ever had a broken nose or other serious injury to face or skull (%)
Taste & Smell - People 40+ that ever had two or more sinus infections (%)
Weight - Average height (inches)
Weight - Average weight (pounds)
Weight - Average BMI
Weight - People that are obese (%)
Weight - People that ever were obese (%)
Weight - People trying to lose weight (%)
20,916 56.7% White alone 7,312 19.8% Hispanic 3,935 10.7% Asian alone 2,877 7.8% Two or more races 1,065 2.9% Black alone 137 0.4% Other race alone 48 0.1% American Indian alone
According to our research of California and other state lists, there were 51 registered sex offenders living in Martinez, California as of April 27, 2024 . The ratio of all residents to sex offenders in Martinez is 754 to 1.The ratio of registered sex offenders to all residents in this city is near the state average.
Officers per 1,000 residents here:
0.84California average:
2.30
Latest news from Martinez, CA collected exclusively by city-data.com from local newspapers, TV, and radio stations
Ancestries: American (7.4%), Italian (7.3%), Irish (6.9%), English (5.1%), European (5.0%), German (5.0%).
Current Local Time:
Land area: 12.3 square miles.
Population density: 2,975 people per square mile (average).
4,436 residents are foreign born (6.6% Asia , 2.8% Latin America , 1.6% Europe ).
This city:
12.0%California:
26.5%
Median real estate property taxes paid for housing units with mortgages in 2022: $6,502 (0.8%)Median real estate property taxes paid for housing units with no mortgage in 2022: $4,536 (0.5%)
Nearest city with pop. 50,000+: Concord, CA
Nearest city with pop. 200,000+: Central Contra Costa, CA (6.9 miles
Nearest city with pop. 1,000,000+: Los Angeles, CA
Nearest cities:
Latitude: 38.00 N, Longitude: 122.12 W
Daytime population change due to commuting: +2,114 (+5.7%)Workers who live and work in this city: 6,995 (37.0%)
Martinez tourist attractions:
Single-family new house construction building permits:
2022: 42 buildings , average cost: $315,9002021: 63 buildings , average cost: $225,6002020: 6 buildings , average cost: $71,3002019: 4 buildings , average cost: $231,5002018: 6 buildings , average cost: $314,7002016: 27 buildings , average cost: $158,3002015: 54 buildings , average cost: $197,7002014: 38 buildings , average cost: $206,2002013: 3 buildings , average cost: $500,0002012: 3 buildings , average cost: $256,7002011: 3 buildings , average cost: $286,8002010: 2 buildings , average cost: $299,2002009: 5 buildings , average cost: $420,0002008: 19 buildings , average cost: $315,4002007: 31 buildings , average cost: $211,6002006: 10 buildings , average cost: $368,9002005: 24 buildings , average cost: $304,4002004: 7 buildings , average cost: $220,5002003: 8 buildings , average cost: $316,5002002: 90 buildings , average cost: $182,5002001: 48 buildings , average cost: $195,9002000: 133 buildings , average cost: $214,0001999: 104 buildings , average cost: $216,5001998: 73 buildings , average cost: $207,0001997: 86 buildings , average cost: $174,200Unemployment in December 2023:
Population change in the 1990s: +2,081 (+6.2%).
Most common occupations in Martinez, CA (%)
Both Males Females
Other management occupations, except farmers and farm managers (6.0%)
Other office and administrative support workers, including supervisors (5.3%)
Other sales and related occupations, including supervisors (4.3%)
Computer specialists (3.9%)
Secretaries and administrative assistants (3.8%)
Retail sales workers, except cashiers (3.2%)
Preschool, kindergarten, elementary, and middle school teachers (3.1%)
Other management occupations, except farmers and farm managers (6.5%)
Computer specialists (5.2%)
Electrical equipment mechanics and other installation, maintenance, and repair workers, including supervisors (4.4%)
Other sales and related occupations, including supervisors (4.4%)
Engineers (3.8%)
Sales representatives, services, wholesale and manufacturing (3.5%)
Vehicle and mobile equipment mechanics, installers, and repairers (3.4%)
Other office and administrative support workers, including supervisors (8.4%)
Secretaries and administrative assistants (7.3%)
Other management occupations, except farmers and farm managers (5.4%)
Preschool, kindergarten, elementary, and middle school teachers (5.3%)
Information and record clerks, except customer service representatives (4.7%)
Other sales and related occupations, including supervisors (4.1%)
Registered nurses (3.5%)
Earthquake activity:
Martinez-area historical earthquake activity is significantly above California state average. It is 7651% greater than the overall U.S. average. On 4/18/1906 at 13:12:21, a magnitude 7.9 (7.9 UK, Class: Major, Intensity: VIII - XII) earthquake occurred 48.0 miles away from the city center, causing $524,000,000 total damage On 10/18/1989 at 00:04:15, a magnitude 7.1 (6.5 MB, 7.1 MS, 6.9 MW, 7.0 ML) earthquake occurred 64.5 miles away from Martinez center, causing 62 deaths ( 62 shaking deaths) and 3757 injuries, causing $1,305,032,704 total damage On 11/4/1927 at 13:51:53, a magnitude 7.5 (7.5 UK) earthquake occurred 221.8 miles away from the city center On 7/21/1952 at 11:52:14, a magnitude 7.7 (7.7 UK) earthquake occurred 270.5 miles away from Martinez center, causing $50,000,000 total damage On 1/31/1922 at 13:17:28, a magnitude 7.6 (7.6 UK) earthquake occurred 261.8 miles away from Martinez center On 4/25/1992 at 18:06:04, a magnitude 7.2 (6.3 MB, 7.1 MS, 7.2 MW, 7.1 MW, Depth: 9.4 mi) earthquake occurred 193.2 miles away from Martinez center, causing $75,000,000 total damage Magnitude types: body-wave magnitude (MB), local magnitude (ML), surface-wave magnitude (MS), moment magnitude (MW) Natural disasters: The number of natural disasters in Contra Costa County (18) is near the US average (15).Major Disasters (Presidential) Declared: 11Emergencies Declared: 3Floods: 13, Storms: 7, Winter Storms: 7, Mudslides: 5, Landslides: 4, Drought: 1, Earthquake: 1, Hurricane: 1, Tornado: 1, Wind: 1, Other: 1 (Note: some incidents may be assigned to more than one category). Hospitals and medical centers in Martinez: CONTRA COSTA REGIONAL MEDICAL CENTER (Government - Local, provides emergency services, 2500 ALHAMBRA AVE) KAISER FOUNDATION HOSPITAL (provides emergency services, 200 MUIR RD) ALHAMBRA CONV HOSPITAL (331 ILENE STREET)
LEGACY NURSING AND REHABILITATION CENTER (1790 MUIR ROAD)
MARTINEZ CONVALESCENT HOSPITAL (4110 ALHAMBRA WAY)
KAISER PERMANENTE MARTINEZ (200 MUIR ROAD, HACIENDA BUILDING, SECOND FLOOR)
KAISER FOUNDATION HOSPITAL HOME HEALTH - MARTINEZ (200 MUIR ROAD, HACIENDA BUILDING)
Amtrak station: MARTINEZ (401 FERRY ST.)
.
Services: ticket office, fully wheelchair accessible, enclosed waiting area, public restrooms, public payphones, full-service food facilities, free short-term parking, free long-term parking, call for taxi service, public transit connection.
College/University in Martinez: Contra Costa Community College District Office Location: 500 Court St; Public; Website: www.4cd.net/default.aspx)
Colleges/universities with over 2000 students nearest to Martinez:
Diablo Valley College (about 4 miles; Pleasant Hill, CA ; Full-time enrollment: 13,015)
Saint Mary's College of California (about 12 miles; Moraga, CA ; FT enrollment: 4,200)
University of California-Berkeley (about 12 miles; Berkeley, CA ; FT enrollment: 37,127)
Berkeley City College (about 13 miles; Berkeley, CA ; FT enrollment: 3,146)
Contra Costa College (about 13 miles; San Pablo, CA ; FT enrollment: 4,249)
Los Medanos College (about 15 miles; Pittsburg, CA ; FT enrollment: 5,289)
Merritt College (about 15 miles; Oakland, CA ; FT enrollment: 2,842)
Public high schools in Martinez: ALHAMBRA SENIOR HIGH Students: 884, Location: 150 E ST., Grades: 9-12)MT. MCKINLEY Students: 65, Location: 202 GLACIER DR., Grades: 7-12)GOLDEN GATE COMMUNITY Students: 43, Location: 222 GLACIER DR., Grades: 6-12)VICENTE MARTINEZ HIGH Students: 41, Location: 614 F ST., Grades: 9-12)BRIONES (ALTERNATIVE) Students: 30, Location: 614 F ST., Grades: KG-12)Public elementary/middle schools in Martinez: MARTINEZ JUNIOR HIGH Students: 904, Location: 1600 CT. ST., Grades: 6-8)HIDDEN VALLEY ELEMENTARY Students: 413, Location: 500 GLACIER DR., Grades: KG-5)MORELLO PARK ELEMENTARY Students: 319, Location: 1200 MORELLO PARK DR., Grades: KG-5)JOHN SWETT ELEMENTARY Students: 282, Location: 4955 ALHAMBRA VALLEY RD., Grades: KG-5)JOHN MUIR ELEMENTARY Students: 225, Location: 205 VISTA WAY, Grades: KG-5)LAS JUNTAS ELEMENTARY Students: 189, Location: 4105 PACHECO BLVD., Grades: KG-5)Private elementary/middle school in Martinez: ST CATHERINE OF SIENA SCHOOL Students: 179, Location: 604 MELLUS ST, Grades: PK-8)
See full list of schools located in Martinez User-submitted facts and corrections:
Martinez County Hospital/Medical Center added by Lisa
Notable locations in Martinez: (A) , Muir Station Shopping Complex (B) , Martinez Yacht Harbor (C) , Martinez Historical Museum (D) , Martinez City Hall (E) , Martinez Branch Contra Costa County Library (F) , Contra Costa County Jail (G) , Contra Costa County Hall of Records (H) , Contra Costa County Courthouse (I) , Contra Costa County Adminstration Building (J) , Contra Costa County Fire Protection District Station 13 (K) , Contra Costa County Fire Protection District Station 14 (L) . Display/hide their locations on the map
Shopping Center: (1) . Display/hide its location on the map
Churches in Martinez include: (A) , First Congregational Church (B) , First Church of Christ Scientist (C) , First Baptist Church (D) , Christ Lutheran Church (E) . Display/hide their locations on the map
Cemeteries: (1) , Catholic Cemetery (2) . Display/hide their locations on the map
Reservoir: (A) . Display/hide its location on the map
Streams, rivers, and creeks: (A) , Arroyo del Hambre (B) . Display/hide their locations on the map
Parks in Martinez include: (1) , Martinez Waterfront Park (2) , Ricks Memorial Park (3) , Susana Park (4) , Martinez Regional Shoreline Park (5) , Morello School Park (6) , Mountain View Park (7) , Boyd Park (8) , Golden Hills Park (9) . Display/hide their locations on the map
Tourist attraction:
Hotel:
Courts:
Birthplace of: Joe DiMaggio - Baseball player and coach, Sara Del Rey - Professional wrestler, Tug McGraw - Baseball player, Chris Singleton - 2005 Major League Baseball player (Tampa Bay Devil Rays, born : Aug 15, 1972), Johnny Lee Clary - Professional wrestler, Maurice Benard - Actor, Robert Stephenson (baseball) - Baseball player, Seanan McGuire - Fantasy writer, Vince DiMaggio - He had two kids Russelene DiMaggio and Bambi Dimaggio, Yau-Man Chan - Skeptic.
Contra Costa County has a predicted average indoor radon screening level between 2 and 4 pCi/L (pico curies per liter) - Moderate Potential Drinking water stations with addresses in Martinez and their reported violations in the past:
RIVERVIEW MARINA SWS (Population served: 40, Groundwater):
Past health violations:
MCL, Monthly (TCR) - In AUG-2007, Contaminant: Coliform. Follow-up actions: St Formal NOV issued (SEP-26-2007)
MCL, Monthly (TCR) - In AUG-2007, Contaminant: Coliform. Follow-up actions: St Formal NOV issued (SEP-26-2007)
MCL, Monthly (TCR) - In JUL-2007, Contaminant: Coliform. Follow-up actions: St Admin Penalty assessed (AUG-21-2007)
MCL, Monthly (TCR) - In JUL-2007, Contaminant: Coliform. Follow-up actions: St Admin Penalty assessed (AUG-21-2007)
Past monitoring violations:
Monitoring, Repeat Major (TCR) - In DEC-2005, Contaminant: Coliform (TCR). Follow-up actions: St Formal NOV issued (JAN-20-2006)
Monitoring, Repeat Major (TCR) - In DEC-2005, Contaminant: Coliform (TCR). Follow-up actions: St Formal NOV issued (JAN-20-2006)
Average household size: This city:
2.4 peopleCalifornia:
2.9 people
Percentage of family households: This city:
64.2%Whole state:
68.7%
Percentage of households with unmarried partners: This city:
7.5%Whole state:
7.2%
Likely homosexual households (counted as self-reported same-sex unmarried-partner households)
Lesbian couples: 0.6% of all households Gay men: 0.3% of all households
People in group quarters in Martinez in 2010:
589 people in local jails and other municipal confinement facilities
268 people in nursing facilities/skilled-nursing facilities
204 people in correctional facilities intended for juveniles
155 people in other noninstitutional facilities
29 people in residential treatment centers for adults
28 people in group homes intended for adults
18 people in workers' group living quarters and job corps centers
3 people in maritime/merchant vessels
2 people in emergency and transitional shelters (with sleeping facilities) for people experiencing homelessness
People in group quarters in Martinez in 2000:
714 people in local jails and other confinement facilities (including police lockups)
219 people in nursing homes
180 people in short-term care, detention or diagnostic centers for delinquent children
56 people in other noninstitutional group quarters
41 people in mental (psychiatric) hospitals or wards
30 people in hospitals/wards and hospices for chronically ill
30 people in other hospitals or wards for chronically ill
30 people in homes or halfway houses for drug/alcohol abuse
24 people in homes for the mentally retarded
17 people in residential treatment centers for emotionally disturbed children
16 people in unknown juvenile institutions
16 people in homes for the mentally ill
7 people in other group homes
Banks with branches in Martinez (2011 data):
Westamerica Bank: Muir Station Branch at 590 Center Avenue, branch established on 1987/11/16; Martinez Branch at 601 Ferry Street, branch established on 1985/02/04. Info updated 2011/06/21: Bank assets: $4,998.1 mil, Deposits: $4,253.2 mil, headquarters in San Rafael, CA, positive income , Commercial Lending Specialization, 98 total offices , Holding Company: Westamerica Bancorporation
Bank of America, National Association: Martinez Branch at 626 Main Street, branch established on 1904/10/17; Virginia Hills Branch at 6678 Alhambra Avenue, branch established on 1980/06/30. Info updated 2009/11/18: Bank assets: $1,451,969.3 mil, Deposits: $1,077,176.8 mil, headquarters in Charlotte, NC, positive income , 5782 total offices , Holding Company: Bank Of America Corporation
Wells Fargo Bank, National Association: Martinez Branch at 902 Main Street, branch established on 1923/05/18. Info updated 2011/04/05: Bank assets: $1,161,490.0 mil, Deposits: $905,653.0 mil, headquarters in Sioux Falls, SD, positive income , 6395 total offices , Holding Company: Wells Fargo & Company
U.S. Bank National Association: Martinez Branch at 659 Main Street, branch established on 1998/01/02. Info updated 2012/01/30: Bank assets: $330,470.8 mil, Deposits: $236,091.5 mil, headquarters in Cincinnati, OH, positive income , 3121 total offices , Holding Company: U.S. Bancorp
Union Bank, National Association: Martinez Branch at 634 Ferry Street, branch established on 1954/08/23. Info updated 2011/09/01: Bank assets: $88,967.5 mil, Deposits: $65,286.4 mil, headquarters in San Francisco, CA, positive income , Commercial Lending Specialization, 403 total offices , Holding Company: Mitsubishi Ufj Financial Group, Inc.
JPMorgan Chase Bank, National Association: 4201 Alhambra Ave Branch at 4201 Alhambra Ave, branch established on 1889/01/01. Info updated 2011/11/10: Bank assets: $1,811,678.0 mil, Deposits: $1,190,738.0 mil, headquarters in Columbus, OH, positive income , International Specialization, 5577 total offices , Holding Company: Jpmorgan Chase & Co.
Citibank, National Association: Martinez Branch at 901 Main Street, branch established on 1987/06/30. Info updated 2012/01/10: Bank assets: $1,288,658.0 mil, Deposits: $882,541.0 mil, headquarters in Sioux Falls, SD, positive income , International Specialization, 1048 total offices , Holding Company: Citigroup Inc.
For population 15 years and over in Martinez:
Never married: 29.5%Now married: 54.3%Separated: 1.3%Widowed: 3.3%Divorced: 11.5% For population 25 years and over in Martinez:
High school or higher: 96.1%Bachelor's degree or higher: 45.3%Graduate or professional degree: 14.8%Unemployed: 3.8%Mean travel time to work (commute): 22.7 minutes
Education Gini index (Inequality in education) Here:
9.7California average:
15.5
Religion statistics for Martinez, CA (based on Contra Costa County data)
Religion Adherents Congregations Catholic 228,400 34 Evangelical Protestant 81,120 352 Other 48,553 123 Mainline Protestant 32,693 101 Black Protestant 10,395 34 Orthodox 2,435 8 None 645,429 -
Source: Clifford Grammich, Kirk Hadaway, Richard Houseal, Dale E.Jones, Alexei Krindatch, Richie Stanley and Richard H.Taylor. 2012. 2010 U.S.Religion Census: Religious Congregations & Membership Study. Association of Statisticians of American Religious Bodies. Jones, Dale E., et al. 2002. Congregations and Membership in the United States 2000. Nashville, TN: Glenmary Research Center. Graphs represent county-level data
Food Environment Statistics: Number of grocery stores : 181Contra Costa County :
1.78 / 10,000 pop.California :
2.14 / 10,000 pop.
Number of supercenters and club stores : 5Here :
0.05 / 10,000 pop.California :
0.04 / 10,000 pop.
Number of convenience stores (no gas) : 52Contra Costa County :
0.51 / 10,000 pop.California :
0.62 / 10,000 pop.
Number of convenience stores (with gas) : 178Contra Costa County :
1.75 / 10,000 pop.State :
1.49 / 10,000 pop.
Number of full-service restaurants : 683Contra Costa County :
6.73 / 10,000 pop.California :
7.42 / 10,000 pop.
Adult diabetes rate : Contra Costa County :
7.1%State :
7.3%
Adult obesity rate : This county :
22.2%California :
21.3%
Low-income preschool obesity rate : Here :
16.8%California :
17.9%
Health and Nutrition: Healthy diet rate : This city:
52.2%State:
49.4%
Average overall health of teeth and gums : Here:
50.9%California:
48.0%
People feeling badly about themselves : Here:
20.3%California:
20.2%
People not drinking alcohol at all : This city:
9.8%State:
11.2%
Average hours sleeping at night : This city:
6.8California:
6.8
Overweight people : This city:
34.1%California:
31.5%
General health condition : This city:
58.8%California:
56.4%
Average condition of hearing : Martinez:
80.7%California:
80.9%
More about Health and Nutrition of Martinez, CA Residents
Local government employment and payroll (March 2022)
Function
Full-time employees
Monthly full-time payroll
Average yearly full-time wage
Part-time employees
Monthly part-time payroll
Police Protection - Officers
31 $457,313 $177,024 0 $0 Financial Administration
16 $160,631 $120,473 4 $7,371 Streets and Highways
12 $107,082 $107,082 0 $0 Natural Resources
12 $90,728 $90,728 0 $0 Water Supply
8 $76,436 $114,654 0 $0 Other Government Administration
7 $41,486 $71,119 8 $7,935 Parks and Recreation
4 $27,750 $83,250 7 $6,524 Housing and Community Development (Local)
4 $27,213 $81,639 0 $0 Solid Waste Management
2 $14,793 $88,758 1 $2,668 Other and Unallocable
0 $0 9 $3,933 Police - Other
0 $0 13 $17,859
Totals for Government
96 $1,003,434 $125,429 42 $46,291
Martinez government finances - Expenditure in 2017 (per resident):
Construction - Water Utilities: $844,000 ($23.16)
Central Staff Services: $804,000 ($22.06)Parks and Recreation: $651,000 ($17.86)Police Protection: $258,000 ($7.08)Current Operations - Police Protection: $10,603,000 ($290.92)
Water Utilities: $8,360,000 ($229.37)Central Staff Services: $5,147,000 ($141.22)Parks and Recreation: $2,983,000 ($81.84)Regular Highways: $2,581,000 ($70.82)Protective Inspection and Regulation - Other: $1,290,000 ($35.39)Financial Administration: $654,000 ($17.94)Sea and Inland Port Facilities: $302,000 ($8.29)Parking Facilities: $206,000 ($5.65)Solid Waste Management: $49,000 ($1.34)Miscellaneous Commercial Activities - Other: $7,000 ($0.19)General - Interest on Debt: $1,208,000 ($33.14)
Intergovernmental to Local - Other - Financial Administration: $210,000 ($5.76)
Other Capital Outlay - General Public Building: $248,000 ($6.80)
Regular Highways: $104,000 ($2.85)Water Utilities - Interest on Debt: $208,000 ($5.71)
Martinez government finances - Revenue in 2017 (per resident):
Charges - Other: $745,000 ($20.44)
Parking Facilities: $507,000 ($13.91)Parks and Recreation: $473,000 ($12.98)Sea and Inland Port Facilities: $188,000 ($5.16)Regular Highways: $123,000 ($3.37)Solid Waste Management: $2,000 ($0.05)Federal Intergovernmental - Other: $13,000 ($0.36)
Miscellaneous - Fines and Forfeits: $368,000 ($10.10)
Interest Earnings: $278,000 ($7.63)Rents: $175,000 ($4.80)Donations From Private Sources: $141,000 ($3.87)General Revenue - Other: $106,000 ($2.91)Special Assessments: $37,000 ($1.02)Revenue - Water Utilities: $10,559,000 ($289.71)
State Intergovernmental - Other: $814,000 ($22.33)
Highways: $732,000 ($20.08)General Local Government Support: $77,000 ($2.11)Tax - Property: $13,292,000 ($364.69)
General Sales and Gross Receipts: $7,329,000 ($201.09)Public Utilities Sales: $1,734,000 ($47.58)Other License: $781,000 ($21.43)Occupation and Business License - Other: $738,000 ($20.25)Other Selective Sales: $561,000 ($15.39)Other: $445,000 ($12.21)Documentary and Stock Transfer: $255,000 ($7.00)
Martinez government finances - Debt in 2017 (per resident):
Long Term Debt - Beginning Outstanding - Unspecified Public Purpose: $34,693,000 ($951.88)
Outstanding Unspecified Public Purpose: $33,704,000 ($924.74)Retired Unspecified Public Purpose: $1,015,000 ($27.85)Issue, Unspecified Public Purpose: $26,000 ($0.71)
Martinez government finances - Cash and Securities in 2017 (per resident):
Bond Funds - Cash and Securities: $10,020,000 ($274.92)
Other Funds - Cash and Securities: $30,912,000 ($848.14)
Sinking Funds - Cash and Securities: $2,885,000 ($79.16)
6.37% of this county's 2021 resident taxpayers lived in other counties in 2020 ($134,084 average adjusted gross income )
Here:
6.37%California average:
5.19%
0.01% of residents moved from foreign countries ($98 average AGI )Contra Costa County:
0.01%California average:
0.03%
Top counties from which taxpayers relocated into this county between 2020 and 2021:
7.09% of this county's 2020 resident taxpayers moved to other counties in 2021 ($123,334 average adjusted gross income )
Here:
7.09%California average:
6.14%
0.01% of residents moved to foreign countries ($92 average AGI )Contra Costa County:
0.01%California average:
0.02%
Top counties to which taxpayers relocated from this county between 2020 and 2021:
Businesses in Martinez, CA
Name Count Name Count
24 Hour Fitness 1 KFC 1 7-Eleven 2 Kroger 2 Ace Hardware 1 MasterBrand Cabinets 2 Baskin-Robbins 1 McDonald's 3 Best Western 1 Payless 1 Blockbuster 1 Quiznos 1 Burger King 2 RadioShack 1 CVS 2 Rite Aid 1 Carl\s Jr. 1 Safeway 2 Curves 1 Starbucks 4 DHL 1 Subway 1 Decora Cabinetry 1 Super 8 1 Domino's Pizza 1 Taco Bell 1 FedEx 5 U-Haul 2 GNC 2 UPS 6 H&R Block 1 Vons 2 Home Depot 1 Walgreens 1 IHOP 1 Walmart 1 Jack In The Box 1 Wendy's 1
Strongest AM radio stations in Martinez:
KTRB (860 AM; 50 kW; MODESTO, CA; Owner: PAPPAS RADIO OF CALIFORNIA, A CALIFORNIA LIMITED PARTNERSHIP)
KIQI (1010 AM; 35 kW; SAN FRANCISCO, CA; Owner: RADIO UNICA OF SAN FRANCISCO LICENSE CORP.)
KNEW (910 AM; 20 kW; OAKLAND, CA; Owner: AMFM RADIO LICENSES, L.L.C.)
KCBS (740 AM; 50 kW; SAN FRANCISCO, CA; Owner: INFINITY BROADCASTING OPERATIONS, INC.)
KABN (1480 AM; 5 kW; CONCORD, CA; Owner: CONCORD AREA BROADCASTING CORP.)
KTCT (1050 AM; 50 kW; SAN MATEO, CA; Owner: SUSQUEHANNA RADIO CORP.)
KFAX (1100 AM; 50 kW; SAN FRANCISCO, CA; Owner: GOLDEN GATE BROADCASTING CO, INC.)
KDYA (1190 AM; 10 kW; VALLEJO, CA; Owner: BAYBRIDGE COMMUNICATIONS, L.L.C.)
KNBR (680 AM; 50 kW; SAN FRANCISCO, CA; Owner: KNBR LICO, INC.)
KGO (810 AM; 50 kW; SAN FRANCISCO, CA; Owner: KGO-AM RADIO, INC.)
KDIA (1640 AM; 10 kW; VALLEJO, CA; Owner: BAYBRIDGE COMMUNICATIONS, L.L.C.)
KATD (990 AM; 10 kW; PITTSBURG, CA; Owner: RADIO UNICA OF SACRAMENTO LICENSE CORP.)
KFRC (610 AM; 5 kW; SAN FRANCISCO, CA; Owner: INFINITY BROADCASTING CORPORATION OF LOS ANGELES)
Strongest FM radio stations in Martinez:
KDFC-FM1 (102.1 FM; LAFAYETTE, CA; Owner: BONNEVILLE HOLDING COMPANY)
KOIT-FM2 (96.5 FM; MARTINEZ, ETC., CA; Owner: BONNEVILLE HOLDING CO. C/O KOIT(FM))
KIOI-FM1 (101.3 FM; WALNUT CREEK, CA; Owner: AMFM RADIO LICENSES, L.L.C.)
KKSF-FM1 (103.7 FM; PLEASANTON, ETC., CA; Owner: AMFM RADIO LICENSES, L.L.C.)
KBLX-FM2 (102.9 FM; PLEASANTON, CA; Owner: ICBC BROADCAST HOLDINGS -CA, INC.)
KSOL-FM3 (98.9 FM; PLEASANTON, CA; Owner: TMS LICENSE CALIFORNIA, INC)
KFRC-FM3 (99.7 FM; WALNUT CREEK, CA; Owner: INFINITY KFRC-FM, INC.)
KZBR-FM1 (95.7 FM; WALNUT CREEK, CA; Owner: BONNEVILLE HOLDING COMPANY)
KISQ-FM3 (98.1 FM; CONCORD, CA; Owner: AMFM RADIO LICENSES, L.L.C.)
KMEL-FM1 (106.1 FM; CONCORD, CA; Owner: AMFM RADIO LICENSES, L.L.C.)
KFJO (92.1 FM; WALNUT CREEK, CA; Owner: CHASE RADIO PROPERTIES, L.L.C.)
KLLC (97.3 FM; SAN FRANCISCO, CA; Owner: INFINITY BROADCASTING OPERATIONS, INC.)
K209BZ (89.7 FM; CONCORD, CA; Owner: YOUR CHRISTIAN COMPANION NETWORK, INC.)
KVHS (90.5 FM; CONCORD, CA; Owner: CLAYTON VALLEY HIGH SCHOOL)
KSFB-FM (100.7 FM; SAN RAFAEL, CA; Owner: GOLDEN GATE BROADCASTING COMPANY, INC.)
KALX (90.7 FM; BERKELEY, CA; Owner: UNIVERSITY OF CALIFORNIA)
KFJO-FM3 (92.1 FM; MARTINEZ, CA; Owner: CHASE RADIO PROPERTIES, L.L.C.)
KUIC (95.3 FM; VACAVILLE, CA; Owner: KUIC, INC.)
K201BV (88.1 FM; BENICIA-MARTINEZ, CA; Owner: KQED, INC.)
KOIT-FM (96.5 FM; SAN FRANCISCO, CA; Owner: BONNEVILLE HOLDING COMPANY)
TV broadcast stations around Martinez:
KTNC-TV (Channel 42; CONCORD, CA; Owner: KTNC LICENSE, LLC)
KQED (Channel 9; SAN FRANCISCO, CA; Owner: KQED, INC.)
KGO-TV (Channel 7; SAN FRANCISCO, CA; Owner: KGO TELEVISION, INC.)
KPIX-TV (Channel 5; SAN FRANCISCO, CA; Owner: CBS BROADCASTING INC.)
KOVR (Channel 13; STOCKTON, CA; Owner: SCI - SACRAMENTO LICENSEE, LLC)
KXTV (Channel 10; SACRAMENTO, CA; Owner: KXTV, INC.)
KSPX (Channel 29; SACRAMENTO, CA; Owner: PAXSON SACRAMENTO LICENSE, INC.)
KCRA-TV (Channel 3; SACRAMENTO, CA; Owner: KCRA HEARST-ARGYLE TELEVISION, INC.)
KTVU (Channel 2; OAKLAND, CA; Owner: KTVU PARTNERSHIP)
KTXL (Channel 40; SACRAMENTO, CA; Owner: CHANNEL 40, INC.)
KUVS (Channel 19; MODESTO, CA; Owner: KUVS LICENSE PARTNERSHIP, G.P.)
KQCA (Channel 58; STOCKTON, CA; Owner: KCRA HEARST-ARGYLE TELEVISION, INC.)
KVIE (Channel 6; SACRAMENTO, CA; Owner: KVIE, INC.)
KMAX-TV (Channel 31; SACRAMENTO, CA; Owner: UPN STATIONS GROUP INC.)
KRON-TV (Channel 4; SAN FRANCISCO, CA; Owner: YOUNG BROADCASTING OF SAN FRANCISCO, INC.)
KMTP-TV (Channel 32; SAN FRANCISCO, CA; Owner: MINORITY TELEVISION PROJECT)
KBHK-TV (Channel 44; SAN FRANCISCO, CA; Owner: VIACOM TELEVISION STATIONS GROUP OF SAN FRANCISCO INC.)
KBWB (Channel 20; SAN FRANCISCO, CA; Owner: KBWB LICENSE, INC.)
KFSF (Channel 66; VALLEJO, CA; Owner: TELEFUTURA SAN FRANCISCO LLC)
KCNS (Channel 38; SAN FRANCISCO, CA; Owner: WRAY, INC.)
KCSM-TV (Channel 60; SAN MATEO, CA; Owner: SAN MATEO COUNTY COMMUNITY COLLEGE DISTRICT)
KFTL (Channel 64; STOCKTON, CA; Owner: FAMILY STATIONS, INC.)
National Bridge Inventory (NBI) Statistics 42 Number of bridges1,765ft / 538m Total length $645,000 Total costs1,161,655 Total average daily traffic64,252 Total average daily truck traffic
New bridges - historical statistics
1 1910-1919 2 1920-1929 6 1930-1939 2 1940-1949 2 1950-1959 13 1960-1969 9 1970-1979 3 1980-1989 3 2000-2009 1 2010-2019
See full National Bridge Inventory statistics for Martinez, CA
Home Mortgage Disclosure Act Aggregated Statistics For Year 2009(Based on 2 full and 7 partial tracts) A) FHA, FSA/RHS & VA B) Conventional C) Refinancings D) Home Improvement Loans E) Loans on Dwellings For 5+ Families F) Non-occupant Loans on Number Average Value Number Average Value Number Average Value Number Average Value Number Average Value Number Average Value
LOANS ORIGINATED 115 $333,365 151 $278,993 812 $275,818 39 $187,211 1 $504,570 51 $200,773 APPLICATIONS APPROVED, NOT ACCEPTED 11 $280,132 16 $243,200 90 $291,429 3 $140,077 0 $0 9 $183,084 APPLICATIONS DENIED 12 $271,088 24 $270,352 221 $318,807 12 $70,498 0 $0 18 $220,649 APPLICATIONS WITHDRAWN 17 $344,857 27 $254,673 135 $284,252 17 $164,526 0 $0 12 $234,940 FILES CLOSED FOR INCOMPLETENESS 2 $245,040 5 $183,086 59 $332,787 2 $147,035 0 $0 2 $210,545
Aggregated Statistics For Year 2008(Based on 2 full and 7 partial tracts) A) FHA, FSA/RHS & VA B) Conventional C) Refinancings D) Home Improvement Loans E) Loans on Dwellings For 5+ Families F) Non-occupant Loans on G) Loans On Manufactured Number Average Value Number Average Value Number Average Value Number Average Value Number Average Value Number Average Value Number Average Value
LOANS ORIGINATED 52 $337,852 170 $313,767 383 $305,711 42 $152,908 0 $0 54 $277,740 0 $0 APPLICATIONS APPROVED, NOT ACCEPTED 2 $368,585 35 $291,189 98 $308,312 8 $255,361 0 $0 13 $273,872 7 $88,356 APPLICATIONS DENIED 8 $392,925 38 $306,878 208 $340,698 26 $177,484 0 $0 24 $282,065 3 $42,963 APPLICATIONS WITHDRAWN 6 $332,058 26 $334,319 102 $310,423 8 $286,594 1 $2,550,000 7 $254,109 0 $0 FILES CLOSED FOR INCOMPLETENESS 2 $393,720 7 $260,614 34 $353,586 3 $137,900 0 $0 5 $247,116 0 $0
Aggregated Statistics For Year 2007(Based on 2 full and 7 partial tracts) A) FHA, FSA/RHS & VA B) Conventional C) Refinancings D) Home Improvement Loans E) Loans on Dwellings For 5+ Families F) Non-occupant Loans on G) Loans On Manufactured Number Average Value Number Average Value Number Average Value Number Average Value Number Average Value Number Average Value Number Average Value
LOANS ORIGINATED 1 $419,670 320 $342,113 744 $332,412 133 $186,128 4 $714,932 93 $306,452 1 $21,380 APPLICATIONS APPROVED, NOT ACCEPTED 0 $0 65 $322,149 154 $357,240 27 $181,542 0 $0 17 $326,166 2 $55,735 APPLICATIONS DENIED 0 $0 106 $331,639 314 $373,413 79 $215,077 0 $0 41 $359,918 2 $174,800 APPLICATIONS WITHDRAWN 0 $0 41 $332,425 148 $380,307 34 $211,936 0 $0 13 $400,386 0 $0 FILES CLOSED FOR INCOMPLETENESS 0 $0 12 $346,271 56 $372,406 6 $283,295 0 $0 1 $224,510 0 $0
Aggregated Statistics For Year 2006(Based on 2 full and 7 partial tracts) B) Conventional C) Refinancings D) Home Improvement Loans E) Loans on Dwellings For 5+ Families F) Non-occupant Loans on G) Loans On Manufactured Number Average Value Number Average Value Number Average Value Number Average Value Number Average Value Number Average Value
LOANS ORIGINATED 484 $347,976 1,062 $341,699 201 $207,174 2 $4,236,350 117 $339,969 2 $30,920 APPLICATIONS APPROVED, NOT ACCEPTED 105 $317,486 185 $334,446 32 $226,444 0 $0 18 $299,390 6 $72,138 APPLICATIONS DENIED 131 $343,637 330 $362,789 110 $198,536 0 $0 38 $362,869 3 $114,230 APPLICATIONS WITHDRAWN 75 $349,379 211 $365,598 31 $266,411 0 $0 13 $421,408 0 $0 FILES CLOSED FOR INCOMPLETENESS 15 $354,367 72 $355,309 8 $175,258 0 $0 4 $273,948 0 $0
Aggregated Statistics For Year 2005(Based on 2 full and 7 partial tracts) B) Conventional C) Refinancings D) Home Improvement Loans E) Loans on Dwellings For 5+ Families F) Non-occupant Loans on G) Loans On Manufactured Number Average Value Number Average Value Number Average Value Number Average Value Number Average Value Number Average Value
LOANS ORIGINATED 667 $343,754 1,425 $335,279 210 $234,362 5 $1,486,794 155 $314,462 1 $205,740 APPLICATIONS APPROVED, NOT ACCEPTED 99 $300,281 180 $322,780 22 $176,037 0 $0 17 $304,116 6 $80,822 APPLICATIONS DENIED 141 $330,975 382 $339,723 76 $229,302 0 $0 37 $319,033 4 $64,035 APPLICATIONS WITHDRAWN 76 $304,590 315 $322,530 47 $246,190 1 $197,440 23 $279,797 5 $128,544 FILES CLOSED FOR INCOMPLETENESS 16 $320,828 72 $356,455 9 $184,163 0 $0 5 $306,084 0 $0
Aggregated Statistics For Year 2004(Based on 2 full and 7 partial tracts) A) FHA, FSA/RHS & VA B) Conventional C) Refinancings D) Home Improvement Loans E) Loans on Dwellings For 5+ Families F) Non-occupant Loans on G) Loans On Manufactured Number Average Value Number Average Value Number Average Value Number Average Value Number Average Value Number Average Value Number Average Value
LOANS ORIGINATED 1 $340,760 747 $298,092 1,485 $275,489 150 $184,080 5 $894,486 170 $255,276 0 $0 APPLICATIONS APPROVED, NOT ACCEPTED 0 $0 118 $272,144 188 $262,279 18 $143,797 1 $463,830 22 $234,331 1 $159,600 APPLICATIONS DENIED 0 $0 141 $292,651 336 $277,053 51 $187,703 1 $219,380 47 $257,682 4 $120,432 APPLICATIONS WITHDRAWN 0 $0 82 $279,943 313 $267,394 27 $124,682 0 $0 24 $264,545 0 $0 FILES CLOSED FOR INCOMPLETENESS 0 $0 19 $340,073 74 $284,111 5 $170,396 0 $0 7 $319,239 0 $0
Aggregated Statistics For Year 2003(Based on 2 full and 7 partial tracts) A) FHA, FSA/RHS & VA B) Conventional C) Refinancings D) Home Improvement Loans E) Loans on Dwellings For 5+ Families F) Non-occupant Loans on Number Average Value Number Average Value Number Average Value Number Average Value Number Average Value Number Average Value
LOANS ORIGINATED 9 $240,068 702 $264,061 3,360 $226,959 56 $71,458 6 $671,600 246 $201,370 APPLICATIONS APPROVED, NOT ACCEPTED 0 $0 95 $268,348 382 $232,408 15 $38,095 1 $406,460 33 $207,490 APPLICATIONS DENIED 0 $0 89 $259,164 409 $249,841 24 $72,617 3 $481,287 37 $209,276 APPLICATIONS WITHDRAWN 1 $286,970 81 $245,389 578 $225,029 16 $96,965 0 $0 29 $186,164 FILES CLOSED FOR INCOMPLETENESS 1 $270,340 15 $265,745 99 $263,845 3 $79,703 1 $288,950 7 $210,297
Aggregated Statistics For Year 2002(Based on 2 full and 7 partial tracts) A) FHA, FSA/RHS & VA B) Conventional C) Refinancings D) Home Improvement Loans E) Loans on Dwellings For 5+ Families F) Non-occupant Loans on Number Average Value Number Average Value Number Average Value Number Average Value Number Average Value Number Average Value
LOANS ORIGINATED 20 $205,846 702 $234,553 2,500 $218,084 66 $47,257 6 $949,767 185 $192,091 APPLICATIONS APPROVED, NOT ACCEPTED 4 $188,922 78 $226,607 316 $223,829 12 $31,310 0 $0 21 $191,601 APPLICATIONS DENIED 2 $179,400 72 $187,675 299 $220,095 36 $52,230 1 $650,560 25 $185,996 APPLICATIONS WITHDRAWN 3 $264,757 64 $215,310 419 $210,068 14 $49,532 1 $288,950 23 $206,642 FILES CLOSED FOR INCOMPLETENESS 0 $0 22 $294,892 69 $249,346 2 $43,060 0 $0 6 $158,695
Aggregated Statistics For Year 2001(Based on 2 full and 7 partial tracts) A) FHA, FSA/RHS & VA B) Conventional C) Refinancings D) Home Improvement Loans E) Loans on Dwellings For 5+ Families F) Non-occupant Loans on Number Average Value Number Average Value Number Average Value Number Average Value Number Average Value Number Average Value
LOANS ORIGINATED 29 $209,123 607 $212,298 1,960 $203,286 110 $46,191 4 $909,732 125 $169,286 APPLICATIONS APPROVED, NOT ACCEPTED 2 $164,175 84 $192,291 231 $200,202 22 $69,030 0 $0 18 $170,631 APPLICATIONS DENIED 2 $196,310 63 $182,512 287 $179,079 39 $44,448 1 $188,040 18 $166,246 APPLICATIONS WITHDRAWN 2 $144,460 60 $182,037 369 $190,930 22 $40,436 0 $0 21 $152,332 FILES CLOSED FOR INCOMPLETENESS 0 $0 21 $204,812 90 $199,971 3 $28,563 0 $0 4 $124,775
Aggregated Statistics For Year 2000(Based on 2 full and 7 partial tracts) A) FHA, FSA/RHS & VA B) Conventional C) Refinancings D) Home Improvement Loans E) Loans on Dwellings For 5+ Families F) Non-occupant Loans on Number Average Value Number Average Value Number Average Value Number Average Value Number Average Value Number Average Value
LOANS ORIGINATED 45 $168,856 760 $183,264 501 $152,498 130 $36,981 2 $492,855 72 $153,614 APPLICATIONS APPROVED, NOT ACCEPTED 3 $177,473 73 $180,682 81 $144,548 28 $60,452 1 $375,000 11 $151,605 APPLICATIONS DENIED 3 $213,073 107 $162,439 166 $147,251 35 $35,359 1 $255,380 7 $144,713 APPLICATIONS WITHDRAWN 2 $110,605 83 $152,580 119 $137,520 10 $53,657 0 $0 5 $123,026 FILES CLOSED FOR INCOMPLETENESS 0 $0 18 $195,779 64 $163,490 5 $54,614 0 $0 2 $72,360
Aggregated Statistics For Year 1999(Based on 3 full and 6 partial tracts) A) FHA, FSA/RHS & VA B) Conventional C) Refinancings D) Home Improvement Loans E) Loans on Dwellings For 5+ Families F) Non-occupant Loans on Number Average Value Number Average Value Number Average Value Number Average Value Number Average Value Number Average Value
LOANS ORIGINATED 75 $150,525 691 $162,530 798 $148,241 102 $28,496 3 $788,193 93 $123,829 APPLICATIONS APPROVED, NOT ACCEPTED 5 $144,214 57 $148,930 127 $146,677 22 $33,545 0 $0 13 $125,390 APPLICATIONS DENIED 5 $195,732 111 $158,443 212 $146,051 43 $35,039 0 $0 20 $112,390 APPLICATIONS WITHDRAWN 8 $148,694 93 $142,506 190 $149,988 7 $24,377 2 $239,300 19 $145,172 FILES CLOSED FOR INCOMPLETENESS 0 $0 27 $178,928 62 $159,825 0 $0 0 $0 4 $94,765
Detailed mortgage data for all 9 tracts in Martinez, CA
Private Mortgage Insurance Companies Aggregated Statistics For Year 2009(Based on 1 full and 7 partial tracts) A) Conventional B) Refinancings Number Average Value Number Average Value
LOANS ORIGINATED 18 $310,021 6 $270,235 APPLICATIONS APPROVED, NOT ACCEPTED 8 $264,396 1 $418,190 APPLICATIONS DENIED 2 $281,925 1 $335,320 APPLICATIONS WITHDRAWN 1 $562,970 0 $0 FILES CLOSED FOR INCOMPLETENESS 2 $393,945 0 $0
Aggregated Statistics For Year 2008(Based on 1 full and 7 partial tracts) A) Conventional B) Refinancings C) Non-occupant Loans on Number Average Value Number Average Value Number Average Value
LOANS ORIGINATED 40 $381,381 14 $367,726 1 $192,370 APPLICATIONS APPROVED, NOT ACCEPTED 11 $365,768 8 $415,244 2 $301,165 APPLICATIONS DENIED 5 $364,312 3 $375,377 1 $309,730 APPLICATIONS WITHDRAWN 4 $360,925 3 $331,260 0 $0 FILES CLOSED FOR INCOMPLETENESS 1 $271,770 0 $0 0 $0
Aggregated Statistics For Year 2007(Based on 2 full and 7 partial tracts) A) Conventional B) Refinancings Number Average Value Number Average Value
LOANS ORIGINATED 17 $436,145 14 $464,476 APPLICATIONS APPROVED, NOT ACCEPTED 3 $411,360 5 $444,854 APPLICATIONS DENIED 0 $0 3 $420,553 APPLICATIONS WITHDRAWN 1 $349,300 0 $0 FILES CLOSED FOR INCOMPLETENESS 0 $0 0 $0
Aggregated Statistics For Year 2006(Based on 1 full and 5 partial tracts) A) Conventional B) Refinancings Number Average Value Number Average Value
LOANS ORIGINATED 4 $493,228 9 $458,647 APPLICATIONS APPROVED, NOT ACCEPTED 1 $486,000 1 $452,660 APPLICATIONS DENIED 0 $0 2 $388,000 APPLICATIONS WITHDRAWN 0 $0 0 $0 FILES CLOSED FOR INCOMPLETENESS 0 $0 0 $0
Aggregated Statistics For Year 2005(Based on 1 full and 7 partial tracts) A) Conventional B) Refinancings C) Non-occupant Loans on Number Average Value Number Average Value Number Average Value
LOANS ORIGINATED 5 $418,888 8 $411,974 1 $261,580 APPLICATIONS APPROVED, NOT ACCEPTED 4 $437,745 2 $397,100 0 $0 APPLICATIONS DENIED 0 $0 0 $0 0 $0 APPLICATIONS WITHDRAWN 1 $280,670 0 $0 0 $0 FILES CLOSED FOR INCOMPLETENESS 0 $0 0 $0 0 $0
Aggregated Statistics For Year 2004(Based on 2 full and 7 partial tracts) A) Conventional B) Refinancings C) Non-occupant Loans on Number Average Value Number Average Value Number Average Value
LOANS ORIGINATED 13 $320,622 10 $316,164 3 $234,917 APPLICATIONS APPROVED, NOT ACCEPTED 5 $282,268 4 $300,972 1 $454,800 APPLICATIONS DENIED 0 $0 0 $0 0 $0 APPLICATIONS WITHDRAWN 2 $201,635 1 $374,120 0 $0 FILES CLOSED FOR INCOMPLETENESS 0 $0 0 $0 0 $0
Aggregated Statistics For Year 2003(Based on 2 full and 7 partial tracts) A) Conventional B) Refinancings C) Non-occupant Loans on Number Average Value Number Average Value Number Average Value
LOANS ORIGINATED 28 $295,527 31 $264,221 3 $270,743 APPLICATIONS APPROVED, NOT ACCEPTED 9 $274,944 17 $271,986 0 $0 APPLICATIONS DENIED 0 $0 0 $0 0 $0 APPLICATIONS WITHDRAWN 2 $240,355 4 $279,458 0 $0 FILES CLOSED FOR INCOMPLETENESS 0 $0 0 $0 0 $0
Aggregated Statistics For Year 2002(Based on 2 full and 7 partial tracts) A) Conventional B) Refinancings C) Non-occupant Loans on Number Average Value Number Average Value Number Average Value
LOANS ORIGINATED 70 $248,783 31 $264,382 10 $181,152 APPLICATIONS APPROVED, NOT ACCEPTED 11 $239,418 21 $284,200 0 $0 APPLICATIONS DENIED 1 $493,850 3 $232,333 0 $0 APPLICATIONS WITHDRAWN 2 $300,000 2 $224,150 0 $0 FILES CLOSED FOR INCOMPLETENESS 0 $0 0 $0 0 $0
Aggregated Statistics For Year 2001(Based on 2 full and 7 partial tracts) A) Conventional B) Refinancings C) Non-occupant Loans on Number Average Value Number Average Value Number Average Value
LOANS ORIGINATED 67 $248,736 31 $249,652 3 $214,673 APPLICATIONS APPROVED, NOT ACCEPTED 13 $252,697 13 $241,883 3 $256,937 APPLICATIONS DENIED 1 $193,830 3 $262,663 0 $0 APPLICATIONS WITHDRAWN 2 $246,110 2 $189,545 0 $0 FILES CLOSED FOR INCOMPLETENESS 1 $94,000 0 $0 0 $0
Aggregated Statistics For Year 2000(Based on 2 full and 7 partial tracts) A) Conventional B) Refinancings C) Non-occupant Loans on Number Average Value Number Average Value Number Average Value
LOANS ORIGINATED 109 $219,795 29 $196,529 3 $138,887 APPLICATIONS APPROVED, NOT ACCEPTED 22 $222,692 11 $204,465 1 $93,460 APPLICATIONS DENIED 2 $239,260 0 $0 0 $0 APPLICATIONS WITHDRAWN 6 $213,815 2 $92,600 0 $0 FILES CLOSED FOR INCOMPLETENESS 1 $232,920 0 $0 0 $0
Aggregated Statistics For Year 1999(Based on 3 full and 6 partial tracts) A) Conventional B) Refinancings C) Non-occupant Loans on Number Average Value Number Average Value Number Average Value
LOANS ORIGINATED 114 $179,964 66 $168,308 3 $147,670 APPLICATIONS APPROVED, NOT ACCEPTED 13 $184,662 22 $175,851 1 $138,600 APPLICATIONS DENIED 5 $168,854 1 $246,590 0 $0 APPLICATIONS WITHDRAWN 1 $170,610 4 $191,262 0 $0 FILES CLOSED FOR INCOMPLETENESS 2 $104,445 1 $215,550 0 $0
Fire-safe hotels and motels in Martinez, California:
Best Western John Muir Inn, 445 Muir Sta Rd, Martinez, California 94553 Phone: (925) 229-1010, Fax: (925) 228-4810
Americas Best Value Inn, 3999 Alhambra Ave/, Martinez, California 94553 Phone: (925) 228-7471, Fax: (925) 228-1465
Muir Lodge Motel, 3930 Alhambra Ave, Martinez, California 94553 Phone: (925) 228-3308
All 3 fire-safe hotels and motels in Martinez, California Martinez compared to California state average:
Unemployed percentage significantly below state average. Black race population percentage below state average. Hispanic race population percentage below state average. Median age significantly above state average. Foreign-born population percentage below state average. Length of stay since moving in significantly above state average. Institutionalized population percentage above state average. Percentage of population with a bachelor's degree or higher above state average.
#31 on the list of "Top 101 cities with the most residents born in Other Eastern Asia (population 500+)"
#56 on the list of "Top 101 cities with the largest percentage of people in short-term care, detention or diagnostic centers for delinquent children (population 1,000+)"
#64 on the list of "Top 101 cities with the most residents born in Armenia (population 500+)"
#96 on the list of "Top 101 cities with largest percentage of males in industries: management of companies and enterprises (population 5,000+)"
#10 on the list of "Top 101 counties with the largest increase in the number of infant deaths per 1000 residents 2000-2006 to 2007-2013 (pop. 50,000+)"
#15 on the list of "Top 101 counties with the lowest Sulfur Oxides Annual air pollution readings in 2012 (µg/m3 )"
#17 on the list of "Top 101 counties with the highest Nitrogen Dioxide air pollution readings in 2012 (ppm)"
#31 on the list of "Top 101 counties with the highest percentage of residents that drank alcohol in the past 30 days"
#34 on the list of "Top 101 counties with the highest surface withdrawal of fresh water for public supply (pop. 50,000+)"
Top Patent Applicants
Arda Aksu (48)
Zhi Li (40)
Tobias Funk (32)
Kulwinder S. Plahey (17)
Bruce Reynolds (16)
Bruce Edward Reynolds (14)
James N. Ziemer (13)
Russell Evan Cooper (12)
Brian David Warner (10)
Miguel A. Carames (9)
Total of 491 patent applications in 2008-2024.
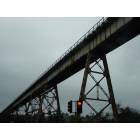
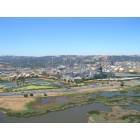
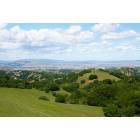
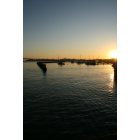

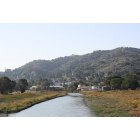
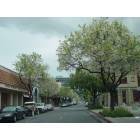
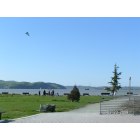

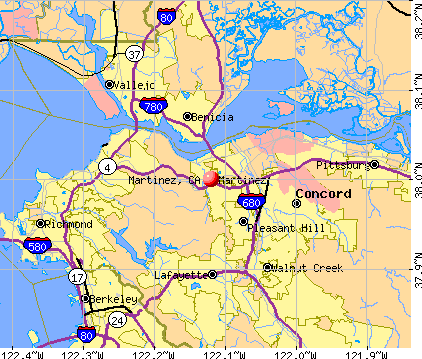


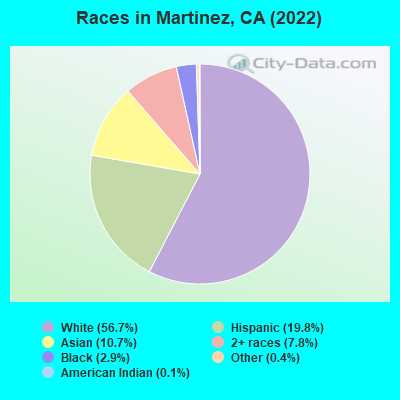
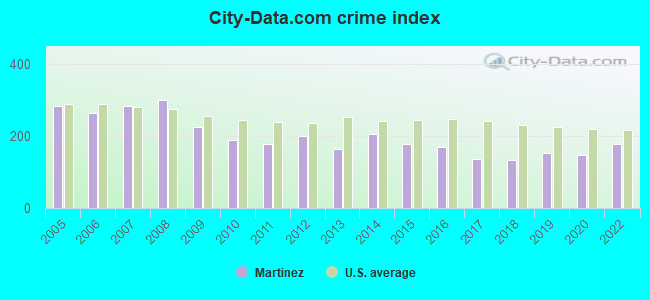
 Recent articles from our blog. Our writers, many of them Ph.D. graduates or candidates, create easy-to-read articles on a wide variety of topics.

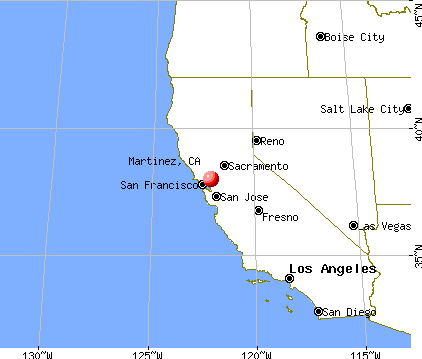
 (6.2 miles
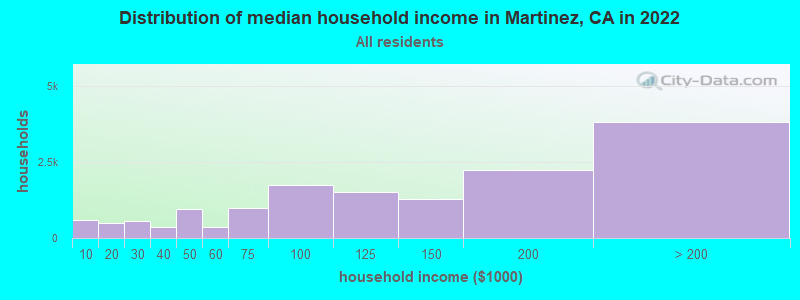
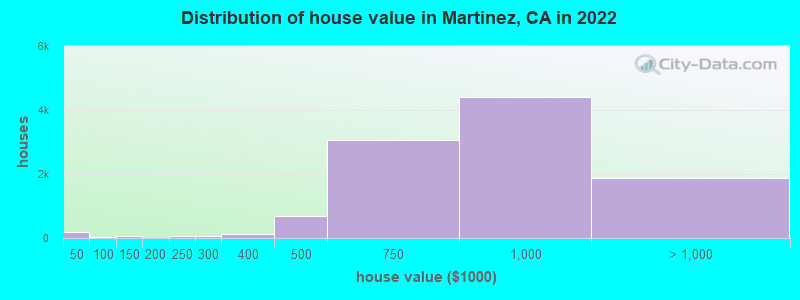
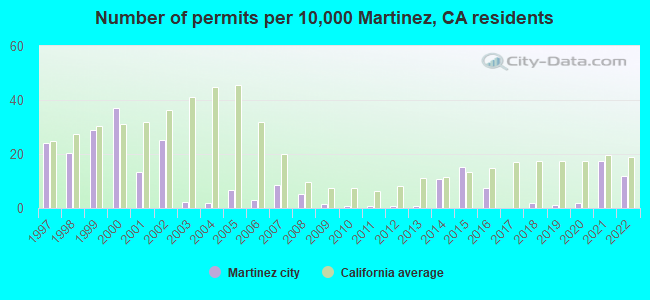
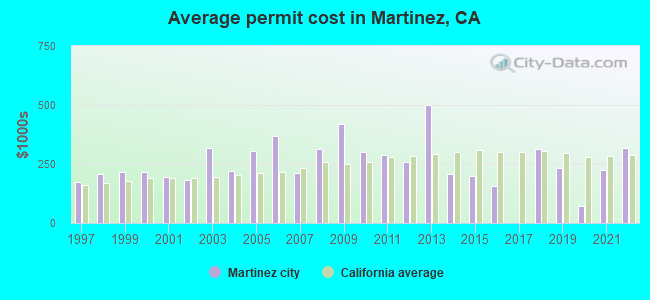
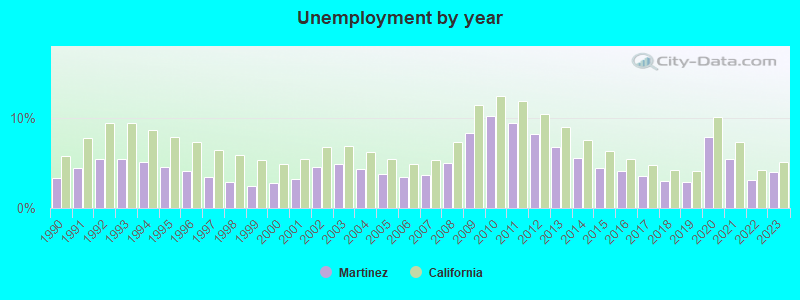
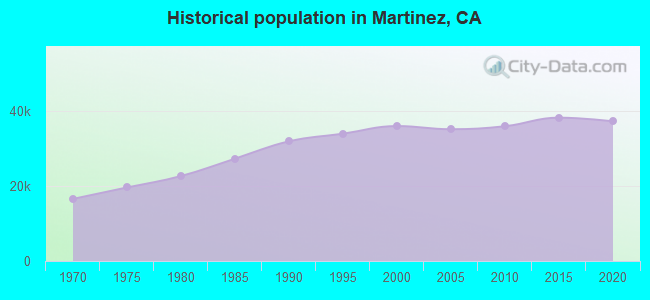
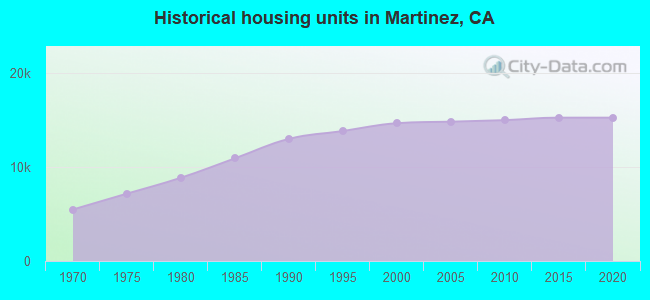
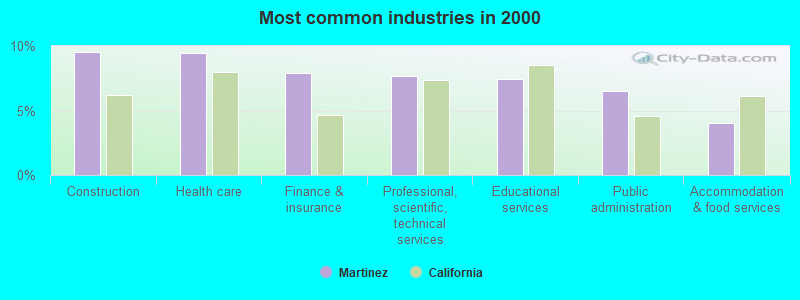
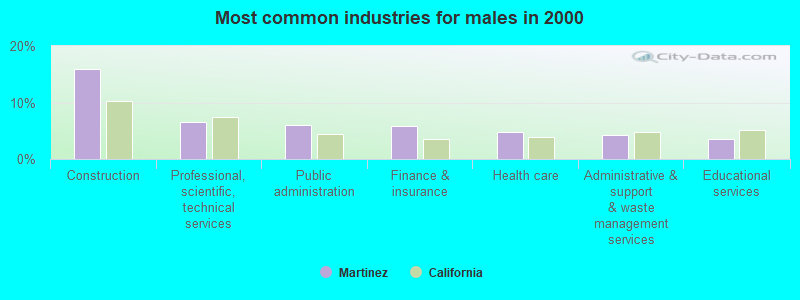
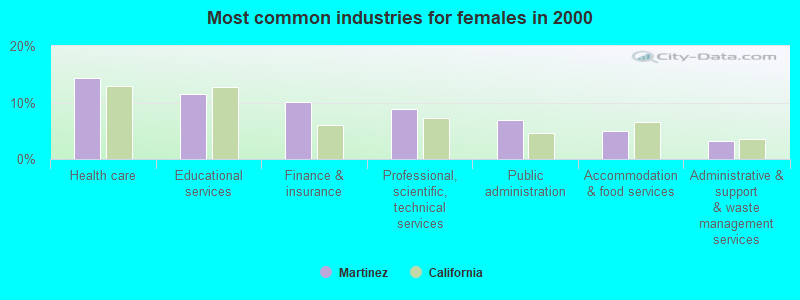

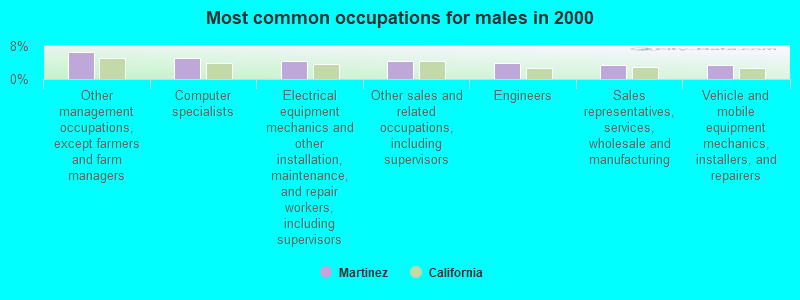
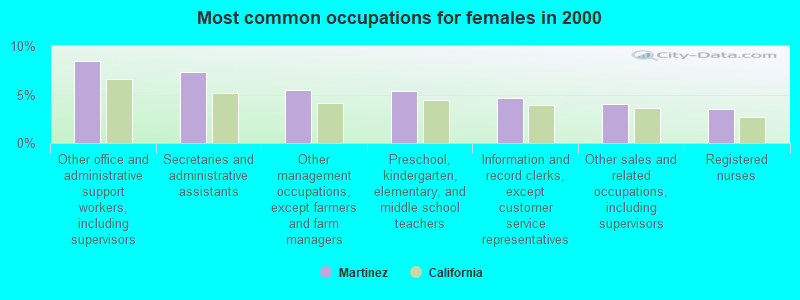
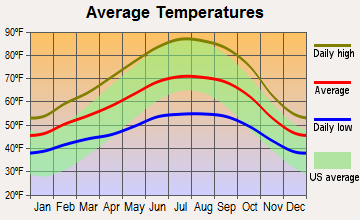
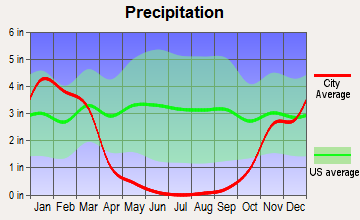
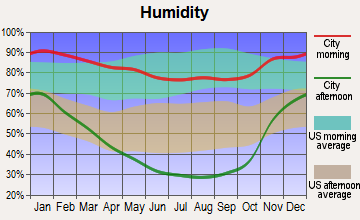

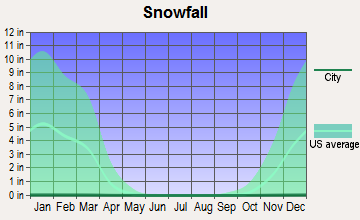
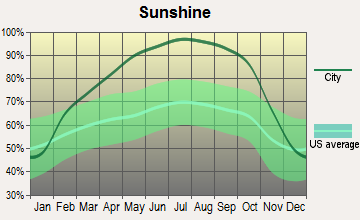
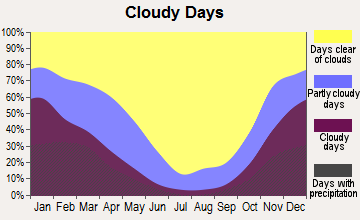
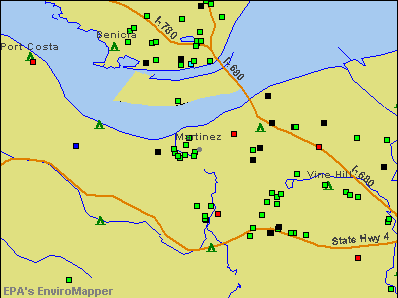

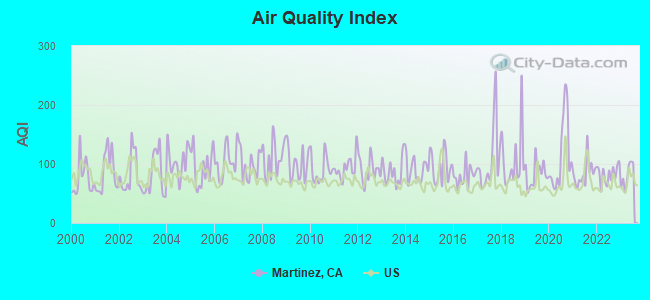
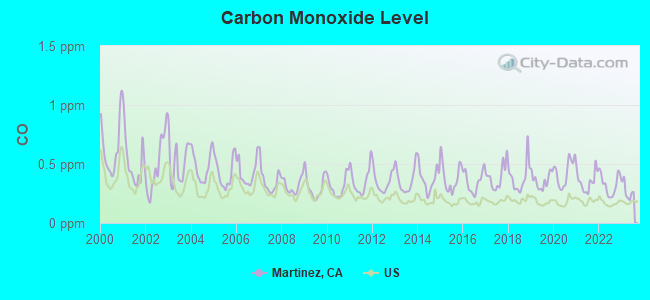
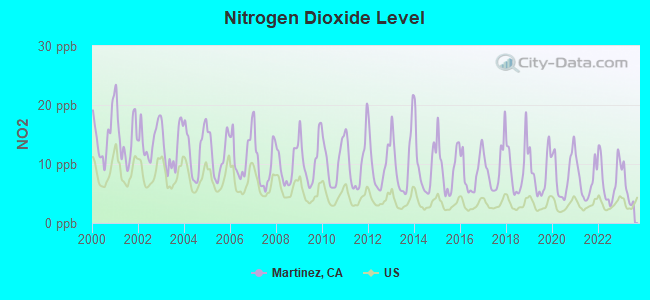
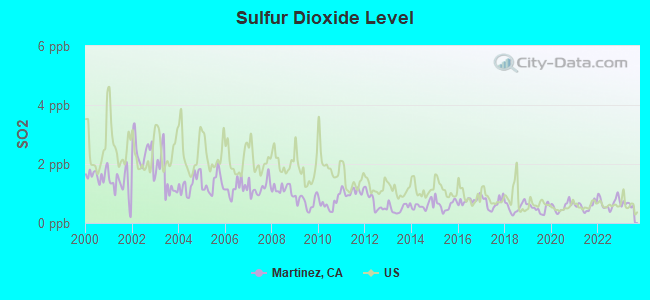
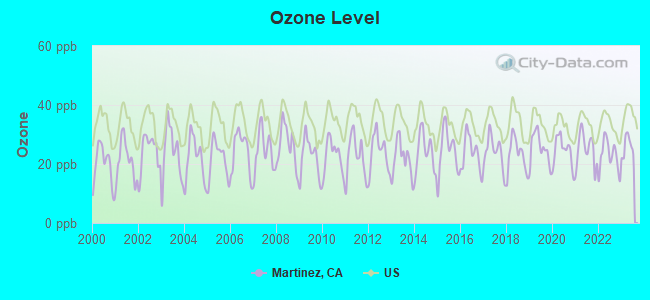
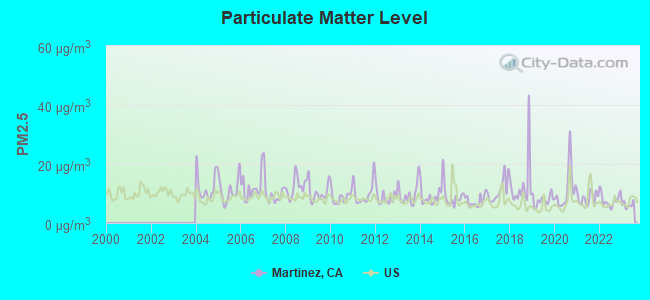
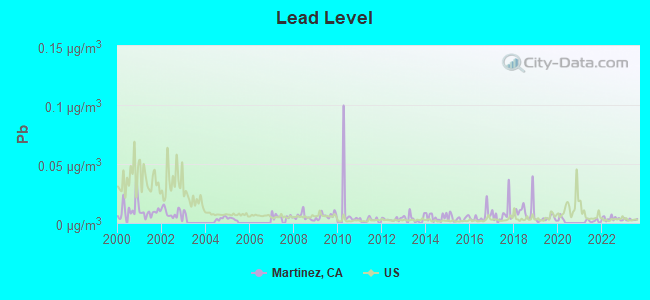
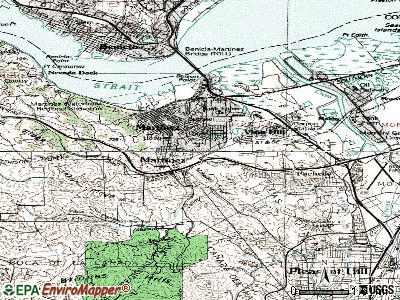
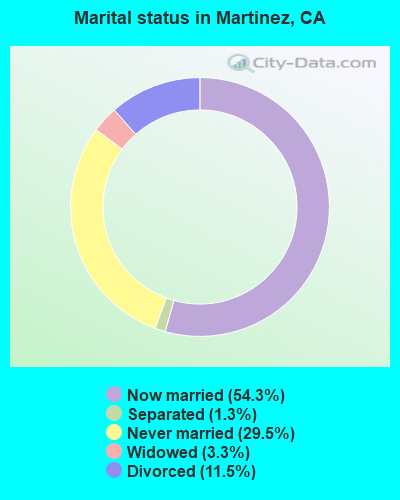
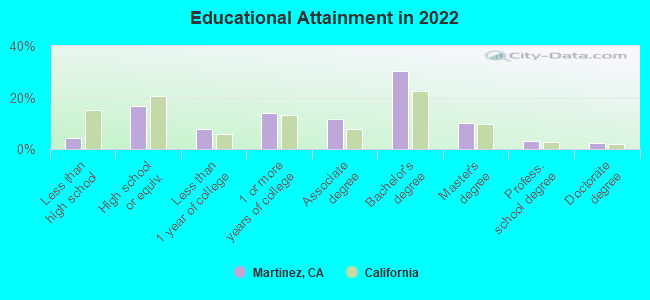
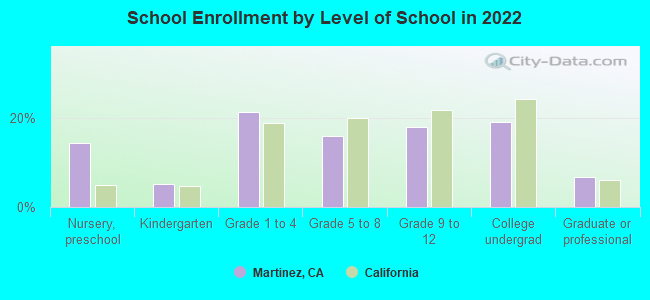
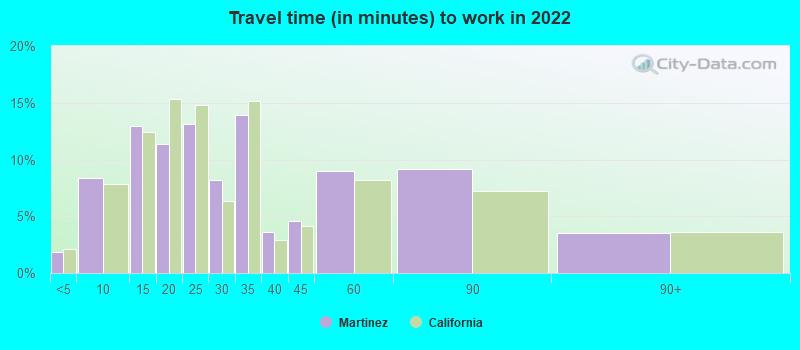
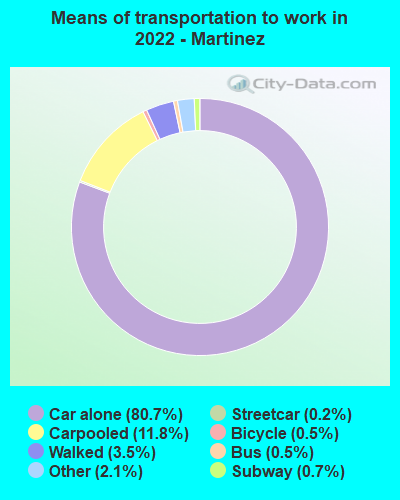


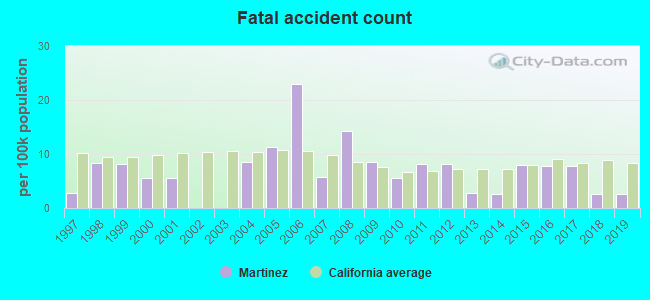
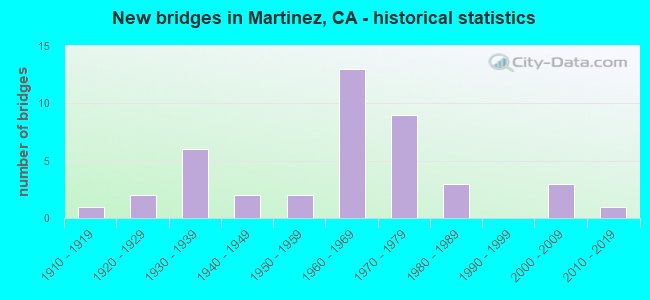
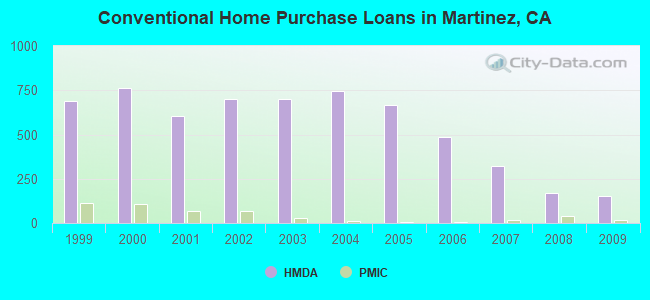
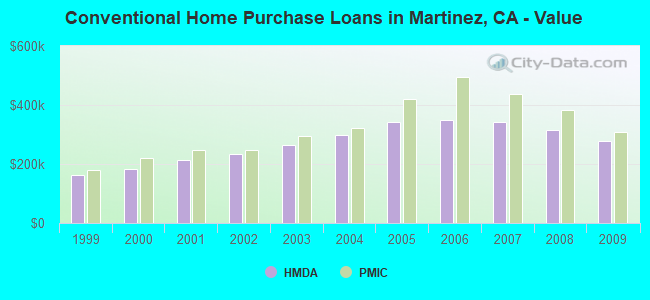
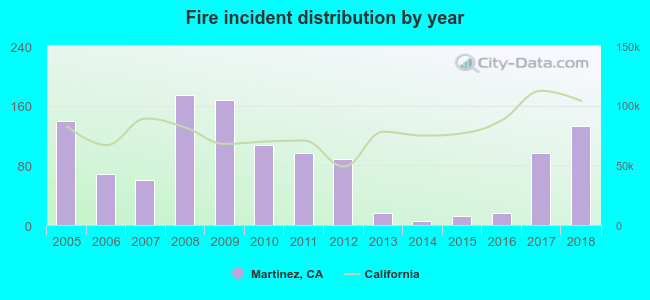 According to the data from the years 2005 - 2018 the average number of fire incidents per year is 84. The highest number of fires - 174 took place in 2008, and the least - 5 in 2014. The data has a declining trend.
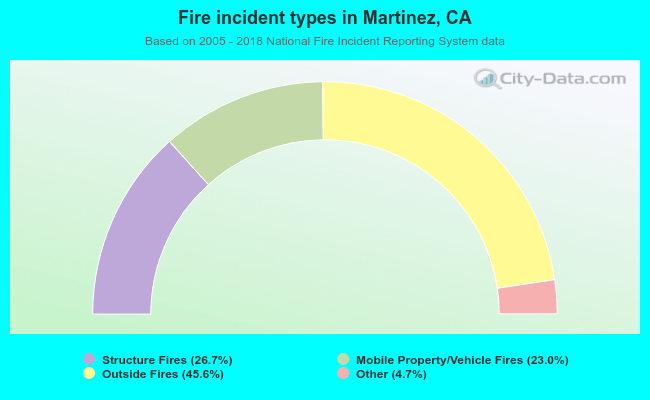 When looking into fire subcategories, the most reports belonged to: Outside Fires (45.6%), and Structure Fires (26.7%).