Estimated zip code population in 2022: 48,654 Zip code population in 2010: 47,065 Zip code population in 2000: 46,659
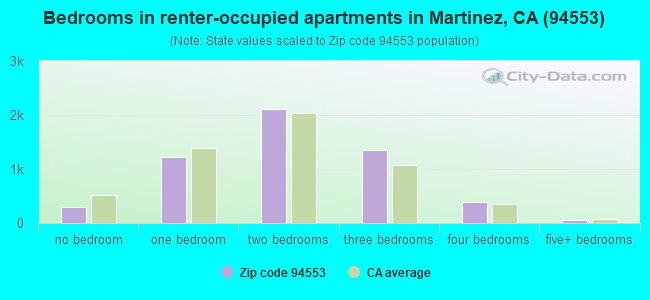
Houses and condos: 20,223 Renter-occupied apartments: 5,431
% of renters here:
28%
State:
44%
March 2022 cost of living index in zip code 94553: 116.9 (more than average, U.S. average is 100)
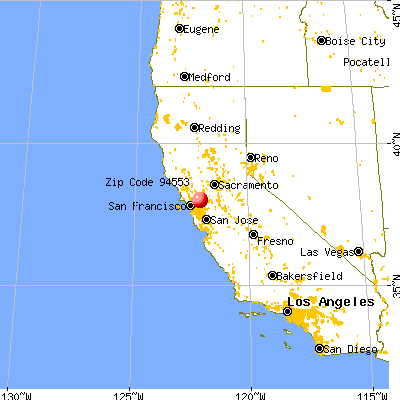
Land area: 49.0 sq. mi. Water area: 2.6 sq. mi.
Population density: 994 people per square mile
(low).
OSM Map
General Map
Google Map
MSN Map
OSM Map
General Map
Google Map
MSN Map
OSM Map
General Map
Google Map
MSN Map
OSM Map
General Map
Google Map
MSN Map
Please wait while loading the map...
Real estate property taxes paid for housing units in 2022:
This zip code:
0.7% ($5,669)
California:
0.7% ($4,831)
Median real estate property taxes paid for housing units with mortgages in 2022: $6,299 (0.8%) Median real estate property taxes paid for housing units with no mortgage in 2022: $4,064 (0.5%)
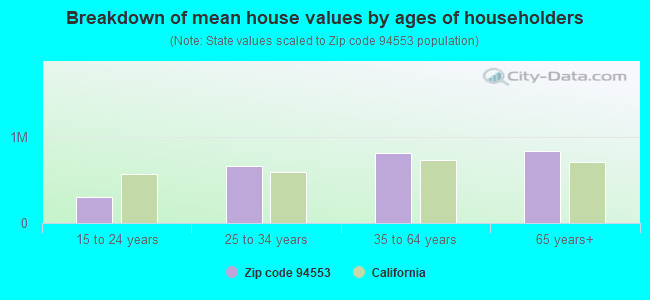
Estimated median house/condo value in 2022: $785,503
94553:
$785,503
California:
$715,900
According to our research of California and other state lists, there were 46 registered sex offenders living in 94553 zip code as of April 27, 2024. The ratio of all residents to sex offenders in zip code 94553 is 1,095 to 1. The ratio of registered sex offenders to all residents in this zip code is lower than the state average.
Median resident age:
This zip code:
42.9 years
California median age:
37.9 years
Average household size:
This zip code:
2.5 people
California:
2.8 people
Averages for the 2020 tax year for zip code 94553, filed in 2021:
Average Adjusted Gross Income (AGI) in 2020: $96,377 (Individual Income Tax Returns)
Here:
$96,377
State:
$95,910
Salary/wage: $86,853 (reported on 78.2% of returns)
Here:
$86,853
State:
$77,331
(% of AGI for various income ranges: 1121.2% for AGIs below $25k, 3753.4% for AGIs $25k-50k, 6911.2% for AGIs $50k-75k, 10486.2% for AGIs $75k-100k, 20179.5% for AGIs $100k-200k, 75102.9% for AGIs over 200k)
Taxable interest for individuals: $1,064 (reported on 47.0% of returns)
This zip code:
$1,064
California:
$2,294
(% of AGI for various income ranges: 22.5% for AGIs below $25k, 28.2% for AGIs $25k-50k, 48.2% for AGIs $50k-75k, 72.6% for AGIs $75k-100k, 122.9% for AGIs $100k-200k, 605.9% for AGIs over 200k)
Ordinary dividends: $5,133 (reported on 26.3% of returns)
Here:
$5,133
State:
$10,949
(% of AGI for various income ranges: 47.9% for AGIs below $25k, 57.8% for AGIs $25k-50k, 127.5% for AGIs $50k-75k, 191.1% for AGIs $75k-100k, 323.1% for AGIs $100k-200k, 1808.6% for AGIs over 200k)
Net capital gain/loss in AGI: +$16,928 (reported on 24.1% of returns)
Here:
+$16,928
State:
+$49,306
(% of AGI for various income ranges: 28.6% for AGIs below $25k, 57.7% for AGIs $25k-50k, 98.6% for AGIs $50k-75k, 191.2% for AGIs $75k-100k, 470.6% for AGIs $100k-200k, 10019.2% for AGIs over 200k)
Profit/loss from business: +$18,743 (reported on 16.7% of returns)
Here:
+$18,743
State:
+$15,671
(% of AGI for various income ranges: 185.9% for AGIs below $25k, 243.3% for AGIs $25k-50k, 315.3% for AGIs $50k-75k, 375.1% for AGIs $75k-100k, 706.4% for AGIs $100k-200k, 3739.6% for AGIs over 200k)
Taxable individual retirement arrangement distribution: $26,124 (reported on 10.3% of returns)
94553:
$26,124
California:
$23,505
(% of AGI for various income ranges: 73.6% for AGIs below $25k, 147.5% for AGIs $25k-50k, 263.9% for AGIs $50k-75k, 492.4% for AGIs $75k-100k, 884.3% for AGIs $100k-200k, 2396.1% for AGIs over 200k)
Self-employed (Keogh) retirement plans: $20,631 (reported on 1.1% of returns)
94553:
$20,631
California:
$30,163
(% of AGI for various income ranges: 4.8% for AGIs below $25k, 9.1% for AGIs $50k-75k, 18.2% for AGIs $75k-100k, 49.0% for AGIs $100k-200k, 470.1% for AGIs over 200k)
Total itemized deductions: $30,765 (reported on 23.2% of returns)
Here:
$30,765
State:
$39,517
(% of AGI for various income ranges: 168.8% for AGIs below $25k, 308.0% for AGIs $25k-50k, 651.7% for AGIs $50k-75k, 1275.9% for AGIs $75k-100k, 2309.3% for AGIs $100k-200k, 7089.2% for AGIs over 200k)
Charity contributions: $4,751 (reported on 18.7% of returns)
Here:
$4,751
State:
$12,598
(% of AGI for various income ranges: 7.9% for AGIs below $25k, 23.4% for AGIs $25k-50k, 59.4% for AGIs $50k-75k, 119.3% for AGIs $75k-100k, 258.4% for AGIs $100k-200k, 1259.2% for AGIs over 200k)
Taxes paid: $8,948 (reported on 23.1% of returns)
94553:
$8,948
State:
$8,807
(% of AGI for various income ranges: 32.6% for AGIs below $25k, 72.0% for AGIs $25k-50k, 185.9% for AGIs $50k-75k, 422.0% for AGIs $75k-100k, 745.2% for AGIs $100k-200k, 1802.0% for AGIs over 200k)
Earned income credit: $1,587 (reported on 7.2% of returns)
Here:
$1,587
State:
$2,074
(% of AGI for various income ranges: 53.5% for AGIs below $25k, 35.6% for AGIs $25k-50k)
Percentage of individuals using paid preparers for their 2020 taxes: 92.6%
Here:
93%
State:
92%
(% for various income ranges: 89.9% for AGIs below $25k, 93.0% for AGIs $25k-50k, 92.7% for AGIs $50k-75k, 93.0% for AGIs $75k-100k, 93.7% for AGIs $100k-200k, 95.0% for AGIs over 200k)
Averages for the 2012 tax year for zip code 94553, filed in 2013:
Average Adjusted Gross Income (AGI) in 2012: $72,533 (Individual Income Tax Returns)
Here:
$72,533
State:
$72,726
Salary/wage: $65,041 (reported on 81.0% of returns)
Here:
$65,041
State:
$59,079
(% of AGI for various income ranges: 66.7% for AGIs below $25k, 74.4% for AGIs $25k-50k, 73.3% for AGIs $50k-75k, 74.7% for AGIs $75k-100k, 78.0% for AGIs $100k-200k, 62.5% for AGIs over 200k)
Taxable interest for individuals: $915 (reported on 47.1% of returns)
This zip code:
$915
California:
$2,146
(% of AGI for various income ranges: 1.2% for AGIs below $25k, 0.6% for AGIs $25k-50k, 0.6% for AGIs $50k-75k, 0.5% for AGIs $75k-100k, 0.5% for AGIs $100k-200k, 0.8% for AGIs over 200k)
Ordinary dividends: $4,238 (reported on 24.2% of returns)
Here:
$4,238
State:
$9,308
(% of AGI for various income ranges: 2.2% for AGIs below $25k, 1.2% for AGIs $25k-50k, 1.4% for AGIs $50k-75k, 1.1% for AGIs $75k-100k, 1.0% for AGIs $100k-200k, 2.2% for AGIs over 200k)
Net capital gain/loss in AGI: +$6,428 (reported on 19.5% of returns)
Here:
+$6,428
State:
+$30,460
(% of AGI for various income ranges: 0.3% for AGIs $25k-50k, 0.4% for AGIs $50k-75k, 0.4% for AGIs $75k-100k, 0.7% for AGIs $100k-200k, 6.3% for AGIs over 200k)
Profit/loss from business: +$18,192 (reported on 16.0% of returns)
Here:
+$18,192
State:
+$17,064
(% of AGI for various income ranges: 11.1% for AGIs below $25k, 5.7% for AGIs $25k-50k, 3.6% for AGIs $50k-75k, 2.9% for AGIs $75k-100k, 3.0% for AGIs $100k-200k, 4.4% for AGIs over 200k)
Taxable individual retirement arrangement distribution: $20,600 (reported on 10.8% of returns)
94553:
$20,600
California:
$19,557
(% of AGI for various income ranges: 3.7% for AGIs below $25k, 2.6% for AGIs $25k-50k, 2.9% for AGIs $50k-75k, 3.1% for AGIs $75k-100k, 2.7% for AGIs $100k-200k, 3.8% for AGIs over 200k)
Self-employment retirement plans: $18,871 (reported on 0.9% of returns)
94553:
$18,871
California:
$24,530
(% of AGI for various income ranges: 0.1% for AGIs below $25k, 0.2% for AGIs $75k-100k, 0.2% for AGIs $100k-200k, 0.5% for AGIs over 200k)
Total itemized deductions: $27,384 (24% of AGI, reported on 46.5% of returns)
Here:
$27,384
State:
$34,004
Here:
23.6% of AGI
State:
22.7% of AGI
(% of AGI for various income ranges: 16.5% for AGIs below $25k, 12.4% for AGIs $25k-50k, 15.8% for AGIs $50k-75k, 18.0% for AGIs $75k-100k, 19.2% for AGIs $100k-200k, 18.2% for AGIs over 200k)
Charity contributions: $2,677 (reported on 38.8% of returns)
Here:
$2,677
State:
$4,659
(% of AGI for various income ranges: 0.7% for AGIs below $25k, 0.9% for AGIs $25k-50k, 1.2% for AGIs $50k-75k, 1.5% for AGIs $75k-100k, 1.6% for AGIs $100k-200k, 1.7% for AGIs over 200k)
Taxes paid: $10,773 (reported on 46.4% of returns)
94553:
$10,773
State:
$14,448
(% of AGI for various income ranges: 3.1% for AGIs below $25k, 2.8% for AGIs $25k-50k, 4.6% for AGIs $50k-75k, 6.4% for AGIs $75k-100k, 7.8% for AGIs $100k-200k, 9.9% for AGIs over 200k)
Earned income credit: $1,707 (reported on 9.5% of returns)
Here:
$1,707
State:
$2,286
(% of AGI for various income ranges: 3.6% for AGIs below $25k, 0.5% for AGIs $25k-50k)
Percentage of individuals using paid preparers for their 2012 taxes: 52.6%
Here:
53%
State:
64%
(% for various income ranges: 45.4% for AGIs below $25k, 50.0% for AGIs $25k-50k, 55.3% for AGIs $50k-75k, 57.7% for AGIs $75k-100k, 58.1% for AGIs $100k-200k, 64.9% for AGIs over 200k)
Averages for the 2004 tax year for zip code 94553, filed in 2005:
Average Adjusted Gross Income (AGI) in 2004: $62,284 (Individual Income Tax Returns)
Here:
$62,284
State:
$58,600
Salary/wage: $56,484 (reported on 83.6% of returns)
Here:
$56,484
State:
$49,455
(% of AGI for various income ranges: 186.1% for AGIs below $10k, 69.5% for AGIs $10k-25k, 78.8% for AGIs $25k-50k, 79.9% for AGIs $50k-75k, 81.5% for AGIs $75k-100k, 71.0% for AGIs over 100k)
Taxable interest for individuals: $1,402 (reported on 56.9% of returns)
This zip code:
$1,402
California:
$2,365
(% of AGI for various income ranges: 11.1% for AGIs below $10k, 2.6% for AGIs $10k-25k, 1.2% for AGIs $25k-50k, 1.1% for AGIs $50k-75k, 1.0% for AGIs $75k-100k, 1.3% for AGIs over 100k)
Taxable dividends: $2,198 (reported on 29.3% of returns)
Here:
$2,198
State:
$4,746
(% of AGI for various income ranges: 9.4% for AGIs below $10k, 2.1% for AGIs $10k-25k, 1.1% for AGIs $25k-50k, 1.0% for AGIs $50k-75k, 0.9% for AGIs $75k-100k, 0.9% for AGIs over 100k)
Net capital gain/loss: +$7,266 (reported on 23.6% of returns)
Here:
+$7,266
State:
+$23,418
(% of AGI for various income ranges: -4.1% for AGIs below $10k, 0.2% for AGIs $10k-25k, 0.3% for AGIs $25k-50k, 0.4% for AGIs $50k-75k, 1.0% for AGIs $75k-100k, 5.2% for AGIs over 100k)
Profit/loss from business: +$22,910 (reported on 15.6% of returns)
Here:
+$22,910
State:
+$16,826
(% of AGI for various income ranges: 9.1% for AGIs below $10k, 8.7% for AGIs $10k-25k, 5.3% for AGIs $25k-50k, 4.0% for AGIs $50k-75k, 4.0% for AGIs $75k-100k, 6.8% for AGIs over 100k)
IRA payment deduction: $3,103 (reported on 2.9% of returns)
94553:
$3,103
California:
$3,192
(% of AGI for various income ranges: 0.5% for AGIs below $10k, 0.2% for AGIs $10k-25k, 0.2% for AGIs $25k-50k, 0.2% for AGIs $50k-75k, 0.1% for AGIs $75k-100k, 0.1% for AGIs over 100k)
Self-employed pension: $14,293 (reported on 1.9% of returns)
Here:
$14,293
California:
$17,688
(% of AGI for various income ranges: 0.2% for AGIs $10k-25k, 0.2% for AGIs $25k-50k, 0.2% for AGIs $50k-75k, 0.3% for AGIs $75k-100k, 0.7% for AGIs over 100k)
Total itemized deductions: $24,646 (26% of AGI, reported on 50.2% of returns)
Here:
$24,646
State:
$28,113
Here:
25.7% of AGI
State:
25.3% of AGI
(% of AGI for various income ranges: 54.0% for AGIs below $10k, 16.4% for AGIs $10k-25k, 16.2% for AGIs $25k-50k, 20.8% for AGIs $50k-75k, 22.6% for AGIs $75k-100k, 19.7% for AGIs over 100k)
Charity contributions deductions: $2,411 (2% of AGI, reported on 44.7% of returns)
Here:
$2,411
State:
$3,923
Here:
2.4% of AGI
State:
3.3% of AGI
(% of AGI for various income ranges: 1.7% for AGIs below $10k, 0.9% for AGIs $10k-25k, 1.2% for AGIs $25k-50k, 1.6% for AGIs $50k-75k, 1.9% for AGIs $75k-100k, 1.9% for AGIs over 100k)
Total tax: $9,464 (reported on 84.9% of returns)
94553:
$9,464
State:
$10,761
(% of AGI for various income ranges: 7.9% for AGIs below $10k, 5.2% for AGIs $10k-25k, 8.3% for AGIs $25k-50k, 10.1% for AGIs $50k-75k, 10.6% for AGIs $75k-100k, 16.8% for AGIs over 100k)
Earned income credit: $1,356 (reported on 7.0% of returns)
Here:
$1,356
State:
$1,763
Percentage of individuals using paid preparers for their 2004 taxes: 56.3%
Here:
56%
State:
66%
(% for various income ranges: 45.6% for AGIs below $10k, 54.7% for AGIs $10k-25k, 54.5% for AGIs $25k-50k, 59.7% for AGIs $50k-75k, 61.0% for AGIs $75k-100k, 62.2% for AGIs over 100k)
Likely homosexual households (counted as self-reported same-sex unmarried-partner households)
Lesbian couples: 0.2% of all households
Gay men: 0.1% of all households
Household received Food Stamps/SNAP in the past 12 months: 1,440 Household did not receive Food Stamps/SNAP in the past 12 months: 17,848
Women who had a birth in the past 12 months: 487 (457 now married, 27 unmarried) Women who did not have a birth in the past 12 months: 9,629 (4,258 now married, 5,353 unmarried)
Housing units in zip code 94553 with a mortgage: 9,872 (923 second mortgage, 14 home equity loan, 837 both second mortgage and home equity loan) Houses without a mortgage: 154
Median monthly owner costs for units with a mortgage: $2,824 Median monthly owner costs for units without a mortgage: $829
Residents with income below the poverty level in 2022:
This zip code:
6.5%
Whole state:
12.2%
Residents with income below 50% of the poverty level in 2022:
This zip code:
2.1%
Whole state:
6.2%
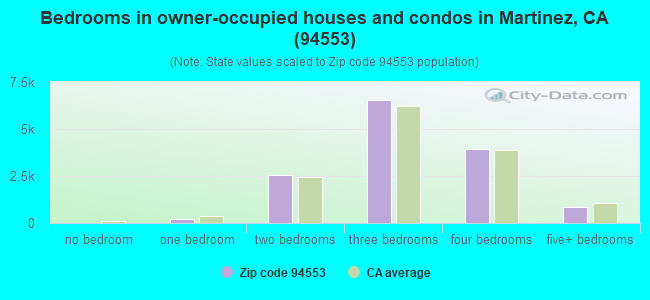
Median number of rooms in houses and condos:
Here:
6.2
State:
6.0
Median number of rooms in apartments:
Here:
4.2
State:
3.9
Notable locations in this zip code not listed on our city pages
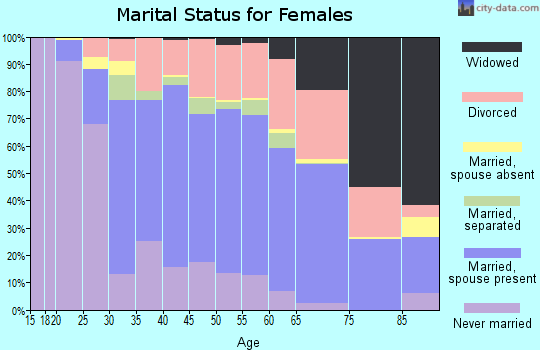
6,837 married couples with children.
1,799 single-parent households (460 men, 1,339 women).
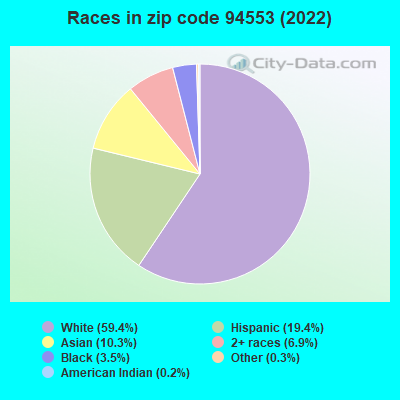
80.2% of residents of 94553 zip code speak English at home.
9.2% of residents speak Spanish at home (79% very well, 15% well, 5% not well, 2% not at all).
4.2% of residents speak other Indo-European language at home (76% very well, 20% well, 4% not well).
5.6% of residents speak Asian or Pacific Island language at home (66% very well, 17% well, 15% not well, 2% not at all).
0.5% of residents speak other language at home (96% very well, 4% well).
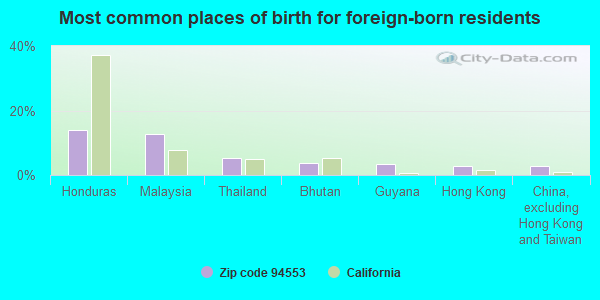
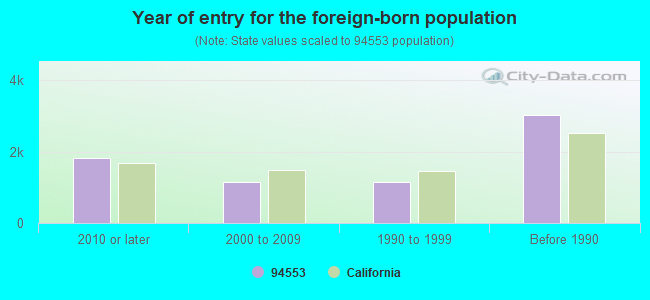
Foreign born population: 6,441 (13.2%) (70.4% of them are naturalized citizens)
Major facilities with environmental interests located in this zip code:
ACME LANDFILL (950 WATERBIRD WAY in MARTINEZ, CA)
AIR MAJOR (AIRS/AFS) STATE MASTER (California Solid Waste disposal sites tracking) - REFUSE DISPOSAL STATE MASTER (California - Hazardous Waste Tracking) - HAZARDOU WASTE PROGRAM (Integrated Compliance Information System) - ICIS-09-1990-0001, FORMAL ENFORCEMENT ACTION CRITERIA AND HAZARDOUS AIR POLLUTANT INVENTORY (Inventory of air pollution sources) National Pollutant Discharge Elimination System NON-MAJOR (Tracking pollutant discharge elimination systems) - permit HAZARDOUS WASTE BIENNIAL REPORTER (Resource Conservation and Recovery Act (tracking hazardous waste)) Large Quantity Generators, more that 1000 kg of hazardous waste/month (Resource Conservation and Recovery Act (tracking hazardous waste)) TSD (Resource Conservation and Recovery Act (tracking hazardous waste)) Small Quantity Generators, between 100 kg and 1000 kg of hazardous waste/month (Resource Conservation and Recovery Act (tracking hazardous waste)) - notification REFUSE DISPOSAL (Solid waste facilities tracking) Business SIC classification: REFUSE SYSTEMS Business NAICS classification: SOLID WASTE LANDFILL.; SOLID WASTE LANDFILL. Organizations: ACME FILL CORPORATION (CONTACT/OPERATOR)
, ACME FILL CORP (CONTACT/OWNER)
Alternative names: ACME FILL CORP
CHEVRON USA INC AVON CA TERMINAL (611 SOLANO WAY in MARTINEZ, CA)
OIL CONTROL (Facility Response Plan for oil discharge) STATE MASTER (California - Hazardous Waste Tracking) - HAZARDOU WASTE PROGRAM CRITERIA AND HAZARDOUS AIR POLLUTANT INVENTORY (Inventory of air pollution sources) Large Quantity Generators, more that 1000 kg of hazardous waste/month (Resource Conservation and Recovery Act (tracking hazardous waste)) Small Quantity Generators, between 100 kg and 1000 kg of hazardous waste/month (Resource Conservation and Recovery Act (tracking hazardous waste)) Small Quantity Generators, between 100 kg and 1000 kg of hazardous waste/month (Resource Conservation and Recovery Act (tracking hazardous waste)) TRI REPORTER (Tracking of toxic chemicals releasing facilities) Business SIC classification: PETROLEUM BULK STATIONS AND TERMINALS Organizations: CHEVRON U.S.A. PRODUCTS (CONTACT/GENERAL)
, CHEVRON PRODUCTS CO. (CONTACT/OPERATOR)
Alternative names: AVON TERMINAL CHEVRON PRODS. CO., CHEVRON INC, CHEVRON 1001094, CHEVRON AVON TERMINAL , CHEVRON PRODS. CO. AVON TERMINAL, CHEVRON USA INC AVON STA
IT CORP VINE HILL FACILITY (896 WATERBIRD WAY in MARTINEZ, CA)
STATE MASTER (California - Hazardous Waste Tracking) - HAZARDOU WASTE PROGRAM CRITERIA AND HAZARDOUS AIR POLLUTANT INVENTORY (Inventory of air pollution sources) (Resource Conservation and Recovery Act (tracking hazardous waste)) HAZARDOUS WASTE BIENNIAL REPORTER (Resource Conservation and Recovery Act (tracking hazardous waste)) Large Quantity Generators, more that 1000 kg of hazardous waste/month (Resource Conservation and Recovery Act (tracking hazardous waste)) TSD (Resource Conservation and Recovery Act (tracking hazardous waste)) Business SIC classification: REFUSE SYSTEMS Business NAICS classification: SOLID WASTE LANDFILL. Organizations: IT CORPORATION (CONTACT/OPERATOR)
, IT VINE HILL LLC (CONTACT/OWNER)
Alternative names: IT CORP VINE HILL COMPLEX
CALTRANS BENICIA MARTINEZ BRIDGE (BENICIA MARTINEZ BRIDGE in MARTINEZ, CA)
STATE MASTER (California - Hazardous Waste Tracking) - HAZARDOU WASTE PROGRAM Large Quantity Generators, more that 1000 kg of hazardous waste/month (Resource Conservation and Recovery Act (tracking hazardous waste)) - notification Large Quantity Generators, more that 1000 kg of hazardous waste/month (Resource Conservation and Recovery Act (tracking hazardous waste)) - notification Alternative names: CALTRANS DIST 4
KAISER PERMANENTE MEDICAL CENTER (200 MUIR ROAD in MARTINEZ, CA)
STATE MASTER (California - Hazardous Waste Tracking) - HAZARDOU WASTE PROGRAM CRITERIA AND HAZARDOUS AIR POLLUTANT INVENTORY (Inventory of air pollution sources) HAZARDOUS WASTE BIENNIAL REPORTER (Resource Conservation and Recovery Act (tracking hazardous waste)) Large Quantity Generators, more that 1000 kg of hazardous waste/month (Resource Conservation and Recovery Act (tracking hazardous waste)) Business SIC classification: GENERAL MEDICAL AND SURGICAL HOSPITALS Business NAICS classification: OFFICES OF PHYSICIANS (EXCEPT MENTAL HEALTH SPECIALISTS).; HMO MEDICAL CENTERS.; DIAGNOSTIC IMAGING CENTERS. Organizations: KAISER FOUNDATION HOSPITALS (CONTACT/OPERATOR)
Alternative names: KAISER FOUNDATION HOSPITAL
MONSANTO COMPANY (1778 MONSANTO WAY in MARTINEZ, CA)
STATE MASTER (California - Hazardous Waste Tracking) - HAZARDOU WASTE PROGRAM CRITERIA AND HAZARDOUS AIR POLLUTANT INVENTORY (Inventory of air pollution sources) Large Quantity Generators, more that 1000 kg of hazardous waste/month (Resource Conservation and Recovery Act (tracking hazardous waste)) TRI REPORTER (Tracking of toxic chemicals releasing facilities) Business SIC classification: INDUSTRIAL INORGANIC CHEMICALS Business NAICS classification: ALL OTHER BASIC INORGANIC CHEMICAL MANUFACTURING. Organizations: MECS INC (CONTACT/OPERATOR)
Alternative names: MECS INC, MONSANTO CHEM CO AVON PLT
GOLDEN EAGLE REFINERY (GOLDEN EAGLE REFINERY in MARTINEZ, CA) . Federal Facility
STATE MASTER (California - Hazardous Waste Tracking) - HAZARDOU WASTE PROGRAM FORMAL ENFORCEMENT ACTION (Integrated Compliance Information System) - ICIS-09-2001-0141, ENFORCEMENT/COMPLIANCE ACTIVITY
CHEVRON STATION 91338 (1250 MORELLO AVE in MARTINEZ, CA)
STATE MASTER (California - Hazardous Waste Tracking) - HAZARDOU WASTE PROGRAM HAZARDOUS WASTE BIENNIAL REPORTER (Resource Conservation and Recovery Act (tracking hazardous waste)) Large Quantity Generators, more that 1000 kg of hazardous waste/month (Resource Conservation and Recovery Act (tracking hazardous waste)) Small Quantity Generators, between 100 kg and 1000 kg of hazardous waste/month (Resource Conservation and Recovery Act (tracking hazardous waste)) - notification Organizations: CHEVRON PRODUCTS CO (CONTACT/OWNER)
Alternative names: CHEVRON 91338, CHEVRON STATION #91338
ALHAMBRA SENIOR HIGH SCHOOL (150 E ST in MARTINEZ, CA)
(Geographic Names Information System) (National Center for Education Statistics) - STATE ID-0730549 Small Quantity Generators, between 100 kg and 1000 kg of hazardous waste/month (Resource Conservation and Recovery Act (tracking hazardous waste)) Organizations: MARTINEZ UNIFIED S. D. (CONTACT/OWNER)
, MARTINEZ UNIFIED (SCHOOL DISTRICT)
Alternative names: ALHAMBRA HIGH SCHOOL
IT CORP BAKER FAC (E END OF ARTHUR RD in MARTINEZ, CA)
(Integrated Compliance Information System) - ICIS-09-1986-0025, FORMAL ENFORCEMENT ACTION (Resource Conservation and Recovery Act (tracking hazardous waste)) Business SIC classification: REFUSE SYSTEMS Organizations: IT CORPORATION (CONTACT/OWNER)
Alternative names: IT CORP OIL REPROCESS FACILITY
NICOLET COMPUTER GRAPHICS (777 ARNOLD DR in MARTINEZ, CA)
Small Quantity Generators, between 100 kg and 1000 kg of hazardous waste/month (Resource Conservation and Recovery Act (tracking hazardous waste)) - notification (Resource Conservation and Recovery Act (tracking hazardous waste)) Small Quantity Generators, between 100 kg and 1000 kg of hazardous waste/month (Resource Conservation and Recovery Act (tracking hazardous waste)) - notification Organizations: EWW CO (CONTACT/OWNER)
, AM INTERNATIONAL (CONTACT/OWNER)
, A M INTERNATIONAL (CONTACT/OWNER)
Alternative names: BRUNING COMPUTER GRAPHICS, ZETA GRAPHICS CORP
FOSTER WHEELER MARTINEZ (550 SOLANO WAY in MARTINEZ, CA)
STATE MASTER (California - Hazardous Waste Tracking) - HAZARDOU WASTE PROGRAM Large Quantity Generators, more that 1000 kg of hazardous waste/month (Resource Conservation and Recovery Act (tracking hazardous waste)) - notification Organizations: FOSTER WHEELER MARTINEZ INC (CONTACT/OWNER)
FEDERAL EXPRESS (115 CENTER ST in PACHECO, CA)
STATE MASTER (California - Hazardous Waste Tracking) - HAZARDOU WASTE PROGRAM Small Quantity Generators, between 100 kg and 1000 kg of hazardous waste/month (Resource Conservation and Recovery Act (tracking hazardous waste)) - notification Organizations: FREDRICK SMITH (CONTACT/OWNER)
Housing units lacking complete plumbing facilities: 0.5% Housing units lacking complete kitchen facilities: 0.6%
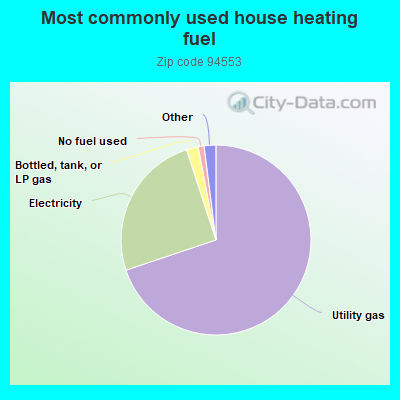
69.8%Utility gas
25.1%Electricity
2.0%Bottled, tank, or LP gas
1.0%No fuel used
0.9%Solar energy
0.9%Wood
Population in 1990: 45,532. Population change in the 1990s: +1,127 (+2.5%).
Place of birth for U.S.-born residents:
This state: 33,208
Northeast: 1,834
Midwest: 2,447
South: 1,925
West: 2,026
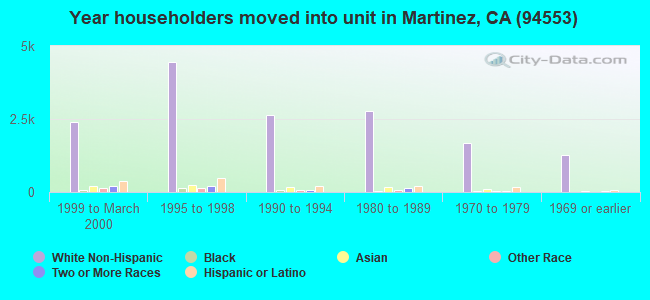
55% of the 94553 zip code residents lived in the same house 5 years ago. Out of people who lived in different houses, 68% lived in this county. Out of people who lived in different counties, 50% lived in California.
91% of the 94553 zip code residents lived in the same house 1 year ago. Out of people who lived in different houses, 61% moved from this county. Out of people who lived in different houses, 25% moved from different county within same state. Out of people who lived in different houses, 11% moved from different state. Out of people who lived in different houses, 2% moved from abroad.
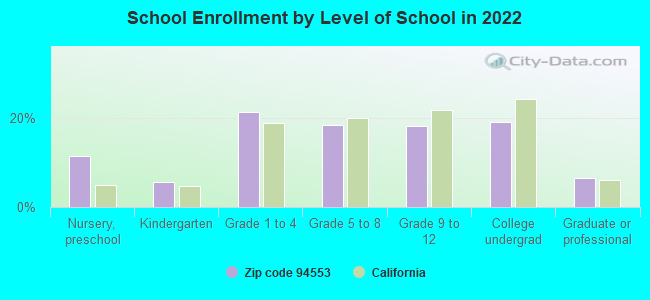
Private vs. public school enrollment:
Students in private schools in grades 1 to 8 (elementary and middle school): 279
Here:
6.8%
California:
10.5%
Students in private schools in grades 9 to 12 (high school): 224
Here:
12.0%
California:
8.5%
Students in private undergraduate colleges: 131
Here:
6.7%
California:
15.9%
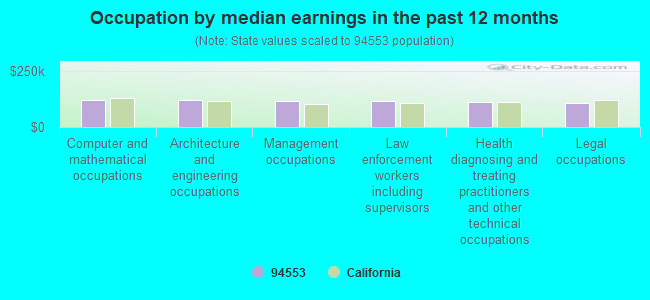
Occupation by median earnings in the past 12 months ($)
121,150Computer and mathematical occupations
119,303Architecture and engineering occupations
114,313Management occupations
113,313Law enforcement workers including supervisors
112,937Health diagnosing and treating practitioners and other technical occupations
107,187Legal occupations
Companies with biggest federal contracts located in this zip code:
I T CORPORATION (4585 PACHECO BLVD in MARTINEZ, CA) : $180,336,294 in 1028 contractsfrom 1999 to 2006
Contracts for Construction of Structures and Facilities -- Other Non-Building Facilities, Construction of Structures and Facilities -- Restoration of real property, Architect - Engineer Services (including landscaping, interior layout, and designing), Other Environmental Services, Studies, and Analytical Support, and moreby Navy Signed by year:2000: $73,731,344; 2001: $69,161,618; 2002: $26,704,107; 2003: $4,878,665; 2004: -$5,242,773; 2005: $8,321,747; 2006: $188,954.
Biggest contracts:
$17,234,617 with Navy for Construction of Structures and Facilities -- Other Non-Building Facilities. Signed on 2000-11-09. Completion date: 2001-11-30.
$10,915,140, same as above.Signed on 2000-12-06. Completion date: 2001-12-30.
$8,944,980, same as above.Signed on 2000-12-11. Completion date: 2001-12-14.
$7,361,366, same as above.Signed on 2001-05-18. Completion date: 2001-11-30.
BAY AREA/DIABLO PETROLEUM CO (501 SHELL AVE in MARTINEZ, CA; small business) : $22,150,753 in 15 contractsfrom 2001 to 2006
Contracts for Fuel Oils, Liquid Propellants and Fuels, Petroleum Base by Defense Logistics Agency, NASA Signed by year:2000: $0; 2001: $495,586; 2002: $0; 2003: $0; 2004: $1,788,235; 2005: $19,856,677; 2006: $10,255.
Biggest contracts:
$14,124,424 with Defense Logistics Agency for Fuel Oils. Taking place in UT. Signed on 2005-04-01. Completion date: 2009-08-31.
$4,187,520, same as above.Signed on 2005-06-13. Completion date: 2009-08-31.
$1,836,765 with Defense Logistics Agency for Fuel Oils. Signed on 2004-04-28. Completion date: 2004-08-31.
$1,137,680 with Defense Logistics Agency for Fuel Oils. Taking place in UT. Signed on 2005-05-10. Completion date: 2009-08-31.
SHORE TERMINALS LLC (2801 WATERFRONT RD in MARTINEZ, CA) : $9,068,294 in 8 contractsfrom 2004 to 2006
Contracts for Lease or Rental of Facilities -- Fuel Storage Buildings by Defense Logistics Agency Signed by year:2000: $0; 2001: $0; 2002: $0; 2003: $0; 2004: $2,390,281; 2005: $2,772,140; 2006: $3,905,873.
Biggest contracts:
$2,772,640 with Defense Logistics Agency for Lease or Rental of Facilities -- Fuel Storage Buildings. Signed on 2006-03-15. Completion date: 2010-03-06.
$2,771,140, same as above.Signed on 2005-01-24. Completion date: 2006-03-06.
$1,133,233 with Defense Logistics Agency for Lease or Rental of Facilities -- Fuel Storage Buildings. Taking place in OR. Signed on 2006-03-10. Completion date: 2007-02-11.
$1,133,233, same as above.Signed on 2004-10-15. Completion date: 2006-02-11.
BCN COMPANY (635 ESCOBAR STREET in MARTINEZ, CA; small business) : $3,308,949 in 25 contractsfrom 1999 to 2002
Contracts for Maintenance, Repair or Alteration of Real Property -- Other Non-Building Facilities, Maintenance, Repair or Alteration of Real Property -- Family Housing Facilities, Construction of Structures and Facilities -- Highways, Roads, Streets, Bridges, and Railways (includes resurfacing), Maintenance, Repair or Alteration of Real Property -- Miscellaneous Buildings, and moreby U.S. Army Corps of Engineers - civil program financing only, Air Force, Forest Service, Forest Service (disused code: now 12C2), and others Signed by year:2000: $957,678; 2001: $2,461,643; 2002: -$150,000; 2003: $0; 2004: $0; 2005: $0; 2006: $0.
Biggest contracts:
$1,615,760 with U.S. Army Corps of Engineers - civil program financing only for Maintenance, Repair or Alteration of Real Property -- Other Non-Building Facilities. Signed on 2001-05-24. Completion date: 2002-09-19.
$642,000 with Air Force for Maintenance, Repair or Alteration of Real Property -- Family Housing Facilities. Signed on 2001-03-21. Completion date: 2001-07-30.
$237,331 with Forest Service for Construction of Structures and Facilities -- Highways, Roads, Streets, Bridges, and Railways (includes resurfacing). Signed on 2000-07-15. Completion date: 1999-10-15.
$186,000 with Forest Service (disused code: now 12C2) for Construction of Structures and Facilities -- Highways, Roads, Streets, Bridges, and Railways (includes resurfacing). Signed on 2000-04-15. Completion date: 2000-11-15.
dr. leonard s. miller (2331 Ranch Del Lago Road in Martinez, CA) : $1,248,400 in 12 contractsfrom 2000 to 2005
Contracts for Legal Services by Offices, Boards and Divisions (includes Attorney General, Deputy Attorney General, etc.) Signed by year:2000: $625,000; 2001: $460,000; 2002: $53,000; 2003: $54,800; 2004: $34,100; 2005: $21,500; 2006: $0.
Biggest contracts:
$390,000 with Offices, Boards and Divisions (includes Attorney General, Deputy Attorney General, etc.) for Legal Services. Taking place in DC. Signed on 2000-01-15. Completion date: 2000-09-15.
$368,000, same as above.Signed on 2000-07-15. Completion date: 2000-09-15.
$280,000, same as above.Signed on 2001-09-15. Completion date: 2001-09-15.
$275,000, same as above.Signed on 2000-09-15. Completion date: 2001-01-15.
KITESHIP CORPORATION (2004 SLIVER LAKE WAY in MARTINEZ, CA; small business) : $505,742 in 5 contractsfrom 2004 to 2005
Contracts for Engineering -- Basic Research (R&D), Physical Sciences -- Basic Research (R&D), Engineering -- Operational Systems Development (R&D) by Army Signed by year:2000: $0; 2001: $0; 2002: $0; 2003: $0; 2004: $69,328; 2005: $436,414; 2006: $0.
Biggest contracts:
$326,293 with Army for Engineering -- Basic Research (R&D). Signed on 2005-12-19. Completion date: 2007-11-18.
$69,941 with Army for Physical Sciences -- Basic Research (R&D). Signed on 2005-10-31. Completion date: 2006-04-30.
$69,328 with Army for Engineering -- Operational Systems Development (R&D). Signed on 2004-12-16. Completion date: 2005-06-12.
$40,180, same as above.Signed on 2005-10-25. Completion date: 2005-06-12.
GOATS R US (1215 GARCIA RANCH RD, in MARTINEZ, CA; small business) : $429,341 in 10 contractsfrom 2001 to 2005
Contracts for Landscaping/Groundskeeping Services, Food Services, Insect and Rodent Control Services by Navy Signed by year:2000: $0; 2001: $38,000; 2002: $188,000; 2003: $91,600; 2004: $61,000; 2005: $50,741; 2006: $0.
Biggest contracts:
$75,000 with Navy for Landscaping/Groundskeeping Services. Signed on 2002-09-25. Completion date: 2003-09-24.
$75,000, same as above.Signed on 2002-01-17. Completion date: 2002-07-25.
$61,000 with Navy for Food Services. Signed on 2004-05-21. Completion date: 2004-10-29.
$53,000 with Navy for Landscaping/Groundskeeping Services. Signed on 2005-07-29. Completion date: 2006-07-29.
GRAYBAR ELECTRIC COMPANY, INC (4591 PACHECO BLVD in MARTINEZ, CA) : $363,292 in 3 contractsfrom 2004 to 2005
$336,036 with Navy for Transformers: Distribution and Power Station. Signed on 2004-09-15. Completion date: 2004-10-20.
$19,543 with Navy for Electrical Hardware and Supplies. Signed on 2005-01-11. Completion date: 2005-02-16.
$7,713 with Navy for Miscellaneous Electrical and Electronic Components. Signed on 2005-01-05. Completion date: 2005-04-25.
GOT POWER INC (150 NARDI LN in MARTINEZ, CA; small business) : $267,490 in 11 contractsfrom 2002 to 2006
Contracts for Maintenance, Repair and Rebuilding of Equipment -- Miscellaneous, Miscellaneous Power Transmission Equipment by Defense Logistics Agency, Army Signed by year:2000: $0; 2001: $0; 2002: $40,046; 2003: $80,119; 2004: $45,512; 2005: $93,982; 2006: $7,831.
Biggest contracts:
$81,982 with Defense Logistics Agency for Maintenance, Repair and Rebuilding of Equipment -- Miscellaneous. Signed on 2005-08-03. Completion date: 2006-08-31.
$45,512 with Army for Miscellaneous Power Transmission Equipment. Taking place in AZ. Signed on 2004-05-26. Completion date: 2005-06-30.
$42,000, same as above.Signed on 2003-06-12. Completion date: 2003-06-30.
$38,119, same as above.Signed on 2003-02-07. Completion date: 2003-06-30.
JEFF GARDNER (431 N BUCHANAN CIRCLE #9 in PACHECO, CA; small business) : $165,600 in 4 contractsfrom 2001 to 2004
$42,000 with Air Force for Maintenance, Repair and Rebuilding of Equipment -- Recreational and Athletic Equipment. Signed on 2003-10-01. Completion date: 2008-09-30.
$42,000, same as above.Signed on 2002-10-01. Completion date: 2003-09-30.
$40,800, same as above.Signed on 2004-11-01. Completion date: 2005-09-30.
$40,800, same as above.Signed on 2001-10-01. Completion date: 2002-09-30.
Top industries in this zip code by the number of employees in 2005:
Health Care and Social Assistance: General Medical and Surgical Hospitals (over 1000 employees: 1 establishment, 250-499 employees: 1 establishment)
2004 - 2018 National Fire Incident Reporting System (NFIRS) incidents
According to the data from the years 2004 - 2018 the average number of fire incidents per year is 22. The highest number of fires - 157 took place in 2005, and the least - 3 in 2004. The data has an increasing trend.
When looking into fire subcategories, the most incidents belonged to: Outside Fires (50.9%), and Mobile Property/Vehicle Fires (24.1%).
Fire incident types reported to NFIRS in Zip Code 94553


 Nearest zip codes: 94523, 94569, 94520, 94549, 94597, 94510.


 According to the data from the years 2004 - 2018 the average number of fire incidents per year is 22. The highest number of fires - 157 took place in 2005, and the least - 3 in 2004. The data has an increasing trend.
 When looking into fire subcategories, the most incidents belonged to: Outside Fires (50.9%), and Mobile Property/Vehicle Fires (24.1%).