Hercules, California

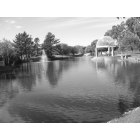
Hercules: The beauty of a simple log seaside Hercules

Hercules: Hercules Seaside Pond
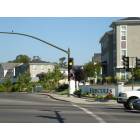
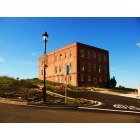
Hercules: San Pablo Av. at Hercules Av., Hercules, CA

Hercules: The Dynamite History of the Dynamic City!
Hercules: The Waterfront Project
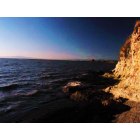
Hercules: Hercules at San Pablo Bay
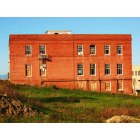
Hercules: "The Explosive History of Hercules"

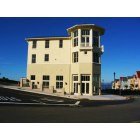
Hercules: The New Hercules

Hercules: Hercules, CA Shoreline at San Pablo Bay
Hercules: A View of Refugio Valley Park
Hercules: Hercules, Dynamite!
- see
13
more - add
your
Submit your own pictures of this city and show them to the world
- OSM Map
- General Map
- Google Map
- MSN Map
Population change since 2000: +33.0%
| Males: 12,197 | |
| Females: 13,723 |
| Median resident age: | 43.0 years |
| California median age: | 37.9 years |
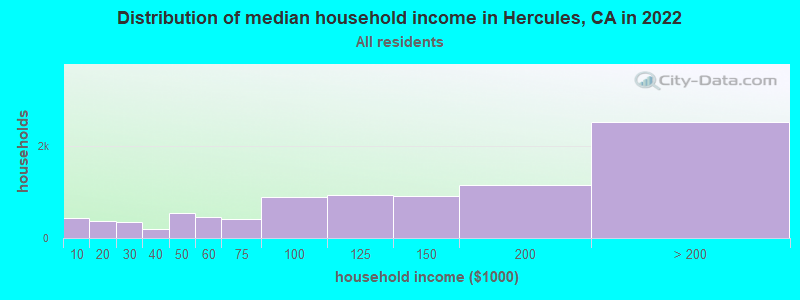
| Hercules: | $125,923 |
| CA: | $91,551 |
Estimated per capita income in 2022: $53,473 (it was $27,699 in 2000)
Hercules city income, earnings, and wages data
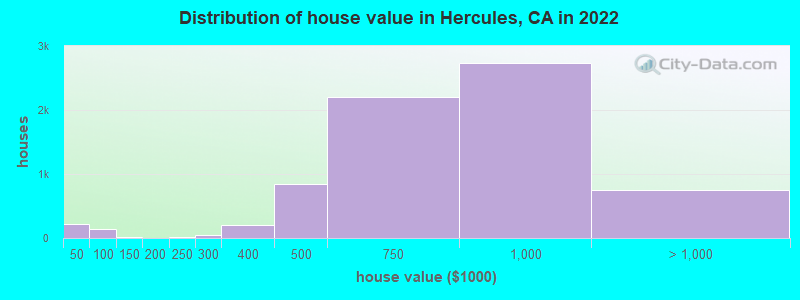
Estimated median house or condo value in 2022: $758,798 (it was $231,800 in 2000)
| Hercules: | $758,798 |
| CA: | $715,900 |
Mean prices in 2022: all housing units: over $1,000,000; detached houses: over $1,000,000; townhouses or other attached units: $865,348; in 2-unit structures: $602,949; in 3-to-4-unit structures: $772,223; in 5-or-more-unit structures: $695,046; mobile homes: $193,193; occupied boats, rvs, vans, etc.: $261,954
Median gross rent in 2022: $2,724.
(3.3% for White Non-Hispanic residents, 8.4% for Black residents, 4.5% for Hispanic or Latino residents, 6.7% for other race residents, 10.2% for two or more races residents)
Detailed information about poverty and poor residents in Hercules, CA


Compare current foreclosures in Hercules, CA:
| Photo | Address | Area | Beds / Baths | Price | Details |
|---|---|---|---|---|---|

|
#1
Grenadine Way
Hercules, CA 94547
|
2,363 sq. feet
|
3 baths 5 beds |
show details | |

|
#2
Zircon Ct
Hercules, CA 94547
|
1,945 sq. feet
|
3 baths 4 beds |
show details | |

|
#3
Carson St
Hercules, CA 94547
|
2,171 sq. feet
|
3 baths 4 beds |
show details | |

|
#4
Lewis St
Hercules, CA 94547
|
1,680 sq. feet
|
2 baths 3 beds |
show details | |

|
#5
Overlook Ter
Hercules, CA 94547
|
1,929 sq. feet
|
3 baths 4 beds |
show details | |

|
#6
Chelsea
Hercules, CA 94547
|
937 sq. feet
|
2 baths 2 beds |
show details | |

|
#7
S Wildwood
Hercules, CA 94547
|
1,413 sq. feet
|
2 baths 3 beds |
show details | |

|
#8
Spinel Ct
Hercules, CA 94547
|
2,346 sq. feet
|
3 baths 4 beds |
show details | |

|
#9
Violet Rd
Hercules, CA 94547
|
3,496 sq. feet
|
3 baths 5 beds |
show details | |

|
#10
Bacchus Apt 2
Hercules, CA 94547
|
1,022 sq. feet
|
1 baths 2 beds |
show details |
| Photo | Address | Area | Beds / Baths | Price | Details |
|---|---|---|---|---|---|

|
#11
S Wildwood
Hercules, CA 94547
|
1,413 sq. feet
|
2 baths 3 beds |
show details | |

|
#12
Lantern Bay
Hercules, CA 94547
|
2,730 sq. feet
|
3 baths 5 beds |
show details | |

|
#13
Falcon Way
Hercules, CA 94547
|
1,720 sq. feet
|
2 baths 4 beds |
show details | |

|
#14
N Wildwood
Hercules, CA 94547
|
1,707 sq. feet
|
2 baths 3 beds |
show details | |

|
#15
Brenner
Hercules, CA 94547
|
1,538 sq. feet
|
3 baths 4 beds |
show details | |

|
#16
Regatta Pt
Hercules, CA 94547
|
3,983 sq. feet
|
4 baths 5 beds |
show details | |

|
#17
Dutch Elm Dr
Hercules, CA 94547
|
2,411 sq. feet
|
3 baths 4 beds |
show details | |

|
#18
Eagle Ct
Hercules, CA 94547
|
1,963 sq. feet
|
2 baths 4 beds |
show details | |

|
#19
Promenade St
Hercules, CA 94547
|
3,236 sq. feet
|
3 baths 5 beds |
show details | |

|
#20
S Wildwood
Hercules, CA 94547
|
1,220 sq. feet
|
2 baths 2 beds |
show details |
| Photo | Address | Area | Beds / Baths | Price | Details |
|---|---|---|---|---|---|

|
#21
Turquoise Dr
Hercules, CA 94547
|
4,815 sq. feet
|
5 baths 6 beds |
show details | |

|
#22
Regatta Pt
Hercules, CA 94547
|
3,983 sq. feet
|
4 baths 5 beds |
show details | |

|
#23
Vierra Way
Hercules, CA 94547
|
1,522 sq. feet
|
2 baths 2 beds |
show details | |

|
#24
Turquoise Dr
Hercules, CA 94547
|
4,634 sq. feet
|
3 baths 4 beds |
show details | |

|
#25
Turquoise Dr
Hercules, CA 94547
|
4,634 sq. feet
|
3 baths 4 beds |
show details | |

|
#26
N Wildwood
Hercules, CA 94547
|
1,413 sq. feet
|
2 baths 3 beds |
show details | |

|
#27
Bonaire Ave
Hercules, CA 94547
|
2,056 sq. feet
|
3 baths 4 beds |
show details | |

|
#28
Turquoise Dr
Hercules, CA 94547
|
4,815 sq. feet
|
5 baths 6 beds |
show details | |

|
#29
N Wildwood
Hercules, CA 94547
|
1,413 sq. feet
|
2 baths 3 beds |
show details | |

|
#30
Mesa Ct
Hercules, CA 94547
|
1,434 sq. feet
|
2 baths 3 beds |
show details |
| Photo | Address | Area | Beds / Baths | Price | Details |
|---|---|---|---|---|---|

|
#31
Eagle Ct
Hercules, CA 94547
|
- sq. feet
|
- baths - beds |
show details | |

|
#32
Alfred Nobel Dr
Hercules, CA 94547
|
- sq. feet
|
- baths - beds |
show details | |

|
#33
Sycamore Ave Unit 5393
Hercules, CA 94547
|
- sq. feet
|
- baths - beds |
show details | |

|
#34
Sycamore Ave # 130
Hercules, CA 94547
|
- sq. feet
|
- baths - beds |
show details | |

|
#35
Forest Run
Hercules, CA 94547
|
- sq. feet
|
- baths - beds |
show details | |

|
#36
Sycamore Ave Ste M178
Hercules, CA 94547
|
- sq. feet
|
- baths - beds |
show details | |

|
Check over 1 million property listings on Foreclosure.com!
|
browse all offers | |||


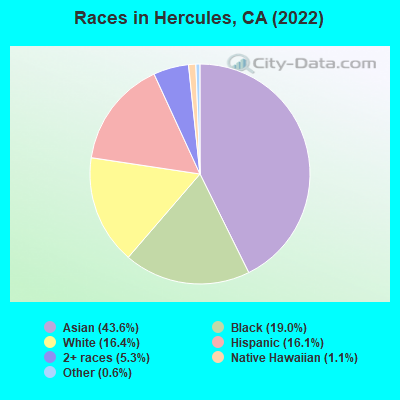
- 11,29743.6%Asian alone
- 4,92819.0%Black alone
- 4,24516.4%White alone
- 4,16416.1%Hispanic
- 1,3825.3%Two or more races
- 2741.1%Native Hawaiian and Other
Pacific Islander alone - 1470.6%Other race alone
According to our research of California and other state lists, there were 16 registered sex offenders living in Hercules, California as of April 27, 2024.
The ratio of all residents to sex offenders in Hercules is 1,602 to 1.
The ratio of registered sex offenders to all residents in this city is lower than the state average.
Type |
2009 |
2010 |
2011 |
2012 |
2013 |
2014 |
2015 |
2016 |
2017 |
2018 |
2019 |
2020 |
2022 |
|---|---|---|---|---|---|---|---|---|---|---|---|---|---|
| Murders (per 100,000) | 2 (8.0) | 2 (8.3) | 0 (0.0) | 1 (4.1) | 0 (0.0) | 0 (0.0) | 1 (3.9) | 1 (3.9) | 0 (0.0) | 0 (0.0) | 0 (0.0) | 0 (0.0) | 0 (0.0) |
| Rapes (per 100,000) | 2 (8.0) | 3 (12.5) | 2 (8.2) | 1 (4.1) | 2 (8.1) | 1 (4.0) | 1 (3.9) | 0 (0.0) | 6 (23.5) | 0 (0.0) | 5 (19.4) | 2 (7.5) | 7 (26.8) |
| Robberies (per 100,000) | 15 (59.7) | 12 (49.9) | 10 (41.1) | 17 (68.9) | 6 (24.2) | 16 (63.9) | 12 (47.4) | 11 (43.0) | 12 (46.9) | 16 (62.1) | 15 (58.2) | 12 (45.2) | 6 (22.9) |
| Assaults (per 100,000) | 30 (119.4) | 29 (120.5) | 21 (86.3) | 24 (97.2) | 14 (56.4) | 10 (40.0) | 17 (67.1) | 41 (160.5) | 12 (46.9) | 14 (54.4) | 11 (42.7) | 16 (60.3) | 24 (91.8) |
| Burglaries (per 100,000) | 125 (497.6) | 74 (307.6) | 94 (386.1) | 98 (397.1) | 83 (334.3) | 60 (239.8) | 113 (446.2) | 74 (289.6) | 66 (258.1) | 82 (318.4) | 31 (120.2) | 36 (135.7) | 30 (114.7) |
| Thefts (per 100,000) | 219 (871.8) | 201 (835.4) | 174 (714.8) | 144 (583.4) | 143 (575.9) | 180 (719.3) | 214 (845.0) | 266 (1,041) | 269 (1,052) | 240 (932.0) | 278 (1,078) | 163 (614.5) | 134 (512.3) |
| Auto thefts (per 100,000) | 75 (298.6) | 81 (336.7) | 44 (180.8) | 56 (226.9) | 48 (193.3) | 46 (183.8) | 65 (256.7) | 52 (203.5) | 43 (168.2) | 28 (108.7) | 32 (124.1) | 39 (147.0) | 54 (206.4) |
| Arson (per 100,000) | 2 (8.0) | 4 (16.6) | 1 (4.1) | 2 (8.1) | 0 (0.0) | 0 (0.0) | 0 (0.0) | 0 (0.0) | 0 (0.0) | 0 (0.0) | 0 (0.0) | 2 (7.5) | 2 (7.6) |
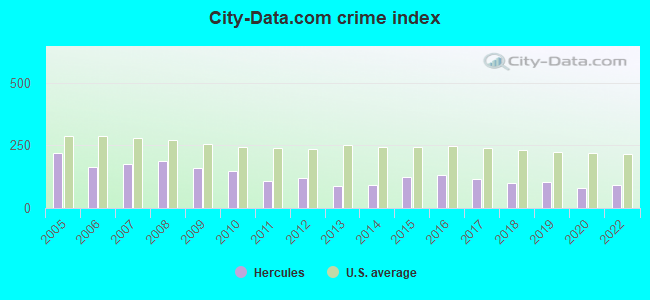
| City-Data.com crime index | 157.7 | 147.5 | 106.2 | 120.7 | 86.9 | 90.6 | 124.3 | 131.0 | 115.8 | 97.8 | 103.0 | 77.5 | 91.7 |
The City-Data.com crime index weighs serious crimes and violent crimes more heavily. Higher means more crime, U.S. average is 246.1. It adjusts for the number of visitors and daily workers commuting into cities.
Crime rate in Hercules detailed stats: murders, rapes, robberies, assaults, burglaries, thefts, arson
Full-time law enforcement employees in 2021, including police officers: 28 (25 officers - 21 male; 4 female).
| Officers per 1,000 residents here: | 0.95 |
| California average: | 2.30 |
 Recent articles from our blog. Our writers, many of them Ph.D. graduates or candidates, create easy-to-read articles on a wide variety of topics.

 | How is Hercules / Pinole? (2 replies) |
| Relocating to Hercules from Minneapolis (47 replies) |
| Housing for TOURO student-Vallejo (20 replies) |
| Hercules (2 replies) |
| Moving from LA to the Bay Area (52 replies) |
| Please suggest a good community to buy a SFH for remote work (8 replies) |
Latest news from Hercules, CA collected exclusively by city-data.com from local newspapers, TV, and radio stations
Ancestries: European (2.3%), Nigerian (2.2%), Italian (2.1%), American (1.4%), Ethiopian (1.3%), Iranian (1.1%).
Current Local Time: PST time zone
Elevation: 60 feet
Land area: 6.48 square miles.
Population density: 4,001 people per square mile (average).
8,402 residents are foreign born (24.8% Asia, 4.5% Latin America).
| This city: | 32.4% |
| California: | 26.5% |
Median real estate property taxes paid for housing units with mortgages in 2022: $7,777 (1.0%)
Median real estate property taxes paid for housing units with no mortgage in 2022: $6,002 (0.8%)
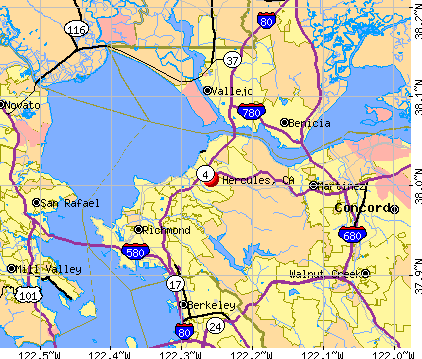
Nearest city with pop. 50,000+: West Contra Costa, CA (4.9 miles  , pop. 236,008).
Nearest city with pop. 1,000,000+: Los Angeles, CA (347.4 miles , pop. 3,694,820).
Nearest cities:
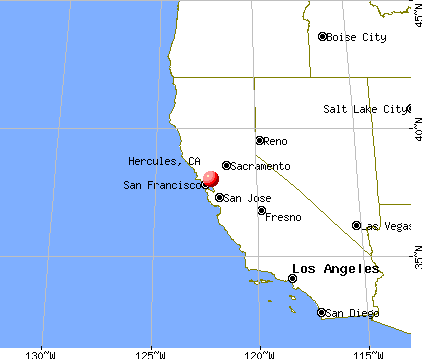
), ), ), )Latitude: 38.01 N, Longitude: 122.26 W
Daytime population change due to commuting: -6,121 (-23.6%)
Workers who live and work in this city: 3,580 (26.7%)
Area code commonly used in this area: 510
Hercules, California accommodation & food services, waste management - Economy and Business Data
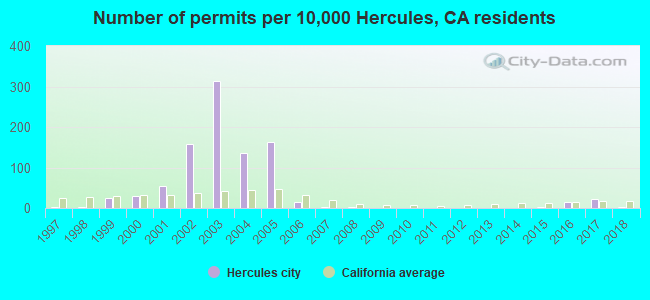
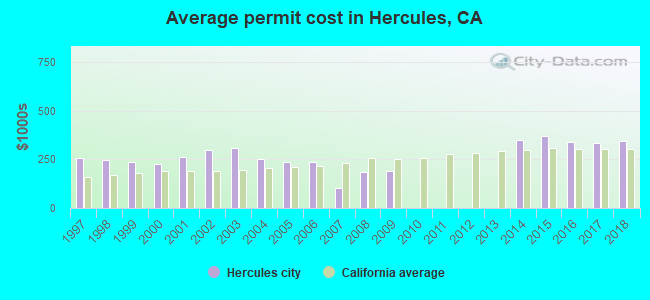
Single-family new house construction building permits:
- 2018: 6 buildings, average cost: $345,000
- 2017: 41 buildings, average cost: $332,200
- 2016: 30 buildings, average cost: $338,400
- 2015: 5 buildings, average cost: $370,000
- 2014: 1 building, cost: $351,400
- 2009: 1 building, cost: $188,400
- 2008: 4 buildings, average cost: $186,400
- 2007: 4 buildings, average cost: $105,100
- 2006: 32 buildings, average cost: $234,200
- 2005: 319 buildings, average cost: $235,800
- 2004: 267 buildings, average cost: $252,500
- 2003: 611 buildings, average cost: $308,000
- 2002: 310 buildings, average cost: $296,000
- 2001: 108 buildings, average cost: $263,900
- 2000: 57 buildings, average cost: $227,400
- 1999: 49 buildings, average cost: $236,400
- 1998: 6 buildings, average cost: $245,100
- 1997: 5 buildings, average cost: $256,500
| Here: | 4.1% |
| California: | 5.1% |
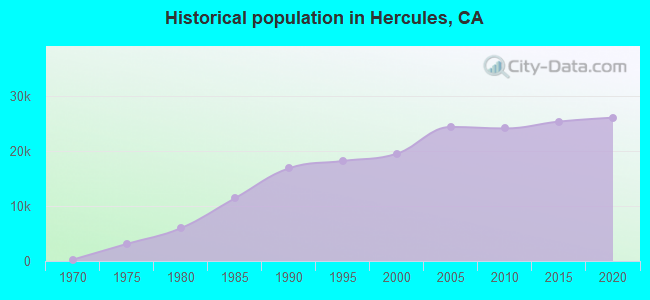
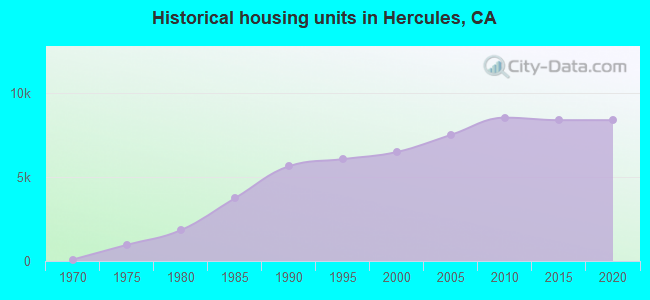
Population change in the 1990s: +2,534 (+14.9%).
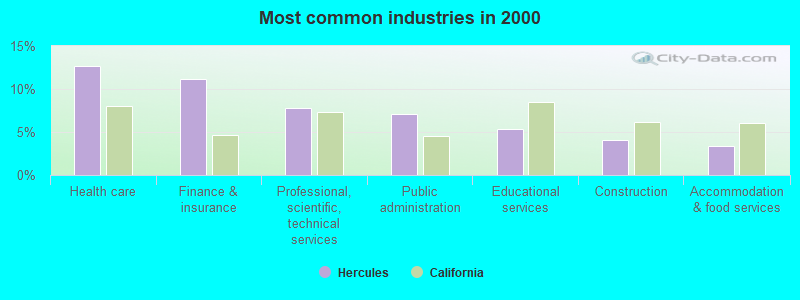
- Health care (12.7%)
- Finance & insurance (11.2%)
- Professional, scientific, technical services (7.8%)
- Public administration (7.1%)
- Educational services (5.4%)
- Construction (4.0%)
- Accommodation & food services (3.4%)
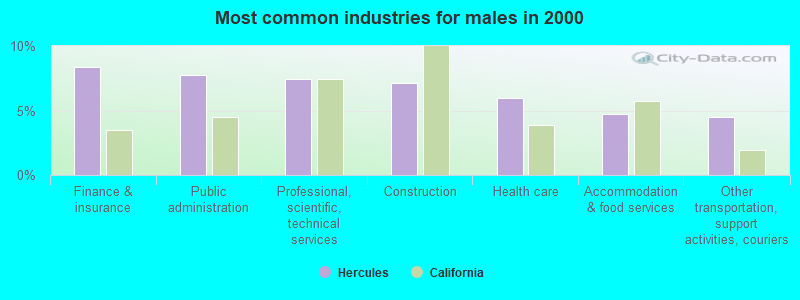
- Finance & insurance (8.4%)
- Public administration (7.8%)
- Professional, scientific, technical services (7.4%)
- Construction (7.1%)
- Health care (5.9%)
- Accommodation & food services (4.7%)
- Other transportation, support activities, couriers (4.5%)
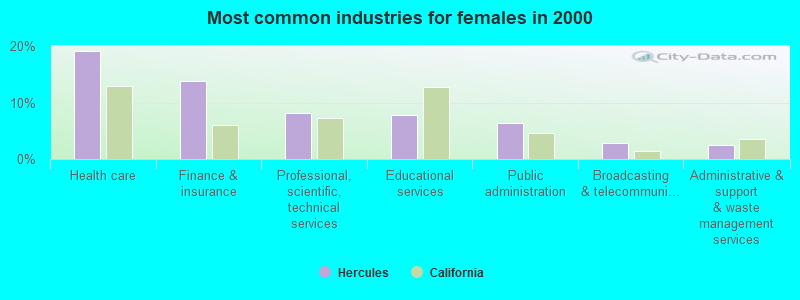
- Health care (19.1%)
- Finance & insurance (13.8%)
- Professional, scientific, technical services (8.2%)
- Educational services (7.9%)
- Public administration (6.4%)
- Broadcasting & telecommunications (2.9%)
- Administrative & support & waste management services (2.5%)
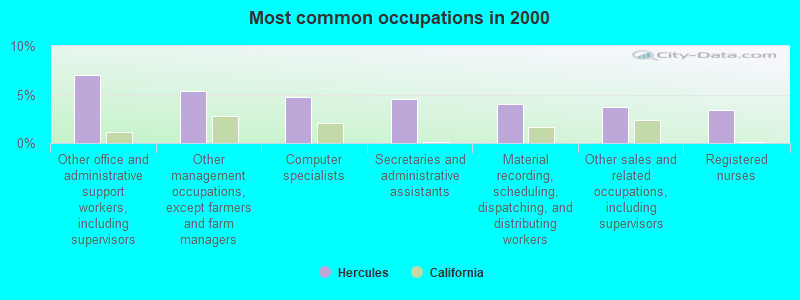
- Other office and administrative support workers, including supervisors (7.0%)
- Other management occupations, except farmers and farm managers (5.4%)
- Computer specialists (4.8%)
- Secretaries and administrative assistants (4.5%)
- Material recording, scheduling, dispatching, and distributing workers (4.0%)
- Other sales and related occupations, including supervisors (3.8%)
- Registered nurses (3.4%)
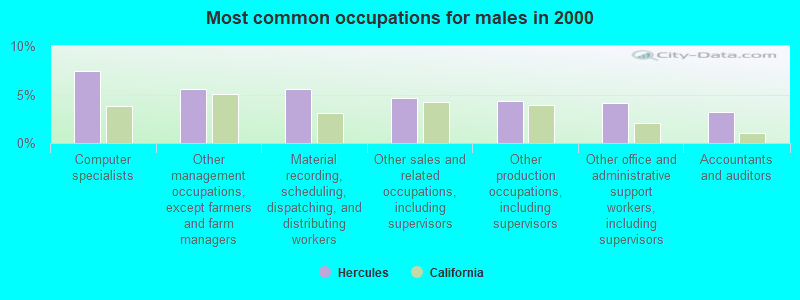
- Computer specialists (7.4%)
- Other management occupations, except farmers and farm managers (5.6%)
- Material recording, scheduling, dispatching, and distributing workers (5.6%)
- Other sales and related occupations, including supervisors (4.7%)
- Other production occupations, including supervisors (4.3%)
- Other office and administrative support workers, including supervisors (4.1%)
- Accountants and auditors (3.2%)

- Other office and administrative support workers, including supervisors (9.8%)
- Secretaries and administrative assistants (8.4%)
- Registered nurses (6.4%)
- Information and record clerks, except customer service representatives (5.2%)
- Other management occupations, except farmers and farm managers (5.2%)
- Cashiers (4.4%)
- Customer service representatives (3.3%)
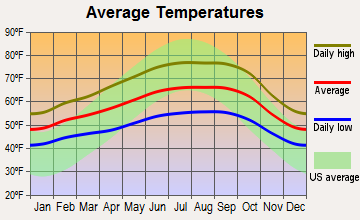
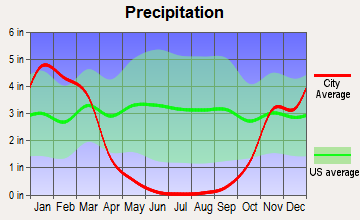
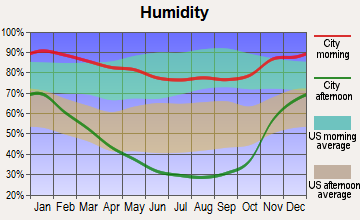
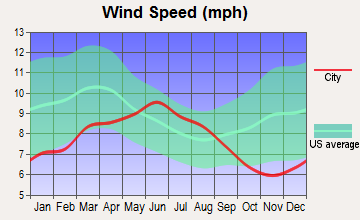
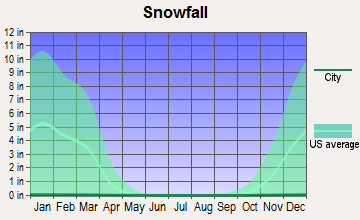
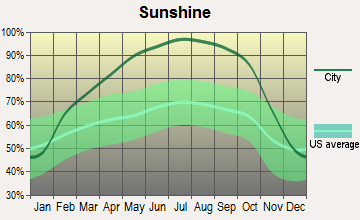
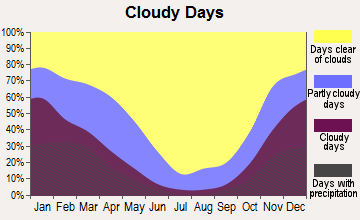
Average climate in Hercules, California
Based on data reported by over 4,000 weather stations
|
|

(lower is better)
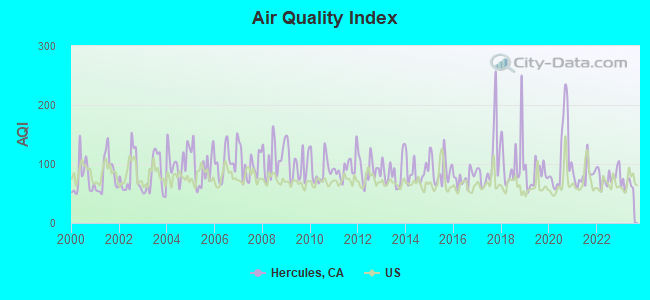
Air Quality Index (AQI) level in 2023 was 64.9. This is about average.
| City: | 64.9 |
| U.S.: | 72.6 |
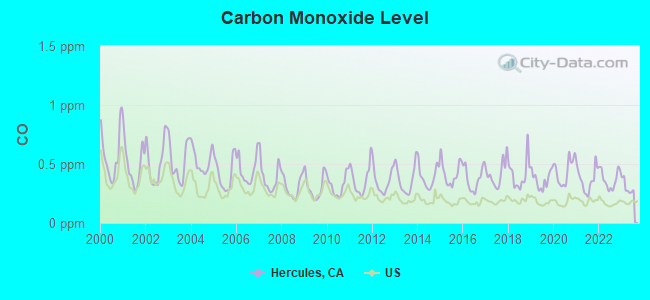
Carbon Monoxide (CO) [ppm] level in 2023 was 0.303. This is worse than average. Closest monitor was 5.4 miles away from the city center.
| City: | 0.303 |
| U.S.: | 0.251 |
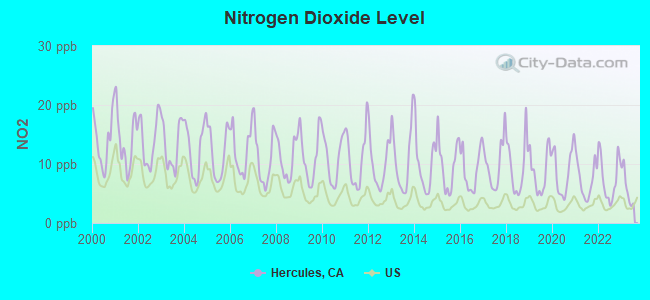
Nitrogen Dioxide (NO2) [ppb] level in 2023 was 5.96. This is about average. Closest monitor was 5.4 miles away from the city center.
| City: | 5.96 |
| U.S.: | 5.11 |
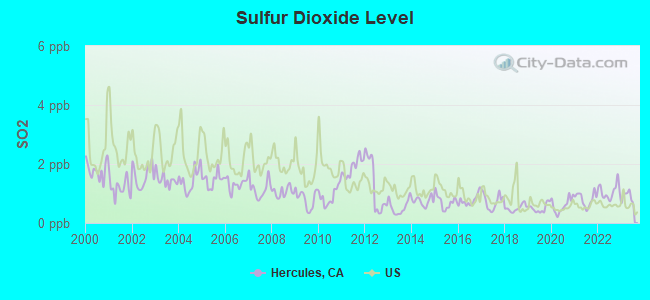
Sulfur Dioxide (SO2) [ppb] level in 2023 was 0.893. This is significantly better than average. Closest monitor was 5.4 miles away from the city center.
| City: | 0.893 |
| U.S.: | 1.515 |
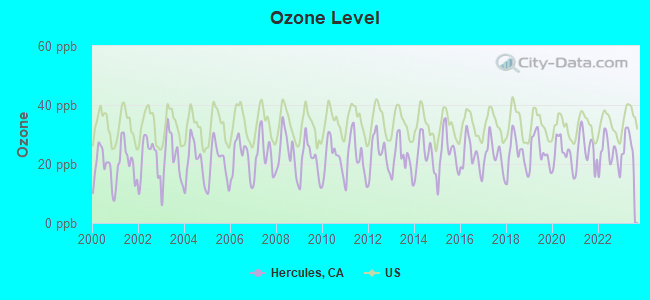
Ozone [ppb] level in 2023 was 27.0. This is better than average. Closest monitor was 5.4 miles away from the city center.
| City: | 27.0 |
| U.S.: | 33.3 |
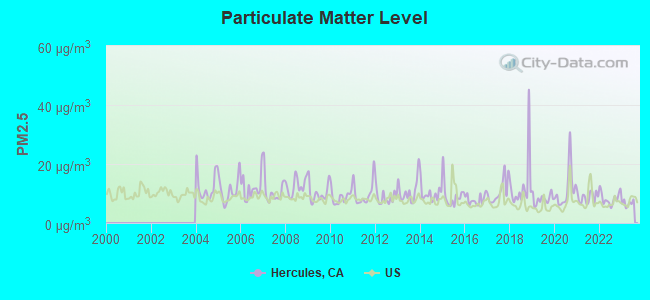
Particulate Matter (PM2.5) [µg/m3] level in 2023 was 6.68. This is better than average. Closest monitor was 6.3 miles away from the city center.
| City: | 6.68 |
| U.S.: | 8.11 |
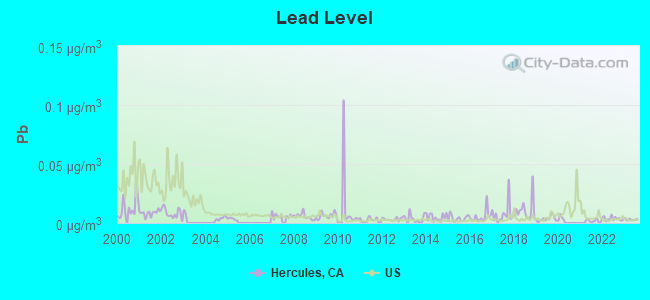
Lead (Pb) [µg/m3] level in 2023 was 0.00290. This is significantly better than average. Closest monitor was 5.4 miles away from the city center.
| City: | 0.00290 |
| U.S.: | 0.00931 |
Earthquake activity:
Hercules-area historical earthquake activity is significantly above California state average. It is 7569% greater than the overall U.S. average.On 4/18/1906 at 13:12:21, a magnitude 7.9 (7.9 UK, Class: Major, Intensity: VIII - XII) earthquake occurred 40.4 miles away from the city center, causing $524,000,000 total damage
On 10/18/1989 at 00:04:15, a magnitude 7.1 (6.5 MB, 7.1 MS, 6.9 MW, 7.0 ML) earthquake occurred 67.6 miles away from the city center, causing 62 deaths (62 shaking deaths) and 3757 injuries, causing $1,305,032,704 total damage
On 11/4/1927 at 13:51:53, a magnitude 7.5 (7.5 UK) earthquake occurred 224.5 miles away from Hercules center
On 7/21/1952 at 11:52:14, a magnitude 7.7 (7.7 UK) earthquake occurred 275.8 miles away from Hercules center, causing $50,000,000 total damage
On 1/31/1922 at 13:17:28, a magnitude 7.6 (7.6 UK) earthquake occurred 256.3 miles away from Hercules center
On 4/25/1992 at 18:06:04, a magnitude 7.2 (6.3 MB, 7.1 MS, 7.2 MW, 7.1 MW, Depth: 9.4 mi) earthquake occurred 188.8 miles away from Hercules center, causing $75,000,000 total damage
Magnitude types: body-wave magnitude (MB), local magnitude (ML), surface-wave magnitude (MS), moment magnitude (MW)
Natural disasters:
The number of natural disasters in Contra Costa County (18) is near the US average (15).Major Disasters (Presidential) Declared: 11
Emergencies Declared: 3
Causes of natural disasters: Floods: 13, Storms: 7, Winter Storms: 7, Mudslides: 5, Landslides: 4, Drought: 1, Earthquake: 1, Hurricane: 1, Tornado: 1, Wind: 1, Other: 1 (Note: some incidents may be assigned to more than one category).
Main business address for: BIO RAD LABORATORIES INC (LABORATORY ANALYTICAL INSTRUMENTS).
Hospitals and medical centers near Hercules:
- DOCTORS MEDICAL CENTER PINOLE CAMPUS (Hospital, about 3 miles away; PINOLE, CA)
- DOCTORS MED CTR PINOLE CAMPUS DP SNF (Nursing Home, about 3 miles away; PINOLE, CA)
- GREENRIDGE SENIOR CARE (Nursing Home, about 4 miles away; RICHMOND, CA)
- VALE HEALTH CARE CENTER (Nursing Home, about 6 miles away; SAN PABLO, CA)
- BAYCREST NURSING CENTER (Nursing Home, about 6 miles away; SAN PABLO, CA)
- SAN PABLO HEALTHCARE AND WELLNESS CENTER (Nursing Home, about 6 miles away; SAN PABLO, CA)
- SAN PABLO DIALYSIS CENTER (Dialysis Facility, about 6 miles away; SAN PABLO, CA)
Amtrak stations near Hercules:
- 7 miles: MARTINEZ (401 FERRY ST.) . Services: ticket office, fully wheelchair accessible, enclosed waiting area, public restrooms, public payphones, full-service food facilities, free short-term parking, free long-term parking, call for taxi service, public transit connection.
- 8 miles: RICHMOND (16TH ST. & MACDONALD AVE.) . Services: fully wheelchair accessible, enclosed waiting area, public restrooms, public payphones, free short-term parking, call for taxi service, public transit connection.
- 9 miles: VALLEJO-MARINE WORLD (VALLEJO, 1000 FAIRGROUNDS DR.) - Bus Station . Services: fully wheelchair accessible, public restrooms, public payphones, snack bar, free short-term parking, free long-term parking, call for taxi service.
Colleges/universities with over 2000 students nearest to Hercules:
- Contra Costa College (about 6 miles; San Pablo, CA; Full-time enrollment: 4,249)
- University of California-Berkeley (about 10 miles; Berkeley, CA; FT enrollment: 37,127)
- Berkeley City College (about 10 miles; Berkeley, CA; FT enrollment: 3,146)
- Diablo Valley College (about 11 miles; Pleasant Hill, CA; FT enrollment: 13,015)
- Saint Mary's College of California (about 15 miles; Moraga, CA; FT enrollment: 4,200)
- Laney College (about 15 miles; Oakland, CA; FT enrollment: 5,668)
- College of Alameda (about 16 miles; Alameda, CA; FT enrollment: 3,071)
Public high school in Hercules:
- HERCULES HIGH (Students: 748, Location: 1900 REFUGIO VALLEY RD., Grades: 9-12)
Public elementary/middle schools in Hercules:
- HERCULES MIDDLE (Students: 722, Location: 1900 REFUGIO VALLEY RD., Grades: 6-8)
- OHLONE ELEMENTARY (Students: 287, Location: 1616 PHEASANT DR., Grades: KG-5)
- HANNA RANCH ELEMENTARY (Students: 281, Location: 2480 REFUGIO VALLEY RD., Grades: KG-5)
- LUPINE HILLS ELEMENTARY (Students: 269, Location: 1919 LUPINE RD., Grades: KG-5)
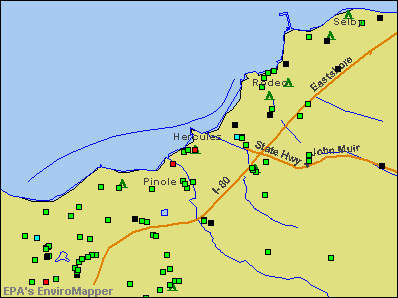
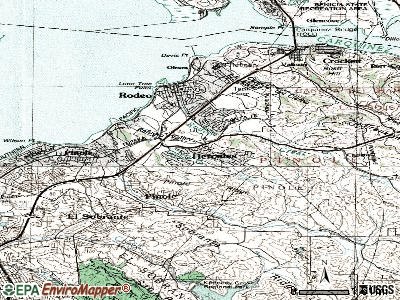
Points of interest:
Notable locations in Hercules: Franklin Canyon Golf Course (A), Hercules City Hall (B), Rodeo - Hercules Fire Protection District Station 76 Hercules (C). Display/hide their locations on the map
Main business address in Hercules: BIO RAD LABORATORIES INC (A). Display/hide its location on the map
Parks in Hercules include: Foxboro Park (1), Ohlone Park (2), Pinole-Hercules Little League Facility (3), Refugio Valley Park (4). Display/hide their locations on the map
Birthplace of: Charles Brown - College basketball player (Loyola Marymnt Lions).
| This city: | 3.0 people |
| California: | 2.9 people |
| This city: | 77.6% |
| Whole state: | 68.7% |
| This city: | 5.1% |
| Whole state: | 7.2% |
Likely homosexual households (counted as self-reported same-sex unmarried-partner households)
- Lesbian couples: 0.4% of all households
- Gay men: 0.4% of all households
17 people in residential treatment centers for adults in 2010
26 people in other noninstitutional group quarters in 2000
13 people in nursing homes in 2000
Banks with branches in Hercules (2011 data):
- U.S. Bank National Association: Hercules Lucky Branch at 1590 Sycamore Avenue, branch established on 2000/09/22. Info updated 2012/01/30: Bank assets: $330,470.8 mil, Deposits: $236,091.5 mil, headquarters in Cincinnati, OH, positive income, 3121 total offices, Holding Company: U.S. Bancorp
- Wells Fargo Bank, National Association: Hercules Branch at 1572 Sycamore Avenue, Suite D, branch established on 2000/06/05. Info updated 2011/04/05: Bank assets: $1,161,490.0 mil, Deposits: $905,653.0 mil, headquarters in Sioux Falls, SD, positive income, 6395 total offices, Holding Company: Wells Fargo & Company
- JPMorgan Chase Bank, National Association: Hercules Branch at 3600 San Pablo Avenue, Suite 2, branch established on 2004/05/03. Info updated 2011/11/10: Bank assets: $1,811,678.0 mil, Deposits: $1,190,738.0 mil, headquarters in Columbus, OH, positive income, International Specialization, 5577 total offices, Holding Company: Jpmorgan Chase & Co.
- Bank of America, National Association: Hercules Financial Center Branch at 1611-C Sycamore Avenue, branch established on 1986/09/22. Info updated 2009/11/18: Bank assets: $1,451,969.3 mil, Deposits: $1,077,176.8 mil, headquarters in Charlotte, NC, positive income, 5782 total offices, Holding Company: Bank Of America Corporation
For population 15 years and over in Hercules:
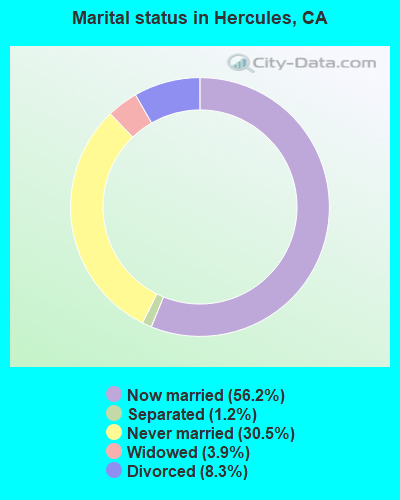
- Never married: 30.5%
- Now married: 56.2%
- Separated: 1.2%
- Widowed: 3.9%
- Divorced: 8.3%
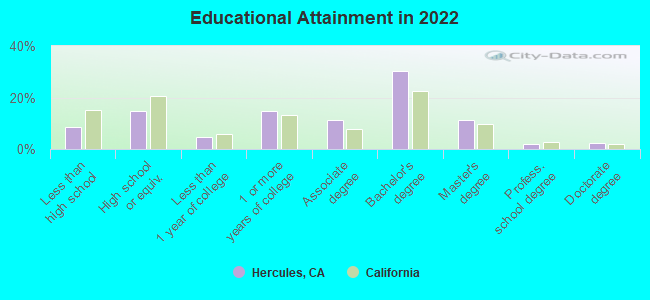
For population 25 years and over in Hercules:
- High school or higher: 91.9%
- Bachelor's degree or higher: 45.3%
- Graduate or professional degree: 14.9%
- Unemployed: 3.2%
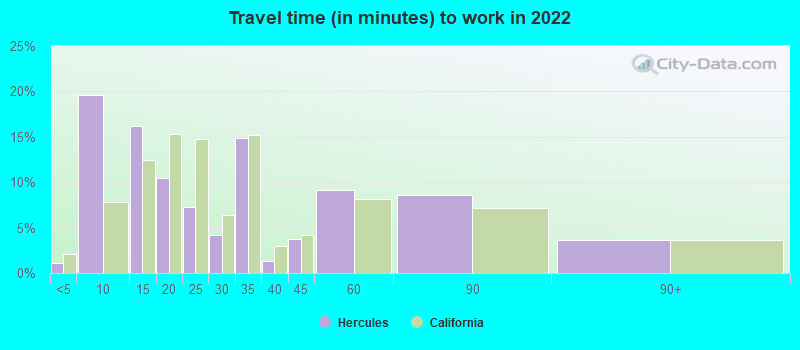
- Mean travel time to work (commute): 30.3 minutes
| Here: | 12.7 |
| California average: | 15.5 |


Graphs represent county-level data. Detailed 2008 Election Results
Neighborhoods in Hercules:
(Hercules, California Neighborhood Map)- Bay Pointe neighborhood
- Bayfront Boulevard (Bayfront) neighborhood
- Belle Terre neighborhood
- Bravo (Bravo Complex) neighborhood
- Caprice neighborhood
- Central neighborhood
- Central Waterfront (Promenade) neighborhood
- Chelsea By Bay (Chelsea By The Bay) neighborhood
- Country Run neighborhood
- Coventry neighborhood
- Crescent Heights neighborhood
- Forest Park neighborhood
- Foxboro neighborhood
- Foxboro Downs (Fox Downs) neighborhood
- Foxboro Heights (Fox Heights) neighborhood
- Foxboro Village neighborhood
- Franklin Canyon neighborhood
- Glenwood neighborhood
- Hawthorne neighborhood
- Hercules By Bay (Hercules By The Bay) neighborhood
- Hercules Point (The Point) neighborhood
- Heritage By The Bay (Heritage) neighborhood
- Herpoco neighborhood
- Hill Town neighborhood
- Historic Hercules (Historic Town Center) neighborhood
- KB (KB) neighborhood
- Marsala Court (Marsala) neighborhood
- New Pacific (Victoria By The Bay) neighborhood
- North Wildwood neighborhood
- Northshore Business Park (Northshore) neighborhood
- Oceana neighborhood
- Olympian Hills (Olympia Hills) neighborhood
- Refugio (Baywood) neighborhood
- Refugio Valley neighborhood
- Seagate At Bayside (Seagate) neighborhood
- South WIldwood neighborhood
- The Astronauts neighborhood
- The Birds neighborhood
- The Flowers neighborhood
- The Islands (Mandalay) neighborhood
- The Stones neighborhood
- The Tides neighborhood
- The Trees neighborhood
- The Village neighborhood
- The Waterfront neighborhood
- Transit Village neighborhood
- Village Park neighborhood
- Wildwood neighborhood
Religion statistics for Hercules, CA (based on Contra Costa County data)


| Religion | Adherents | Congregations |
|---|---|---|
| Catholic | 228,400 | 34 |
| Evangelical Protestant | 81,120 | 352 |
| Other | 48,553 | 123 |
| Mainline Protestant | 32,693 | 101 |
| Black Protestant | 10,395 | 34 |
| Orthodox | 2,435 | 8 |
| None | 645,429 | - |
Food Environment Statistics:
| Contra Costa County: | 1.78 / 10,000 pop. |
| State: | 2.14 / 10,000 pop. |
| Here: | 0.05 / 10,000 pop. |
| California: | 0.04 / 10,000 pop. |
| This county: | 0.51 / 10,000 pop. |
| California: | 0.62 / 10,000 pop. |
| This county: | 1.75 / 10,000 pop. |
| State: | 1.49 / 10,000 pop. |
| Here: | 6.73 / 10,000 pop. |
| California: | 7.42 / 10,000 pop. |
| Here: | 7.1% |
| State: | 7.3% |
| Contra Costa County: | 22.2% |
| California: | 21.3% |
| This county: | 16.8% |
| California: | 17.9% |
Health and Nutrition:
| Hercules: | 54.5% |
| State: | 49.4% |
| Hercules: | 51.1% |
| California: | 48.0% |
| This city: | 27.2 |
| California: | 28.1 |
| Here: | 16.1% |
| State: | 20.2% |
| Hercules: | 17.5% |
| California: | 11.2% |
| Hercules: | 6.7 |
| State: | 6.8 |
| Here: | 28.4% |
| State: | 31.5% |
| Here: | 58.7% |
| California: | 56.4% |
| Here: | 83.5% |
| State: | 80.9% |
More about Health and Nutrition of Hercules, CA Residents
| Local government employment and payroll (March 2022) | |||||
| Function | Full-time employees | Monthly full-time payroll | Average yearly full-time wage | Part-time employees | Monthly part-time payroll |
|---|---|---|---|---|---|
| Police Protection - Officers | 24 | $262,449 | $131,225 | 0 | $0 |
| Streets and Highways | 14 | $132,276 | $113,379 | 0 | $0 |
| Other Government Administration | 9 | $58,162 | $77,549 | 2 | $3,627 |
| Financial Administration | 6 | $57,021 | $114,042 | 0 | $0 |
| Police - Other | 4 | $24,178 | $72,534 | 3 | $6,338 |
| Parks and Recreation | 3 | $33,123 | $132,492 | 43 | $97,905 |
| Housing and Community Development (Local) | 1 | $7,588 | $91,056 | 0 | $0 |
| Totals for Government | 61 | $574,796 | $113,075 | 48 | $107,870 |
Hercules government finances - Expenditure in 2017 (per resident):
- Construction - Housing and Community Development: $3,221,000 ($124.27)
Central Staff Services: $814,000 ($31.40)
- Current Operations - Police Protection: $6,022,000 ($232.33)
Central Staff Services: $3,564,000 ($137.50)
Regular Highways: $3,468,000 ($133.80)
Financial Administration: $2,386,000 ($92.05)
Sewerage: $2,153,000 ($83.06)
Parks and Recreation: $1,883,000 ($72.65)
Protective Inspection and Regulation - Other: $236,000 ($9.10)
- General - Interest on Debt: $3,963,000 ($152.89)
- Other Capital Outlay - General - Other: $1,244,000 ($47.99)
Sewerage: $1,023,000 ($39.47)
General Public Building: $550,000 ($21.22)
Electric Utilities: $318,000 ($12.27)
Hercules government finances - Revenue in 2017 (per resident):
- Charges - Sewerage: $5,798,000 ($223.69)
Regular Highways: $2,295,000 ($88.54)
Parks and Recreation: $1,737,000 ($67.01)
Other: $1,129,000 ($43.56)
- Federal Intergovernmental - Other: $4,249,000 ($163.93)
- Local Intergovernmental - Other: $2,535,000 ($97.80)
- Miscellaneous - General Revenue - Other: $1,487,000 ($57.37)
Rents: $960,000 ($37.04)
Interest Earnings: $94,000 ($3.63)
Fines and Forfeits: $48,000 ($1.85)
- State Intergovernmental - Other: $4,775,000 ($184.22)
Highways: $2,940,000 ($113.43)
General Local Government Support: $13,000 ($0.50)
- Tax - Property: $15,495,000 ($597.80)
Public Utilities Sales: $4,455,000 ($171.88)
General Sales and Gross Receipts: $2,646,000 ($102.08)
Other License: $362,000 ($13.97)
Documentary and Stock Transfer: $136,000 ($5.25)
Occupation and Business License - Other: $131,000 ($5.05)
Other Selective Sales: $8,000 ($0.31)
Hercules government finances - Debt in 2017 (per resident):
- Long Term Debt - Outstanding Unspecified Public Purpose: $147,908,000 ($5706.33)
Beginning Outstanding - Unspecified Public Purpose: $145,055,000 ($5596.26)
Issue, Unspecified Public Purpose: $6,787,000 ($261.84)
Outstanding Nonguaranteed - Industrial Revenue: $5,115,000 ($197.34)
Beginning Outstanding - Public Debt for Private Purpose: $5,115,000 ($197.34)
Retired Unspecified Public Purpose: $3,934,000 ($151.77)
Hercules government finances - Cash and Securities in 2017 (per resident):
- Other Funds - Cash and Securities: $40,869,000 ($1576.74)
- Sinking Funds - Cash and Securities: $28,591,000 ($1103.05)
6.37% of this county's 2021 resident taxpayers lived in other counties in 2020 ($134,084 average adjusted gross income)
| Here: | 6.37% |
| California average: | 5.19% |
0.01% of residents moved from foreign countries ($98 average AGI)
Contra Costa County: 0.01% California average: 0.03%
Top counties from which taxpayers relocated into this county between 2020 and 2021:
| from Alameda County, CA | |
| from San Francisco County, CA | |
| from Santa Clara County, CA |
7.09% of this county's 2020 resident taxpayers moved to other counties in 2021 ($123,334 average adjusted gross income)
| Here: | 7.09% |
| California average: | 6.14% |
0.01% of residents moved to foreign countries ($92 average AGI)
Contra Costa County: 0.01% California average: 0.02%
Top counties to which taxpayers relocated from this county between 2020 and 2021:
| to Alameda County, CA | |
| to Solano County, CA | |
| to San Francisco County, CA |
| Businesses in Hercules, CA | ||||
| Name | Count | Name | Count | |
|---|---|---|---|---|
| Burger King | 1 | RadioShack | 1 | |
| FedEx | 1 | Rite Aid | 1 | |
| GNC | 1 | Starbucks | 2 | |
| Home Depot | 1 | Subway | 1 | |
| Jack In The Box | 1 | T-Mobile | 1 | |
| Jones New York | 1 | Taco Bell | 1 | |
| McDonald's | 1 | UPS | 2 | |
Strongest AM radio stations in Hercules:
- KTRB (860 AM; 50 kW; MODESTO, CA; Owner: PAPPAS RADIO OF CALIFORNIA, A CALIFORNIA LIMITED PARTNERSHIP)
- KNEW (910 AM; 20 kW; OAKLAND, CA; Owner: AMFM RADIO LICENSES, L.L.C.)
- KCBS (740 AM; 50 kW; SAN FRANCISCO, CA; Owner: INFINITY BROADCASTING OPERATIONS, INC.)
- KIQI (1010 AM; 35 kW; SAN FRANCISCO, CA; Owner: RADIO UNICA OF SAN FRANCISCO LICENSE CORP.)
- KDYA (1190 AM; 10 kW; VALLEJO, CA; Owner: BAYBRIDGE COMMUNICATIONS, L.L.C.)
- KDIA (1640 AM; 10 kW; VALLEJO, CA; Owner: BAYBRIDGE COMMUNICATIONS, L.L.C.)
- KTCT (1050 AM; 50 kW; SAN MATEO, CA; Owner: SUSQUEHANNA RADIO CORP.)
- KNBR (680 AM; 50 kW; SAN FRANCISCO, CA; Owner: KNBR LICO, INC.)
- KFAX (1100 AM; 50 kW; SAN FRANCISCO, CA; Owner: GOLDEN GATE BROADCASTING CO, INC.)
- KFRC (610 AM; 5 kW; SAN FRANCISCO, CA; Owner: INFINITY BROADCASTING CORPORATION OF LOS ANGELES)
- KGO (810 AM; 50 kW; SAN FRANCISCO, CA; Owner: KGO-AM RADIO, INC.)
- KABL (960 AM; 5 kW; OAKLAND, CA; Owner: AMFM RADIO LICENSES, L.L.C.)
- KMZT (1510 AM; 8 kW; SAN RAFAEL, CA; Owner: MOUNT WILSON FM BROADCASTERS, INC.)
Strongest FM radio stations in Hercules:
- K249DJ (97.7 FM; SAN PABLO, CA; Owner: EL CERRITO HIGH SCHOOL)
- KKSF-FM1 (103.7 FM; PLEASANTON, ETC., CA; Owner: AMFM RADIO LICENSES, L.L.C.)
- KSFB-FM (100.7 FM; SAN RAFAEL, CA; Owner: GOLDEN GATE BROADCASTING COMPANY, INC.)
- KBLX-FM2 (102.9 FM; PLEASANTON, CA; Owner: ICBC BROADCAST HOLDINGS -CA, INC.)
- KSOL-FM3 (98.9 FM; PLEASANTON, CA; Owner: TMS LICENSE CALIFORNIA, INC)
- KFRC-FM3 (99.7 FM; WALNUT CREEK, CA; Owner: INFINITY KFRC-FM, INC.)
- KZBR-FM1 (95.7 FM; WALNUT CREEK, CA; Owner: BONNEVILLE HOLDING COMPANY)
- KLLC (97.3 FM; SAN FRANCISCO, CA; Owner: INFINITY BROADCASTING OPERATIONS, INC.)
- KDFC-FM1 (102.1 FM; LAFAYETTE, CA; Owner: BONNEVILLE HOLDING COMPANY)
- KOIT-FM2 (96.5 FM; MARTINEZ, ETC., CA; Owner: BONNEVILLE HOLDING CO. C/O KOIT(FM))
- KIOI-FM1 (101.3 FM; WALNUT CREEK, CA; Owner: AMFM RADIO LICENSES, L.L.C.)
- KISQ-FM3 (98.1 FM; CONCORD, CA; Owner: AMFM RADIO LICENSES, L.L.C.)
- KMEL-FM1 (106.1 FM; CONCORD, CA; Owner: AMFM RADIO LICENSES, L.L.C.)
- KALX (90.7 FM; BERKELEY, CA; Owner: UNIVERSITY OF CALIFORNIA)
- KFJO (92.1 FM; WALNUT CREEK, CA; Owner: CHASE RADIO PROPERTIES, L.L.C.)
- KDFC-FM (102.1 FM; SAN FRANCISCO, CA; Owner: BONNEVILLE HOLDING COMPANY)
- KOIT-FM (96.5 FM; SAN FRANCISCO, CA; Owner: BONNEVILLE HOLDING COMPANY)
- KKSF (103.7 FM; SAN FRANCISCO, CA; Owner: AMFM RADIO LICENSES, L.L.C.)
- KFOG (104.5 FM; SAN FRANCISCO, CA; Owner: KFFG LICO, INC)
- KSOL (98.9 FM; SAN FRANCISCO, CA; Owner: TMS LICENSE CALIFORNIA, INC)
TV broadcast stations around Hercules:
- KQED (Channel 9; SAN FRANCISCO, CA; Owner: KQED, INC.)
- KGO-TV (Channel 7; SAN FRANCISCO, CA; Owner: KGO TELEVISION, INC.)
- KPIX-TV (Channel 5; SAN FRANCISCO, CA; Owner: CBS BROADCASTING INC.)
- KTVU (Channel 2; OAKLAND, CA; Owner: KTVU PARTNERSHIP)
- KRON-TV (Channel 4; SAN FRANCISCO, CA; Owner: YOUNG BROADCASTING OF SAN FRANCISCO, INC.)
- KMTP-TV (Channel 32; SAN FRANCISCO, CA; Owner: MINORITY TELEVISION PROJECT)
- KBHK-TV (Channel 44; SAN FRANCISCO, CA; Owner: VIACOM TELEVISION STATIONS GROUP OF SAN FRANCISCO INC.)
- KBWB (Channel 20; SAN FRANCISCO, CA; Owner: KBWB LICENSE, INC.)
- KFSF (Channel 66; VALLEJO, CA; Owner: TELEFUTURA SAN FRANCISCO LLC)
- KTNC-TV (Channel 42; CONCORD, CA; Owner: KTNC LICENSE, LLC)
- KCNS (Channel 38; SAN FRANCISCO, CA; Owner: WRAY, INC.)
- KSPX (Channel 29; SACRAMENTO, CA; Owner: PAXSON SACRAMENTO LICENSE, INC.)
- KOVR (Channel 13; STOCKTON, CA; Owner: SCI - SACRAMENTO LICENSEE, LLC)
- KXTV (Channel 10; SACRAMENTO, CA; Owner: KXTV, INC.)
- KCRA-TV (Channel 3; SACRAMENTO, CA; Owner: KCRA HEARST-ARGYLE TELEVISION, INC.)
- KTXL (Channel 40; SACRAMENTO, CA; Owner: CHANNEL 40, INC.)
- KUVS (Channel 19; MODESTO, CA; Owner: KUVS LICENSE PARTNERSHIP, G.P.)
- KQCA (Channel 58; STOCKTON, CA; Owner: KCRA HEARST-ARGYLE TELEVISION, INC.)
- KVIE (Channel 6; SACRAMENTO, CA; Owner: KVIE, INC.)
- KMAX-TV (Channel 31; SACRAMENTO, CA; Owner: UPN STATIONS GROUP INC.)
- KCSM-TV (Channel 60; SAN MATEO, CA; Owner: SAN MATEO COUNTY COMMUNITY COLLEGE DISTRICT)
- National Bridge Inventory (NBI) Statistics
- 27Number of bridges
- 446ft / 136mTotal length
- 908,270Total average daily traffic
- 42,261Total average daily truck traffic
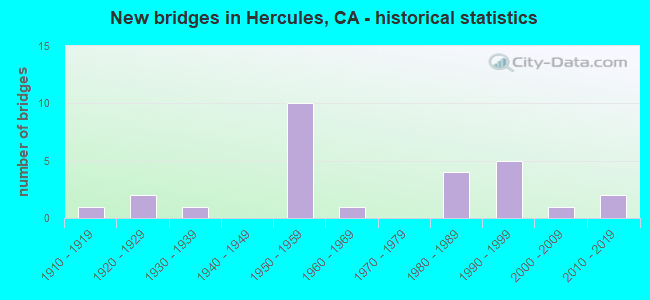
- New bridges - historical statistics
- 11910-1919
- 21920-1929
- 11930-1939
- 101950-1959
- 11960-1969
- 41980-1989
- 51990-1999
- 12000-2009
- 22010-2019
FCC Registered Antenna Towers:
13 (See the full list of FCC Registered Antenna Towers in Hercules)FCC Registered Broadcast Land Mobile Towers:
8 (See the full list of FCC Registered Broadcast Land Mobile Towers in Hercules, CA)FCC Registered Microwave Towers:
10 (See the full list of FCC Registered Microwave Towers in this town)FCC Registered Amateur Radio Licenses:
143 (See the full list of FCC Registered Amateur Radio Licenses in Hercules)FAA Registered Aircraft:
5- Aircraft: PIPER PA-28-151 (Category: Land, Seats: 4, Weight: Up to 12,499 Pounds, Speed: 80 mph), Engine: LYCOMING 0-320 SERIES (180 HP) (Reciprocating)
N-Number: 7036F, N7036F, N-7036F, Serial Number: 28-7715192, Year manufactured: 1976, Certificate Issue Date: 02/19/2016
Registrant (Individual): Vigne Henry A La, 142 Brenner, Hercules, CA 94547 - Aircraft: PIPER PA-32-300 (Category: Land, Seats: 6, Weight: Up to 12,499 Pounds, Speed: 126 mph), Engine: LYCOMING TI0-540 SER (310 HP) (Reciprocating)
N-Number: 8922N, N8922N, N-8922N, Serial Number: 32-40717, Year manufactured: 1969, Airworthiness Date: 05/22/1969, Certificate Issue Date: 01/15/1997
Registrant (Individual): Malcolm M Kew, 3 Pinnacle Ct, Hercules, CA 94547 - Aircraft: SOCATA TB-20 TRINIDAD (Category: Land, Seats: 4, Weight: Up to 12,499 Pounds), Engine: LYCOMING IO-540 SER (300 HP) (Reciprocating)
N-Number: 909RD, N909RD, N-909RD, Serial Number: 1038, Year manufactured: 1990, Airworthiness Date: 05/08/1990, Certificate Issue Date: 03/10/2016
Registrant (Corporation): Pontix Consulting Inc, 345 Shipwatch Ln, Hercules, CA 94547 - Aircraft: DJI PHANTOM 3 PROFESSION (Category: Land, Engines: 4), Engine: Electric
N-Number: 603KF, N603KF, N-603KF, Serial Number: P77DCE29010397, Certificate Issue Date: 11/03/2015
Registrant (Individual): Jeffrey R Foster, 1090 Avocet Dr, Hercules, CA 94547
Deregistered: Cancel Date: 03/14/2019 - Aircraft: DJI INNOVATIONS INSPIRE 1 (Category: Land, Engines: 4), Engine: Electric
N-Number: 614BF, N614BF, N-614BF, Serial Number: W13DCB16020371, Certificate Issue Date: 11/03/2015
Registrant (Individual): Jeffrey R Foster, 1090 Avocet Dr, Hercules, CA 94547
Deregistered: Cancel Date: 03/08/2019
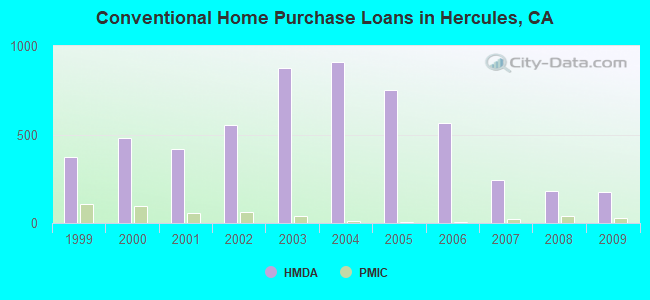
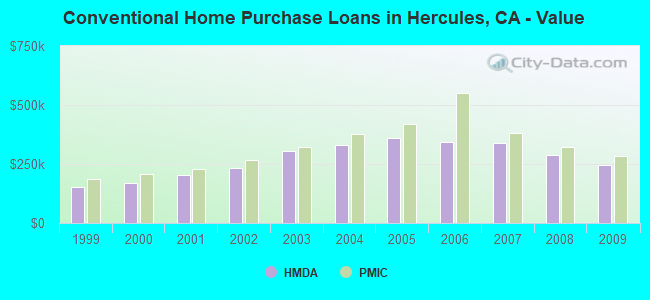
| Home Mortgage Disclosure Act Aggregated Statistics For Year 2009 (Based on 2 full and 1 partial tracts) | ||||||||||
| A) FHA, FSA/RHS & VA Home Purchase Loans | B) Conventional Home Purchase Loans | C) Refinancings | D) Home Improvement Loans | F) Non-occupant Loans on < 5 Family Dwellings (A B C & D) | ||||||
|---|---|---|---|---|---|---|---|---|---|---|
| Number | Average Value | Number | Average Value | Number | Average Value | Number | Average Value | Number | Average Value | |
| LOANS ORIGINATED | 107 | $278,131 | 174 | $245,293 | 369 | $247,264 | 14 | $155,547 | 38 | $206,285 |
| APPLICATIONS APPROVED, NOT ACCEPTED | 13 | $279,686 | 20 | $254,035 | 42 | $267,198 | 2 | $136,805 | 7 | $190,386 |
| APPLICATIONS DENIED | 28 | $294,602 | 51 | $238,450 | 176 | $320,809 | 17 | $180,275 | 25 | $224,926 |
| APPLICATIONS WITHDRAWN | 18 | $276,021 | 23 | $241,409 | 85 | $295,603 | 5 | $118,916 | 12 | $167,917 |
| FILES CLOSED FOR INCOMPLETENESS | 6 | $277,287 | 6 | $254,195 | 33 | $339,246 | 3 | $101,600 | 3 | $199,510 |
Detailed HMDA statistics for the following Tracts: 3591.01 , 3592.03, 3592.04
| Private Mortgage Insurance Companies Aggregated Statistics For Year 2009 (Based on 2 full and 1 partial tracts) | ||||||
| A) Conventional Home Purchase Loans | B) Refinancings | C) Non-occupant Loans on < 5 Family Dwellings (A & B) | ||||
|---|---|---|---|---|---|---|
| Number | Average Value | Number | Average Value | Number | Average Value | |
| LOANS ORIGINATED | 29 | $282,810 | 4 | $293,362 | 0 | $0 |
| APPLICATIONS APPROVED, NOT ACCEPTED | 11 | $340,578 | 4 | $318,380 | 1 | $206,400 |
| APPLICATIONS DENIED | 7 | $255,849 | 2 | $302,155 | 0 | $0 |
| APPLICATIONS WITHDRAWN | 9 | $210,991 | 0 | $0 | 0 | $0 |
| FILES CLOSED FOR INCOMPLETENESS | 1 | $243,270 | 0 | $0 | 0 | $0 |
Detailed PMIC statistics for the following Tracts: 3591.01 , 3592.03, 3592.04
2002 - 2018 National Fire Incident Reporting System (NFIRS) incidents
- Fire incident types reported to NFIRS in Hercules, CA
- 25842.4%Outside Fires
- 23438.4%Structure Fires
- 7512.3%Mobile Property/Vehicle Fires
- 426.9%Other
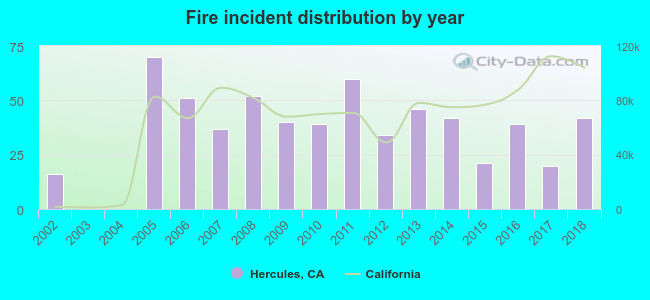 According to the data from the years 2002 - 2018 the average number of fire incidents per year is 36. The highest number of reported fires - 70 took place in 2005, and the least - 0 in 2003. The data has a rising trend.
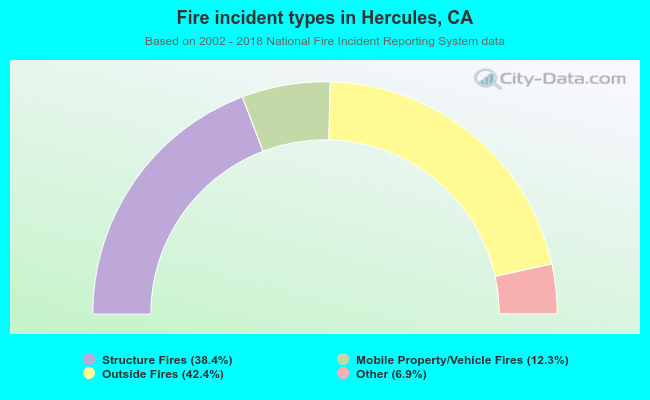 When looking into fire subcategories, the most reports belonged to: Outside Fires (42.4%), and Structure Fires (38.4%).
| Most common first names in Hercules, CA among deceased individuals | ||
| Name | Count | Lived (average) |
|---|---|---|
| George | 16 | 68.9 years |
| Mary | 15 | 82.7 years |
| John | 15 | 68.2 years |
| James | 14 | 62.4 years |
| William | 11 | 71.3 years |
| Maria | 11 | 79.1 years |
| Robert | 10 | 65.7 years |
| Richard | 10 | 70.4 years |
| Charles | 9 | 75.1 years |
| Joseph | 8 | 75.5 years |
| Most common last names in Hercules, CA among deceased individuals | ||
| Last name | Count | Lived (average) |
|---|---|---|
| Lee | 12 | 73.8 years |
| Wong | 10 | 75.2 years |
| Johnson | 9 | 68.9 years |
| Chan | 8 | 82.8 years |
| Taylor | 7 | 72.9 years |
| Smith | 7 | 77.9 years |
| Harris | 6 | 76.3 years |
| Williams | 6 | 77.8 years |
| Davis | 5 | 59.4 years |
| Stewart | 5 | 69.4 years |
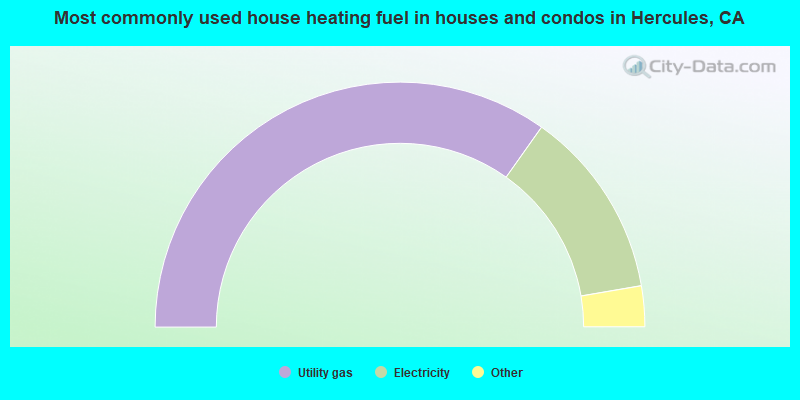
- 69.7%Utility gas
- 25.0%Electricity
- 2.7%Bottled, tank, or LP gas
- 2.0%Solar energy
- 0.6%No fuel used
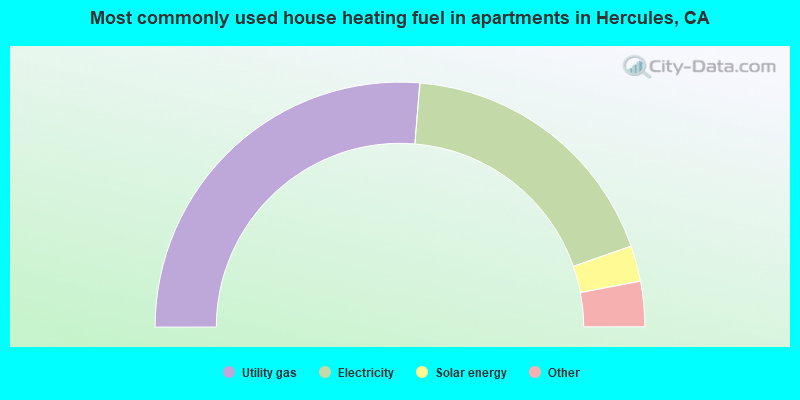
- 52.6%Utility gas
- 36.7%Electricity
- 4.7%Solar energy
- 3.3%No fuel used
- 2.2%Wood
- 0.5%Bottled, tank, or LP gas
Hercules compared to California state average:
- Unemployed percentage significantly below state average.
- Black race population percentage significantly above state average.
- Hispanic race population percentage below state average.
- Median age above state average.
- Foreign-born population percentage above state average.
- Renting percentage below state average.
- Length of stay since moving in significantly above state average.
- Number of rooms per house above state average.
- House age below state average.
- Percentage of population with a bachelor's degree or higher above state average.
Hercules on our top lists:
- #32 on the list of "Top 101 cities with the most residents born in Philippines (population 500+)"
- #37 on the list of "Top 100 most racially diverse cities (pop. 5,000+)"
- #45 on the list of "Top 101 cities with the most residents born in South Eastern Asia (population 500+)"
- #53 on the list of "Top 101 cities with the most residents born in Hong Kong (population 500+)"
- #71 on the list of "Top 101 cities with the lowest number of police officers per 1000 residents (population 5,000+)"
- #87 on the list of "Top 101 cities with the most residents born in Asia (population 500+)"
- #94 on the list of "Top 100 cities with longest commuting times (pop. 5,000+)"
- #10 on the list of "Top 101 counties with the largest increase in the number of infant deaths per 1000 residents 2000-2006 to 2007-2013 (pop. 50,000+)"
- #15 on the list of "Top 101 counties with the lowest Sulfur Oxides Annual air pollution readings in 2012 (µg/m3)"
- #17 on the list of "Top 101 counties with the highest Nitrogen Dioxide air pollution readings in 2012 (ppm)"
- #31 on the list of "Top 101 counties with the highest percentage of residents that drank alcohol in the past 30 days"
- #34 on the list of "Top 101 counties with the highest surface withdrawal of fresh water for public supply (pop. 50,000+)"

|
|
Total of 471 patent applications in 2008-2024.