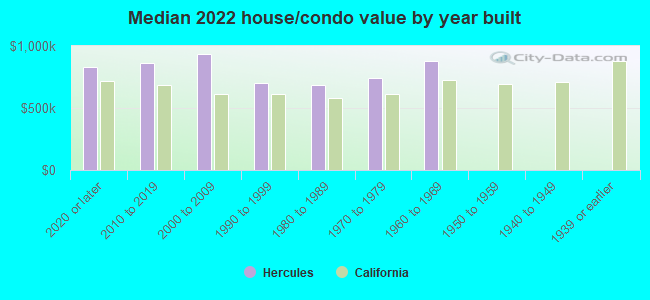
Hercules, CA (California) Houses and Residents
| Hercules: | $758,798 |
| California: | $715,900 |
Total population: 25,086 (Urban population: 19,299, Rural population: 0)
Houses: 9,432 (9,117 occupied: 7,310 owner occupied, 1,826 renter occupied)
| % of renters here: | 20% |
| State: | 44% |
Housing density: 1,456 houses/condos per square mile
Median price asked for vacant for-sale houses and condos in 2022: $213,802.
Median contract rent in 2022: over $2,000 (lower quartile is $1,792, upper quartile is over $2,000)
Median rent asked for vacant for-rent units in 2022: $3,730
Median gross rent in Hercules, CA in 2022: over $2,000
Housing units in Hercules with a mortgage: 5,927 (557 second mortgage, 35 home equity loan, 369 both second mortgage and home equity loan)
Houses without a mortgage: 81
Median household income for houses/condos with a mortgage: $140,283
Median household income for apartments without a mortgage: $98,890
Median monthly housing costs: $2,703
Compare current foreclosures in Hercules, CA:
| Photo | Address | Area | Beds / Baths | Price | Details |
|---|---|---|---|---|---|

|
#1
Catalina Dr
Hercules, CA 94547
|
2,518 sq. feet
|
3 baths 5 beds |
$868,400
|
show details |

|
#2
S Wildwood
Hercules, CA 94547
|
1,413 sq. feet
|
2 baths 3 beds |
show details | |

|
#3
Overlook Ter
Hercules, CA 94547
|
1,929 sq. feet
|
3 baths 4 beds |
show details | |

|
#4
Chelsea
Hercules, CA 94547
|
937 sq. feet
|
2 baths 2 beds |
show details | |

|
#5
S Wildwood
Hercules, CA 94547
|
1,413 sq. feet
|
2 baths 3 beds |
show details | |

|
#6
Spinel Ct
Hercules, CA 94547
|
2,346 sq. feet
|
3 baths 4 beds |
show details | |

|
#7
Eagle Ct
Hercules, CA 94547
|
1,963 sq. feet
|
2 baths 4 beds |
show details | |

|
#8
Zircon Ct
Hercules, CA 94547
|
1,945 sq. feet
|
3 baths 4 beds |
show details | |

|
#9
Violet Rd
Hercules, CA 94547
|
3,496 sq. feet
|
3 baths 5 beds |
show details | |

|
#10
Lantern Bay
Hercules, CA 94547
|
2,730 sq. feet
|
3 baths 5 beds |
show details |
| Photo | Address | Area | Beds / Baths | Price | Details |
|---|---|---|---|---|---|

|
#11
Carson St
Hercules, CA 94547
|
2,171 sq. feet
|
3 baths 4 beds |
show details | |

|
#12
Falcon Way
Hercules, CA 94547
|
1,720 sq. feet
|
2 baths 4 beds |
show details | |

|
#13
N Wildwood
Hercules, CA 94547
|
1,707 sq. feet
|
2 baths 3 beds |
show details | |

|
#14
Brenner
Hercules, CA 94547
|
1,538 sq. feet
|
3 baths 4 beds |
show details | |

|
#15
Regatta Pt
Hercules, CA 94547
|
3,983 sq. feet
|
4 baths 5 beds |
show details | |

|
#16
Grenadine Way
Hercules, CA 94547
|
2,363 sq. feet
|
3 baths 5 beds |
show details | |

|
#17
Waverly Cir
Hercules, CA 94547
|
2,400 sq. feet
|
3 baths 4 beds |
show details | |

|
#18
Watermark Ter
Hercules, CA 94547
|
3,389 sq. feet
|
4 baths 5 beds |
show details | |

|
#19
Lewis St
Hercules, CA 94547
|
1,680 sq. feet
|
2 baths 3 beds |
show details | |

|
#20
Dutch Elm Dr
Hercules, CA 94547
|
2,411 sq. feet
|
3 baths 4 beds |
show details |
| Photo | Address | Area | Beds / Baths | Price | Details |
|---|---|---|---|---|---|

|
#21
Promenade St
Hercules, CA 94547
|
3,236 sq. feet
|
3 baths 5 beds |
show details | |

|
#22
N Wildwood
Hercules, CA 94547
|
1,413 sq. feet
|
2 baths 3 beds |
show details | |

|
#23
Mesa Ct
Hercules, CA 94547
|
1,434 sq. feet
|
2 baths 3 beds |
show details | |

|
#24
N Wildwood
Hercules, CA 94547
|
1,413 sq. feet
|
2 baths 3 beds |
show details | |

|
#25
Turquoise Dr
Hercules, CA 94547
|
4,815 sq. feet
|
5 baths 6 beds |
show details | |

|
#26
Bacchus Apt 2
Hercules, CA 94547
|
1,022 sq. feet
|
1 baths 2 beds |
show details | |

|
#27
Turquoise Dr
Hercules, CA 94547
|
4,634 sq. feet
|
3 baths 4 beds |
show details | |

|
#28
Turquoise Dr
Hercules, CA 94547
|
4,634 sq. feet
|
3 baths 4 beds |
show details | |

|
#29
Vierra Way
Hercules, CA 94547
|
1,522 sq. feet
|
2 baths 2 beds |
show details | |

|
#30
Regatta Pt
Hercules, CA 94547
|
3,983 sq. feet
|
4 baths 5 beds |
show details |
| Photo | Address | Area | Beds / Baths | Price | Details |
|---|---|---|---|---|---|

|
#31
Turquoise Dr
Hercules, CA 94547
|
4,815 sq. feet
|
5 baths 6 beds |
show details | |

|
#32
S Wildwood
Hercules, CA 94547
|
1,220 sq. feet
|
2 baths 2 beds |
show details | |

|
#33
Bonaire Ave
Hercules, CA 94547
|
2,056 sq. feet
|
3 baths 4 beds |
show details | |

|
#34
Eagle Ct
Hercules, CA 94547
|
- sq. feet
|
- baths - beds |
show details | |

|
#35
John Muir Pkwy
Hercules, CA 94547
|
- sq. feet
|
- baths - beds |
show details | |

|
#36
Alfred Nobel Dr
Hercules, CA 94547
|
- sq. feet
|
- baths - beds |
show details | |

|
#37
Sycamore Ave Unit 5393
Hercules, CA 94547
|
- sq. feet
|
- baths - beds |
show details | |

|
#38
Forest Run
Hercules, CA 94547
|
- sq. feet
|
- baths - beds |
show details | |

|
#39
Sycamore Ave Ste M178
Hercules, CA 94547
|
- sq. feet
|
- baths - beds |
show details | |

|
#40
Sycamore Ave # 130
Hercules, CA 94547
|
- sq. feet
|
- baths - beds |
show details |
| Photo | Address | Area | Beds / Baths | Price | Details |
|---|---|---|---|---|---|

|
Check over 1 million property listings on Foreclosure.com!
|
browse all offers | |||
| Photo | Address | Area | Beds / Baths | Price | Details |
|---|

Latest news about housing in Hercules, CA collected exclusively by city-data.com from local newspapers, TV, and radio stations

 | To buy or rent a home, which is better? Great article (189 replies) |
| Relocating and Househunting (48 replies) |
| Housing for TOURO student-Vallejo (20 replies) |
| Young couple seeking to buy or rent a house in Bay Area (10 replies) |
| The Los Angeles Homeless Containment Thread (9135 replies) |
| How the hell do I find apartments in east bay? (19 replies) |
Median year apartment built: 1990
Household type by relationship:
Households: 25,913- Male householders: 4,300 (753 living alone), Female householders: 4,645 (1,384 living alone)
5,071 spouses (5,036 opposite-sex spouses), 342 unmarried partners, (302 opposite-sex unmarried partners), 8,021 children (7,915 natural, 28 adopted, 77 stepchildren), 510 grandchildren, 307 brothers or sisters, 1,321 parents, 0 foster children, 731 other relatives, 601 non-relatives
- In group quarters: 60
Size of family households: 2,293 2-persons, 1,603 3-persons, 1,251 4-persons, 750 5-persons, 440 6-persons, 318 7-or-more-persons.
Size of nonfamily households: 2,162 1-person, 250 2-persons, 48 3-persons.
3,708 married couples with children.
709 single-parent households (68 men, 641 women).
52.5% of residents of Hercules speak English at home.
12.5% of residents speak Spanish at home (77% speak English very well, 18% speak English well, 4% speak English not well, 1% don't speak English at all).
12.4% of residents speak other Indo-European language at home (64% speak English very well, 26% speak English well, 6% speak English not well, 5% don't speak English at all).
20.3% of residents speak Asian or Pacific Island language at home (63% speak English very well, 25% speak English well, 8% speak English not well, 4% don't speak English at all).
3.8% of residents speak other language at home (83% speak English very well, 16% speak English well, 2% speak English not well).
Foreign born population: 8,886 (34.3%)
(80.5% of them are naturalized citizens)
| Here: | 6.5 |
| State: | 6.0 |
| Here: | 4.6 |
| State: | 3.9 |
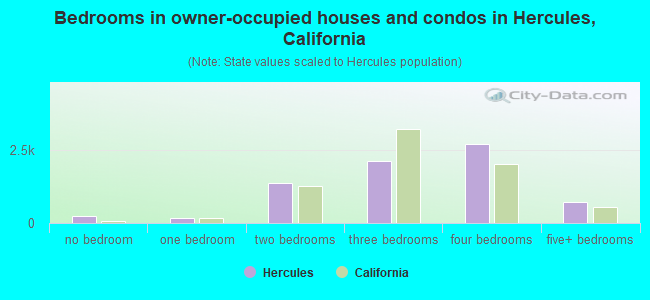
- Bedrooms in owner-occupied houses and condos in Hercules, California
- 230no bedroom
- 1751 bedroom
- 1,3542 bedrooms
- 2,1233 bedrooms
- 2,6954 bedrooms
- 7345+ bedrooms
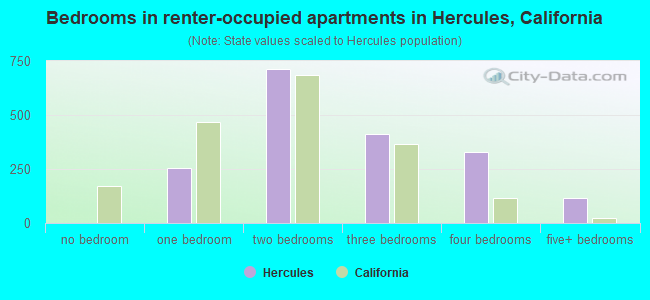
- Bedrooms in renter-occupied apartments in Hercules, California
- 0no bedroom
- 2561 bedroom
- 7112 bedrooms
- 4123 bedrooms
- 3314 bedrooms
- 1165+ bedrooms
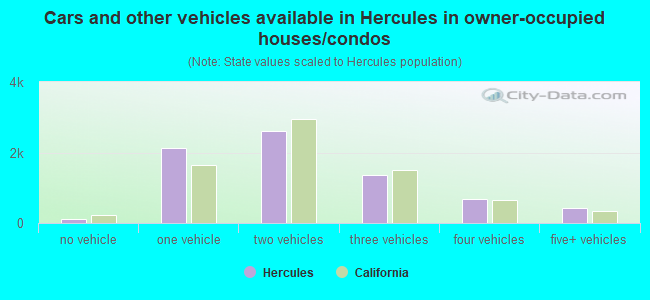
- Cars and other vehicles available in Hercules in owner-occupied houses/condos
- 119no vehicle
- 2,1151 vehicle
- 2,6082 vehicles
- 1,3613 vehicles
- 6914 vehicles
- 4175+ vehicles
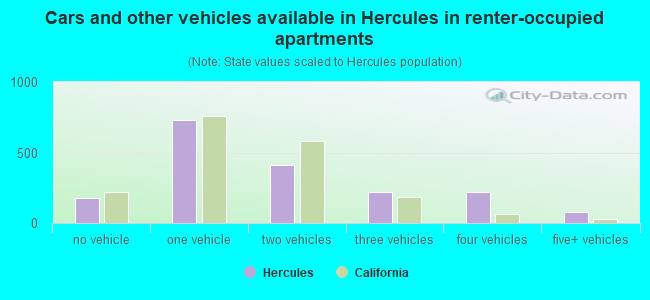
- Cars and other vehicles available in Hercules in renter-occupied apartments
- 174no vehicle
- 7291 vehicle
- 4092 vehicles
- 2223 vehicles
- 2174 vehicles
- 765+ vehicles
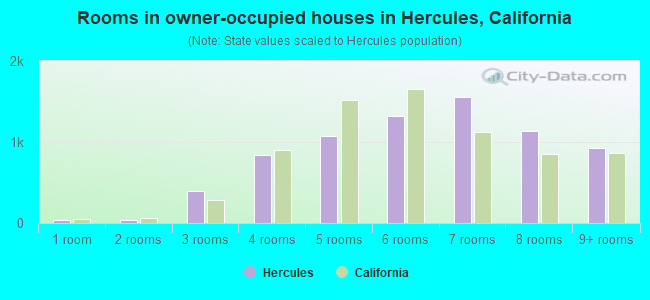
- Rooms in owner-occupied houses in Hercules, California
- 321 room
- 352 rooms
- 3943 rooms
- 8414 rooms
- 1,0795 rooms
- 1,3226 rooms
- 1,5517 rooms
- 1,1348 rooms
- 9229+ rooms
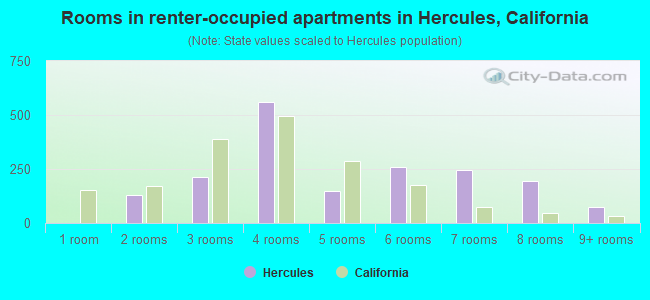
- Rooms in renter-occupied apartments in Hercules, California
- 01 room
- 1312 rooms
- 2123 rooms
- 5624 rooms
- 1505 rooms
- 2576 rooms
- 2477 rooms
- 1938 rooms
- 739+ rooms
Hercules, CA household income distribution

- 426Less than $10,000
- 371$10,000 to $19,999
- 338$20,000 to $29,999
- 193$30,000 to $39,999
- 545$40,000 to $49,999
- 450$50,000 to $59,999
- 420$60,000 to $74,999
- 892$75,000 to $99,999
- 933$100,000 to $124,999
- 914$125,000 to $149,999
- 1,145$150,000 to $199,999
- 2,527$200,000 or more
Home value of owner - occupied houses in 2022 in Hercules, CA
-
- 158Less than $10,000
- 61$30,000 to $34,999
- 46$70,000 to $79,999
- 97$80,000 to $89,999
- 20$100,000 to $124,999
- 9$200,000 to $249,999
- 43$250,000 to $299,999
- 208$300,000 to $399,999
- 835$400,000 to $499,999
- 2,204$500,000 to $749,999
- 2,739$750,000 to $999,999
- 609$1,000,000 to $1,499,999
- 71$1,500,000 to $1,999,999
- 61$2,000,000 or more
Rent paid by renters in 2022 in Hercules, CA
-
- 8$200 to $249
- 46$400 to $449
- 10$700 to $749
- 38$750 to $799
- 45$900 to $999
- 12$1,000 to $1,249
- 60$1,250 to $1,499
- 367$1,500 to $1,999
- 209$2,000 to $2,499
- 266$2,500 to $2,999
- 267$3,000 to $3,499
- 296$3,500 or more
- 148No cash rent
Percentage of workers working in this county: 56.0%
Number of people working at home: 2,499 (18.6% of all workers)
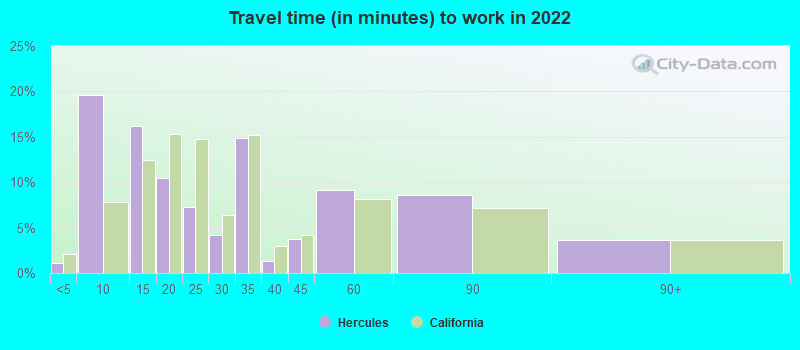
Travel time to work (commute)
- Less than 5 minutes: 135
- 5 to 9 minutes: 578
- 10 to 14 minutes: 715
- 15 to 19 minutes: 879
- 20 to 24 minutes: 1,272
- 25 to 29 minutes: 531
- 30 to 34 minutes: 1,248
- 35 to 39 minutes: 435
- 40 to 44 minutes: 609
- 45 to 59 minutes: 1,567
- 60 to 89 minutes: 2,012
- 90 or more minutes: 709
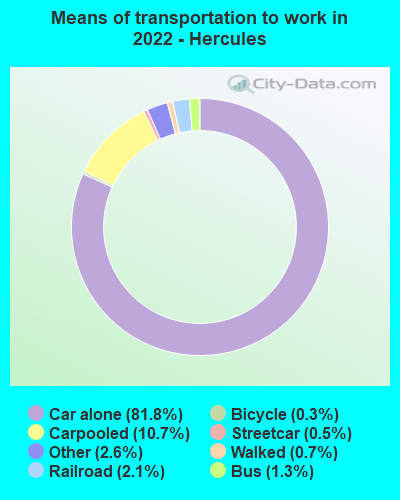
Means of transportation to work:
- Drove a car alone: 3,943 (54.1%)
- Carpooled: 576 (7.9%)
- Bus: 50 (0.7%)
- Subway or elevated rail: 15 (0.2%)
- Light rail, streetcar or trolley: 76 (1.0%)
- Taxi: 134 (1.8%)
- Bicycle: 9 (0.1%)
- Walked: 48 (0.7%)
- Worked at home: 2,499 (34.3%)
- Unemployment by race in 2022
- Unemployment rate for White non-Hispanic residents
- 0.6%Males
- 8.7%Females
- Unemployment rate for Black residents
- 2.1%Males
- 8.7%Females
- Unemployment rate for Asian residents
- 2.1%Males
- 3.8%Females
- Unemployment rate for other race residents
- 7.3%Males
- 1.8%Females
- Unemployment rate for two or more race residents
- 5.1%Males
- 4.1%Females
- Unemployment rate for Hispanic or Latino residents
- 4.9%Males
- 2.2%Females
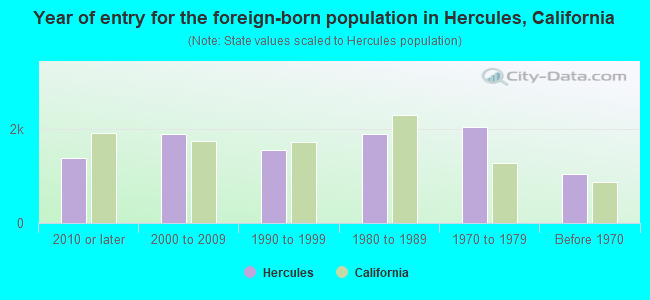
- Year of entry for the foreign-born population in Hercules, California
- 1,3972010 or later
- 1,8912000 to 2009
- 1,5541990 to 1999
- 1,9091980 to 1989
- 2,0501970 to 1979
- 1,053Before 1970
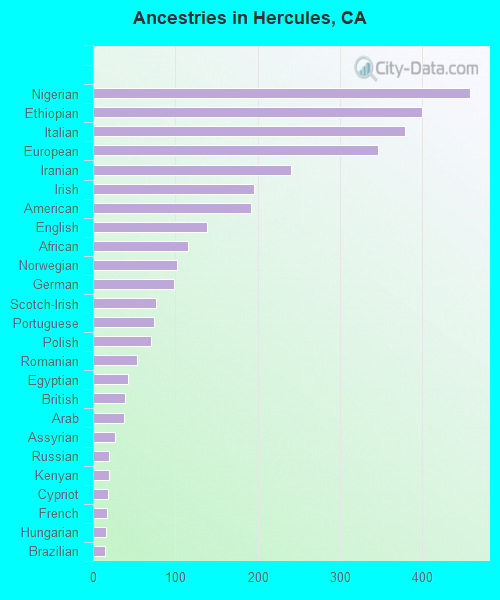
First ancestries reported:
- Nigerian: 458 (2.5%)
- Ethiopian: 399 (2.2%)
- Italian: 379 (2.1%)
- European: 346 (1.9%)
- Iranian: 241 (1.3%)
- Irish: 195 (1.1%)
- American: 192 (1.1%)
- English: 139 (0.8%)
- African: 115 (0.6%)
- Norwegian: 102 (0.6%)
- German: 98 (0.5%)
- Scotch-Irish: 77 (0.4%)
- Portuguese: 74 (0.4%)
- Polish: 70 (0.4%)
- Romanian: 53 (0.3%)
- Egyptian: 43 (0.2%)
- British: 39 (0.2%)
- Arab: 38 (0.2%)
- Assyrian: 27 (0.1%)
- Russian: 19 (0.1%)
- Kenyan: 19 (0.1%)
- Cypriot: 18 (0.10%)
- French: 17 (0.09%)
- Hungarian: 16 (0.09%)
- Brazilian: 14 (0.08%)
- Bulgarian: 14 (0.08%)
- Ghanaian: 10 (0.06%)
- Dutch: 10 (0.06%)
- Haitian: 10 (0.06%)
- Lebanese: 10 (0.06%)
- Austrian: 7 (0.04%)
- Greek: 7 (0.04%)
- Scottish: 6 (0.03%)
- Ukrainian: 5 (0.03%)
- Canadian: 3 (0.02%)
- Eastern European: 3 (0.02%)
- Danish: 2 (0.01%)
Most common places of birth for foreign-born residents (%):
| Hercules: | 27.3% (2,294) |
| California: | 7.8% (818,297) |
| Hercules: | 19.5% (1,639) |
| California: | 5.2% (539,184) |
| Hercules: | 8.9% (749) |
| California: | 37.2% (3,881,193) |
| Hercules: | 7.4% (622) |
| California: | 6.6% (684,672) |
| Hercules: | 4.6% (386) |
| California: | 0.5% (49,399) |
| Hercules: | 4.1% (347) |
| California: | 4.9% (512,335) |
| Hercules: | 3.0% (249) |
| California: | 1.2% (127,477) |
| Hercules: | 2.6% (219) |
| California: | 0.2% (16,541) |
| Hercules: | 2.2% (186) |
| California: | 2.0% (206,004) |
| Hercules: | 2.1% (174) |
| California: | 3.0% (315,248) |
| Hercules: | 1.7% (145) |
| California: | 0.3% (35,557) |
| Hercules: | 1.7% (144) |
| California: | 4.2% (440,287) |
Place of birth for U.S.-born residents:
- This state: 13,781
- Other state: 2,361
- Northeast: 410
- Midwest: 579
- South: 1,126
- West: 252
90.4% of Hercules residents lived in the same house 1 years ago.
Out of people who lived in different houses, 38.3% lived in this county.
Out of people who lived in different counties, 78.8% lived in California.
| Hercules: | 90.4% |
| State average: | 88.9% |
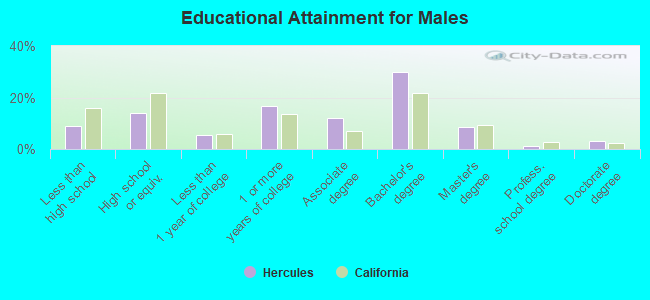
Education attainment for males 25 years and older:
- No schooling: 361
- Nursery to 4th grade: 11
- 5th and 6th grade: 161
- 7th and 8th grade: 55
- 9th grade: 4
- 10th grade: 23
- 11th grade: 62
- 12th grade, no diploma: 102
- High school graduate (or equivalency): 1,203
- Less than 1 year of college: 490
- Some college more than 1 year, no degree: 1,442
- Associate degree: 1,057
- Bachelor's degree: 2,621
- Master's degree: 752
- Professional school degree: 111
- Doctorate degree: 263
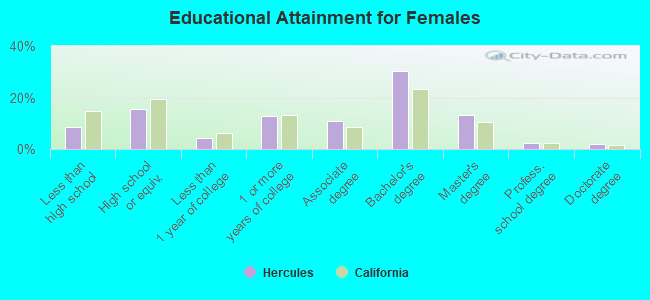
Education attainment for females 25 years and older:
- No schooling: 242
- Nursery to 4th grade: 149
- 5th and 6th grade: 63
- 7th and 8th grade: 60
- 9th grade: 0
- 10th grade: 87
- 11th grade: 69
- 12th grade, no diploma: 185
- High school graduate (or equivalency): 1,580
- Less than 1 year of college: 423
- Some college more than 1 year, no degree: 1,317
- Associate degree: 1,091
- Bachelor's degree: 3,091
- Master's degree: 1,362
- Professional school degree: 247
- Doctorate degree: 208


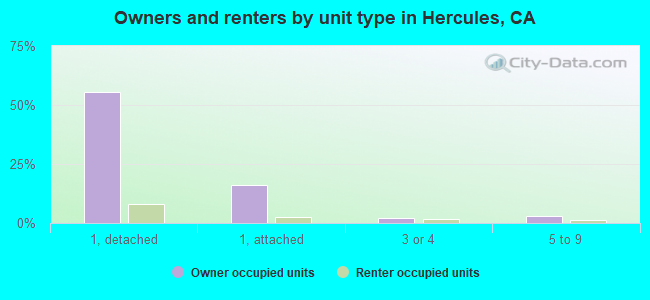
Housing units in structures:
- One, detached: 5,665
- One, attached: 1,946
- Two: 135
- 3 or 4: 423
- 5 to 9: 375
- 10 to 19: 335
- 20 to 49: 13
- 50 or more: 490
- Mobile homes: 32
- Boats, RVs, vans, etc.: 13
Housing units lacking complete kitchen facilities in 2022: 0.9%
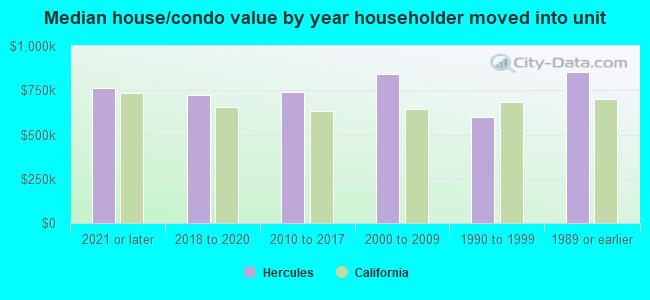
House/condo owner moved in on average 15 years ago
Renter moved in on average 6 years ago
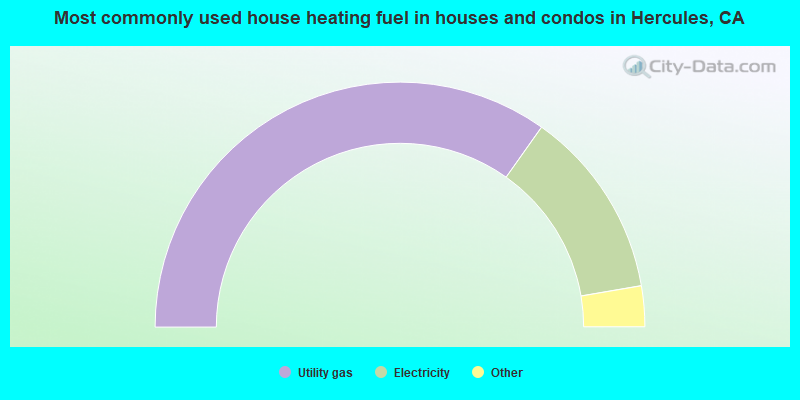
- 69.7%Utility gas
- 25.0%Electricity
- 2.7%Bottled, tank, or LP gas
- 2.0%Solar energy
- 0.6%No fuel used
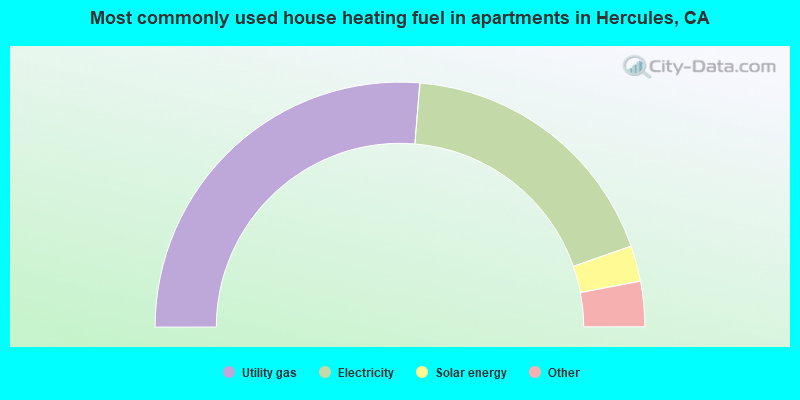
- 52.6%Utility gas
- 36.7%Electricity
- 4.7%Solar energy
- 3.3%No fuel used
- 2.2%Wood
- 0.5%Bottled, tank, or LP gas
Private vs. public school enrollment:
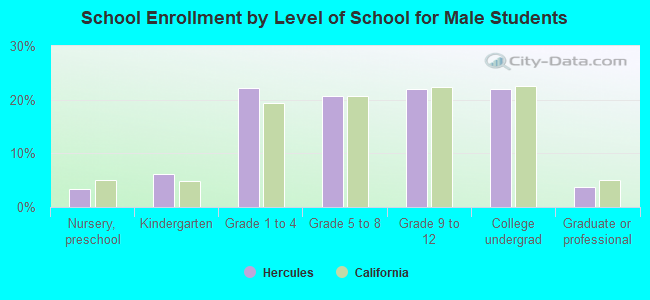
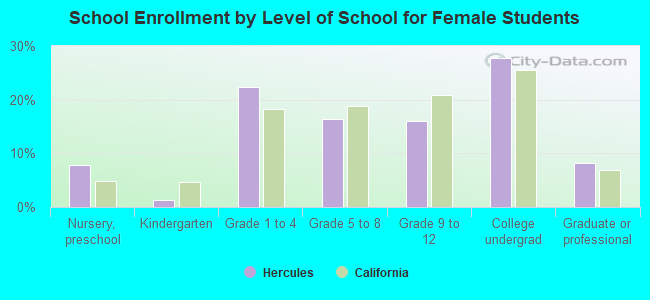
| Here: | 20.0% |
| California: | 10.5% |
| Here: | 20.6% |
| California: | 8.5% |
| Here: | 13.0% |
| California: | 15.9% |