Estimated zip code population in 2022: 28,219 Zip code population in 2010: 26,864 Zip code population in 2000: 23,995
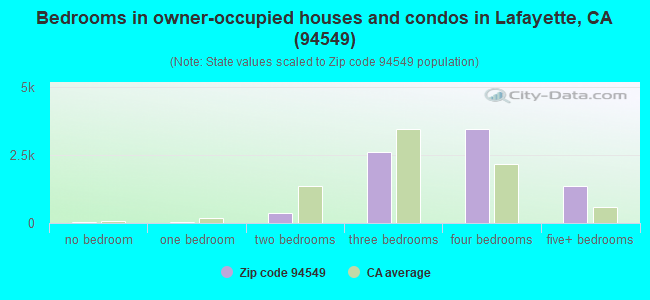
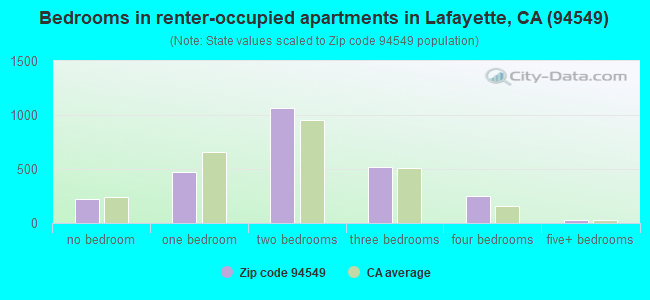
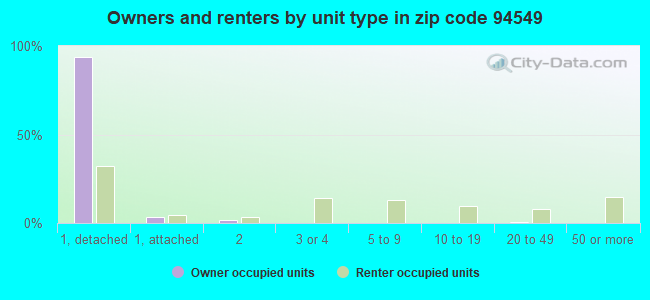
Houses and condos: 10,794 Renter-occupied apartments: 2,552
% of renters here:
25%
State:
44%
March 2022 cost of living index in zip code 94549: 121.8 (high, U.S. average is 100)
Land area: 19.2 sq. mi. Water area: 0.2 sq. mi.
Population density: 1,470 people per square mile
(low).
OSM Map
General Map
Google Map
MSN Map
OSM Map
General Map
Google Map
MSN Map
OSM Map
General Map
Google Map
MSN Map
OSM Map
General Map
Google Map
MSN Map
Please wait while loading the map...
Real estate property taxes paid for housing units in 2022:
This zip code:
0.5% ($10,292)
California:
0.7% ($4,831)
Median real estate property taxes paid for housing units with mortgages in 2022: $10,330 (0.5%) Median real estate property taxes paid for housing units with no mortgage in 2022: $8,685 (0.5%)
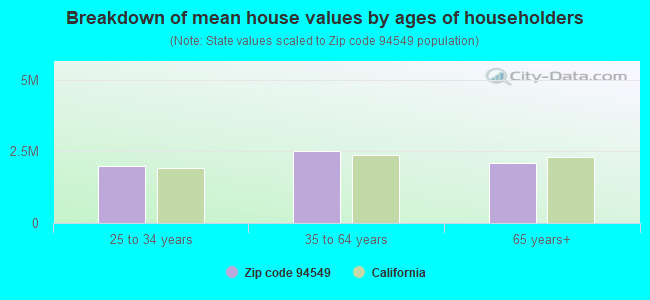
Estimated median house/condo value in 2022: $1,996,333
94549:
$1,996,333
California:
$715,900
According to our research of California and other state lists, there were 4 registered sex offenders living in 94549 zip code as of April 27, 2024. The ratio of all residents to sex offenders in zip code 94549 is 7,355 to 1. The ratio of registered sex offenders to all residents in this zip code is much lower than the state average.
Median resident age:
This zip code:
46.6 years
California median age:
37.9 years
Average household size:
This zip code:
2.7 people
California:
2.8 people
Averages for the 2020 tax year for zip code 94549, filed in 2021:
Average Adjusted Gross Income (AGI) in 2020: $335,956 (Individual Income Tax Returns)
Here:
$335,956
State:
$95,910
Salary/wage: $249,709 (reported on 72.0% of returns)
Here:
$249,709
State:
$77,331
(% of AGI for various income ranges: 1293.4% for AGIs below $25k, 3746.1% for AGIs $25k-50k, 7183.8% for AGIs $50k-75k, 10160.0% for AGIs $75k-100k, 18276.6% for AGIs $100k-200k, 177023.1% for AGIs over 200k)
Taxable interest for individuals: $6,369 (reported on 65.9% of returns)
This zip code:
$6,369
California:
$2,294
(% of AGI for various income ranges: 54.9% for AGIs below $25k, 111.0% for AGIs $25k-50k, 173.5% for AGIs $50k-75k, 269.3% for AGIs $75k-100k, 478.9% for AGIs $100k-200k, 4029.5% for AGIs over 200k)
Ordinary dividends: $24,176 (reported on 58.9% of returns)
Here:
$24,176
State:
$10,949
(% of AGI for various income ranges: 200.5% for AGIs below $25k, 314.3% for AGIs $25k-50k, 619.2% for AGIs $50k-75k, 1008.4% for AGIs $75k-100k, 2066.0% for AGIs $100k-200k, 13242.4% for AGIs over 200k)
Net capital gain/loss in AGI: +$116,441 (reported on 56.6% of returns)
Here:
+$116,441
State:
+$49,306
(% of AGI for various income ranges: 90.0% for AGIs below $25k, 323.5% for AGIs $25k-50k, 451.8% for AGIs $50k-75k, 778.4% for AGIs $75k-100k, 1838.5% for AGIs $100k-200k, 72663.4% for AGIs over 200k)
Profit/loss from business: +$59,472 (reported on 22.7% of returns)
Here:
+$59,472
State:
+$15,671
(% of AGI for various income ranges: 227.5% for AGIs below $25k, 496.3% for AGIs $25k-50k, 914.8% for AGIs $50k-75k, 1040.4% for AGIs $75k-100k, 1814.6% for AGIs $100k-200k, 12342.9% for AGIs over 200k)
Taxable individual retirement arrangement distribution: $48,022 (reported on 15.9% of returns)
94549:
$48,022
California:
$23,505
(% of AGI for various income ranges: 88.1% for AGIs below $25k, 359.2% for AGIs $25k-50k, 560.0% for AGIs $50k-75k, 1364.9% for AGIs $75k-100k, 2627.3% for AGIs $100k-200k, 5102.8% for AGIs over 200k)
Self-employed (Keogh) retirement plans: $39,197 (reported on 5.4% of returns)
94549:
$39,197
California:
$30,163
(% of AGI for various income ranges: 73.5% for AGIs $50k-75k, 88.7% for AGIs $75k-100k, 211.2% for AGIs $100k-200k, 2146.5% for AGIs over 200k)
Total itemized deductions: $59,366 (reported on 38.3% of returns)
Here:
$59,366
State:
$39,517
(% of AGI for various income ranges: 397.5% for AGIs below $25k, 746.4% for AGIs $25k-50k, 1202.0% for AGIs $50k-75k, 1734.4% for AGIs $75k-100k, 3628.3% for AGIs $100k-200k, 20426.1% for AGIs over 200k)
Charity contributions: $27,170 (reported on 32.9% of returns)
Here:
$27,170
State:
$12,598
(% of AGI for various income ranges: 12.5% for AGIs below $25k, 41.0% for AGIs $25k-50k, 98.7% for AGIs $50k-75k, 195.6% for AGIs $75k-100k, 446.9% for AGIs $100k-200k, 9606.0% for AGIs over 200k)
Taxes paid: $9,500 (reported on 38.1% of returns)
94549:
$9,500
State:
$8,807
(% of AGI for various income ranges: 75.7% for AGIs below $25k, 154.3% for AGIs $25k-50k, 230.2% for AGIs $50k-75k, 441.8% for AGIs $75k-100k, 884.5% for AGIs $100k-200k, 2852.2% for AGIs over 200k)
Earned income credit: $1,134 (reported on 3.2% of returns)
Here:
$1,134
State:
$2,074
(% of AGI for various income ranges: 33.0% for AGIs below $25k, 20.7% for AGIs $25k-50k)
Percentage of individuals using paid preparers for their 2020 taxes: 91.9%
Here:
92%
State:
92%
(% for various income ranges: 88.2% for AGIs below $25k, 91.5% for AGIs $25k-50k, 90.7% for AGIs $50k-75k, 90.6% for AGIs $75k-100k, 91.6% for AGIs $100k-200k, 94.4% for AGIs over 200k)
Averages for the 2012 tax year for zip code 94549, filed in 2013:
Average Adjusted Gross Income (AGI) in 2012: $211,924 (Individual Income Tax Returns)
Here:
$211,924
State:
$72,726
Salary/wage: $153,041 (reported on 72.8% of returns)
Here:
$153,041
State:
$59,079
(% of AGI for various income ranges: 62.1% for AGIs below $25k, 62.7% for AGIs $25k-50k, 56.7% for AGIs $50k-75k, 57.0% for AGIs $75k-100k, 60.2% for AGIs $100k-200k, 50.3% for AGIs over 200k)
Taxable interest for individuals: $5,367 (reported on 63.8% of returns)
This zip code:
$5,367
California:
$2,146
(% of AGI for various income ranges: 4.0% for AGIs below $25k, 2.0% for AGIs $25k-50k, 2.2% for AGIs $50k-75k, 1.8% for AGIs $75k-100k, 1.2% for AGIs $100k-200k, 1.6% for AGIs over 200k)
Ordinary dividends: $19,055 (reported on 54.5% of returns)
Here:
$19,055
State:
$9,308
(% of AGI for various income ranges: 9.1% for AGIs below $25k, 5.1% for AGIs $25k-50k, 5.1% for AGIs $50k-75k, 5.1% for AGIs $75k-100k, 4.5% for AGIs $100k-200k, 4.9% for AGIs over 200k)
Net capital gain/loss in AGI: +$49,000 (reported on 50.5% of returns)
Here:
+$49,000
State:
+$30,460
(% of AGI for various income ranges: 0.6% for AGIs below $25k, 2.2% for AGIs $25k-50k, 1.4% for AGIs $50k-75k, 2.4% for AGIs $75k-100k, 2.6% for AGIs $100k-200k, 14.6% for AGIs over 200k)
Profit/loss from business: +$49,041 (reported on 23.8% of returns)
Here:
+$49,041
State:
+$17,064
(% of AGI for various income ranges: 13.4% for AGIs below $25k, 9.4% for AGIs $25k-50k, 8.6% for AGIs $50k-75k, 7.8% for AGIs $75k-100k, 7.9% for AGIs $100k-200k, 4.6% for AGIs over 200k)
Taxable individual retirement arrangement distribution: $38,913 (reported on 18.0% of returns)
94549:
$38,913
California:
$19,557
(% of AGI for various income ranges: 5.5% for AGIs below $25k, 6.0% for AGIs $25k-50k, 7.0% for AGIs $50k-75k, 7.2% for AGIs $75k-100k, 5.7% for AGIs $100k-200k, 2.4% for AGIs over 200k)
Self-employment retirement plans: $31,413 (reported on 5.6% of returns)
94549:
$31,413
California:
$24,530
(% of AGI for various income ranges: 1.1% for AGIs below $25k, 0.4% for AGIs $50k-75k, 0.6% for AGIs $75k-100k, 0.8% for AGIs $100k-200k, 0.9% for AGIs over 200k)
Total itemized deductions: $64,977 (20% of AGI, reported on 61.5% of returns)
Here:
$64,977
State:
$34,004
Here:
20.2% of AGI
State:
22.7% of AGI
(% of AGI for various income ranges: 33.3% for AGIs below $25k, 21.2% for AGIs $25k-50k, 20.5% for AGIs $50k-75k, 22.0% for AGIs $75k-100k, 22.0% for AGIs $100k-200k, 17.8% for AGIs over 200k)
Charity contributions: $8,126 (reported on 54.2% of returns)
Here:
$8,126
State:
$4,659
(% of AGI for various income ranges: 1.0% for AGIs below $25k, 1.2% for AGIs $25k-50k, 1.5% for AGIs $50k-75k, 1.9% for AGIs $75k-100k, 1.9% for AGIs $100k-200k, 2.2% for AGIs over 200k)
Taxes paid: $35,540 (reported on 61.3% of returns)
94549:
$35,540
State:
$14,448
(% of AGI for various income ranges: 7.1% for AGIs below $25k, 5.0% for AGIs $25k-50k, 5.7% for AGIs $50k-75k, 7.6% for AGIs $75k-100k, 9.3% for AGIs $100k-200k, 11.0% for AGIs over 200k)
Earned income credit: $1,129 (reported on 4.1% of returns)
Here:
$1,129
State:
$2,286
(% of AGI for various income ranges: 1.6% for AGIs below $25k, 0.3% for AGIs $25k-50k)
Percentage of individuals using paid preparers for their 2012 taxes: 60.7%
Here:
61%
State:
64%
(% for various income ranges: 50.3% for AGIs below $25k, 52.2% for AGIs $25k-50k, 55.8% for AGIs $50k-75k, 60.9% for AGIs $75k-100k, 62.8% for AGIs $100k-200k, 73.7% for AGIs over 200k)
Averages for the 2004 tax year for zip code 94549, filed in 2005:
Average Adjusted Gross Income (AGI) in 2004: $152,369 (Individual Income Tax Returns)
Here:
$152,369
State:
$58,600
Salary/wage: $114,311 (reported on 71.5% of returns)
Here:
$114,311
State:
$49,455
(% of AGI for various income ranges: 54.9% for AGIs $10k-25k, 60.6% for AGIs $25k-50k, 57.0% for AGIs $50k-75k, 56.7% for AGIs $75k-100k, 51.5% for AGIs over 100k)
Taxable interest for individuals: $5,773 (reported on 71.3% of returns)
This zip code:
$5,773
California:
$2,365
(% of AGI for various income ranges: 6.2% for AGIs $10k-25k, 3.6% for AGIs $25k-50k, 3.8% for AGIs $50k-75k, 2.8% for AGIs $75k-100k, 2.4% for AGIs over 100k)
Taxable dividends: $11,000 (reported on 60.0% of returns)
Here:
$11,000
State:
$4,746
(% of AGI for various income ranges: 7.3% for AGIs $10k-25k, 5.0% for AGIs $25k-50k, 4.1% for AGIs $50k-75k, 4.4% for AGIs $75k-100k, 4.1% for AGIs over 100k)
Net capital gain/loss: +$46,821 (reported on 54.0% of returns)
Here:
+$46,821
State:
+$23,418
(% of AGI for various income ranges: 1.6% for AGIs $10k-25k, 2.1% for AGIs $25k-50k, 1.7% for AGIs $50k-75k, 2.1% for AGIs $75k-100k, 18.5% for AGIs over 100k)
Profit/loss from business: +$45,218 (reported on 24.2% of returns)
Here:
+$45,218
State:
+$16,826
(% of AGI for various income ranges: 12.8% for AGIs $10k-25k, 10.5% for AGIs $25k-50k, 9.1% for AGIs $50k-75k, 11.1% for AGIs $75k-100k, 6.6% for AGIs over 100k)
IRA payment deduction: $3,629 (reported on 4.3% of returns)
94549:
$3,629
California:
$3,192
(% of AGI for various income ranges: 0.4% for AGIs $10k-25k, 0.5% for AGIs $25k-50k, 0.2% for AGIs $50k-75k, 0.3% for AGIs $75k-100k, 0.1% for AGIs over 100k)
Self-employed pension: $23,265 (reported on 7.2% of returns)
Here:
$23,265
California:
$17,688
(% of AGI for various income ranges: 1.0% for AGIs $10k-25k, 0.4% for AGIs $25k-50k, 0.6% for AGIs $50k-75k, 1.5% for AGIs $75k-100k, 1.1% for AGIs over 100k)
Total itemized deductions: $49,356 (20% of AGI, reported on 59.1% of returns)
Here:
$49,356
State:
$28,113
Here:
20.1% of AGI
State:
25.3% of AGI
(% of AGI for various income ranges: 26.7% for AGIs $10k-25k, 23.2% for AGIs $25k-50k, 22.9% for AGIs $50k-75k, 26.1% for AGIs $75k-100k, 17.8% for AGIs over 100k)
Charity contributions deductions: $8,717 (3% of AGI, reported on 54.6% of returns)
Here:
$8,717
State:
$3,923
Here:
3.4% of AGI
State:
3.3% of AGI
(% of AGI for various income ranges: 1.6% for AGIs $10k-25k, 1.8% for AGIs $25k-50k, 2.2% for AGIs $50k-75k, 2.5% for AGIs $75k-100k, 3.2% for AGIs over 100k)
Total tax: $34,779 (reported on 84.5% of returns)
94549:
$34,779
State:
$10,761
(% of AGI for various income ranges: 6.2% for AGIs $10k-25k, 8.8% for AGIs $25k-50k, 10.6% for AGIs $50k-75k, 11.2% for AGIs $75k-100k, 20.3% for AGIs over 100k)
Earned income credit: $972 (reported on 3.2% of returns)
Here:
$972
State:
$1,763
Percentage of individuals using paid preparers for their 2004 taxes: 61.8%
Here:
62%
State:
66%
(% for various income ranges: 53.1% for AGIs below $10k, 54.1% for AGIs $10k-25k, 55.5% for AGIs $25k-50k, 60.9% for AGIs $50k-75k, 64.4% for AGIs $75k-100k, 70.2% for AGIs over 100k)
Likely homosexual households (counted as self-reported same-sex unmarried-partner households)
Lesbian couples: 0.5% of all households
Gay men: 0.0% of all households
Household received Food Stamps/SNAP in the past 12 months: 266 Household did not receive Food Stamps/SNAP in the past 12 months: 9,829
Women who had a birth in the past 12 months: 219 (218 now married, 0 unmarried) Women who did not have a birth in the past 12 months: 5,504 (2,854 now married, 2,621 unmarried)
Housing units in zip code 94549 with a mortgage: 5,528 (1,068 second mortgage, 58 home equity loan, 911 both second mortgage and home equity loan) Houses without a mortgage: 39
Median monthly owner costs for units with a mortgage: $3,876 Median monthly owner costs for units without a mortgage: $1,318
Residents with income below the poverty level in 2022:
This zip code:
4.8%
Whole state:
12.2%
Residents with income below 50% of the poverty level in 2022:
This zip code:
1.1%
Whole state:
6.2%
Median number of rooms in houses and condos:
Here:
7.6
State:
6.0
Median number of rooms in apartments:
Here:
4.2
State:
3.9
Notable locations in this zip code not listed on our city pages
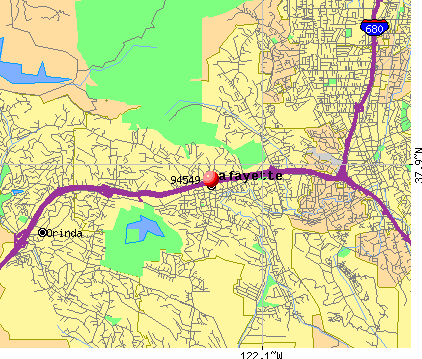
Notable locations in zip code 94549: Lafayette Water Treatment Plant (A), Sunnyside Pumping Plant (B), Withers Pumping Plant (C), Lafayette Town Hall (D), Lafayette Branch Contra Costa County Library (E), Contra Costa County Fire Protection District Station 15 (F), Contra Costa County Fire Protection District Station 17 (G), Contra Costa County Fire Protection District Station 16 (H). Display/hide their locations on the map
Cemeteries: Queen of Heaven Cemetery (1), Oakmont Memorial Park (2), Lafayette Cemetery (3), Queen of Haven Cemetery (4). Display/hide their locations on the map
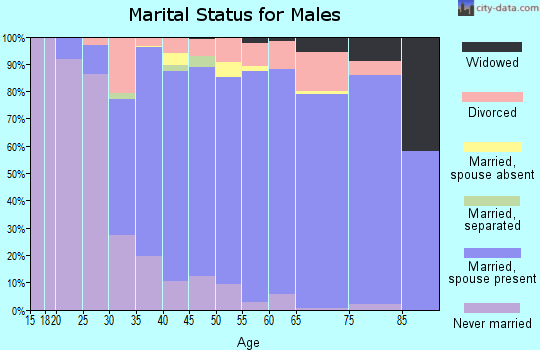
5,558 married couples with children.
774 single-parent households (509 men, 265 women).
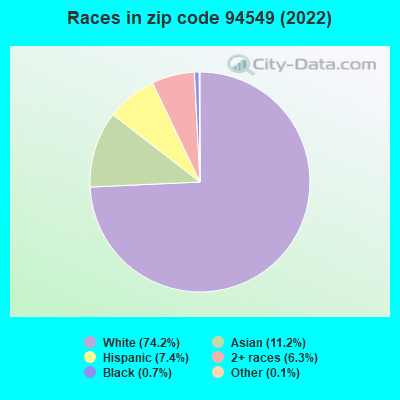
78.9% of residents of 94549 zip code speak English at home.
3.9% of residents speak Spanish at home (78% very well, 17% well, 5% not well).
12.3% of residents speak other Indo-European language at home (81% very well, 15% well, 4% not well).
4.2% of residents speak Asian or Pacific Island language at home (76% very well, 20% well, 5% not well).
1.0% of residents speak other language at home (87% very well, 5% well, 9% not well).
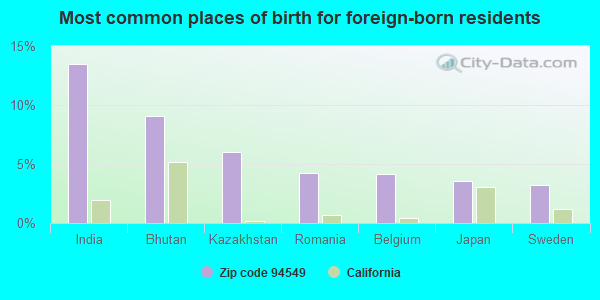
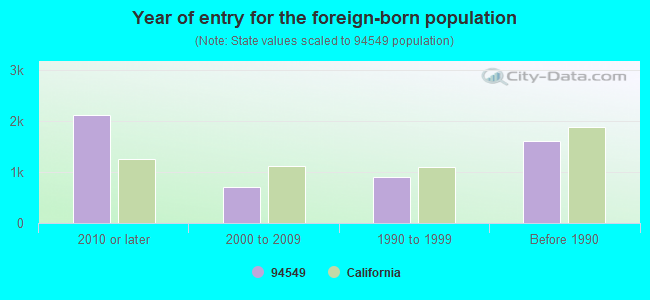
Foreign born population: 4,522 (16.0%) (56.6% of them are naturalized citizens)
Major facilities with environmental interests located in this zip code:
ACALANES HIGH SCHOOL (1200 PLEASANT HILL RD. in LAFAYETTE, CA)
(Geographic Names Information System) STATE MASTER (California - Hazardous Waste Tracking) - HAZARDOU WASTE PROGRAM (National Center for Education Statistics) - STATE ID-0730283 Small Quantity Generators, between 100 kg and 1000 kg of hazardous waste/month (Resource Conservation and Recovery Act (tracking hazardous waste)) - notification Organizations: ACALANTES UNION SCHOOL DIST (CONTACT/OWNER)
, ACALANES UNION HIGH (SCHOOL DISTRICT)
EQUILON ENTERPRISES (3356 MT DIABLO/AILEEN in LAFAYETTE, CA) . Federal Facility
STATE MASTER (California - Hazardous Waste Tracking) - HAZARDOU WASTE PROGRAM Small Quantity Generators, between 100 kg and 1000 kg of hazardous waste/month (Resource Conservation and Recovery Act (tracking hazardous waste)) - notification Organizations: EQUILON ENTERPRISES, LLC (CONTACT/OWNER)
Alternative names: SHELL OIL CO
EQUILON ENTERPRISES (3603 MT DIABLO/DEWING in LAFAYETTE, CA) . Federal Facility
STATE MASTER (California - Hazardous Waste Tracking) - HAZARDOU WASTE PROGRAM Small Quantity Generators, between 100 kg and 1000 kg of hazardous waste/month (Resource Conservation and Recovery Act (tracking hazardous waste)) - notification Organizations: EQUILON ENTERPRISES, LLC (CONTACT/OWNER)
Alternative names: SHELL OIL CO
CHEVRON STATION NO 95890 (3632 MT DIABLO BLVD in LAFAYETTE, CA)
STATE MASTER (California - Hazardous Waste Tracking) - HAZARDOU WASTE PROGRAM Small Quantity Generators, between 100 kg and 1000 kg of hazardous waste/month (Resource Conservation and Recovery Act (tracking hazardous waste)) - notification Organizations: CHEVRON PRODUCTS CO (CONTACT/OWNER)
HAPPY VALLEY ELEMENTARY (3855 HAPPY VALLEY ROAD in LAFAYETTE, CA)
(National Center for Education Statistics) - STATE ID-6003743 Organizations: LAFAYETTE ELEMENTARY (SCHOOL DISTRICT)
LAFAYETTE ELEMENTARY (950 MORAGA ROAD in LAFAYETTE, CA)
(National Center for Education Statistics) - STATE ID-6003750
M. H. STANLEY MIDDLE (3455 SCHOOL ST. in LAFAYETTE, CA)
(National Center for Education Statistics) - STATE ID-6003768 Organizations: LAFAYETTE ELEMENTARY (SCHOOL DISTRICT)
ACALANES UNION HIGH SCHOOL DISTRICT (1212 PLEASANT HILL ROAD in LAFAYETTE, CA)
COMPLIANCE ACTIVITY (Tracking inspections of insecticide, fungicide, and rodenticide, and toxic substances) (Resource Conservation and Recovery Act (tracking hazardous waste)) Alternative names: ACALANES UNION HSD
EBMUD BROOKWOOD RESERVOIR (1598 RELIEZ VALLEY RD in LAFAYETTE, CA)
Large Quantity Generators, more that 1000 kg of hazardous waste/month (Resource Conservation and Recovery Act (tracking hazardous waste)) - notification Organizations: E B M U D (CONTACT/OWNER)
EBMUD LAFAYETTE WATER TREATMENT PLANT (3848 MOUNT DIABLO BLVD in LAFAYETTE, CA)
HAZARDOUS WASTE BIENNIAL REPORTER (Resource Conservation and Recovery Act (tracking hazardous waste)) Small Quantity Generators, between 100 kg and 1000 kg of hazardous waste/month (Resource Conservation and Recovery Act (tracking hazardous waste)) Organizations: EAST BAY MUNICIPAL UTILITY DISTRICT (CONTACT/OPERATOR)
CALTRANS DIST 4 (W BOUND ON AND OFF RAMPS FROM in LAFAYETTE, CA)
Large Quantity Generators, more that 1000 kg of hazardous waste/month (Resource Conservation and Recovery Act (tracking hazardous waste)) - notification
HAMLIN CLEANERS (3425 GOLDEN GATE WAY in LAFAYETTE, CA)
CRITERIA AND HAZARDOUS AIR POLLUTANT INVENTORY (Inventory of air pollution sources) Small Quantity Generators, between 100 kg and 1000 kg of hazardous waste/month (Resource Conservation and Recovery Act (tracking hazardous waste))
HAMLIN CLEANERS (3516 GOLDEN GATE WAY in LAFAYETTE, CA)
CRITERIA AND HAZARDOUS AIR POLLUTANT INVENTORY (Inventory of air pollution sources) Small Quantity Generators, between 100 kg and 1000 kg of hazardous waste/month (Resource Conservation and Recovery Act (tracking hazardous waste)) Business SIC classification: DRYCLEANING PLANTS, EXCEPT RUG CLEANING Alternative names: SUNSHINE CLEANERS
Housing units lacking complete plumbing facilities: 0.8% Housing units lacking complete kitchen facilities: 1.4%
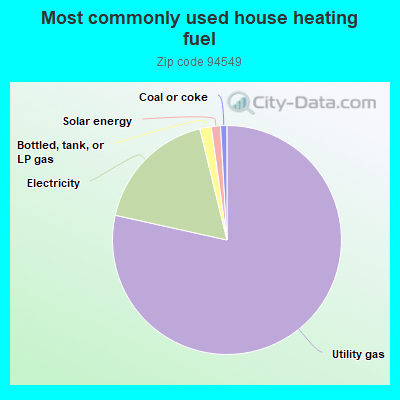
78.4%Utility gas
17.7%Electricity
1.6%Bottled, tank, or LP gas
1.3%Solar energy
0.9%Coal or coke
Population in 1990: 25,979.
Place of birth for U.S.-born residents:
This state: 15,958
Northeast: 2,528
Midwest: 1,887
South: 1,410
West: 1,149
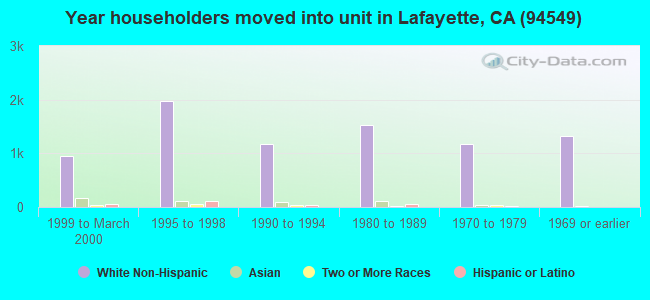
63% of the 94549 zip code residents lived in the same house 5 years ago. Out of people who lived in different houses, 51% lived in this county. Out of people who lived in different counties, 50% lived in California.
91% of the 94549 zip code residents lived in the same house 1 year ago. Out of people who lived in different houses, 29% moved from this county. Out of people who lived in different houses, 45% moved from different county within same state. Out of people who lived in different houses, 20% moved from different state. Out of people who lived in different houses, 12% moved from abroad.
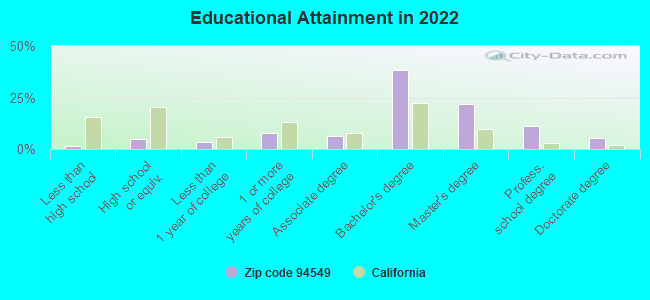
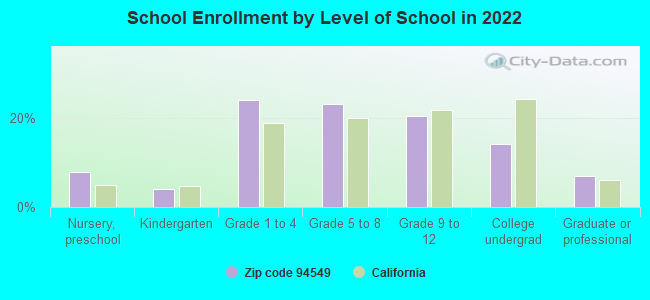
Private vs. public school enrollment:
Students in private schools in grades 1 to 8 (elementary and middle school): 786
Here:
21.3%
California:
10.5%
Students in private schools in grades 9 to 12 (high school): 123
Here:
7.8%
California:
8.5%
Students in private undergraduate colleges: 352
Here:
31.9%
California:
15.9%
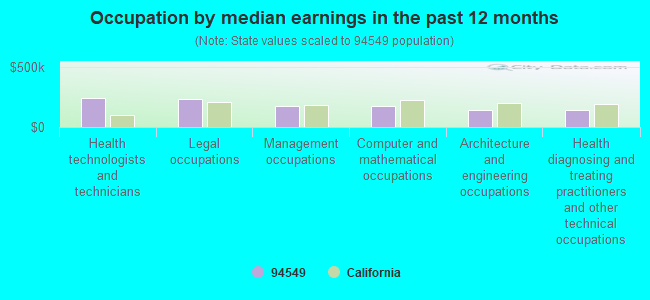
Occupation by median earnings in the past 12 months ($)
246,465Health technologists and technicians
237,352Legal occupations
175,760Management occupations
175,598Computer and mathematical occupations
145,486Architecture and engineering occupations
141,853Health diagnosing and treating practitioners and other technical occupations
Companies with biggest federal contracts located in this zip code:
NOVELX INC (3746 MT DIABLO BLVD in LAFAYETTE, CA; small business) : $2,807,329 in 4 contractsfrom 2003 to 2005
$2,053,577 with Navy for Other Defense -- Advanced Development (R&D). Signed on 2004-06-28. Completion date: 2005-12-28.
$584,796 with Navy for Other Defense -- Basic Research (R&D). Signed on 2005-06-30. Completion date: 2006-12-29.
$98,967 with Army for Other Defense -- Applied Research and Exploratory Development (R&D). Signed on 2003-06-24. Completion date: 2004-02-20.
$69,989 with Army for Services -- Applied Research and Exploratory Development (R&D). Signed on 2003-08-22. Completion date: 2004-02-18.
APPLIED ENVIRODEVELOPMENT, INC (606 STAGECOACH COURT in LAFAYETTE, CA; small business) : $747,486 in 7 contractsfrom 2001 to 2003
Contracts for Nuclear Reactors, Marine Hardware and Hull Items, Precious Metals Primary Forms by Navy, United States Coast Guard (disused code: now 7008) Signed by year:2000: $0; 2001: $173,460; 2002: $394,770; 2003: $179,256; 2004: $0; 2005: $0; 2006: $0.
Biggest contracts:
$304,770 with Navy for Nuclear Reactors. Taking place in TX. Signed on 2002-06-23. Completion date: 2002-07-19.
$147,000 with Navy for Marine Hardware and Hull Items. Taking place in TX. Signed on 2001-09-10. Completion date: 2006-07-12.
$90,000 with United States Coast Guard (disused code: now 7008) for Precious Metals Primary Forms. Signed on 2002-04-15. Completion date: 2002-06-15.
$86,240 with Navy for Marine Hardware and Hull Items. Taking place in TX. Signed on 2003-04-16. Completion date: 2003-04-30.
carl shapiro (19 Tolan Way in Lafayette, CA; small business) : $563,716 in 4 contractsfrom 2000 to 2004
$150,727 with Offices, Boards and Divisions (includes Attorney General, Deputy Attorney General, etc.) for Expert Witness. Signed on 2004-10-07. Completion date: 2005-09-30.
$149,165 with Offices, Boards and Divisions (includes Attorney General, Deputy Attorney General, etc.) for Expert Witness. Taking place in DC. Signed on 2003-03-15. Completion date: 2003-05-15.
$139,824, same as above.Signed on 2003-07-15. Completion date: 2004-04-15.
$124,000 with Offices, Boards and Divisions (includes Attorney General, Deputy Attorney General, etc.) for Legal Services. Taking place in DC. Signed on 2000-04-15. Completion date: 2000-11-15.
MICROWAVE SCIENCES (1041 LOS ARABIS LANE in LAFAYETTE, CA; small business) : $303,411 in 5 contractsfrom 2000 to 2004
Contracts for R&D-Other Space-B Res, Other Defense -- Advanced Development (R&D), Training/Curriculum Development, Scientific and Management Education, and moreby NASA, Department of Defense, Navy Signed by year:2000: $100,000; 2001: $0; 2002: $67,500; 2003: $99,998; 2004: $35,913; 2005: $0; 2006: $0.
Biggest contracts:
$100,000 with NASA for R&D-Other Space-B Res. Signed on 2000-08-15. Completion date: 2000-10-15.
$99,998 with Department of Defense for Other Defense -- Advanced Development (R&D). Signed on 2003-09-24. Completion date: 2004-03-23.
$39,500 with Navy for Training/Curriculum Development. Signed on 2002-07-03. Completion date: 2002-07-03.
$35,913 with Navy for Scientific and Management Education. Signed on 2004-06-09. Completion date: 2004-09-30.
MOUNTAIN MOVERS EXCAVATION, IN (250 LAFAYETTE CIRCLE in LAFAYETTE, CA)
$105,000 with Air Force for Athletic and Sporting Equipment. Signed on 2001-09-30. Completion date: 2002-08-30.
NEON SOFTWARE INC (244 LAFAYETTE CIRCLE in LAFAYETTE, CA; small business) : $52,679 in 4 contractsfrom 2004 to 2005
$34,548 with National Park Service for ADP Software. Signed on 2004-09-15. Effective on 2004-09-14. Completion date: 2004-09-30.
$14,252 with Air Force for ADP Software. Signed on 2005-09-21. Completion date: 2005-10-14.
$2,876 with Navy for ADP Components. Signed on 2005-09-28. Completion date: 2005-09-30.
$1,003 with National Institutes of Health for ADP Software. Signed on 2004-12-29. Completion date: 2005-12-31.
BLAKE ROTHFUSS (814 ROSEDALE AVE in LAFAYETTE, CA; small business) : $36,399 in 6 contractsfrom 2005 to 2006
Contracts for Other Professional Services by Army, U.S. Army Corps of Engineers - civil program financing only Signed by year:2000: $0; 2001: $0; 2002: $0; 2003: $0; 2004: $0; 2005: $37,400; 2006: -$1,001.
Biggest contracts:
$15,000 with Army for Other Professional Services. Signed on 2005-11-07. Completion date: 2006-03-09.
$8,000 with Army for Other Professional Services. Taking place in AL. Signed on 2005-05-25. Completion date: 2005-06-02.
$8,000 with U.S. Army Corps of Engineers - civil program financing only for Other Professional Services. Taking place in AL. Signed on 2005-05-25. Completion date: 2005-06-02.
$3,200 with Army for Other Professional Services. Taking place in AL. Signed on 2005-05-25. Completion date: 2005-06-02.
WESTERN DATA GROUP OF NEVADA, (1530 RANCHO VIEW DR in LAFAYETTE, CA)
$35,306 with Navy for Miscellaneous Communication Equipment. Signed on 2005-05-23. Completion date: 2005-06-07.
LESKIN, BARRY (3398 SILVER SPRINGS COURT in LAFAYETTE, CA; small business) : $16,500 in 2 contractsin 2005
$11,000 with Navy for Educational Services. Signed on 2005-06-03. Completion date: 2005-08-10.
$5,500, same as above.Signed on 2005-08-27. Completion date: 2005-09-23.
LIGHTRIVER TECHNOLOGIES, INC (3732 MT DIABLO BLVD # 156 in LAFAYETTE, CA; small business) : $4,537 in 2 contractsfrom 2004 to 2005
$18,148 with Department of Defense for Other ADP and Telecommunications Services (includes data storage on tapes, compact disks, etc.). Signed on 2004-12-29. Completion date: 2008-12-31.
-$13,611, same as above.Signed on 2005-01-10. Completion date: 2008-12-31.
Top industries in this zip code by the number of employees in 2005:
2002 - 2018 National Fire Incident Reporting System (NFIRS) incidents
According to the data from the years 2002 - 2018 the average number of fire incidents per year is 6. The highest number of reported fire incidents - 57 took place in 2005, and the least - 0 in 2003. The data has an increasing trend.
When looking into fire subcategories, the most reports belonged to: Outside Fires (43.6%), and Mobile Property/Vehicle Fires (27.3%).
Fire incident types reported to NFIRS in Zip Code 94549


 Nearest zip codes: 94597, 94595, 94575, 94556, 94523, 94563.


 According to the data from the years 2002 - 2018 the average number of fire incidents per year is 6. The highest number of reported fire incidents - 57 took place in 2005, and the least - 0 in 2003. The data has an increasing trend.
 When looking into fire subcategories, the most reports belonged to: Outside Fires (43.6%), and Mobile Property/Vehicle Fires (27.3%).