Estimated zip code population in 2022: 17,197 Zip code population in 2010: 16,425 Zip code population in 2000: 18,019
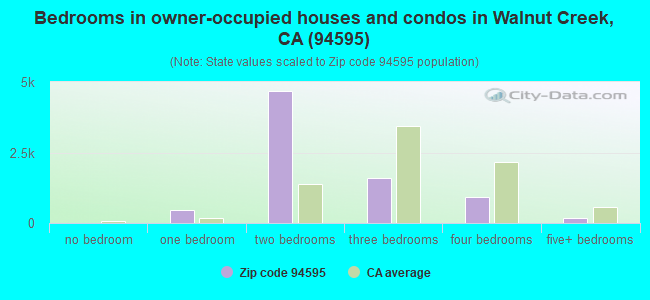
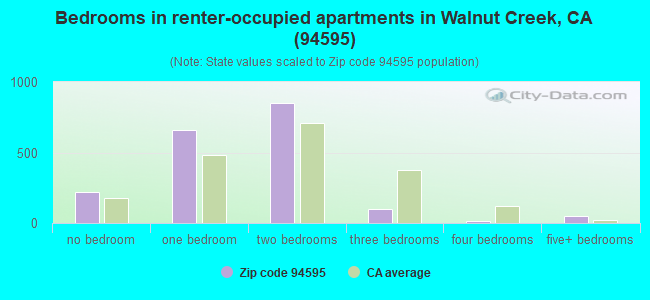
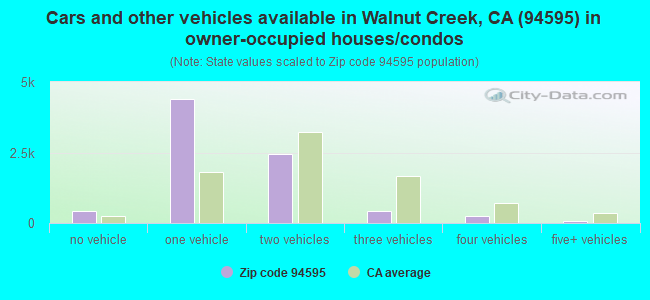
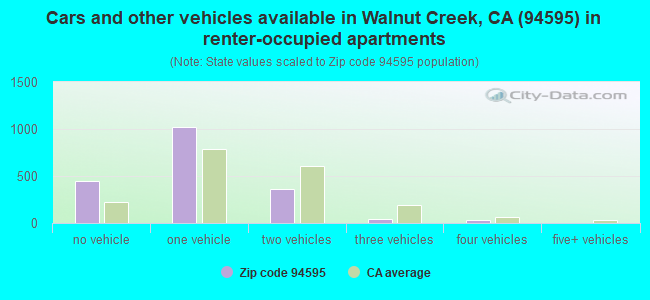
Houses and condos: 10,214 Renter-occupied apartments: 1,889
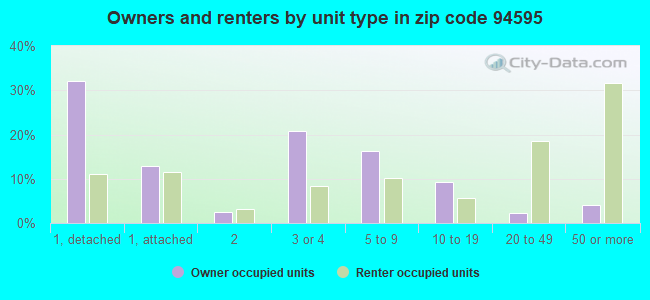
% of renters here:
19%
State:
44%
March 2022 cost of living index in zip code 94595: 120.2 (high, U.S. average is 100)
Land area: 5.4 sq. mi. Water area: 0.0 sq. mi.
Population density: 3,197 people per square mile
(average).
OSM Map
General Map
Google Map
MSN Map
OSM Map
General Map
Google Map
MSN Map
OSM Map
General Map
Google Map
MSN Map
OSM Map
General Map
Google Map
MSN Map
Please wait while loading the map...
Real estate property taxes paid for housing units in 2022:
This zip code:
0.7% ($5,928)
California:
0.7% ($4,831)
Median real estate property taxes paid for housing units with mortgages in 2022: $7,459 (0.8%) Median real estate property taxes paid for housing units with no mortgage in 2022: $4,803 (0.7%)
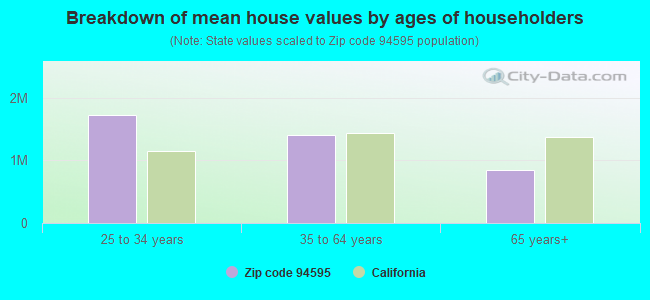
Estimated median house/condo value in 2022: $803,419
94595:
$803,419
California:
$715,900
According to our research of California and other state lists, there were 6 registered sex offenders living in 94595 zip code as of April 27, 2024. The ratio of all residents to sex offenders in zip code 94595 is 2,988 to 1. The ratio of registered sex offenders to all residents in this zip code is much lower than the state average.
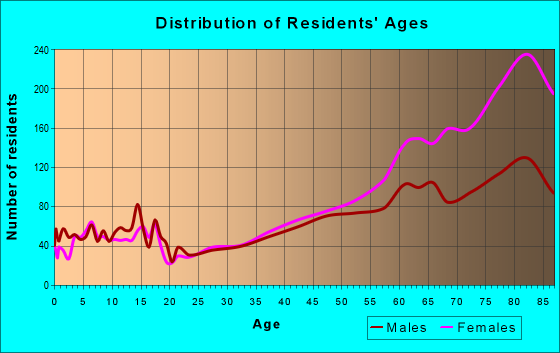
Median resident age:
This zip code:
70.0 years
California median age:
37.9 years
Average household size:
This zip code:
1.7 people
California:
2.8 people
Averages for the 2020 tax year for zip code 94595, filed in 2021:
Average Adjusted Gross Income (AGI) in 2020: $136,963 (Individual Income Tax Returns)
Here:
$136,963
State:
$95,910
Salary/wage: $133,844 (reported on 43.3% of returns)
Here:
$133,844
State:
$77,331
(% of AGI for various income ranges: 758.8% for AGIs below $25k, 2137.0% for AGIs $25k-50k, 3835.8% for AGIs $50k-75k, 5181.2% for AGIs $75k-100k, 11791.2% for AGIs $100k-200k, 93121.4% for AGIs over 200k)
Taxable interest for individuals: $2,700 (reported on 70.1% of returns)
This zip code:
$2,700
California:
$2,294
(% of AGI for various income ranges: 180.2% for AGIs below $25k, 199.1% for AGIs $25k-50k, 322.5% for AGIs $50k-75k, 371.5% for AGIs $75k-100k, 640.1% for AGIs $100k-200k, 1565.5% for AGIs over 200k)
Ordinary dividends: $12,978 (reported on 60.0% of returns)
Here:
$12,978
State:
$10,949
(% of AGI for various income ranges: 394.0% for AGIs below $25k, 697.7% for AGIs $25k-50k, 1012.2% for AGIs $50k-75k, 1656.3% for AGIs $75k-100k, 2586.2% for AGIs $100k-200k, 7624.3% for AGIs over 200k)
Net capital gain/loss in AGI: +$31,514 (reported on 56.2% of returns)
Here:
+$31,514
State:
+$49,306
(% of AGI for various income ranges: 73.8% for AGIs below $25k, 220.5% for AGIs $25k-50k, 574.4% for AGIs $50k-75k, 1079.8% for AGIs $75k-100k, 2557.6% for AGIs $100k-200k, 32884.8% for AGIs over 200k)
Profit/loss from business: +$31,509 (reported on 15.9% of returns)
Here:
+$31,509
State:
+$15,671
(% of AGI for various income ranges: 162.6% for AGIs below $25k, 397.4% for AGIs $25k-50k, 524.7% for AGIs $50k-75k, 425.0% for AGIs $75k-100k, 1385.5% for AGIs $100k-200k, 6580.7% for AGIs over 200k)
Taxable individual retirement arrangement distribution: $31,206 (reported on 33.2% of returns)
94595:
$31,206
California:
$23,505
(% of AGI for various income ranges: 466.6% for AGIs below $25k, 903.8% for AGIs $25k-50k, 1412.5% for AGIs $50k-75k, 2292.5% for AGIs $75k-100k, 4295.5% for AGIs $100k-200k, 8414.1% for AGIs over 200k)
Self-employed (Keogh) retirement plans: $25,279 (reported on 2.4% of returns)
94595:
$25,279
California:
$30,163
(% of AGI for various income ranges: 58.8% for AGIs $25k-50k, 46.7% for AGIs $75k-100k, 142.0% for AGIs $100k-200k, 958.0% for AGIs over 200k)
Total itemized deductions: $38,018 (reported on 31.4% of returns)
Here:
$38,018
State:
$39,517
(% of AGI for various income ranges: 701.2% for AGIs below $25k, 1152.6% for AGIs $25k-50k, 1555.9% for AGIs $50k-75k, 2487.1% for AGIs $75k-100k, 3821.2% for AGIs $100k-200k, 11719.1% for AGIs over 200k)
Charity contributions: $9,389 (reported on 27.1% of returns)
Here:
$9,389
State:
$12,598
(% of AGI for various income ranges: 36.1% for AGIs below $25k, 122.9% for AGIs $25k-50k, 165.6% for AGIs $50k-75k, 319.0% for AGIs $75k-100k, 595.0% for AGIs $100k-200k, 3792.3% for AGIs over 200k)
Taxes paid: $8,637 (reported on 31.4% of returns)
94595:
$8,637
State:
$8,807
(% of AGI for various income ranges: 127.8% for AGIs below $25k, 240.8% for AGIs $25k-50k, 376.1% for AGIs $50k-75k, 590.2% for AGIs $75k-100k, 1006.6% for AGIs $100k-200k, 2420.9% for AGIs over 200k)
Earned income credit: $943 (reported on 2.1% of returns)
Here:
$943
State:
$2,074
(% of AGI for various income ranges: 16.4% for AGIs below $25k, 10.2% for AGIs $25k-50k)
Percentage of individuals using paid preparers for their 2020 taxes: 91.5%
Here:
92%
State:
92%
(% for various income ranges: 87.9% for AGIs below $25k, 90.5% for AGIs $25k-50k, 91.8% for AGIs $50k-75k, 92.6% for AGIs $75k-100k, 92.1% for AGIs $100k-200k, 94.5% for AGIs over 200k)
Averages for the 2012 tax year for zip code 94595, filed in 2013:
Average Adjusted Gross Income (AGI) in 2012: $95,946 (Individual Income Tax Returns)
Here:
$95,946
State:
$72,726
Salary/wage: $88,668 (reported on 44.4% of returns)
Here:
$88,668
State:
$59,079
(% of AGI for various income ranges: 29.8% for AGIs below $25k, 28.3% for AGIs $25k-50k, 27.9% for AGIs $50k-75k, 29.8% for AGIs $75k-100k, 43.5% for AGIs $100k-200k, 48.3% for AGIs over 200k)
Taxable interest for individuals: $2,901 (reported on 70.5% of returns)
This zip code:
$2,901
California:
$2,146
(% of AGI for various income ranges: 6.3% for AGIs below $25k, 3.5% for AGIs $25k-50k, 2.9% for AGIs $50k-75k, 2.7% for AGIs $75k-100k, 2.1% for AGIs $100k-200k, 1.3% for AGIs over 200k)
Ordinary dividends: $12,801 (reported on 57.8% of returns)
Here:
$12,801
State:
$9,308
(% of AGI for various income ranges: 13.2% for AGIs below $25k, 9.4% for AGIs $25k-50k, 7.8% for AGIs $50k-75k, 8.2% for AGIs $75k-100k, 6.6% for AGIs $100k-200k, 7.7% for AGIs over 200k)
Net capital gain/loss in AGI: +$12,206 (reported on 53.5% of returns)
Here:
+$12,206
State:
+$30,460
(% of AGI for various income ranges: 0.7% for AGIs $25k-50k, 1.0% for AGIs $50k-75k, 2.8% for AGIs $75k-100k, 3.2% for AGIs $100k-200k, 13.4% for AGIs over 200k)
Profit/loss from business: +$27,583 (reported on 15.7% of returns)
Here:
+$27,583
State:
+$17,064
(% of AGI for various income ranges: 10.1% for AGIs below $25k, 4.1% for AGIs $25k-50k, 4.0% for AGIs $50k-75k, 3.3% for AGIs $75k-100k, 4.7% for AGIs $100k-200k, 4.5% for AGIs over 200k)
Taxable individual retirement arrangement distribution: $22,636 (reported on 38.0% of returns)
94595:
$22,636
California:
$19,557
(% of AGI for various income ranges: 15.2% for AGIs below $25k, 10.6% for AGIs $25k-50k, 11.0% for AGIs $50k-75k, 11.1% for AGIs $75k-100k, 10.6% for AGIs $100k-200k, 6.1% for AGIs over 200k)
Self-employment retirement plans: $20,482 (reported on 2.2% of returns)
94595:
$20,482
California:
$24,530
(% of AGI for various income ranges: 0.4% for AGIs below $25k, 0.5% for AGIs $50k-75k, 0.4% for AGIs $100k-200k, 0.7% for AGIs over 200k)
Total itemized deductions: $32,204 (23% of AGI, reported on 57.0% of returns)
Here:
$32,204
State:
$34,004
Here:
23.3% of AGI
State:
22.7% of AGI
(% of AGI for various income ranges: 40.2% for AGIs below $25k, 21.2% for AGIs $25k-50k, 19.6% for AGIs $50k-75k, 19.3% for AGIs $75k-100k, 19.6% for AGIs $100k-200k, 16.7% for AGIs over 200k)
Charity contributions: $4,042 (reported on 50.4% of returns)
Here:
$4,042
State:
$4,659
(% of AGI for various income ranges: 2.3% for AGIs below $25k, 2.3% for AGIs $25k-50k, 2.1% for AGIs $50k-75k, 2.2% for AGIs $75k-100k, 2.1% for AGIs $100k-200k, 2.1% for AGIs over 200k)
Taxes paid: $12,849 (reported on 56.9% of returns)
94595:
$12,849
State:
$14,448
(% of AGI for various income ranges: 7.2% for AGIs below $25k, 4.8% for AGIs $25k-50k, 5.2% for AGIs $50k-75k, 6.1% for AGIs $75k-100k, 7.9% for AGIs $100k-200k, 8.9% for AGIs over 200k)
Earned income credit: $1,038 (reported on 2.4% of returns)
Here:
$1,038
State:
$2,286
(% of AGI for various income ranges: 0.6% for AGIs below $25k, 0.1% for AGIs $25k-50k)
Percentage of individuals using paid preparers for their 2012 taxes: 60.8%
Here:
61%
State:
64%
(% for various income ranges: 49.6% for AGIs below $25k, 56.5% for AGIs $25k-50k, 65.0% for AGIs $50k-75k, 67.9% for AGIs $75k-100k, 66.5% for AGIs $100k-200k, 72.0% for AGIs over 200k)
Averages for the 2004 tax year for zip code 94595, filed in 2005:
Average Adjusted Gross Income (AGI) in 2004: $74,445 (Individual Income Tax Returns)
Here:
$74,445
State:
$58,600
Salary/wage: $66,211 (reported on 40.4% of returns)
Here:
$66,211
State:
$49,455
(% of AGI for various income ranges: 90.8% for AGIs below $10k, 21.4% for AGIs $10k-25k, 28.7% for AGIs $25k-50k, 28.4% for AGIs $50k-75k, 34.9% for AGIs $75k-100k, 39.7% for AGIs over 100k)
Taxable interest for individuals: $4,770 (reported on 80.5% of returns)
This zip code:
$4,770
California:
$2,365
(% of AGI for various income ranges: 48.0% for AGIs below $10k, 12.9% for AGIs $10k-25k, 7.4% for AGIs $25k-50k, 6.5% for AGIs $50k-75k, 5.1% for AGIs $75k-100k, 3.6% for AGIs over 100k)
Taxable dividends: $7,982 (reported on 66.7% of returns)
Here:
$7,982
State:
$4,746
(% of AGI for various income ranges: 47.9% for AGIs below $10k, 13.9% for AGIs $10k-25k, 10.0% for AGIs $25k-50k, 8.8% for AGIs $50k-75k, 8.3% for AGIs $75k-100k, 5.3% for AGIs over 100k)
Net capital gain/loss: +$17,477 (reported on 58.6% of returns)
Here:
+$17,477
State:
+$23,418
(% of AGI for various income ranges: -15.4% for AGIs below $10k, -2.5% for AGIs $10k-25k, 1.6% for AGIs $25k-50k, 2.5% for AGIs $50k-75k, 3.9% for AGIs $75k-100k, 21.7% for AGIs over 100k)
Profit/loss from business: +$25,184 (reported on 14.5% of returns)
Here:
+$25,184
State:
+$16,826
(% of AGI for various income ranges: 10.4% for AGIs below $10k, 4.9% for AGIs $10k-25k, 4.9% for AGIs $25k-50k, 4.7% for AGIs $50k-75k, 3.6% for AGIs $75k-100k, 5.2% for AGIs over 100k)
IRA payment deduction: $3,341 (reported on 2.6% of returns)
94595:
$3,341
California:
$3,192
(% of AGI for various income ranges: 0.3% for AGIs $10k-25k, 0.2% for AGIs $25k-50k, 0.2% for AGIs $50k-75k, 0.1% for AGIs $75k-100k, 0.1% for AGIs over 100k)
Self-employed pension: $15,587 (reported on 2.6% of returns)
Here:
$15,587
California:
$17,688
(% of AGI for various income ranges: 0.3% for AGIs $10k-25k, 0.1% for AGIs $25k-50k, 0.4% for AGIs $50k-75k, 0.4% for AGIs $75k-100k, 0.7% for AGIs over 100k)
Total itemized deductions: $27,063 (25% of AGI, reported on 54.8% of returns)
Here:
$27,063
State:
$28,113
Here:
25.1% of AGI
State:
25.3% of AGI
(% of AGI for various income ranges: 110.1% for AGIs below $10k, 29.4% for AGIs $10k-25k, 19.8% for AGIs $25k-50k, 20.5% for AGIs $50k-75k, 20.7% for AGIs $75k-100k, 18.4% for AGIs over 100k)
Charity contributions deductions: $4,592 (4% of AGI, reported on 49.9% of returns)
Here:
$4,592
State:
$3,923
Here:
4.1% of AGI
State:
3.3% of AGI
(% of AGI for various income ranges: 5.9% for AGIs below $10k, 2.6% for AGIs $10k-25k, 2.3% for AGIs $25k-50k, 2.7% for AGIs $50k-75k, 3.2% for AGIs $75k-100k, 3.3% for AGIs over 100k)
Total tax: $12,454 (reported on 85.0% of returns)
94595:
$12,454
State:
$10,761
(% of AGI for various income ranges: 5.8% for AGIs below $10k, 4.0% for AGIs $10k-25k, 8.4% for AGIs $25k-50k, 10.8% for AGIs $50k-75k, 11.4% for AGIs $75k-100k, 17.3% for AGIs over 100k)
Earned income credit: $985 (reported on 2.0% of returns)
Here:
$985
State:
$1,763
Percentage of individuals using paid preparers for their 2004 taxes: 69.6%
Here:
70%
State:
66%
(% for various income ranges: 58.7% for AGIs below $10k, 69.7% for AGIs $10k-25k, 69.2% for AGIs $25k-50k, 72.2% for AGIs $50k-75k, 71.5% for AGIs $75k-100k, 74.1% for AGIs over 100k)
Likely homosexual households (counted as self-reported same-sex unmarried-partner households)
Lesbian couples: 0.0% of all households
Gay men: 0.4% of all households
Household received Food Stamps/SNAP in the past 12 months: 98 Household did not receive Food Stamps/SNAP in the past 12 months: 9,412
Women who had a birth in the past 12 months: 194 (144 now married, 49 unmarried) Women who did not have a birth in the past 12 months: 1,574 (801 now married, 765 unmarried)
Housing units in zip code 94595 with a mortgage: 3,249 (319 second mortgage, 14 home equity loan, 246 both second mortgage and home equity loan) Houses without a mortgage: 48
Median monthly owner costs for units with a mortgage: $3,073 Median monthly owner costs for units without a mortgage: $1,467
Residents with income below the poverty level in 2022:
This zip code:
3.9%
Whole state:
12.2%
Residents with income below 50% of the poverty level in 2022:
This zip code:
1.9%
Whole state:
6.2%
Median number of rooms in houses and condos:
Here:
5.2
State:
6.0
Median number of rooms in apartments:
Here:
3.4
State:
3.9
Notable locations in this zip code not listed on our city pages
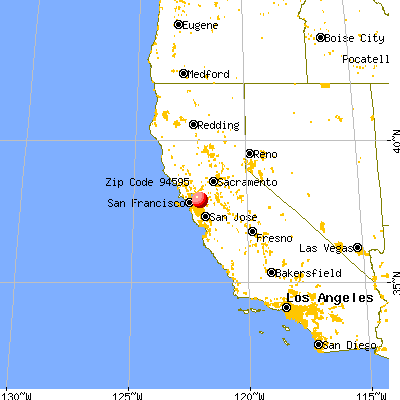
Notable locations in zip code 94595: Rossmoor Walnut Creek Golf Course (A), Tice Pumping Plant (B), Contra Costa County Fire Protection District Station 3 (C). Display/hide their locations on the map
In group quarters: 577 (-1 institutionalized population)
Size of family households: 3,016 2-persons, 479 3-persons, 609 4-persons, 117 5-persons, 56 6-persons, 14 7-or-more-persons
Size of nonfamily households: 5,187 1-person, 367 2-persons, 21 3-persons
1,451 married couples with children.
234 single-parent households (22 men, 212 women).
84.2% of residents of 94595 zip code speak English at home.
4.1% of residents speak Spanish at home (87% very well, 8% well, 5% not well).
5.4% of residents speak other Indo-European language at home (82% very well, 9% well, 6% not well, 3% not at all).
8.3% of residents speak Asian or Pacific Island language at home (54% very well, 31% well, 14% not well, 2% not at all).
0.2% of residents speak other language at home (49% very well, 39% well, 12% not at all).
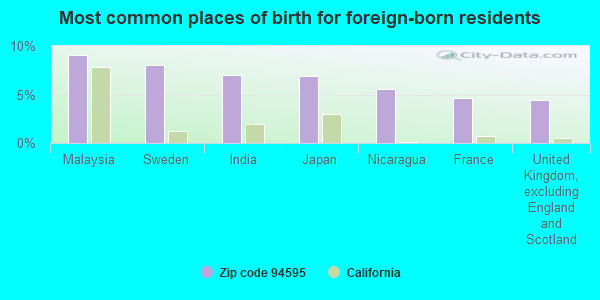
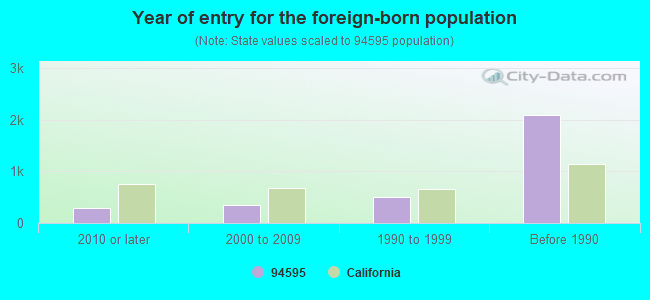
Foreign born population: 2,984 (17.4%) (83.7% of them are naturalized citizens)
Facilities with environmental interests located in this zip code:
MIRACLE AUTO PAINTING (1075 BOULEVARD WAY in WALNUT CREEK, CA)
STATE MASTER (California - Hazardous Waste Tracking) - HAZARDOU WASTE PROGRAM CRITERIA AND HAZARDOUS AIR POLLUTANT INVENTORY (Inventory of air pollution sources) Small Quantity Generators, between 100 kg and 1000 kg of hazardous waste/month (Resource Conservation and Recovery Act (tracking hazardous waste)) - notification Business SIC classification: TOP, BODY, AND UPHOLSTERY REPAIR SHOPS AND PAINT SHOPS Business NAICS classification: AUTOMOTIVE BODY, PAINT, AND INTERIOR REPAIR AND MAINTENANCE. Organizations: MULTIPLE ALLIED SVCS INC (CONTACT/OWNER)
CHEVRON STATION NO 92709 (1998 TICE VALLEY BLVD in WALNUT CREEK, CA)
STATE MASTER (California - Hazardous Waste Tracking) - HAZARDOU WASTE PROGRAM Small Quantity Generators, between 100 kg and 1000 kg of hazardous waste/month (Resource Conservation and Recovery Act (tracking hazardous waste)) - notification Organizations: CHEVRON PRODUCTS CO (CONTACT/OWNER)
CALTRANS DISTRICT 4 (2616 N MAIN ST in WALNUT CREEK, CA)
STATE MASTER (California - Hazardous Waste Tracking) - HAZARDOU WASTE PROGRAM Small Quantity Generators, between 100 kg and 1000 kg of hazardous waste/month (Resource Conservation and Recovery Act (tracking hazardous waste))
EBMUD PLEASANT HILL RESERVOIR (1480 PLEASANT HILL ROAD in WALNUT CREEK, CA)
Large Quantity Generators, more that 1000 kg of hazardous waste/month (Resource Conservation and Recovery Act (tracking hazardous waste)) Organizations: EAST BAY MUNICIPAL UTILITY DISTRICT (CONTACT/OPERATOR)
, EAST BAY MUNICIPAL UTILITY (CONTACT/OWNER)
AMERICAN CLEANERS (2400 OLYMPIC BOULEVARD in WALNUT CREEK, CA)
CRITERIA AND HAZARDOUS AIR POLLUTANT INVENTORY (Inventory of air pollution sources) Small Quantity Generators, between 100 kg and 1000 kg of hazardous waste/month (Resource Conservation and Recovery Act (tracking hazardous waste)) - notification Business SIC classification: DRYCLEANING PLANTS, EXCEPT RUG CLEANING Organizations: RAMIN HALAUITI (CONTACT/OWNER)
Alternative names: DRY CLEAN USA, DRYCLEAN USA
GOLDEN WEST BUILDERS (2363 BOULEVARD CIRCLE STE 103 in WALNUT CREEK, CA)
TRANSPORTER (Resource Conservation and Recovery Act (tracking hazardous waste)) Organizations: D B NEFF CORP (CONTACT/OWNER)
EAST BAY MUNICIPAL UTILITY DIS (2055 DANVILLE BOULEVARD in WALNUT CREEK, CA)
CRITERIA AND HAZARDOUS AIR POLLUTANT INVENTORY (Inventory of air pollution sources) Business SIC classification: AIR AND WATER RESOURCE AND SOLID WASTE MANAGEMENT
HULL'S WALNUT CREEK CHAPEL (1139 SARANAP AVENUE in WALNUT CREEK, CA)
CRITERIA AND HAZARDOUS AIR POLLUTANT INVENTORY (Inventory of air pollution sources) Business SIC classification: FUNERAL SERVICE AND CREMATORIES
JEWISH COMMUNITY CENTER (2071 TICE VALLEY BLVD in WALNUT CREEK, CA)
COMPLIANCE ACTIVITY (Tracking inspections of insecticide, fungicide, and rodenticide, and toxic substances)
LAFAYETTE WOODWORKING (1116 SARANAP AVENUE in WALNUT CREEK, CA)
CRITERIA AND HAZARDOUS AIR POLLUTANT INVENTORY (Inventory of air pollution sources) Business SIC classification: FURNITURE AND FIXTURES
MOUNT DIABLO STATE PARK DISPOSAL SITE (MOUNT DIABLO STATE PARK in WALNUT CREEK, CA)
CRITERIA AND HAZARDOUS AIR POLLUTANT INVENTORY (Inventory of air pollution sources) Business SIC classification: REFUSE SYSTEMS Business NAICS classification: SOLID WASTE LANDFILL.
Housing units lacking complete plumbing facilities: 0.1% Housing units lacking complete kitchen facilities: 1.0%
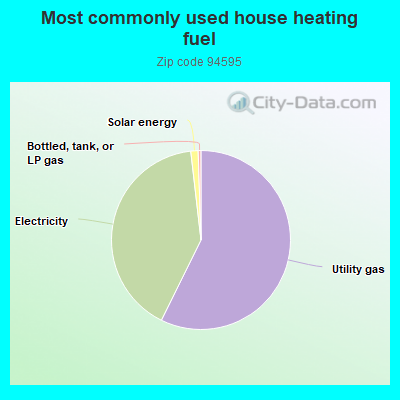
56.8%Utility gas
40.5%Electricity
1.3%Solar energy
0.5%Bottled, tank, or LP gas
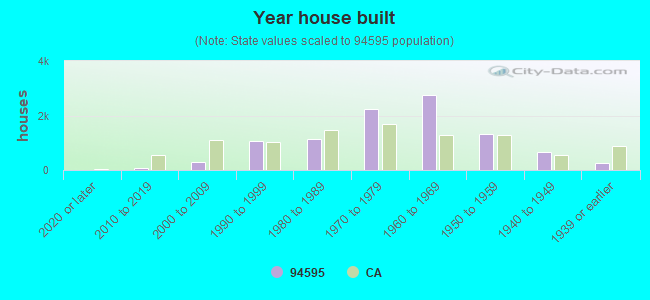
Population in 1990: 16,346. Population change in the 1990s: +1,673 (+10.2%).
Place of birth for U.S.-born residents:
This state: 7,682
Northeast: 2,177
Midwest: 2,289
South: 804
West: 766
60% of the 94595 zip code residents lived in the same house 5 years ago. Out of people who lived in different houses, 53% lived in this county. Out of people who lived in different counties, 50% lived in California.
88% of the 94595 zip code residents lived in the same house 1 year ago. Out of people who lived in different houses, 43% moved from this county. Out of people who lived in different houses, 42% moved from different county within same state. Out of people who lived in different houses, 14% moved from different state.
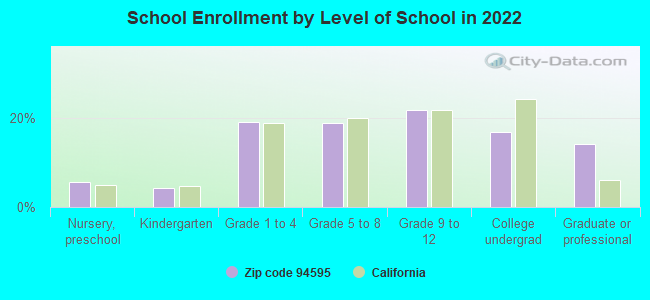
Private vs. public school enrollment:
Students in private schools in grades 1 to 8 (elementary and middle school): 122
Here:
16.3%
California:
10.5%
Students in private schools in grades 9 to 12 (high school): 31
Here:
7.4%
California:
8.5%
Students in private undergraduate colleges: 64
Here:
19.6%
California:
15.9%
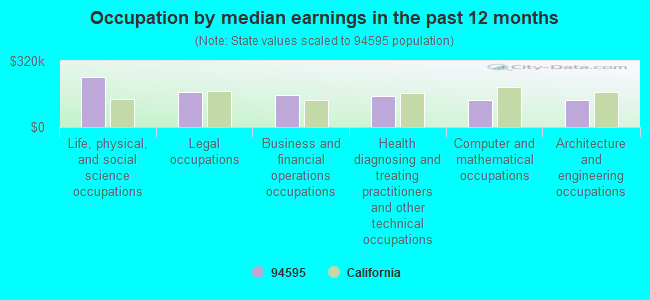
Occupation by median earnings in the past 12 months ($)
242,578Life, physical, and social science occupations
167,648Legal occupations
156,269Business and financial operations occupations
148,746Health diagnosing and treating practitioners and other technical occupations
129,251Computer and mathematical occupations
128,935Architecture and engineering occupations
Companies with federal contracts located in this zip code:
HERDER, MICHAEL P (134 PTARMIGAN DR 4 in WALNUT CREEK, CA; small business) : $41,700 in 4 contractsfrom 2000 to 2003
$100,000 with Geological Survey for Other Professional Services. Taking place in VA. Signed on 2000-04-15. Completion date: 2000-10-15.
$0, same as above.Signed on 2003-06-15. Completion date: 2000-10-15.
-$300, same as above.Signed on 2003-06-15. Completion date: 2000-10-15.
-$58,000, same as above.Signed on 2000-06-15. Completion date: 2000-10-15.
FRED DILLETT & ASSOCIATES INC (2509 CABALLO RANCHO DR in WALNUT CREEK, CA; small business) : $18,000 in 2 contractsin 2000
$18,000 with Federal Bureau of Investigation for Installation of Equipment -- Communication, Detection, and Coherent Radiation Equipment. Signed on 2000-09-15. Completion date: 2000-09-15.
$0, same as above.Signed on 2000-09-15. Completion date: 2000-09-15.
BALES SCIENTIFIC INC (1620 TICE VALLEY BLVD in WALNUT CREEK, CA; small business) : $0 in 2 contractsfrom 2000 to 2002
$90,000 with Navy for Photographic Equipment and Accessories. Signed on 2000-10-25. Completion date: 2001-09-28.
-$90,000, same as above.Signed on 2002-02-14. Completion date: 2001-09-28.
Top industries in this zip code by the number of employees in 2005:
Health Care and Social Assistance: Nursing Care Facilities (100-249 employees: 3 establishments)
Real Estate and Rental and Leasing: Nonresidential Property Managers (250-499: 1)
Health Care and Social Assistance: Services for the Elderly and Persons with Disabilities (100-249: 2, 10-19: 1)
Health Care and Social Assistance: Other Individual and Family Services (50-99: 1, 20-49: 1, 1-4: 1)
Health Care and Social Assistance: Offices of Physicians (except Mental Health Specialists) (50-99: 1, 5-9: 2, 1-4: 8)
Health Care and Social Assistance: Homes for the Elderly (50-99: 1, 10-19: 1, 1-4: 4)
Accommodation and Food Services: Food Service Contractors (50-99: 1, 10-19: 1, 1-4: 1)
Health Care and Social Assistance: Offices of Dentists (20-49: 1, 10-19: 1, 5-9: 3, 1-4: 4)
People in group quarters in 2010:
449 people in nursing facilities/skilled-nursing facilities
27 people in workers' group living quarters and job corps centers
9 people in in-patient hospice facilities
People in group quarters in 2000:
245 people in nursing homes
121 people in other noninstitutional group quarters
100 people in other group homes
3 people in religious group quarters
Fatal accident statistics in 2011:
Fatal accident count: 1
Vehicles involved in fatal accidents: 2
Fatal accidents caused by drunken drivers: 0
Fatalities: 1
Persons involved in fatal accidents: 3
Pedestrians involved in fatal accidents: 1
Fatal accident statistics in 2010:
Fatal accident count: 1
Vehicles involved in fatal accidents: 1
Fatal accidents caused by drunken drivers: 0
Fatalities: 1
Persons involved in fatal accidents: 1
Pedestrians involved in fatal accidents: 0
Home Mortgage Disclosure Act Aggregated Statistics For Year 2009 (Based on 2 full and 8 partial tracts)
A) FHA, FSA/RHS & VA Home Purchase Loans
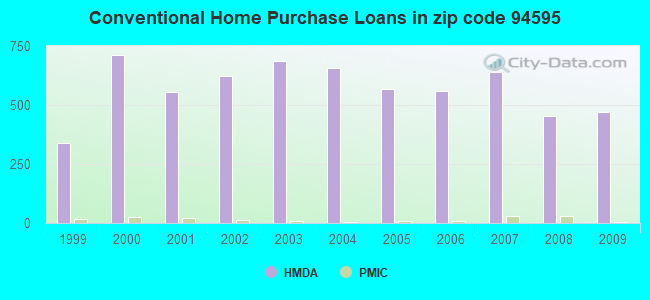
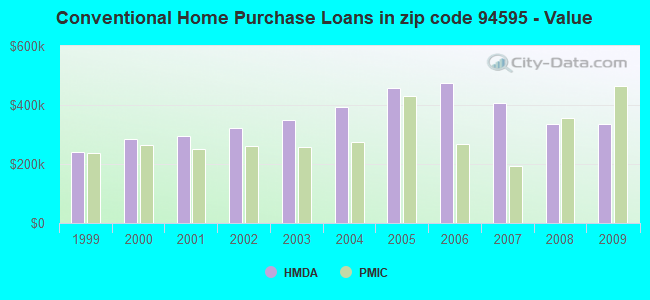
B) Conventional Home Purchase Loans
C) Refinancings
D) Home Improvement Loans
F) Non-occupant Loans on < 5 Family Dwellings (A B C & D)
Number
Average Value
Number
Average Value
Number
Average Value
Number
Average Value
Number
Average Value
LOANS ORIGINATED
50
$370,916
471
$334,992
1,392
$367,093
56
$236,128
73
$316,971
APPLICATIONS APPROVED, NOT ACCEPTED
6
$280,795
39
$447,356
132
$418,887
5
$353,822
10
$204,704
APPLICATIONS DENIED
6
$437,408
67
$452,647
341
$425,800
14
$168,474
25
$306,158
APPLICATIONS WITHDRAWN
6
$533,450
33
$426,800
189
$375,444
10
$324,581
3
$260,513
FILES CLOSED FOR INCOMPLETENESS
1
$423,550
11
$389,691
54
$387,248
8
$244,050
5
$287,736
Aggregated Statistics For Year 2008 (Based on 2 full and 8 partial tracts)
A) FHA, FSA/RHS & VA Home Purchase Loans
B) Conventional Home Purchase Loans
C) Refinancings
D) Home Improvement Loans
E) Loans on Dwellings For 5+ Families
F) Non-occupant Loans on < 5 Family Dwellings (A B C & D)
Number
Average Value
Number
Average Value
Number
Average Value
Number
Average Value
Number
Average Value
Number
Average Value
LOANS ORIGINATED
13
$478,688
455
$335,676
437
$404,217
43
$204,397
1
$37,689,140
59
$310,784
APPLICATIONS APPROVED, NOT ACCEPTED
3
$418,427
58
$466,242
94
$378,935
18
$219,570
0
$0
11
$351,123
APPLICATIONS DENIED
1
$996,350
59
$530,395
158
$521,518
19
$261,328
0
$0
15
$558,228
APPLICATIONS WITHDRAWN
4
$466,068
44
$458,357
110
$414,643
10
$198,769
0
$0
9
$304,427
FILES CLOSED FOR INCOMPLETENESS
0
$0
8
$514,915
27
$528,590
7
$208,263
0
$0
0
$0
Aggregated Statistics For Year 2007 (Based on 2 full and 8 partial tracts)
B) Conventional Home Purchase Loans
C) Refinancings
D) Home Improvement Loans
F) Non-occupant Loans on < 5 Family Dwellings (A B C & D)
Number
Average Value
Number
Average Value
Number
Average Value
Number
Average Value
LOANS ORIGINATED
640
$407,397
605
$451,643
100
$338,468
110
$296,620
APPLICATIONS APPROVED, NOT ACCEPTED
106
$512,844
113
$449,450
13
$340,339
21
$537,737
APPLICATIONS DENIED
64
$542,333
156
$523,603
28
$386,462
21
$541,995
APPLICATIONS WITHDRAWN
46
$390,850
102
$549,501
10
$249,626
14
$525,789
FILES CLOSED FOR INCOMPLETENESS
11
$437,424
38
$478,066
9
$348,283
2
$184,705
Aggregated Statistics For Year 2006 (Based on 2 full and 8 partial tracts)
B) Conventional Home Purchase Loans
C) Refinancings
D) Home Improvement Loans
E) Loans on Dwellings For 5+ Families
F) Non-occupant Loans on < 5 Family Dwellings (A B C & D)
Number
Average Value
Number
Average Value
Number
Average Value
Number
Average Value
Number
Average Value
LOANS ORIGINATED
561
$473,657
740
$454,858
122
$316,516
1
$29,128,070
119
$407,080
APPLICATIONS APPROVED, NOT ACCEPTED
51
$516,626
127
$463,579
9
$255,541
0
$0
11
$498,215
APPLICATIONS DENIED
88
$639,310
138
$509,180
29
$296,804
0
$0
19
$548,325
APPLICATIONS WITHDRAWN
39
$579,370
113
$400,443
11
$244,380
0
$0
10
$372,074
FILES CLOSED FOR INCOMPLETENESS
5
$393,164
40
$498,494
7
$225,961
0
$0
12
$323,268
Aggregated Statistics For Year 2005 (Based on 2 full and 8 partial tracts)
B) Conventional Home Purchase Loans
C) Refinancings
D) Home Improvement Loans
E) Loans on Dwellings For 5+ Families
F) Non-occupant Loans on < 5 Family Dwellings (A B C & D)
G) Loans On Manufactured Home Dwelling (A B C & D)
Number
Average Value
Number
Average Value
Number
Average Value
Number
Average Value
Number
Average Value
Number
Average Value
LOANS ORIGINATED
569
$459,018
878
$449,701
93
$367,353
3
$2,078,933
144
$398,491
0
$0
APPLICATIONS APPROVED, NOT ACCEPTED
75
$438,852
127
$378,009
8
$404,481
0
$0
14
$259,283
4
$88,358
APPLICATIONS DENIED
74
$452,129
150
$427,423
22
$358,788
0
$0
22
$376,490
1
$145,220
APPLICATIONS WITHDRAWN
55
$516,510
169
$460,716
22
$254,098
0
$0
10
$498,889
0
$0
FILES CLOSED FOR INCOMPLETENESS
7
$268,204
30
$464,199
2
$129,350
0
$0
5
$352,956
0
$0
Aggregated Statistics For Year 2004 (Based on 2 full and 8 partial tracts)
B) Conventional Home Purchase Loans
C) Refinancings
D) Home Improvement Loans
E) Loans on Dwellings For 5+ Families
F) Non-occupant Loans on < 5 Family Dwellings (A B C & D)
G) Loans On Manufactured Home Dwelling (A B C & D)
Number
Average Value
Number
Average Value
Number
Average Value
Number
Average Value
Number
Average Value
Number
Average Value
LOANS ORIGINATED
655
$393,481
1,186
$388,574
81
$290,669
1
$5,654,400
104
$307,065
0
$0
APPLICATIONS APPROVED, NOT ACCEPTED
93
$415,247
166
$404,633
9
$238,392
2
$3,993,600
19
$276,334
0
$0
APPLICATIONS DENIED
89
$448,659
204
$420,655
34
$300,396
1
$1,344,600
29
$297,271
4
$30,642
APPLICATIONS WITHDRAWN
51
$477,508
211
$398,856
11
$297,745
0
$0
16
$355,632
0
$0
FILES CLOSED FOR INCOMPLETENESS
11
$508,177
44
$441,319
0
$0
0
$0
6
$481,775
0
$0
Aggregated Statistics For Year 2003 (Based on 2 full and 8 partial tracts)
A) FHA, FSA/RHS & VA Home Purchase Loans
B) Conventional Home Purchase Loans
C) Refinancings
D) Home Improvement Loans
E) Loans on Dwellings For 5+ Families
F) Non-occupant Loans on < 5 Family Dwellings (A B C & D)
Number
Average Value
Number
Average Value
Number
Average Value
Number
Average Value
Number
Average Value
Number
Average Value
LOANS ORIGINATED
0
$0
687
$349,461
3,116
$330,885
30
$97,516
3
$1,955,950
161
$250,336
APPLICATIONS APPROVED, NOT ACCEPTED
0
$0
75
$388,706
387
$347,500
11
$40,189
0
$0
22
$313,701
APPLICATIONS DENIED
1
$340,680
51
$415,195
358
$373,742
12
$112,009
1
$31,099,200
37
$316,455
APPLICATIONS WITHDRAWN
0
$0
49
$431,441
412
$311,495
4
$60,395
0
$0
9
$184,204
FILES CLOSED FOR INCOMPLETENESS
0
$0
17
$514,658
93
$356,716
0
$0
1
$2,982,700
10
$270,526
Aggregated Statistics For Year 2002 (Based on 2 full and 8 partial tracts)
A) FHA, FSA/RHS & VA Home Purchase Loans
B) Conventional Home Purchase Loans
C) Refinancings
D) Home Improvement Loans
E) Loans on Dwellings For 5+ Families
F) Non-occupant Loans on < 5 Family Dwellings (A B C & D)
Number
Average Value
Number
Average Value
Number
Average Value
Number
Average Value
Number
Average Value
Number
Average Value
LOANS ORIGINATED
3
$79,633
625
$323,161
2,396
$313,611
33
$155,786
1
$3,534,000
112
$251,298
APPLICATIONS APPROVED, NOT ACCEPTED
0
$0
67
$371,216
263
$317,671
4
$83,505
0
$0
9
$309,253
APPLICATIONS DENIED
0
$0
47
$282,124
211
$309,225
12
$94,203
0
$0
10
$192,605
APPLICATIONS WITHDRAWN
1
$229,000
61
$359,902
276
$287,472
10
$49,950
1
$169,060
11
$288,927
FILES CLOSED FOR INCOMPLETENESS
0
$0
16
$313,655
81
$344,574
0
$0
0
$0
1
$360,470
Aggregated Statistics For Year 2001 (Based on 2 full and 8 partial tracts)
A) FHA, FSA/RHS & VA Home Purchase Loans
B) Conventional Home Purchase Loans
C) Refinancings
D) Home Improvement Loans
E) Loans on Dwellings For 5+ Families
F) Non-occupant Loans on < 5 Family Dwellings (A B C & D)
Number
Average Value
Number
Average Value
Number
Average Value
Number
Average Value
Number
Average Value
Number
Average Value
LOANS ORIGINATED
4
$200,025
554
$295,033
1,466
$304,525
82
$80,736
3
$4,777,967
104
$242,818
APPLICATIONS APPROVED, NOT ACCEPTED
6
$122,138
68
$293,645
216
$329,488
24
$107,002
0
$0
10
$244,054
APPLICATIONS DENIED
0
$0
51
$223,033
147
$300,910
24
$74,674
0
$0
9
$248,569
APPLICATIONS WITHDRAWN
3
$224,433
55
$266,892
208
$287,079
14
$93,993
0
$0
14
$218,202
FILES CLOSED FOR INCOMPLETENESS
0
$0
29
$260,002
79
$329,015
7
$69,590
0
$0
3
$198,293
Aggregated Statistics For Year 2000 (Based on 2 full and 8 partial tracts)
A) FHA, FSA/RHS & VA Home Purchase Loans
B) Conventional Home Purchase Loans
C) Refinancings
D) Home Improvement Loans
E) Loans on Dwellings For 5+ Families
F) Non-occupant Loans on < 5 Family Dwellings (A B C & D)
Number
Average Value
Number
Average Value
Number
Average Value
Number
Average Value
Number
Average Value
Number
Average Value
LOANS ORIGINATED
1
$254,960
712
$284,641
311
$246,303
89
$54,033
1
$3,675,360
57
$266,491
APPLICATIONS APPROVED, NOT ACCEPTED
0
$0
83
$257,293
45
$234,250
11
$59,522
1
$10,743,360
12
$247,978
APPLICATIONS DENIED
2
$131,790
68
$233,558
94
$211,501
17
$79,904
0
$0
14
$154,672
APPLICATIONS WITHDRAWN
0
$0
64
$242,477
77
$177,002
11
$50,028
0
$0
4
$169,882
FILES CLOSED FOR INCOMPLETENESS
2
$199,680
26
$297,615
22
$218,775
2
$20,635
0
$0
1
$518,090
Aggregated Statistics For Year 1999 (Based on 1 full and 4 partial tracts)
A) FHA, FSA/RHS & VA Home Purchase Loans
B) Conventional Home Purchase Loans
C) Refinancings
D) Home Improvement Loans
E) Loans on Dwellings For 5+ Families
F) Non-occupant Loans on < 5 Family Dwellings (A B C & D)


 Nearest zip codes: 94596, 94597, 94575, 94549, 94507, 94556.