Estates neighborhood in Concord, California (CA), 94520 detailed profile
Settings
X

Business Search - 14 Million verified businesses
Area: 0.174 square miles
Population: 1,259
Population density:
| Estates: | 7,240 people per square mile |
| Concord: | 4,069 people per square mile |

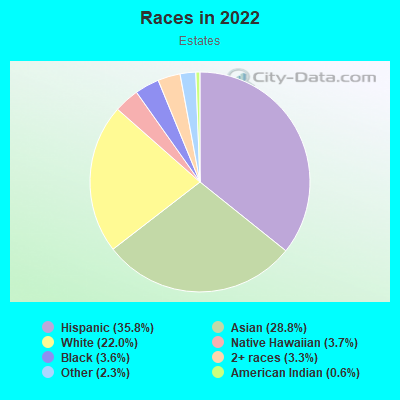
- 53142.2%Hispanic or Latino
- 28622.8%Black
- 18114.4%Asian
- 16112.8%White
- 987.8%Two or more races
Median household income in 2022:
| Estates: | $107,813 |
| Concord: | $104,523 |
Distribution of median household income
![Distribution of median household income]()
- 23Less than $10,000
- 47$20,000 to $29,999
- 38$30,000 to $39,999
- 89$40,000 to $49,999
- 28$50,000 to $59,999
- 25$60,000 to $74,999
- 69$75,000 to $99,999
- 66$100,000 to $124,999
- 74$125,000 to $149,999
- 56$150,000 to $199,999
- 83$200,000 or more

Distribution of owner-occupied house/condo value
![Distribution of owner-occupied house/condo value]()
- 26Less than $50,000
- 3$200,000 to $249,999
- 10$250,000 to $299,999
- 16$300,000 to $399,999
- 26$400,000 to $499,999
- 96$500,000 to $749,999
- 28$750,000 to $999,999
- 24$1,000,000 or more

Distribution of rent paid by renters
![Distribution of rent paid by renters]()
- 32$600 to $699
- 7$1,000 to $1,249
- 25$1,500 to $1,999
- 205$2,000 or more

Median rent in 2022:
| Estates: | $2,343 |
| Concord: | $1,824 |
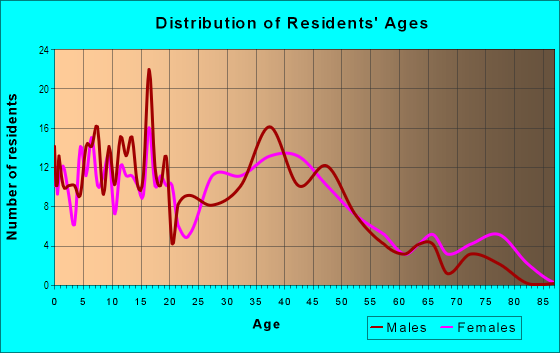
| Males: | 646 |
| Females: | 612 |
Males:
| This neighborhood: | 37.9 years |
| Whole city: | 38.7 years |
| This neighborhood: | 44.4 years |
| Whole city: | 43.1 years |
Average household size:
| Estates: | 38.0 people |
| Concord: | 2.6 people |
Percentage of family households:
| Estates: | 62.7% |
| Concord: | 49.2% |
| Here: | 60.2% |
| Concord: | 50.7% |
Percentage of married-couple families with children (among all households):
| Estates: | 31.7% |
| Concord: | 30.3% |
Percentage of single-mother households (among all households):
| Estates: | 10.0% |
| Concord: | 5.5% |
Percentage of never married males 15 years old and over:
Percentage of never married females 15 years old and over:
| Estates: | 22.8% |
| Concord: | 20.6% |
Percentage of never married females 15 years old and over:
| Estates: | 11.8% |
| city: | 13.6% |
Percentage of people that speak English not well or not at all:
| Estates: | 0.0% |
| Concord: | 9.7% |
Percentage of people born in this state:
Percentage of people born in another U.S. state:
Percentage of native residents but born outside the U.S.:
Percentage of foreign born residents:
| Here: | 64.9% |
| Concord: | 54.6% |
Percentage of people born in another U.S. state:
| Estates: | 10.9% |
| Concord: | 15.0% |
Percentage of native residents but born outside the U.S.:
| Here: | 1.3% |
| city: | 1.8% |
Percentage of foreign born residents:
| Here: | 23.0% |
| Concord: | 28.5% |
Owner-occupied
Renter-occupied

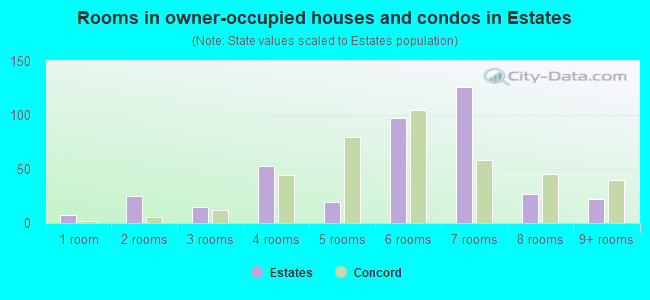
- Rooms in owner-occupied houses and condos in Estates
- 71 room
- 252 rooms
- 153 rooms
- 534 rooms
- 195 rooms
- 976 rooms
- 1267 rooms
- 278 rooms
- 229+ rooms
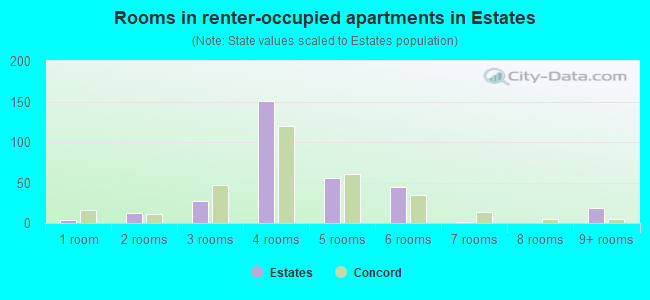
- Rooms in renter-occupied apartments in Estates
- 41 room
- 122 rooms
- 273 rooms
- 1514 rooms
- 555 rooms
- 446 rooms
- 17 rooms
- 08 rooms
- 189+ rooms
Owner-occupied
Renter-occupied
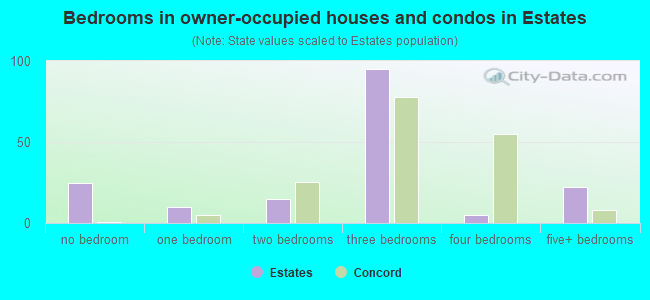
- Bedrooms in owner-occupied houses and condos in Estates
- 25no bedroom
- 101 bedroom
- 152 bedrooms
- 953 bedrooms
- 54 bedrooms
- 225+ bedrooms
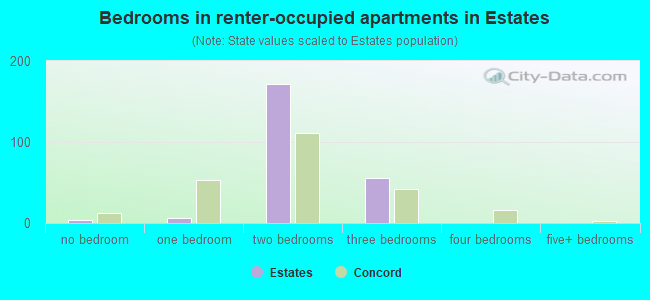
- Bedrooms in renter-occupied apartments in Estates
- 4no bedroom
- 61 bedroom
- 1722 bedrooms
- 553 bedrooms
- 04 bedrooms
- 05+ bedrooms
Average number of cars or other vehicles available in houses/condos:
Average number of cars or other vehicles available in apartments:
| This neighborhood: | 2.0 |
| Concord: | 2.0 |
Average number of cars or other vehicles available in apartments:
| Here: | 1.9 |
| city: | 1.8 |
Percentage of units with a mortgage:
| Estates: | 52.8% |
| Concord: | 74.7% |
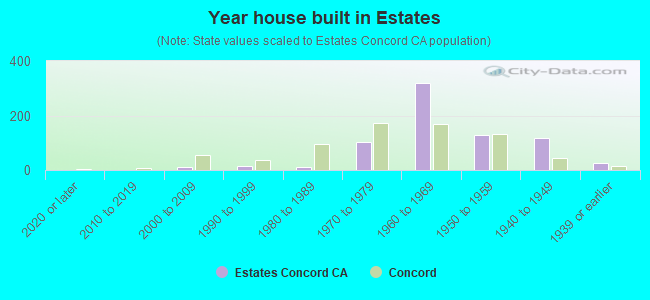
- Year house built in Estates
- 02020 or later
- 02010 to 2019
- 112000 to 2009
- 151990 to 1999
- 121980 to 1989
- 1031970 to 1979
- 3201960 to 1969
- 1281950 to 1959
- 1161940 to 1949
- 241939 or earlier
City-data.com crime index for city in 2020 (higher means more crime):
| City: | 247.0 |
| U.S. average: | 219.5 |
Travel time to work (commute)
![Travel time to work (commute)]()
- 8Less than 5 minutes
- 1225 to 9 minutes
- 22710 to 14 minutes
- 17515 to 19 minutes
- 13720 to 24 minutes
- 12525 to 29 minutes
- 7930 to 34 minutes
- 3635 to 39 minutes
- 12340 to 44 minutes
- 9945 to 59 minutes
- 9560 to 89 minutes
- 8690 or more minutes

Means of transportation to work
![Means of transportation to work]()
- 77.8%580Drove a car alone
- 4.2%31Carpooled
- 6.4%48Subway or elevated rail
- 2.4%18Long-distance train or commuter rail
- 4.4%33Motorcycle
- 11.0%82Walked
- 0.4%3Other means
- 11.4%85Worked at home

Time leaving home to go to work
![Time leaving home to go to work]()
- 7012:00 a.m. to 4:59 a.m.
- 545:00 a.m. to 5:29 a.m.
- 345:30 a.m. to 5:59 a.m.
- 1256:00 a.m. to 6:29 a.m.
- 1176:30 a.m. to 6:59 a.m.
- 2297:00 a.m. to 7:29 a.m.
- 1787:30 a.m. to 7:59 a.m.
- 1888:00 a.m. to 8:29 a.m.
- 928:30 a.m. to 8:59 a.m.
- 899:00 a.m. to 9:59 a.m.
- 6110:00 a.m. to 10:59 a.m.
- 2911:00 a.m. to 11:59 a.m.
- 15112:00 p.m. to 3:59 p.m.
- 134:00 p.m. to 11:59 p.m.

Occupations of males:
- Percentage of males in management occupations (except farmers):
Here: 2.4% city: 13.4%
- Percentage of males in business and financial operations occupations:
Here: 4.9% city: 5.8%
- Percentage of males in computer and mathematical occupations:
Here: 7.3% city: 5.5%
- Percentage of males in architecture and engineering occupations:
Here: 1.7% city: 4.0%
- Percentage of males in life, physical, and social science occupations:
Here: 16.9% city: 1.1%
- Percentage of males in education, training, and library occupations:
Here: 12.2% city: 2.9%
- Percentage of males in arts, design, entertainment, sports, and media occupations:
Here: 1.3% city: 1.9%
- Percentage of males in healthcare practitioners and technical occupations:
Here: 3.0% city: 1.9%
- Percentage of males in service occupations:
Here: 62.0% city: 19.4%
- Percentage of males in sales and office occupations:
Here: 3.8% city: 13.6%
- Percentage of males in construction, extraction, and maintenance occupations:
Here: 16.7% city: 10.0%
- Percentage of males in production occupations:
Here: 12.9% city: 4.8%
- Percentage of males in transportation occupations:
Here: 6.1% city: 5.6%
- Percentage of males in material moving occupations:
Here: 6.4% city: 3.8%
Occupations of females:
- Percentage of females in management occupations (except farmers):
Here: 13.7% city: 11.5%
- Percentage of females in business and financial operations occupations:
Here: 13.7% city: 7.7%
- Percentage of females in architecture and engineering occupations:
Here: 1.2% city: 0.8%
- Percentage of females in legal occupations:
Here: 8.4% city: 1.0%
- Percentage of females in education, training, and library occupations:
Here: 10.9% city: 9.9%
- Percentage of females in arts, design, entertainment, sports, and media occupations:
Here: 10.4% city: 2.7%
- Percentage of females in healthcare practitioners and technical occupations:
Here: 3.1% city: 8.0%
- Percentage of females in service occupations:
Here: 7.3% city: 24.0%
- Percentage of females in sales and office occupations:
Here: 32.5% city: 25.7%
- Percentage of females in transportation occupations:
Here: 3.3% city: 0.9%
- Percentage of females in material moving occupations:
Here: 2.1% city: 1.4%
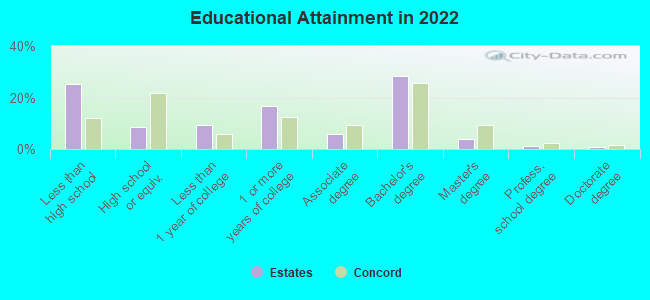
Education in this neighborhood (subdivision or community):
- Percentage of people 3 years and older in K-12 schools:
Estates: 27.7% Concord: 14.7%
- Percentage of people 3 years and older in undergraduate colleges:
Estates: 7.4% Concord: 5.5%
- Percentage of people 3 years and older in grad. or professional schools:
Estates: 1.1% Concord: 1.5%
- Percentage of students K-12 enrolled in private schools:
Estates: 9.4% Concord: 13.5%
Percentage of population below poverty level:
| Estates: | 4.7% |
| Concord: | 8.8% |
Median year owner moved in (as recorded in 2022):
Median year renter moved in (as recorded in 2022):
| Estates: | 2001 |
| Concord: | 2008 |
Median year renter moved in (as recorded in 2022):
| Estates: | 2017 |
| Concord: | 2018 |
Percentage of married-couple families with both working:
| Estates: | 82.9% |
| Concord: | 80.0% |
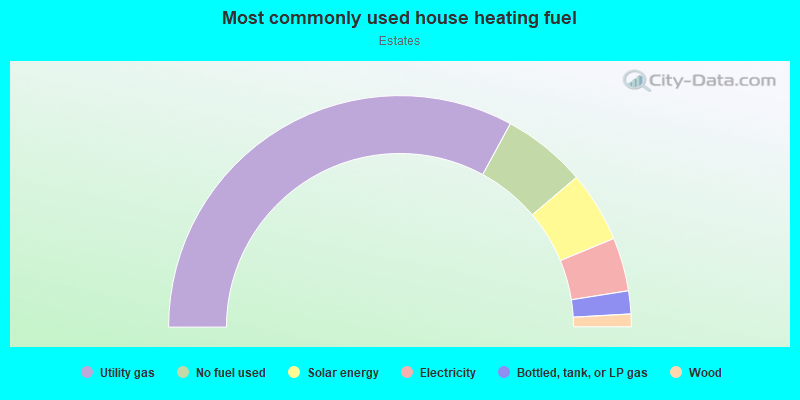
- 65.9%Utility gas
- 11.8%No fuel used
- 9.9%Solar energy
- 7.5%Electricity
- 3.2%Bottled, tank, or LP gas
- 1.8%Wood
Roads and streets:
Richard Ave
Length: 0.76 miles
Directions: E-W, N-S, SE-NW, SW-NE
Address range: 2600 to 2999
Directions: E-W, N-S, SE-NW, SW-NE
Address range: 2600 to 2999
Solano Way
Length: 0.67 miles
Directions: E-W, N-S, SE-NW, SW-NE
Address range: 1900 to 2199
Directions: E-W, N-S, SE-NW, SW-NE
Address range: 1900 to 2199
Broadmoor Ave
Length: 0.43 miles
Directions: E-W, N-S, SW-NE
Address range: 2700 to 2899
Directions: E-W, N-S, SW-NE
Address range: 2700 to 2899
Eastgate Ave
Length: 0.37 miles
Directions: N-S, SW-NE
Address range: 2700 to 2899
Directions: N-S, SW-NE
Address range: 2700 to 2899
Argyll Dr
Length: 0.36 miles
Directions: E-W, SW-NE
Address range: 2650 to 2799
Directions: E-W, SW-NE
Address range: 2650 to 2799
Mayfair Ave
Length: 0.35 miles
Directions: N-S, SE-NW
Address range: 2600 to 2799
Directions: N-S, SE-NW
Address range: 2600 to 2799
Courtland Dr
Length: 0.32 miles
Directions: N-S, SW-NE
Address range: 2700 to 2899
Directions: N-S, SW-NE
Address range: 2700 to 2899
Kay Ave
Length: 0.25 miles
Directions: N-S, SW-NE
Address range: 2700 to 2899
Directions: N-S, SW-NE
Address range: 2700 to 2899
Heaton Cir
Length: 0.24 miles
Directions: E-W, SE-NW, SW-NE
Address range: 1900 to 2099
Directions: E-W, SE-NW, SW-NE
Address range: 1900 to 2099
Westgate Ave
Length: 0.21 miles
Directions: N-S, SW-NE
Address range: 2700 to 2899
Directions: N-S, SW-NE
Address range: 2700 to 2899
Edward Ave
Length: 0.12 miles
Directions: E-W, SW-NE
Address range: 2700 to 2799
Directions: E-W, SW-NE
Address range: 2700 to 2799
Grant St
Length: 0.08 miles
Direction: SE-NW
Direction: SE-NW
Solano Ct
Length: 0.03 miles
Direction: SW-NE
Address range: 1900 to 1999
Direction: SW-NE
Address range: 1900 to 1999
Westgate Ct
Length: 0.03 miles
Direction: SE-NW
Address range: 2700 to 2799
Direction: SE-NW
Address range: 2700 to 2799
Richard Ct
Length: 0.03 miles
Direction: E-W
Address range: 2800 to 2999
Direction: E-W
Address range: 2800 to 2999
Heaton Ct
Length: 0.02 miles
Direction: SW-NE
Address range: 1950 to 1999
Direction: SW-NE
Address range: 1950 to 1999
Circle Ct
Length: 0.02 miles
Direction: E-W
Direction: E-W
Railroad features:
Union Pacific RR
Length: 0.13 miles
Direction: SE-NW
Direction: SE-NW