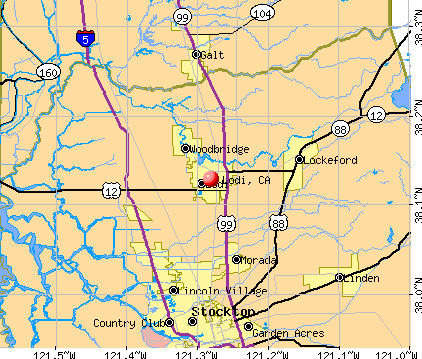
Lodi, California
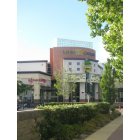
Lodi: Downtown Lodi
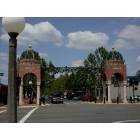
Lodi: Lodi Arch
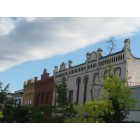
Lodi: downtown Lodi
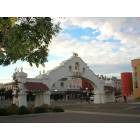
Lodi: Downtown Lodi movie theater
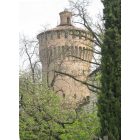
Lodi: Torre del castello di Lodi Italia
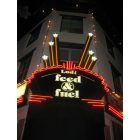
Lodi: The night scene in downtown lODI
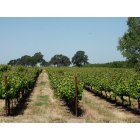
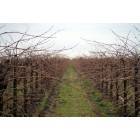
Lodi: Vine yard and valley oaks just East of Lodi
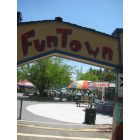
Lodi: Fun Town in Micke Grove in Lodi
Lodi: quality inn (lodi ca)
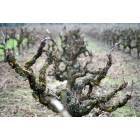
Lodi: grape vineyard east of Lodi
Lodi: grape vineyard east of Lodi
- see
13
more - add
your
Submit your own pictures of this city and show them to the world
- OSM Map
- General Map
- Google Map
- MSN Map
Population change since 2000: +18.0%
 |
| Males: 32,921 | |
| Females: 34,337 |
| Median resident age: | 37.5 years |
| California median age: | 37.9 years |
Zip codes: 95242.
| Lodi: | $88,440 |
| CA: | $91,551 |
Estimated per capita income in 2022: $37,877 (it was $18,719 in 2000)
Lodi city income, earnings, and wages data
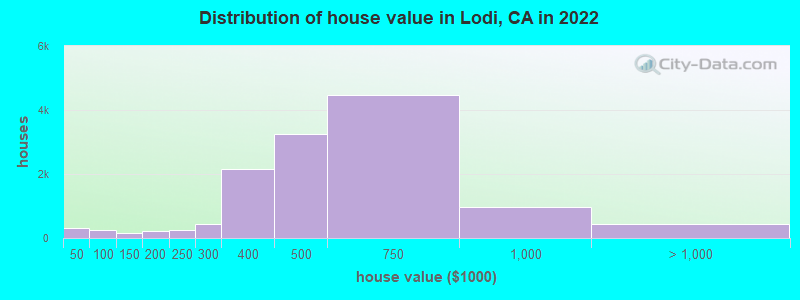
Estimated median house or condo value in 2022: $513,900 (it was $139,800 in 2000)
| Lodi: | $513,900 |
| CA: | $715,900 |
Mean prices in 2022: all housing units: $509,039; detached houses: $532,441; townhouses or other attached units: $432,727; in 3-to-4-unit structures: $507,837; in 5-or-more-unit structures: $276,721; mobile homes: $97,094
Median gross rent in 2022: $1,497.
(9.8% for White Non-Hispanic residents, 9.4% for Black residents, 18.2% for Hispanic or Latino residents, 19.8% for American Indian residents, 51.8% for Native Hawaiian and other Pacific Islander residents, 21.4% for other race residents, 13.9% for two or more races residents)
Detailed information about poverty and poor residents in Lodi, CA


Compare current foreclosures in Lodi, CA:
| Photo | Address | Area | Beds / Baths | Price | Details |
|---|---|---|---|---|---|

|
#1
Vineyard Dr
Lodi, CA 95240
|
1,225 sq. feet
|
2 baths 3 beds |
$370,000
|
show details |

|
#2
Almond Dr Apt 84
Lodi, CA 95240
|
1,064 sq. feet
|
1 baths 2 beds |
show details | |

|
#3
N Jack Tone Rd
Lodi, CA 95240
|
1,556 sq. feet
|
2 baths 2 beds |
show details | |

|
#4
N Ham Ln
Lodi, CA 95242
|
1,767 sq. feet
|
3 baths 3 beds |
show details | |

|
#5
Rutledge Dr
Lodi, CA 95242
|
1,104 sq. feet
|
2 baths 3 beds |
show details | |

|
#6
Live Oak Ct
Lodi, CA 95242
|
2,200 sq. feet
|
2 baths 4 beds |
show details | |

|
#7
W Tokay St
Lodi, CA 95240
|
966 sq. feet
|
1 baths 2 beds |
show details | |

|
#8
Edgewood Dr
Lodi, CA 95240
|
2,901 sq. feet
|
3 baths 5 beds |
show details | |

|
#9
Concord St
Lodi, CA 95240
|
1,967 sq. feet
|
1 baths 4 beds |
show details | |

|
#10
Boreal Dr
Lodi, CA 95242
|
2,482 sq. feet
|
3 baths 4 beds |
show details |
| Photo | Address | Area | Beds / Baths | Price | Details |
|---|---|---|---|---|---|

|
#11
Lake St
Lodi, CA 95242
|
1,650 sq. feet
|
1 baths 3 beds |
show details | |

|
#12
Winchester St Apt 13
Lodi, CA 95240
|
818 sq. feet
|
1 baths 2 beds |
show details | |

|
#13
Massarosa Ln
Lodi, CA 95240
|
1,992 sq. feet
|
2 baths 4 beds |
show details | |

|
#14
Mulberry Cir
Lodi, CA 95240
|
1,333 sq. feet
|
2 baths 3 beds |
show details | |

|
#15
Kimberly Dr
Lodi, CA 95240
|
1,208 sq. feet
|
2 baths 3 beds |
show details | |

|
#16
Aladdin Way
Lodi, CA 95242
|
1,320 sq. feet
|
2 baths 3 beds |
show details | |

|
#17
S Church St
Lodi, CA 95240
|
1,252 sq. feet
|
1 baths 2 beds |
show details | |

|
#18
Koni Ct
Lodi, CA 95240
|
2,362 sq. feet
|
2 baths 3 beds |
show details | |

|
#19
Pinot Noir Dr
Lodi, CA 95240
|
1,362 sq. feet
|
2 baths 3 beds |
show details | |

|
#20
S Mills Avenue
Lodi, CA 95242
|
970 sq. feet
|
2 baths 2 beds |
show details |
| Photo | Address | Area | Beds / Baths | Price | Details |
|---|---|---|---|---|---|

|
#21
East Highway 12
Lodi, CA 95240
|
1,591 sq. feet
|
1 baths 2 beds |
show details | |

|
#22
Ponderosa Dr
Lodi, CA 95242
|
1,826 sq. feet
|
2 baths 3 beds |
show details | |

|
#23
W Pine St
Lodi, CA 95242
|
1,339 sq. feet
|
2 baths 3 beds |
show details | |

|
#24
Sleepy Hollow Dr
Lodi, CA 95242
|
1,770 sq. feet
|
2 baths 3 beds |
show details | |

|
#25
S Sacramento St
Lodi, CA 95240
|
1,074 sq. feet
|
1 baths 3 beds |
show details | |

|
#26
E Live Oak Rd
Lodi, CA 95240
|
1,953 sq. feet
|
2 baths 3 beds |
show details | |

|
#27
Dunsmuir Dr
Lodi, CA 95240
|
1,534 sq. feet
|
2 baths 3 beds |
show details | |

|
#28
Finch Run
Lodi, CA 95240
|
1,440 sq. feet
|
2 baths 3 beds |
show details | |

|
#29
Modoc Way
Lodi, CA 95242
|
1,376 sq. feet
|
2 baths 3 beds |
show details | |

|
#30
S School St
Lodi, CA 95240
|
1,164 sq. feet
|
1 baths 2 beds |
show details |
| Photo | Address | Area | Beds / Baths | Price | Details |
|---|---|---|---|---|---|

|
#31
Forrest Ave
Lodi, CA 95240
|
933 sq. feet
|
2 baths 2 beds |
show details | |

|
#32
N Extension Rd
Lodi, CA 95242
|
1,419 sq. feet
|
1 baths 3 beds |
show details | |

|
#33
S School St
Lodi, CA 95240
|
1,311 sq. feet
|
1 baths 3 beds |
show details | |

|
#34
Eden St
Lodi, CA 95240
|
756 sq. feet
|
1 baths 2 beds |
show details | |

|
#35
Klamath Ct
Lodi, CA 95242
|
1,244 sq. feet
|
2 baths 3 beds |
show details | |

|
#36
Debbie Ln
Lodi, CA 95242
|
1,414 sq. feet
|
2 baths 3 beds |
show details | |

|
#37
N Tecklenburg Rd
Lodi, CA 95240
|
1,487 sq. feet
|
1 baths 2 beds |
show details | |

|
#38
Rockingham Cir
Lodi, CA 95242
|
1,995 sq. feet
|
3 baths 4 beds |
show details | |

|
#39
N School St
Lodi, CA 95240
|
864 sq. feet
|
1 baths 2 beds |
show details | |

|
#40
Eilers Ln Apt 1705
Lodi, CA 95242
|
1,199 sq. feet
|
2 baths 2 beds |
show details |
| Photo | Address | Area | Beds / Baths | Price | Details |
|---|---|---|---|---|---|

|
#41
Adobe Ct Apt A
Lodi, CA 95240
|
- sq. feet
|
- baths - beds |
show details | |

|
#42
Sylvan Way Apt 1402
Lodi, CA 95242
|
- sq. feet
|
- baths - beds |
show details | |

|
#43
S Mills Ave Apt 101
Lodi, CA 95242
|
- sq. feet
|
- baths - beds |
show details | |

|
#44
El Centro Dr
Lodi, CA 95240
|
- sq. feet
|
- baths - beds |
show details | |

|
#45
Louie Ave
Lodi, CA 95240
|
- sq. feet
|
- baths - beds |
show details | |

|
#46
Reynolds Ranch Pkwy # 101a
Lodi, CA 95240
|
- sq. feet
|
- baths - beds |
show details | |

|
#47
Maple St
Lodi, CA 95240
|
- sq. feet
|
- baths - beds |
show details | |

|
#48
S Orange Ave Apt 84
Lodi, CA 95240
|
- sq. feet
|
- baths - beds |
show details | |

|
#49
Connie St
Lodi, CA 95240
|
- sq. feet
|
- baths - beds |
show details | |

|
Check over 1 million property listings on Foreclosure.com!
|
browse all offers | |||


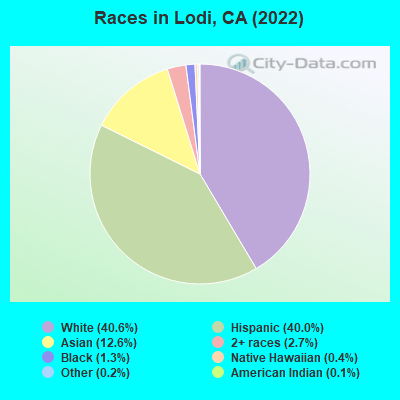
- 27,46940.6%White alone
- 27,08140.0%Hispanic
- 8,50612.6%Asian alone
- 1,8312.7%Two or more races
- 8571.3%Black alone
- 2490.4%Native Hawaiian and Other
Pacific Islander alone - 1090.2%Other race alone
- 970.1%American Indian alone
According to our research of California and other state lists, there were 125 registered sex offenders living in Lodi, California as of April 26, 2024.
The ratio of all residents to sex offenders in Lodi is 524 to 1.
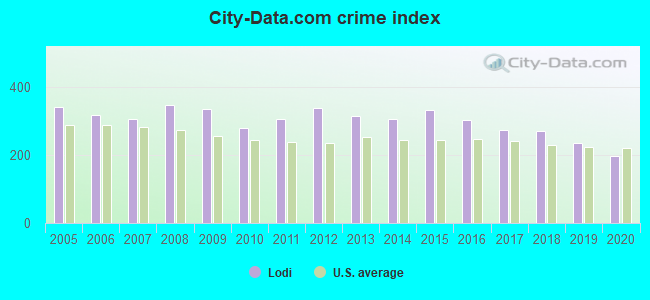
The City-Data.com crime index weighs serious crimes and violent crimes more heavily. Higher means more crime, U.S. average is 246.1. It adjusts for the number of visitors and daily workers commuting into cities.
- means the value is smaller than the state average.- means the value is about the same as the state average.
- means the value is bigger than the state average.
- means the value is much bigger than the state average.
Crime rate in Lodi detailed stats: murders, rapes, robberies, assaults, burglaries, thefts, arson
Full-time law enforcement employees in 2021, including police officers: 100 (70 officers - 62 male; 8 female).
| Officers per 1,000 residents here: | 1.02 |
| California average: | 2.30 |
 Recent articles from our blog. Our writers, many of them Ph.D. graduates or candidates, create easy-to-read articles on a wide variety of topics.

 | San Joaquin Valley Gentrification thread(Fresno, Merced, Stockton, Bakersfield) (338 replies) |
| What's being done to fix the housing crisis in California? (546 replies) |
| Lodi vs Elk Grove (17 replies) |
| Lodi (17 replies) |
| Questions about FAIRFIELD, CA (9 replies) |
| Coronavirus (12544 replies) |
Latest news from Lodi, CA collected exclusively by city-data.com from local newspapers, TV, and radio stations
Ancestries: German (6.8%), English (6.2%), European (3.6%), Italian (3.5%), Irish (2.9%), American (1.8%).
Current Local Time: PST time zone
Elevation: 51 feet
Land area: 12.2 square miles.
Population density: 5,496 people per square mile (average).
13,331 residents are foreign born (12.5% Latin America, 6.6% Asia).
| This city: | 19.7% |
| California: | 26.5% |
Median real estate property taxes paid for housing units with mortgages in 2022: $3,362 (0.6%)
Median real estate property taxes paid for housing units with no mortgage in 2022: $3,118 (0.6%)
Nearest city with pop. 200,000+: Stockton, CA  (10.6 miles , pop. 243,771).
Nearest city with pop. 1,000,000+: Los Angeles, CA (323.3 miles , pop. 3,694,820).
Nearest cities:
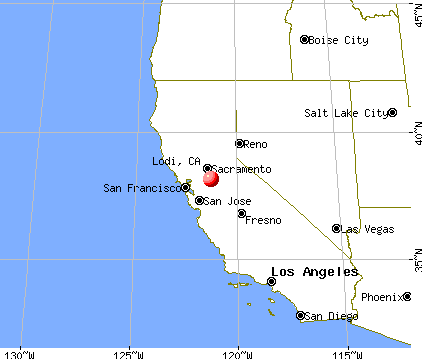
), ), ), ), ), ), Latitude: 38.13 N, Longitude: 121.28 W
Daytime population change due to commuting: +1,876 (+2.8%)
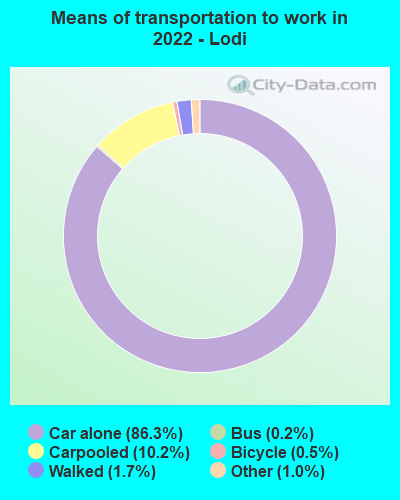
Workers who live and work in this city: 14,844 (48.8%)
Area code: 209
Lodi tourist attractions:
Lodi, California accommodation & food services, waste management - Economy and Business Data
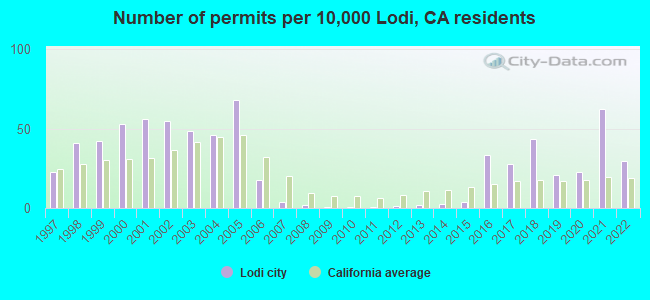
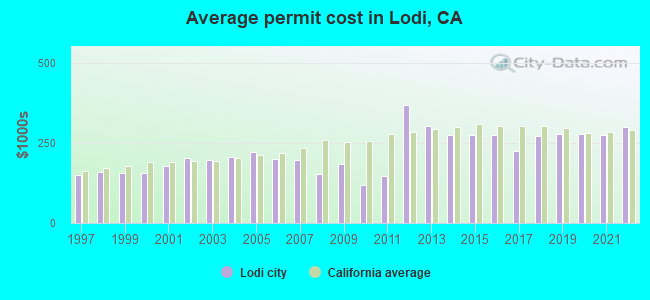
Single-family new house construction building permits:
- 2022: 169 buildings, average cost: $298,700
- 2021: 357 buildings, average cost: $274,200
- 2020: 130 buildings, average cost: $277,700
- 2019: 119 buildings, average cost: $277,900
- 2018: 247 buildings, average cost: $269,800
- 2017: 157 buildings, average cost: $225,700
- 2016: 189 buildings, average cost: $273,500
- 2015: 20 buildings, average cost: $272,600
- 2014: 16 buildings, average cost: $272,600
- 2013: 10 buildings, average cost: $303,500
- 2012: 8 buildings, average cost: $368,600
- 2011: 5 buildings, average cost: $147,600
- 2010: 5 buildings, average cost: $119,100
- 2009: 4 buildings, average cost: $183,700
- 2008: 12 buildings, average cost: $153,100
- 2007: 20 buildings, average cost: $197,200
- 2006: 99 buildings, average cost: $200,900
- 2005: 389 buildings, average cost: $220,400
- 2004: 262 buildings, average cost: $205,300
- 2003: 275 buildings, average cost: $198,200
- 2002: 312 buildings, average cost: $202,000
- 2001: 319 buildings, average cost: $178,600
- 2000: 300 buildings, average cost: $155,000
- 1999: 239 buildings, average cost: $154,700
- 1998: 234 buildings, average cost: $159,500
- 1997: 131 buildings, average cost: $149,100
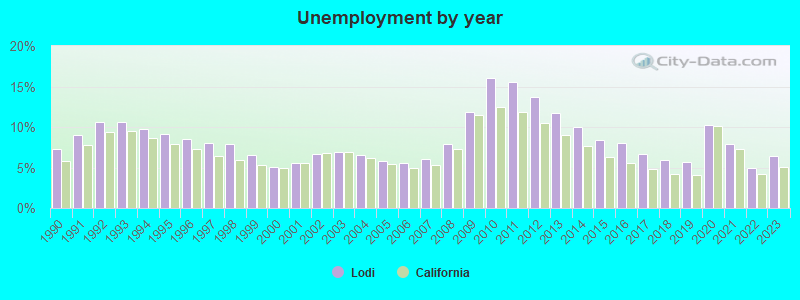
| Here: | 6.4% |
| California: | 5.1% |
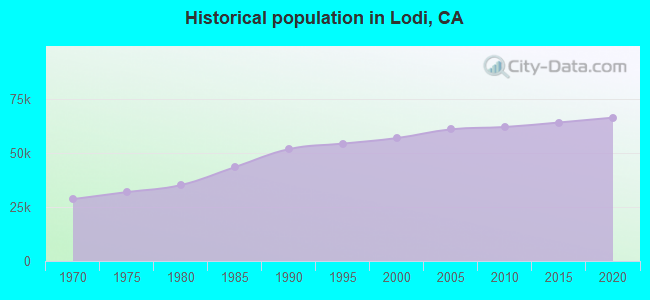
Population change in the 1990s: +4,928 (+9.5%).
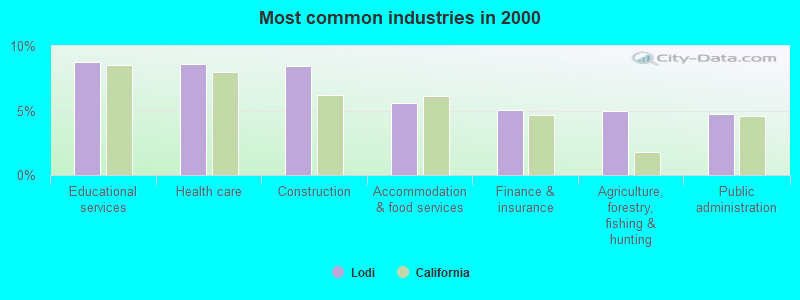
- Educational services (8.8%)
- Health care (8.6%)
- Construction (8.5%)
- Accommodation & food services (5.6%)
- Finance & insurance (5.0%)
- Agriculture, forestry, fishing & hunting (4.9%)
- Public administration (4.7%)
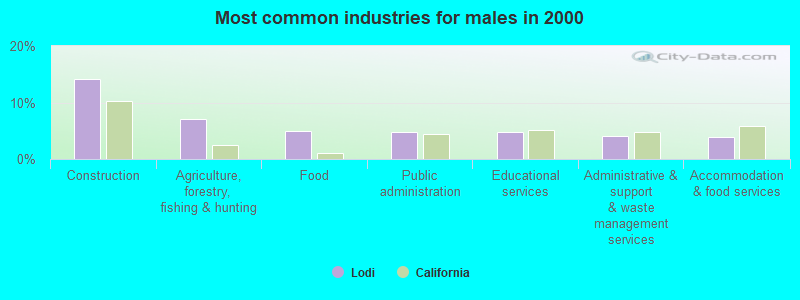
- Construction (14.1%)
- Agriculture, forestry, fishing & hunting (7.0%)
- Food (4.9%)
- Public administration (4.9%)
- Educational services (4.8%)
- Administrative & support & waste management services (4.1%)
- Accommodation & food services (3.8%)
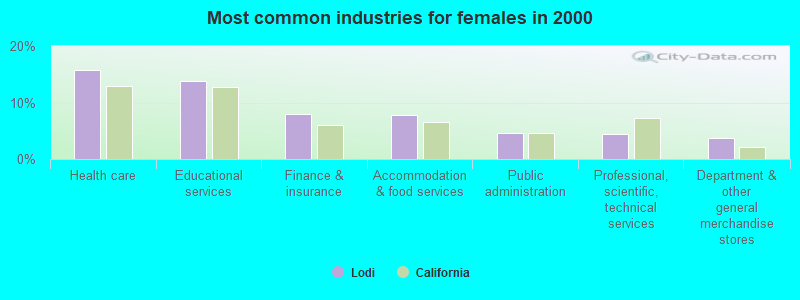
- Health care (15.7%)
- Educational services (13.8%)
- Finance & insurance (8.0%)
- Accommodation & food services (7.7%)
- Public administration (4.5%)
- Professional, scientific, technical services (4.5%)
- Department & other general merchandise stores (3.8%)
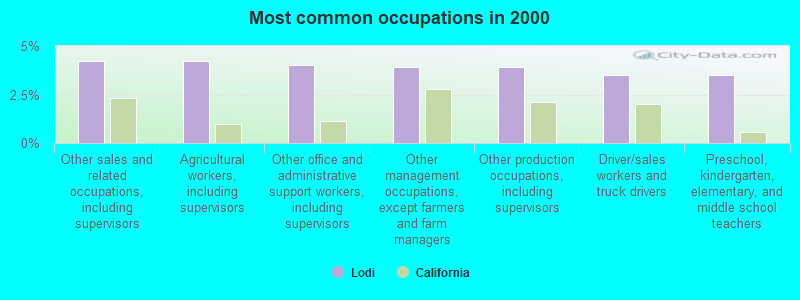
- Other sales and related occupations, including supervisors (4.2%)
- Agricultural workers, including supervisors (4.2%)
- Other office and administrative support workers, including supervisors (4.0%)
- Other management occupations, except farmers and farm managers (3.9%)
- Other production occupations, including supervisors (3.9%)
- Driver/sales workers and truck drivers (3.5%)
- Preschool, kindergarten, elementary, and middle school teachers (3.5%)
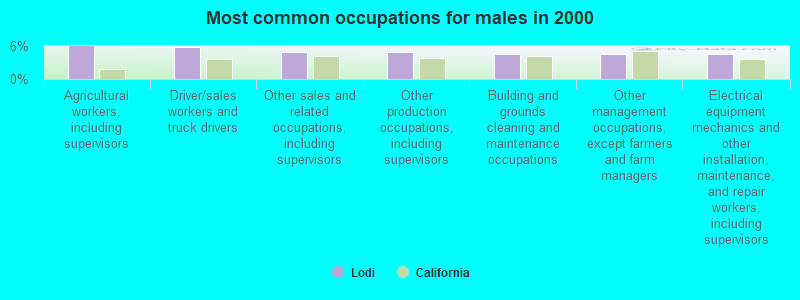
- Agricultural workers, including supervisors (6.0%)
- Driver/sales workers and truck drivers (5.8%)
- Other sales and related occupations, including supervisors (4.9%)
- Other production occupations, including supervisors (4.9%)
- Building and grounds cleaning and maintenance occupations (4.6%)
- Other management occupations, except farmers and farm managers (4.5%)
- Electrical equipment mechanics and other installation, maintenance, and repair workers, including supervisors (4.5%)
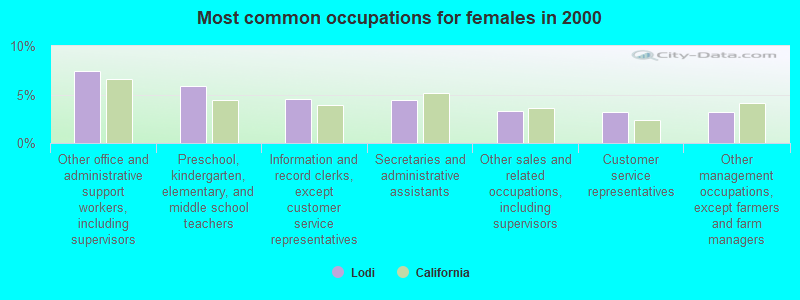
- Other office and administrative support workers, including supervisors (7.5%)
- Preschool, kindergarten, elementary, and middle school teachers (5.8%)
- Information and record clerks, except customer service representatives (4.6%)
- Secretaries and administrative assistants (4.5%)
- Other sales and related occupations, including supervisors (3.3%)
- Customer service representatives (3.2%)
- Other management occupations, except farmers and farm managers (3.2%)
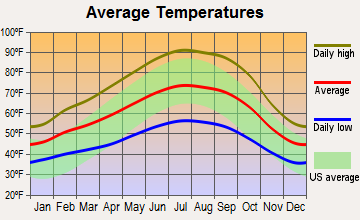
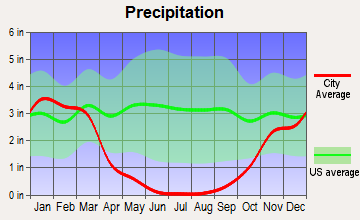
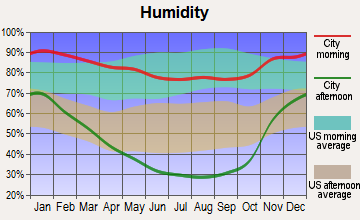
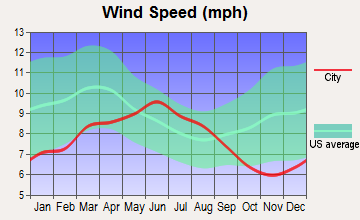
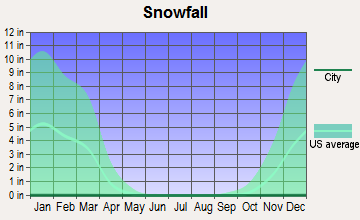
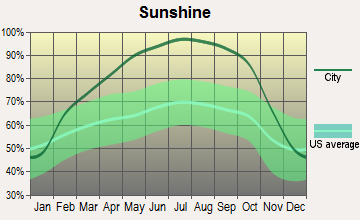
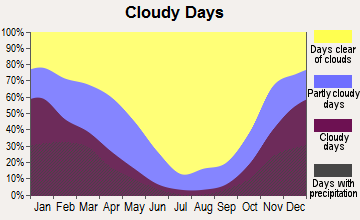
Average climate in Lodi, California
Based on data reported by over 4,000 weather stations
|
|

(lower is better)
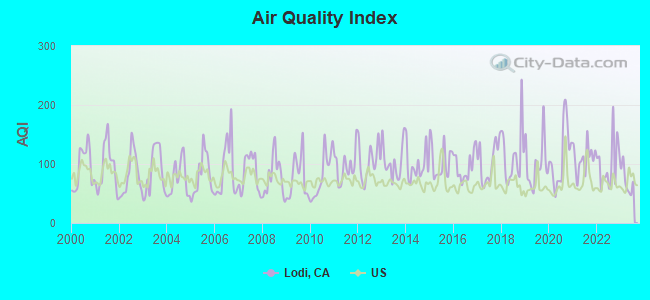
Air Quality Index (AQI) level in 2023 was 71.8. This is about average.
| City: | 71.8 |
| U.S.: | 72.6 |
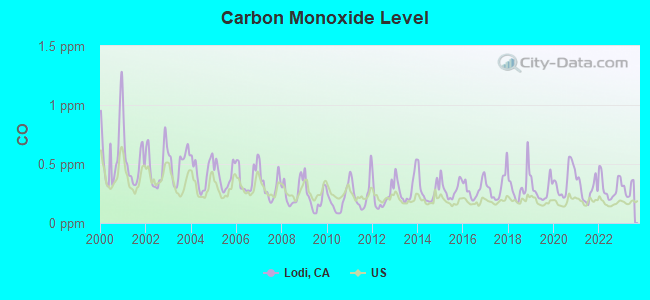
Carbon Monoxide (CO) [ppm] level in 2023 was 0.291. This is about average. Closest monitor was 0.9 miles away from the city center.
| City: | 0.291 |
| U.S.: | 0.251 |
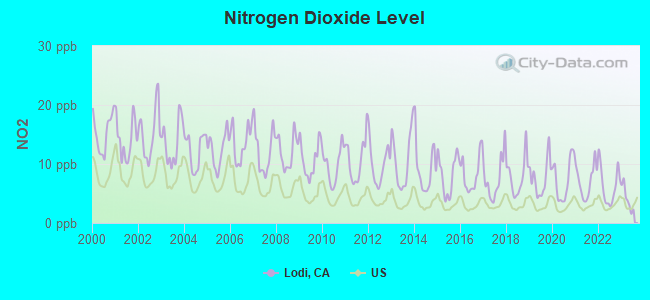
Nitrogen Dioxide (NO2) [ppb] level in 2023 was 4.17. This is better than average. Closest monitor was 11.6 miles away from the city center.
| City: | 4.17 |
| U.S.: | 5.11 |
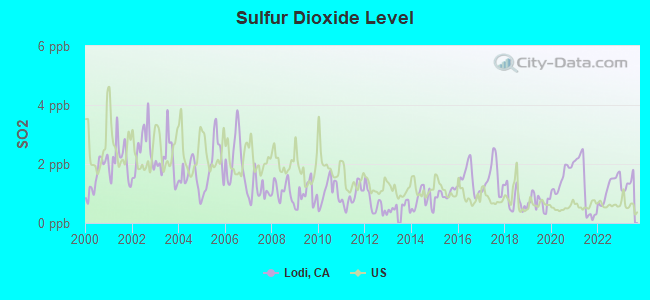
Sulfur Dioxide (SO2) [ppb] level in 2023 was 1.32. This is about average. Closest monitor was 12.3 miles away from the city center.
| City: | 1.32 |
| U.S.: | 1.51 |
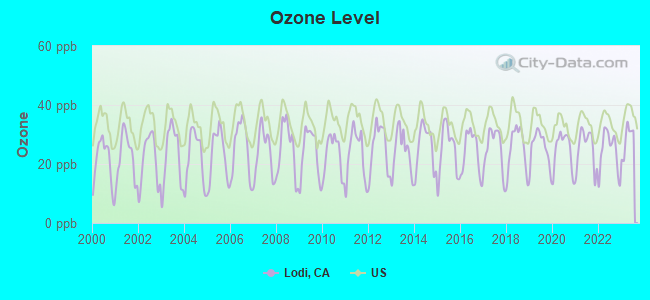
Ozone [ppb] level in 2023 was 28.4. This is about average. Closest monitor was 0.9 miles away from the city center.
| City: | 28.4 |
| U.S.: | 33.3 |
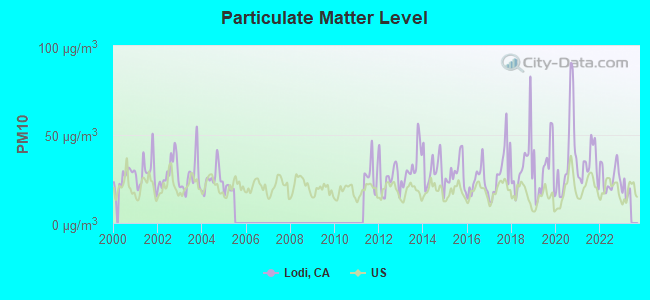
Particulate Matter (PM10) [µg/m3] level in 2022 was 25.8. This is worse than average. Closest monitor was 7.9 miles away from the city center.
| City: | 25.8 |
| U.S.: | 19.2 |
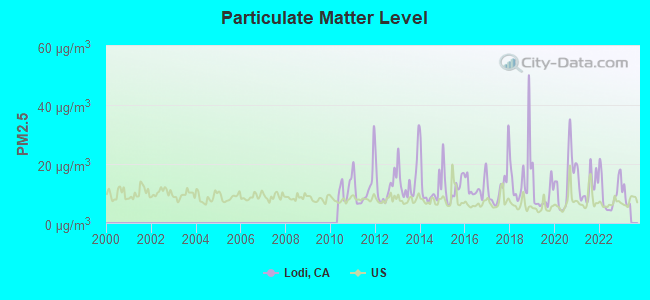
Particulate Matter (PM2.5) [µg/m3] level in 2022 was 10.1. This is worse than average. Closest monitor was 11.6 miles away from the city center.
| City: | 10.1 |
| U.S.: | 8.1 |
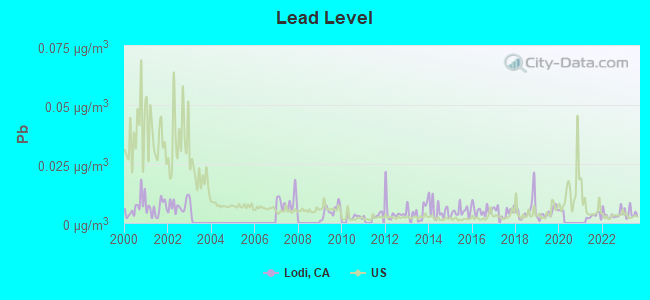
Lead (Pb) [µg/m3] level in 2023 was 0.00414. This is significantly better than average. Closest monitor was 8.0 miles away from the city center.
| City: | 0.00414 |
| U.S.: | 0.00931 |
Earthquake activity:
Lodi-area historical earthquake activity is significantly above California state average. It is 7917% greater than the overall U.S. average.On 4/18/1906 at 13:12:21, a magnitude 7.9 (7.9 UK, Class: Major, Intensity: VIII - XII) earthquake occurred 94.0 miles away from Lodi center, causing $524,000,000 total damage
On 10/18/1989 at 00:04:15, a magnitude 7.1 (6.5 MB, 7.1 MS, 6.9 MW, 7.0 ML) earthquake occurred 75.4 miles away from the city center, causing 62 deaths (62 shaking deaths) and 3757 injuries, causing $1,305,032,704 total damage
On 7/21/1952 at 11:52:14, a magnitude 7.7 (7.7 UK) earthquake occurred 250.8 miles away from Lodi center, causing $50,000,000 total damage
On 11/4/1927 at 13:51:53, a magnitude 7.5 (7.5 UK) earthquake occurred 222.7 miles away from the city center
On 10/3/1915 at 06:52:48, a magnitude 7.6 (7.6 UK) earthquake occurred 260.4 miles away from the city center
On 12/21/1932 at 06:10:09, a magnitude 7.2 (7.2 UK) earthquake occurred 175.5 miles away from Lodi center
Magnitude types: body-wave magnitude (MB), local magnitude (ML), surface-wave magnitude (MS), moment magnitude (MW)
Natural disasters:
The number of natural disasters in San Joaquin County (20) is greater than the US average (15).Major Disasters (Presidential) Declared: 15
Emergencies Declared: 3
Causes of natural disasters: Floods: 13, Storms: 7, Mudslides: 4, Landslides: 3, Winter Storms: 3, Drought: 1, Earthquake: 1, Freeze: 1, Heavy Rain: 1, Hurricane: 1, Tornado: 1, Wind: 1, Other: 2 (Note: some incidents may be assigned to more than one category).

Main business address for: FARMERS & MERCHANTS BANCORP (NATIONAL COMMERCIAL BANKS), FIRST FINANCIAL BANCORP /CA/ (STATE COMMERCIAL BANKS).
Hospitals in Lodi:
- ALPINE ICF (2216 ALPINE DRIVE)
- BEAR CREEK ICF (4617 EAST BEAR CREEK ROAD)
- LODI MEMORIAL HOSPITAL (Voluntary non-profit - Other, provides emergency services, 975 S FAIRMONT AVENUE)
- LODI MEMORIAL HOSPITAL - WEST (provides emergency services, 800 S LOWER SACRAMENTO RD)
Nursing Homes in Lodi:
- ARBOR NURSING CENTER (900 NORTH CHURCH STREET)
- BECHTHOLD CONV HOSP (610 S FAIRMONT AVE)
- CRESCENT COURT NURSING HOME (610 S FAIRMONT AVENUE)
- DELTA REHABILITATION AND CARE CENTER (1334 S. HAM LANE)
- FAIRMONT REHABILITATION HOSPITAL SNF (950 S. FAIRMONT AVENUE)
- LODI HEALTH CARE CENTER (1120 SYLVIA DR)
- LODI MEMORIAL HOSPITAL - WEST D/P SNF (800 LOWER SACRAMENTO RD)
- VIENNA NURSING AND REHABILITATION CENTER (800 SO. HAM LANE)
- WINE COUNTRY CARE CENTER (321 WEST TURNER ROAD)
Dialysis Facilities in Lodi:
Airports and heliports located in Lodi:
- Lodi Airport (1O3) (Runways: 2, Air Taxi Ops: 575, Itinerant Ops: 20,700, Local Ops: 22,770)
- Lodi Airpark Airport (L53) (Runways: 1, Itinerant Ops: 200, Local Ops: 12,000)
- Kingdon Airpark Airport (O20) (Runways: 1, Itinerant Ops: 3,350, Local Ops: 4,650)
- Wallom Field Airport (8CA8) (Runways: 1)
- Lodi Memorial Hospital Heliport (8CL7)
Amtrak stations near Lodi:
- 12 miles: STOCKTON, CABRAL STATION (STOCKTON, 949 E. CHANNEL ST.) . Services: public payphones.
- 13 miles: STOCKTON, SAN JOAQUIN ST. (STOCKTON, 735 S. SAN JOAQUIN ST.) . Services: ticket office, fully wheelchair accessible, enclosed waiting area, public restrooms, public payphones, vending machines, free short-term parking, call for car rental service, call for taxi service, public transit connection.
Colleges/universities with over 2000 students nearest to Lodi:
- San Joaquin Delta College (about 10 miles; Stockton, CA; Full-time enrollment: 12,167)
- University of the Pacific (about 11 miles; Stockton, CA; FT enrollment: 4,999)
- Cosumnes River College (about 24 miles; Sacramento, CA; FT enrollment: 9,327)
- California State University-Sacramento (about 31 miles; Sacramento, CA; FT enrollment: 22,234)
- Sacramento City College (about 31 miles; Sacramento, CA; FT enrollment: 15,963)
- Los Medanos College (about 33 miles; Pittsburg, CA; FT enrollment: 5,289)
- Modesto Junior College (about 37 miles; Modesto, CA; FT enrollment: 10,635)
Public high schools in Lodi:
- LODI HIGH (Students: 1,457, Location: 3 PACIFIC AVE., Grades: 9-12)
- TOKAY HIGH (Students: 1,405, Location: 1111 W. CENTURY BLVD., Grades: 9-12)
- INDEPENDENCE (Students: 116, Location: 13451 N. EXTENSION RD., Grades: KG-12)
- LIBERTY HIGH (Location: 660 W. WALNUT ST., Grades: 9-12)
- RIO VALLEY CHARTER (Location: 1530 W. KETTLEMAN LN., STE. A, Grades: KG-12, Charter school)
- WALTER J. KATNICH COMMUNITY DAY (Location: 13451 N. EXTENSION RD., Grades: 7-12)
Private high schools in Lodi:
- JIM ELLIOT CHRISTIAN HIGH SCHOOL (Students: 224, Location: 2695 W VINE ST, Grades: 9-12)
- LODI ACADEMY (Students: 101, Location: 1230 S CENTRAL AVE, Grades: 9-12)
- NORTH VALLEY SCHOOL (Students: 76, Location: 12755 N HIGHWAY 88, Grades: KG-12)
- LIFE TRAINING ACADEMY (Students: 46, Location: 11451 N WEST LN, Grades: KG-11)
Biggest public elementary/middle schools in Lodi:
- LODI MIDDLE (Students: 859, Location: 945 S. HAM LN., Grades: 7-8)
- MILLSWOOD MIDDLE (Students: 730, Location: 233 N. MILLS, Grades: 7-8)
- LOIS E. BORCHARDT ELEMENTARY (Students: 526, Location: 375 CULBERTSON DR., Grades: KG-6)
- ELLERTH E. LARSON ELEMENTARY (Students: 464, Location: 2375 GIANNONI WAY, Grades: KG-6)
- ERMA B. REESE ELEMENTARY (Students: 444, Location: 1800 W. ELM ST., Grades: KG-6)
- BECKMAN ELEMENTARY (Students: 429, Location: 2201 SCARBOROUGH DR., Grades: KG-6)
- VINEWOOD ELEMENTARY (Students: 398, Location: 1600 W. TOKAY ST., Grades: KG-6)
- LAWRENCE ELEMENTARY (Students: 338, Location: 721 CALAVERAS ST., Grades: KG-6)
- GEORGE WASHINGTON ELEMENTARY (Students: 314, Location: 831 W. LOCKEFORD ST., Grades: KG-6)
- WOODBRIDGE (Students: 287, Location: 1290 LILAC ST., Grades: KG-6)
Private elementary/middle schools in Lodi:
- ST ANNE SCHOOL (Students: 243, Location: 200 S PLEASANT AVE, Grades: KG-8)
- ST PETER LUTHERAN SCHOOL (Students: 212, Location: 2400 OXFORD WAY, Grades: PK-8)
- LODI SDA ELEMENTARY SCHOOL (Students: 185, Location: 1240 S CENTRAL AVE, Grades: KG-8)
- CENTURY CHRISTIAN SCHOOL (Students: 167, Location: 550 W CENTURY BLVD, Grades: PK-8)
- VINEYARD CHRISTIAN MIDDLE SCHOOL (Students: 78, Location: 2301 W LODI AVE, Grades: 6-8)
User-submitted facts and corrections:
- There is a new elementary school called, Larson Elementary School. (grades k-6)
Points of interest:
Notable locations in Lodi: Lodi Municipal Service Center (A), North Ridge Industrial Center (B), Lodi Industrial Park (C), White Slough Water Pollution Control Plant (D), Grape Festival Buildings (E), Lodi Fire Department Station 4 (F), Lodi Fire Department Station 3 (G), Lodi Fire Department Station 2 (H), Mattison Hall (I), Lodi Womens Club (J), Lodi City Hall (K), Lodi Chamber of Commerce (L), Lodi Fire Department Station 1 (M), Carnegie Library (N). Display/hide their locations on the map
Shopping Centers: Southwest Plaza Shopping Center (1), Lakewood Mall Shopping Center (2), Fairmont Plaza Shopping Center (3). Display/hide their locations on the map
Main business address in Lodi include: FARMERS & MERCHANTS BANCORP (A), FIRST FINANCIAL BANCORP /CA/ (B). Display/hide their locations on the map
Churches in Lodi include: Bethel Open Bible Church (A), Calvary Bible Church (B), Central Seventh Day Adventist Church (C), Church of Christ (D), Church of God (E), Church of the Nazarene (F), Ebenezer Congregational Church (G), Emanuel American Lutheran Church (H), First Assembly of God Church (I). Display/hide their locations on the map
Lake: Smith Lake (A). Display/hide its location on the map
Parks in Lodi include: American Legion Park (1), Blakely Park (2), Twin Oaks Park (3), Van Buskirk Park (4), Vinewood Park (5), Emerson Park (6), Hale Park (7), Lawrence Park (8), Lodi Lake Park (9). Display/hide their locations on the map
Tourist attractions: Bounce-About (Amusement & Theme Parks; 167 Commerce Street # 101) (1), C & R Enterprises (2379 Maggio Circle) (2). Display/hide their approximate locations on the map
Hotels: Best Western Royal Host Inn (710 South Cherokee Lane) (1), Best Western I 5 Inn And Stes (6411 West Banner Road) (2), Amorosa Inn & Gardens (7889 East Harney Lane) (3), Budget Inn of Lodi (917 South Cherokee Lane) (4). Display/hide their approximate locations on the map
Birthplace of: Bill Cartwright - Basketball player-coach, Jennifer Tate - Martial artist, Maximo Yabes - Army Medal of Honor recipient, Mike Droese - Retired professional wrestler, Neal C. Wilson - President of the General Conference of Seventh-day Adventists, Patrick Ianni - Soccer player, Tayt Ianni - Soccer player, Tony Petersen - Football coach, Brad Wellman - Baseball player, Lloyd Hittle - Major League Baseball pitcher.
Drinking water stations with addresses in Lodi and their reported violations in the past:
PHILLIPS FARMS (Population served: 3,000, Groundwater):Past health violations:SJC SPORTS COMPLEX (Population served: 100, Groundwater):Past monitoring violations:
- MCL, Monthly (TCR) - In JAN-2014, Contaminant: Coliform. Follow-up actions: St Public Notif requested (JAN-01-2014), St Compliance achieved (FEB-11-2014)
- MCL, Monthly (TCR) - In AUG-2013, Contaminant: Coliform. Follow-up actions: St Public Notif requested (JUL-01-2013), St Compliance achieved (SEP-10-2013)
- MCL, Monthly (TCR) - In JUL-2013, Contaminant: Coliform. Follow-up actions: St Public Notif requested (JUL-01-2013), St Compliance achieved (SEP-10-2013)
- MCL, Monthly (TCR) - In FEB-2010, Contaminant: Coliform. Follow-up actions: St Compliance achieved (MAR-10-2010)
- MCL, Monthly (TCR) - In DEC-2009, Contaminant: Coliform. Follow-up actions: St Public Notif requested (JAN-10-2010)
- MCL, Monthly (TCR) - In DEC-2007, Contaminant: Coliform. Follow-up actions: St Public Notif requested (DEC-01-2007)
- 11 other older health violations
- 2 routine major monitoring violations
- 2 minor monitoring violations
Past health violations:MARIONS RANCH HOUSE MOTEL (Population served: 78, Groundwater):Past monitoring violations:
- MCL, Monthly (TCR) - In SEP-2006, Contaminant: Coliform. Follow-up actions: St Public Notif requested (SEP-01-2006)
- MCL, Monthly (TCR) - In SEP-2006, Contaminant: Coliform. Follow-up actions: St Public Notif requested (SEP-01-2006)
- 3 routine major monitoring violations
Past health violations:PETES PLACE LLC (Population served: 50, Groundwater):Past monitoring violations:
- MCL, Monthly (TCR) - In APR-2012, Contaminant: Coliform. Follow-up actions: St Public Notif requested (APR-01-2012), St Compliance achieved (APR-01-2012)
- MCL, Monthly (TCR) - In OCT-2006, Contaminant: Coliform. Follow-up actions: St Public Notif requested (OCT-01-2006)
- MCL, Monthly (TCR) - In OCT-2006, Contaminant: Coliform. Follow-up actions: St Public Notif requested (OCT-01-2006)
- 3 routine major monitoring violations
Past health violations:MOKELUMNE BEACH RV PARK (Population served: 30, Groundwater):
- MCL, Monthly (TCR) - In MAY-2006, Contaminant: Coliform. Follow-up actions: St Public Notif requested (MAY-01-2006)
- MCL, Monthly (TCR) - In MAY-2006, Contaminant: Coliform. Follow-up actions: St Public Notif requested (MAY-01-2006)
Past monitoring violations:JESSIES GROVE WINERY (Population served: 25, Groundwater):
- 2 routine major monitoring violations
Past monitoring violations:LOCKEFORD SPRINGS GOLF COURSE (Population served: 25, Groundwater):
- 2 routine major monitoring violations
Past health violations:VAN RUITEN FAMILY WINERY (Population served: 25, Groundwater):Past monitoring violations:
- MCL, Monthly (TCR) - In JUN-2012, Contaminant: Coliform. Follow-up actions: St Public Notif requested (JUN-01-2012), St Compliance achieved (JUL-01-2012)
- MCL, Monthly (TCR) - In NOV-2009, Contaminant: Coliform. Follow-up actions: St Public Notif requested (DEC-10-2009)
- MCL, Monthly (TCR) - In SEP-2009, Contaminant: Coliform. Follow-up actions: St Public Notif requested (OCT-10-2009)
- MCL, Monthly (TCR) - In SEP-2009, Contaminant: Coliform. Follow-up actions: St Public Notif requested (OCT-10-2009)
- MCL, Monthly (TCR) - In AUG-2009, Contaminant: Coliform. Follow-up actions: St Public Notif requested (SEP-10-2009)
- MCL, Monthly (TCR) - In AUG-2009, Contaminant: Coliform. Follow-up actions: St Public Notif requested (SEP-10-2009)
- 6 other older health violations
- 2 routine major monitoring violations
Past health violations:Past monitoring violations:
- MCL, Monthly (TCR) - In DEC-2010, Contaminant: Coliform. Follow-up actions: St Public Notif requested (DEC-01-2010), St Compliance achieved (DEC-01-2010)
- MCL, Monthly (TCR) - In DEC-2010, Contaminant: Coliform. Follow-up actions: St Public Notif requested (DEC-01-2010)
- One minor monitoring violation
Drinking water stations with addresses in Lodi that have no violations reported:
- ROYCE FARMS BBQ (Population served: 100, Primary Water Source Type: Groundwater)
- DESHMESH DARBAR LODI/STK WATER SYS (Population served: 25, Primary Water Source Type: Groundwater)
- MARTINIS BAIT & TACKLE (Population served: 25, Primary Water Source Type: Groundwater)
- SJC MOSSDALE CROSSING PARK (Population served: 25, Primary Water Source Type: Groundwater)
| This city: | 2.8 people |
| California: | 2.9 people |
| This city: | 69.1% |
| Whole state: | 68.7% |
| This city: | 7.4% |
| Whole state: | 7.2% |
Likely homosexual households (counted as self-reported same-sex unmarried-partner households)
- Lesbian couples: 0.4% of all households
- Gay men: 0.1% of all households
People in group quarters in Lodi in 2010:
- 470 people in nursing facilities/skilled-nursing facilities
- 74 people in emergency and transitional shelters (with sleeping facilities) for people experiencing homelessness
- 43 people in residential treatment centers for adults
- 42 people in other noninstitutional facilities
- 21 people in group homes intended for adults
- 12 people in group homes for juveniles (non-correctional)
- 8 people in residential treatment centers for juveniles (non-correctional)
- 7 people in workers' group living quarters and job corps centers
People in group quarters in Lodi in 2000:
- 628 people in nursing homes
- 175 people in other noninstitutional group quarters
- 92 people in other nonhousehold living situations
- 55 people in wards in general hospitals for patients who have no usual home elsewhere
- 42 people in homes for the mentally ill
- 28 people in homes for the mentally retarded
- 4 people in religious group quarters
Banks with most branches in Lodi (2011 data):
- Farmers & Merchants Bank of Central California: 7 branches. Info updated 2006/11/03: Bank assets: $1,920.1 mil, Deposits: $1,627.8 mil, local headquarters, positive income, Agricultural Specialization, 23 total offices, Holding Company: Farmers & Merchants Bancorp
- Wells Fargo Bank, National Association: Lodi Branch, Raley's Lodi Branch, Lodi Branch. Info updated 2011/04/05: Bank assets: $1,161,490.0 mil, Deposits: $905,653.0 mil, headquarters in Sioux Falls, SD, positive income, 6395 total offices, Holding Company: Wells Fargo & Company
- Bank of America, National Association: The Vineyard Branch at 700 Kettleman Lane, branch established on 1979/06/11; Lodi Branch at 31 South School Street, branch established on 1927/02/19. Info updated 2009/11/18: Bank assets: $1,451,969.3 mil, Deposits: $1,077,176.8 mil, headquarters in Charlotte, NC, positive income, 5782 total offices, Holding Company: Bank Of America Corporation
- Compass Bank: Vineyard Branch at 1150 W. Kettleman Ln., branch established on 1887/01/01; Church Street Branch at 200 N. Church Street, branch established on 1988/06/30. Info updated 2011/02/24: Bank assets: $63,107.0 mil, Deposits: $46,232.4 mil, headquarters in Birmingham, AL, negative income in the last year, Commercial Lending Specialization, 720 total offices, Holding Company: Banco Bilbao Vizcaya Argentaria, S.A.
- Central Valley Community Bank: Lodi Branch at 1901 Kettleman Drive, branch established on 2006/06/30. Info updated 2008/11/25: Bank assets: $848.4 mil, Deposits: $714.0 mil, headquarters in Fresno, CA, positive income, Commercial Lending Specialization, 17 total offices, Holding Company: Central Valley Community Bancorp
- Community Business Bank: Lodi Branch at 1540 Kettleman Lane, Suite A, branch established on 2005/11/14. Info updated 2009/11/02: Bank assets: $156.4 mil, Deposits: $133.5 mil, headquarters in West Sacramento, CA, positive income, Commercial Lending Specialization, 5 total offices
- Union Bank, National Association: Lodi Instore Branch at 610 W. Kettleman Lane, branch established on 1996/04/04. Info updated 2011/09/01: Bank assets: $88,967.5 mil, Deposits: $65,286.4 mil, headquarters in San Francisco, CA, positive income, Commercial Lending Specialization, 403 total offices, Holding Company: Mitsubishi Ufj Financial Group, Inc.
- Bank of Stockton: Lodi Branch at 120 West Walnut Street, branch established on 1965/04/01. Info updated 2010/04/08: Bank assets: $2,047.8 mil, Deposits: $1,722.4 mil, headquarters in Stockton, CA, positive income, Commercial Lending Specialization, 16 total offices, Holding Company: 1867 Western Financial Corporation
- Bank of Agriculture and Commerce: Lodi Office Branch at 1610 W. Kettleman Lane, Suite C, branch established on 1989/11/28. Info updated 2009/08/28: Bank assets: $469.4 mil, Deposits: $403.6 mil, headquarters in Stockton, CA, positive income, Commercial Lending Specialization, 10 total offices, Holding Company: Bac Financial Inc.
- 5 other banks with 5 local branches
For population 15 years and over in Lodi:
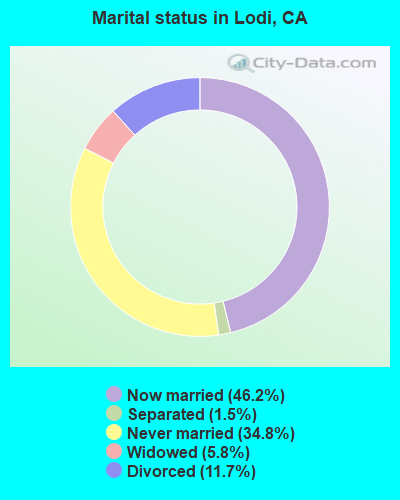
- Never married: 34.8%
- Now married: 46.2%
- Separated: 1.5%
- Widowed: 5.8%
- Divorced: 11.7%
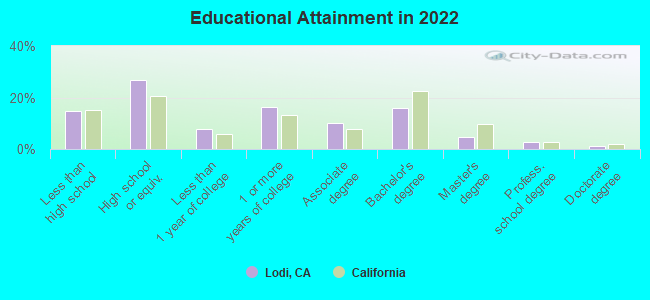
For population 25 years and over in Lodi:
- High school or higher: 85.3%
- Bachelor's degree or higher: 24.2%
- Graduate or professional degree: 8.4%
- Unemployed: 7.4%
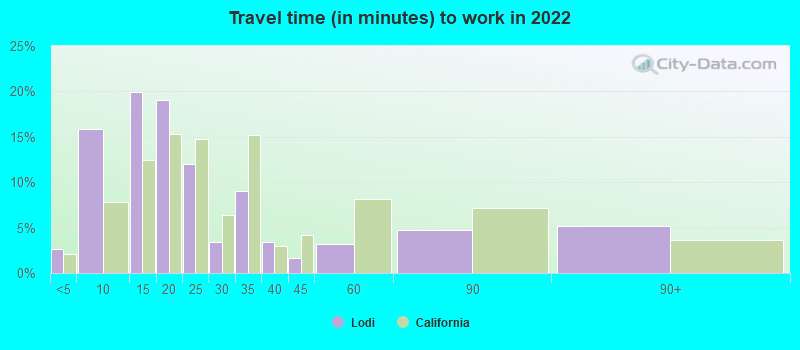
- Mean travel time to work (commute): 22.3 minutes
| Here: | 15.3 |
| California average: | 15.5 |
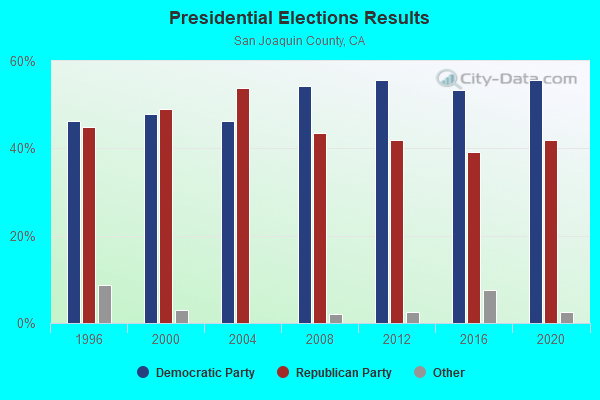
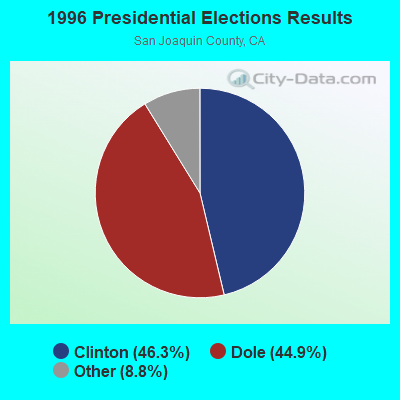
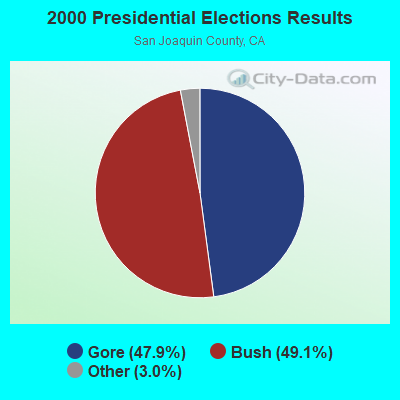
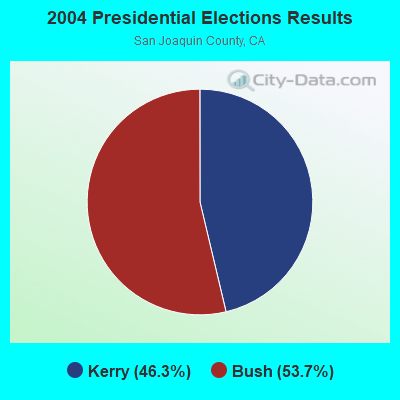
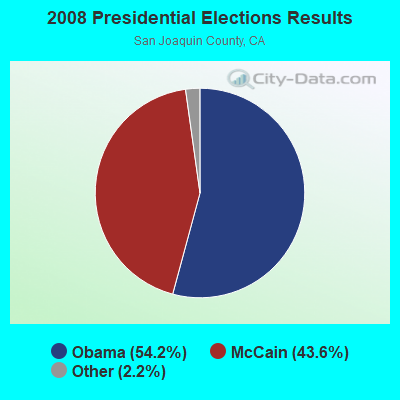
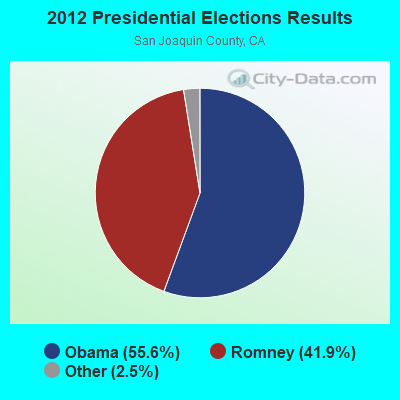
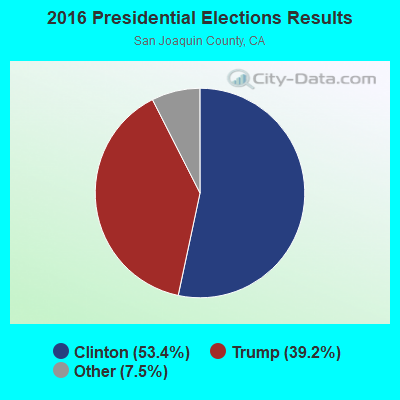

Graphs represent county-level data. Detailed 2008 Election Results
Religion statistics for Lodi, CA (based on San Joaquin County data)
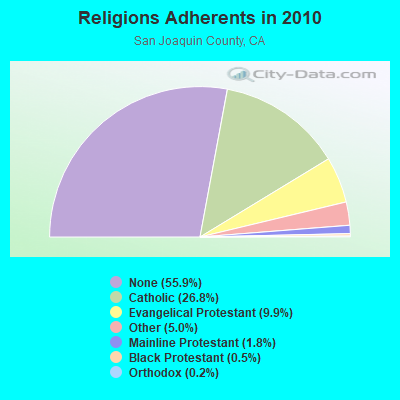
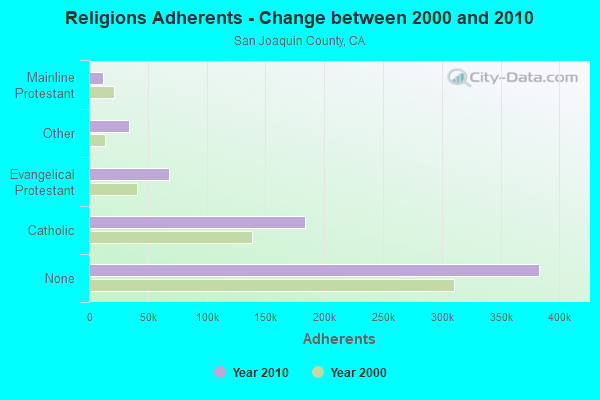
| Religion | Adherents | Congregations |
|---|---|---|
| Catholic | 183,692 | 18 |
| Evangelical Protestant | 67,940 | 304 |
| Other | 33,949 | 68 |
| Mainline Protestant | 12,067 | 43 |
| Black Protestant | 3,251 | 17 |
| Orthodox | 1,368 | 2 |
| None | 383,039 | - |
Food Environment Statistics:
| This county: | 2.34 / 10,000 pop. |
| California: | 2.14 / 10,000 pop. |
| This county: | 0.04 / 10,000 pop. |
| California: | 0.04 / 10,000 pop. |
| Here: | 0.67 / 10,000 pop. |
| State: | 0.62 / 10,000 pop. |
| This county: | 2.02 / 10,000 pop. |
| State: | 1.49 / 10,000 pop. |
| This county: | 5.23 / 10,000 pop. |
| California: | 7.42 / 10,000 pop. |
| Here: | 7.1% |
| California: | 7.3% |
| This county: | 29.2% |
| California: | 21.3% |
| San Joaquin County: | 16.5% |
| California: | 17.9% |
Health and Nutrition:
| This city: | 47.9% |
| California: | 49.4% |
| Here: | 45.3% |
| California: | 48.0% |
| Here: | 28.5 |
| State: | 28.1 |
| Lodi: | 22.3% |
| State: | 20.2% |
| This city: | 11.3% |
| California: | 11.2% |
| This city: | 6.8 |
| California: | 6.8 |
| Lodi: | 32.7% |
| California: | 31.5% |
| This city: | 54.2% |
| California: | 56.4% |
| This city: | 78.6% |
| State: | 80.9% |
More about Health and Nutrition of Lodi, CA Residents
| Local government employment and payroll (March 2022) | |||||
| Function | Full-time employees | Monthly full-time payroll | Average yearly full-time wage | Part-time employees | Monthly part-time payroll |
|---|---|---|---|---|---|
| Police Protection - Officers | 77 | $806,624 | $125,708 | 2 | $4,811 |
| Firefighters | 65 | $643,304 | $118,764 | 0 | $0 |
| Electric Power | 55 | $546,434 | $119,222 | 7 | $52,428 |
| Police - Other | 41 | $272,476 | $79,749 | 5 | $8,111 |
| Streets and Highways | 38 | $282,282 | $89,142 | 0 | $0 |
| Parks and Recreation | 38 | $226,678 | $71,583 | 79 | $96,778 |
| Other and Unallocable | 38 | $220,818 | $69,732 | 2 | $2,404 |
| Sewerage | 35 | $245,610 | $84,209 | 2 | $606 |
| Financial Administration | 30 | $194,460 | $77,784 | 3 | $4,636 |
| Other Government Administration | 15 | $142,256 | $113,805 | 20 | $31,476 |
| Local Libraries | 13 | $81,979 | $75,673 | 21 | $25,013 |
| Housing and Community Development (Local) | 9 | $71,231 | $94,975 | 0 | $0 |
| Judicial and Legal | 3 | $38,768 | $155,072 | 0 | $0 |
| Fire - Other | 2 | $11,056 | $66,336 | 0 | $0 |
| Totals for Government | 459 | $3,783,976 | $98,927 | 141 | $226,263 |
Lodi government finances - Expenditure in 2021 (per resident):
- Construction - Regular Highways: $8,891,000 ($132.19)
General - Other: $1,470,000 ($21.86)
Housing and Community Development: $1,447,000 ($21.51)
Transit Utilities: $853,000 ($12.68)
Parks and Recreation: $602,000 ($8.95)
Police Protection: $245,000 ($3.64)
- Current Operations - Electric Utilities: $64,039,000 ($952.14)
Central Staff Services: $28,830,000 ($428.65)
Police Protection: $19,877,000 ($295.53)
Local Fire Protection: $10,340,000 ($153.74)
Regular Highways: $7,681,000 ($114.20)
Transit Utilities: $6,816,000 ($101.34)
Sewerage: $5,806,000 ($86.32)
Parks and Recreation: $4,444,000 ($66.07)
Water Utilities: $4,086,000 ($60.75)
Housing and Community Development: $1,847,000 ($27.46)
Financial Administration: $1,623,000 ($24.13)
Protective Inspection and Regulation - Other: $1,389,000 ($20.65)
Health - Other: $1,082,000 ($16.09)
Libraries: $1,002,000 ($14.90)
Judicial and Legal Services: $586,000 ($8.71)
- Electric Utilities - Interest on Debt: $2,290,000 ($34.05)
- General - Interest on Debt: $7,551,000 ($112.27)
- Other Capital Outlay - Local Fire Protection: $786,000 ($11.69)
General - Other: $609,000 ($9.05)
Police Protection: $367,000 ($5.46)
Parks and Recreation: $119,000 ($1.77)
Regular Highways: $26,000 ($0.39)
- Water Utilities - Interest on Debt: $843,000 ($12.53)
Lodi government finances - Revenue in 2021 (per resident):
- Charges - Sewerage: $16,781,000 ($249.50)
Other: $10,546,000 ($156.80)
Parks and Recreation: $1,141,000 ($16.96)
Housing and Community Development: $362,000 ($5.38)
- Federal Intergovernmental - Transit Utilities: $6,761,000 ($100.52)
Other: $874,000 ($12.99)
Water Utilities: $261,000 ($3.88)
- Local Intergovernmental - Transit Utilities: $400,000 ($5.95)
Other: $3,000 ($0.04)
- Miscellaneous - Interest Earnings: $11,170,000 ($166.08)
Special Assessments: $9,283,000 ($138.02)
General Revenue - Other: $5,815,000 ($86.46)
Rents: $1,705,000 ($25.35)
Donations From Private Sources: $679,000 ($10.10)
Fines and Forfeits: $221,000 ($3.29)
Sale of Property: $60,000 ($0.89)
- Revenue - Electric Utilities: $74,197,000 ($1103.17)
Water Utilities: $14,107,000 ($209.74)
Transit Utilities: $450,000 ($6.69)
- State Intergovernmental - Other: $31,406,000 ($466.95)
Highways: $2,866,000 ($42.61)
Transit Utilities: $1,684,000 ($25.04)
Electric Utilities: $568,000 ($8.45)
Sewerage: $379,000 ($5.64)
General Local Government Support: $81,000 ($1.20)
- Tax - General Sales and Gross Receipts: $19,134,000 ($284.49)
Property: $18,190,000 ($270.45)
Public Utilities Sales: $9,698,000 ($144.19)
Other: $9,593,000 ($142.63)
Other License: $2,766,000 ($41.13)
Occupation and Business License - Other: $1,703,000 ($25.32)
Other Selective Sales: $900,000 ($13.38)
Documentary and Stock Transfer: $425,000 ($6.32)
Lodi government finances - Debt in 2021 (per resident):
- Long Term Debt - Beginning Outstanding - Unspecified Public Purpose: $260,612,000 ($3874.81)
Outstanding Unspecified Public Purpose: $245,800,000 ($3654.58)
Retired Unspecified Public Purpose: $14,812,000 ($220.23)
Lodi government finances - Cash and Securities in 2021 (per resident):
- Bond Funds - Cash and Securities: $9,883,000 ($146.94)
- Other Funds - Cash and Securities: $54,198,000 ($805.82)
- Sinking Funds - Cash and Securities: $177,000 ($2.63)
6.18% of this county's 2021 resident taxpayers lived in other counties in 2020 ($75,687 average adjusted gross income)
| Here: | 6.18% |
| California average: | 5.19% |
0.01% of residents moved from foreign countries ($71 average AGI)
San Joaquin County: 0.01% California average: 0.03%
Top counties from which taxpayers relocated into this county between 2020 and 2021:
| from Alameda County, CA | |
| from Santa Clara County, CA | |
| from Stanislaus County, CA |
5.64% of this county's 2020 resident taxpayers moved to other counties in 2021 ($66,959 average adjusted gross income)
| Here: | 5.64% |
| California average: | 6.14% |
0.01% of residents moved to foreign countries ($82 average AGI)
San Joaquin County: 0.01% California average: 0.02%
Top counties to which taxpayers relocated from this county between 2020 and 2021:
| to Stanislaus County, CA | |
| to Sacramento County, CA | |
| to Alameda County, CA |
| Businesses in Lodi, CA | ||||
| Name | Count | Name | Count | |
|---|---|---|---|---|
| 7-Eleven | 1 | Lowe's | 1 | |
| 99 Cents Only Stores | 1 | Marshalls | 1 | |
| AT&T | 1 | MasterBrand Cabinets | 1 | |
| Applebee's | 1 | McDonald's | 5 | |
| AutoZone | 1 | Microtel | 1 | |
| Baskin-Robbins | 2 | Motel 6 | 1 | |
| Best Western | 2 | New Balance | 1 | |
| Blockbuster | 1 | Nike | 3 | |
| Budget Car Rental | 1 | Panera Bread | 1 | |
| Burger King | 3 | Payless | 1 | |
| CVS | 2 | Penske | 1 | |
| Carl\s Jr. | 2 | Pier 1 Imports | 1 | |
| Chevrolet | 1 | Pizza Hut | 1 | |
| Cold Stone Creamery | 1 | Quality | 1 | |
| Curves | 1 | Quiznos | 1 | |
| DHL | 2 | RadioShack | 2 | |
| Decora Cabinetry | 1 | Rite Aid | 1 | |
| Dennys | 2 | SAS Shoes | 1 | |
| FedEx | 9 | Safeway | 1 | |
| GNC | 2 | Staples | 1 | |
| H&R Block | 3 | Starbucks | 5 | |
| Hilton | 1 | Subway | 6 | |
| Holiday Inn | 1 | T-Mobile | 3 | |
| Honda | 1 | Taco Bell | 4 | |
| IHOP | 1 | Target | 1 | |
| JCPenney | 1 | The Room Place | 1 | |
| Jack In The Box | 2 | Toyota | 1 | |
| Jones New York | 4 | U-Haul | 2 | |
| KFC | 2 | UPS | 12 | |
| Kmart | 1 | Vans | 3 | |
| Kohl's | 1 | Vons | 1 | |
| Kroger | 2 | Walgreens | 1 | |
| Lane Furniture | 2 | Walmart | 1 | |
| Little Caesars Pizza | 1 | Wendy's | 1 | |
| Long John Silver's | 1 | |||
Strongest AM radio stations in Lodi:
- KCVR (1570 AM; 5 kW; LODI, CA; Owner: ENTRAVISION HOLDINGS, LLC)
- KHTK (1140 AM; 50 kW; SACRAMENTO, CA; Owner: INFINITY RADIO SUBSIDIARY OPERATIONS INC.)
- KCBC (770 AM; 50 kW; RIVERBANK, CA; Owner: KIERTRON, INC.)
- KSTE (650 AM; 25 kW; RANCHO CORDOVA, CA; Owner: AMFM RADIO LICENSES, L.L.C.)
- KSTN (1420 AM; 5 kW; STOCKTON, CA; Owner: SAN JOAQUIN BROADCASTING CO.)
- KNBR (680 AM; 50 kW; SAN FRANCISCO, CA; Owner: KNBR LICO, INC.)
- KGO (810 AM; 50 kW; SAN FRANCISCO, CA; Owner: KGO-AM RADIO, INC.)
- KTRB (860 AM; 50 kW; MODESTO, CA; Owner: PAPPAS RADIO OF CALIFORNIA, A CALIFORNIA LIMITED PARTNERSHIP)
- KFIA (710 AM; 25 kW; CARMICHAEL, CA; Owner: VISTA BROADCASTING INC.)
- KTCT (1050 AM; 50 kW; SAN MATEO, CA; Owner: SUSQUEHANNA RADIO CORP.)
- KCBS (740 AM; 50 kW; SAN FRANCISCO, CA; Owner: INFINITY BROADCASTING OPERATIONS, INC.)
- KFAX (1100 AM; 50 kW; SAN FRANCISCO, CA; Owner: GOLDEN GATE BROADCASTING CO, INC.)
- KFBK (1530 AM; 50 kW; SACRAMENTO, CA; Owner: AMFM RADIO LICENSES, L.L.C.)
Strongest FM radio stations in Lodi:
- KJOY (99.3 FM; STOCKTON, CA; Owner: CITADEL BROADCASTING COMPANY)
- KWIN (97.7 FM; LODI, CA; Owner: CITADEL BROADCASTING COMPANY)
- KKSF-FM1 (103.7 FM; PLEASANTON, ETC., CA; Owner: AMFM RADIO LICENSES, L.L.C.)
- KBLX-FM2 (102.9 FM; PLEASANTON, CA; Owner: ICBC BROADCAST HOLDINGS -CA, INC.)
- KSOL-FM3 (98.9 FM; PLEASANTON, CA; Owner: TMS LICENSE CALIFORNIA, INC)
- KFRC-FM3 (99.7 FM; WALNUT CREEK, CA; Owner: INFINITY KFRC-FM, INC.)
- KZBR-FM1 (95.7 FM; WALNUT CREEK, CA; Owner: BONNEVILLE HOLDING COMPANY)
- KQOD (100.1 FM; STOCKTON, CA; Owner: CAPSTAR TX LIMITED PARTNERSHIP)
- KMEL-FM1 (106.1 FM; CONCORD, CA; Owner: AMFM RADIO LICENSES, L.L.C.)
- KISQ-FM3 (98.1 FM; CONCORD, CA; Owner: AMFM RADIO LICENSES, L.L.C.)
- KOSO (93.1 FM; PATTERSON, CA; Owner: CAPSTAR TX LIMITED PARTNERSHIP)
- K238AC (95.5 FM; SALIDA, CA; Owner: FAMILY STATIONS, INC.)
- KEDR (88.1 FM; SACRAMENTO, CA; Owner: FAMILY STATIONS, INC.)
- KXJZ (88.9 FM; SACRAMENTO, CA; Owner: CALIFORNIA STATE UNIV., SACRAMENTO)
- KUOP (91.3 FM; STOCKTON, CA; Owner: UNIVERSITY OF THE PACIFIC)
- KUIC (95.3 FM; VACAVILLE, CA; Owner: KUIC, INC.)
- KYCC (90.1 FM; STOCKTON, CA; Owner: YOUR CHRISTIAN COMPANION NETWORK, INC.)
- KHOP (95.1 FM; OAKDALE, CA; Owner: CITADEL BROADCASTING COMPANY)
- KBAA (94.5 FM; GILROY, CA; Owner: INFINITY RADIO OPERATIONS INC.)
- KXCL (103.9 FM; YUBA CITY, CA; Owner: HARLAN COMMUNICATIONS, INC.)
TV broadcast stations around Lodi:
- KUVS (Channel 19; MODESTO, CA; Owner: KUVS LICENSE PARTNERSHIP, G.P.)
- KOVR (Channel 13; STOCKTON, CA; Owner: SCI - SACRAMENTO LICENSEE, LLC)
- KXTV (Channel 10; SACRAMENTO, CA; Owner: KXTV, INC.)
- KCRA-TV (Channel 3; SACRAMENTO, CA; Owner: KCRA HEARST-ARGYLE TELEVISION, INC.)
- KQCA (Channel 58; STOCKTON, CA; Owner: KCRA HEARST-ARGYLE TELEVISION, INC.)
- KSPX (Channel 29; SACRAMENTO, CA; Owner: PAXSON SACRAMENTO LICENSE, INC.)
- KMAX-TV (Channel 31; SACRAMENTO, CA; Owner: UPN STATIONS GROUP INC.)
- KTXL (Channel 40; SACRAMENTO, CA; Owner: CHANNEL 40, INC.)
- KVIE (Channel 6; SACRAMENTO, CA; Owner: KVIE, INC.)
- KDTS-CA (Channel 52; STOCKTON, CA; Owner: WORD OF GOD FELLOWSHIP, INC.)
- KMMK-LP (Channel 14; SACRAMENTO, CA; Owner: CABALLERO TELEVISION TEXAS, L.L.C.)
- KEZT-CA (Channel 23; SACRAMENTO, CA; Owner: TELEFUTURA SACRAMENTO LLC)
- KMMW-LP (Channel 47; STOCKTON, CA; Owner: CABALLERO TELEVISION TEXAS, L.L.C.)
Medal of Honor Recipients
Medal of Honor Recipient born in Lodi: Maximo Yabes.
- National Bridge Inventory (NBI) Statistics
- 54Number of bridges
- 600ft / 183mTotal length
- $3,838,000Total costs
- 1,334,836Total average daily traffic
- 220,595Total average daily truck traffic
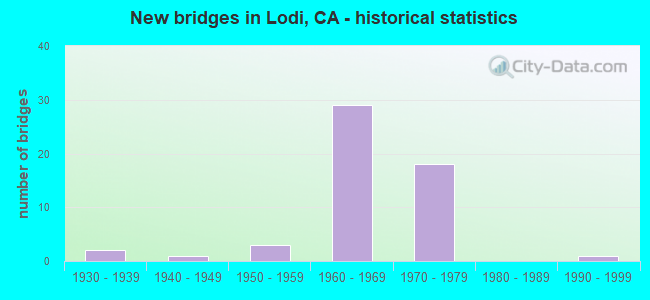
- New bridges - historical statistics
- 21930-1939
- 11940-1949
- 31950-1959
- 291960-1969
- 181970-1979
- 11990-1999
FCC Registered Antenna Towers: 156 (See the full list of FCC Registered Antenna Towers)
FCC Registered Broadcast Land Mobile Towers: 39 (See the full list of FCC Registered Broadcast Land Mobile Towers in Lodi, CA)
FCC Registered Microwave Towers: 159 (See the full list of FCC Registered Microwave Towers in this town)
FCC Registered Paging Towers: 3 (See the full list of FCC Registered Paging Towers)
FCC Registered Amateur Radio Licenses: 318 (See the full list of FCC Registered Amateur Radio Licenses in Lodi)
FAA Registered Aircraft Manufacturers and Dealers: 1 (See the full list of FAA Registered Manufacturers and Dealers in Lodi)
FAA Registered Aircraft: 67 (See the full list of FAA Registered Aircraft)
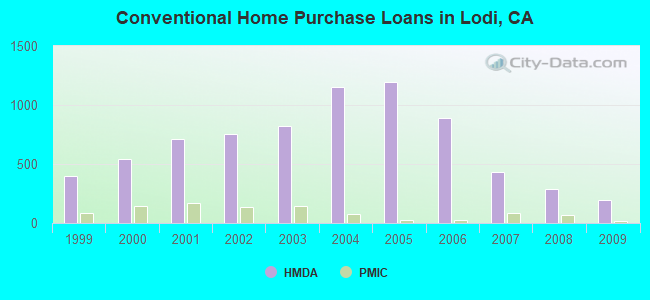
| Home Mortgage Disclosure Act Aggregated Statistics For Year 2009 (Based on 7 full and 6 partial tracts) | ||||||||||||||
| A) FHA, FSA/RHS & VA Home Purchase Loans | B) Conventional Home Purchase Loans | C) Refinancings | D) Home Improvement Loans | E) Loans on Dwellings For 5+ Families | F) Non-occupant Loans on < 5 Family Dwellings (A B C & D) | G) Loans On Manufactured Home Dwelling (A B C & D) | ||||||||
|---|---|---|---|---|---|---|---|---|---|---|---|---|---|---|
| Number | Average Value | Number | Average Value | Number | Average Value | Number | Average Value | Number | Average Value | Number | Average Value | Number | Average Value | |
| LOANS ORIGINATED | 246 | $170,474 | 191 | $164,438 | 503 | $208,548 | 32 | $64,541 | 3 | $2,905,697 | 98 | $127,890 | 1 | $143,720 |
| APPLICATIONS APPROVED, NOT ACCEPTED | 20 | $171,900 | 16 | $149,779 | 54 | $198,821 | 7 | $25,514 | 0 | $0 | 5 | $94,136 | 0 | $0 |
| APPLICATIONS DENIED | 25 | $183,682 | 42 | $136,243 | 206 | $224,473 | 25 | $89,061 | 0 | $0 | 33 | $115,247 | 4 | $77,480 |
| APPLICATIONS WITHDRAWN | 35 | $166,274 | 37 | $162,051 | 168 | $202,697 | 6 | $102,637 | 1 | $55,950 | 19 | $129,126 | 0 | $0 |
| FILES CLOSED FOR INCOMPLETENESS | 7 | $253,141 | 13 | $195,627 | 50 | $223,579 | 0 | $0 | 0 | $0 | 8 | $160,508 | 0 | $0 |
Detailed mortgage data for all 13 tracts in Lodi, CA
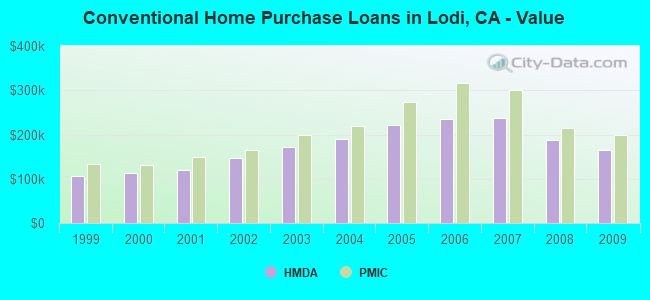
| Private Mortgage Insurance Companies Aggregated Statistics For Year 2009 (Based on 7 full and 5 partial tracts) | ||||||
| A) Conventional Home Purchase Loans | B) Refinancings | C) Non-occupant Loans on < 5 Family Dwellings (A & B) | ||||
|---|---|---|---|---|---|---|
| Number | Average Value | Number | Average Value | Number | Average Value | |
| LOANS ORIGINATED | 17 | $199,678 | 4 | $298,235 | 1 | $186,000 |
| APPLICATIONS APPROVED, NOT ACCEPTED | 5 | $132,000 | 8 | $255,220 | 0 | $0 |
| APPLICATIONS DENIED | 4 | $137,960 | 3 | $179,183 | 0 | $0 |
| APPLICATIONS WITHDRAWN | 2 | $176,260 | 1 | $268,960 | 0 | $0 |
| FILES CLOSED FOR INCOMPLETENESS | 1 | $85,570 | 1 | $379,200 | 0 | $0 |
2005 - 2018 National Fire Incident Reporting System (NFIRS) incidents
- Fire incident types reported to NFIRS in Lodi, CA
- 1,01557.6%Outside Fires
- 48427.5%Structure Fires
- 25514.5%Mobile Property/Vehicle Fires
- 90.5%Other
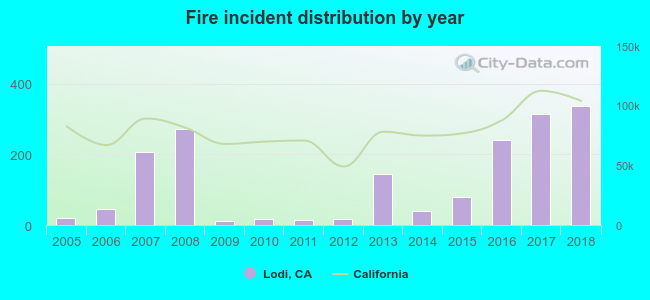 According to the data from the years 2005 - 2018 the average number of fires per year is 126. The highest number of fire incidents - 338 took place in 2018, and the least - 12 in 2009. The data has an increasing trend.
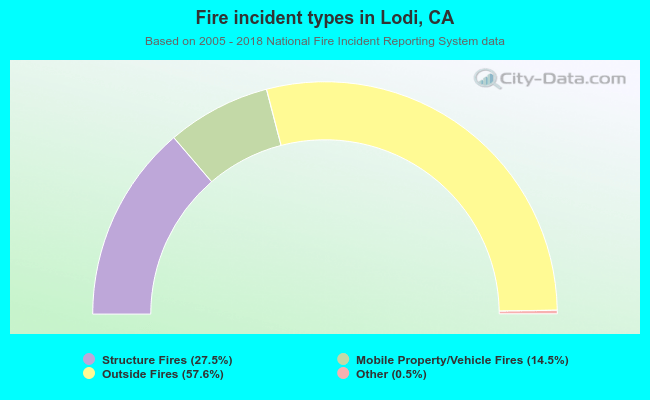 When looking into fire subcategories, the most reports belonged to: Outside Fires (57.6%), and Structure Fires (27.5%).
Fire-safe hotels and motels in Lodi, California:
- Lodi Comfort Inn, 118 N Cherokee Ln, Lodi, California 95240 , Phone: (209) 367-4848, Fax: (209) 367-4898
- Best Western Royal Host Inn, 710 S Cherokee Ln, Lodi, California 95240 , Phone: (209) 369-8484, Fax: (209) 369-0654
- Modern Motor Lodge, 1050 S Cherokee Ln, Lodi, California 95240 , Phone: (209) 333-8844
- Holiday Inn Express, 1140 S Cherokee Ln, Lodi, California 95240 , Phone: (209) 334-6422, Fax: (209) 368-7967
- Hampton Inn & Suites, 1337 S Beckman Rd, Lodi, California 95240 , Phone: (209) 369-2700, Fax: (209) 369-4050
- Holiday Inn Express, 1337 E Kettleman Ln, Lodi, California 95240 , Phone: (209) 329-0751, Fax: (209) 858-1800
- Best Western I-5 Inn & Suites, 6411 W Banner St Lodi, Lodi, California 95242 , Phone: (209) 367-3000, Fax: (209) 365-1765
| Most common first names in Lodi, CA among deceased individuals | ||
| Name | Count | Lived (average) |
|---|---|---|
| John | 486 | 77.7 years |
| William | 314 | 77.0 years |
| Mary | 263 | 80.1 years |
| James | 221 | 74.6 years |
| Robert | 215 | 72.4 years |
| George | 192 | 77.6 years |
| Charles | 169 | 76.8 years |
| Helen | 159 | 82.2 years |
| Henry | 145 | 79.7 years |
| Frank | 140 | 76.3 years |
| Most common last names in Lodi, CA among deceased individuals | ||
| Last name | Count | Lived (average) |
|---|---|---|
| Smith | 120 | 79.3 years |
| Johnson | 99 | 76.0 years |
| Miller | 96 | 78.4 years |
| Brown | 65 | 74.2 years |
| Reiswig | 58 | 80.7 years |
| Williams | 57 | 75.8 years |
| Anderson | 56 | 79.1 years |
| Wilson | 55 | 76.1 years |
| Martin | 47 | 74.9 years |
| Jones | 46 | 77.8 years |
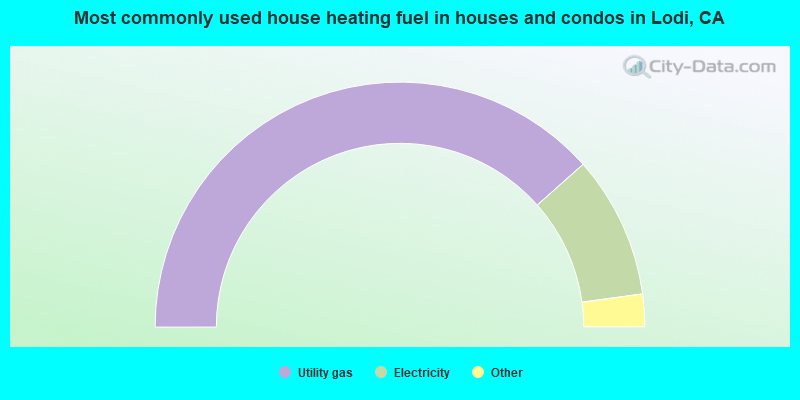
- 76.8%Utility gas
- 18.8%Electricity
- 2.6%Bottled, tank, or LP gas
- 0.9%Solar energy
- 0.5%Wood
- 0.3%No fuel used
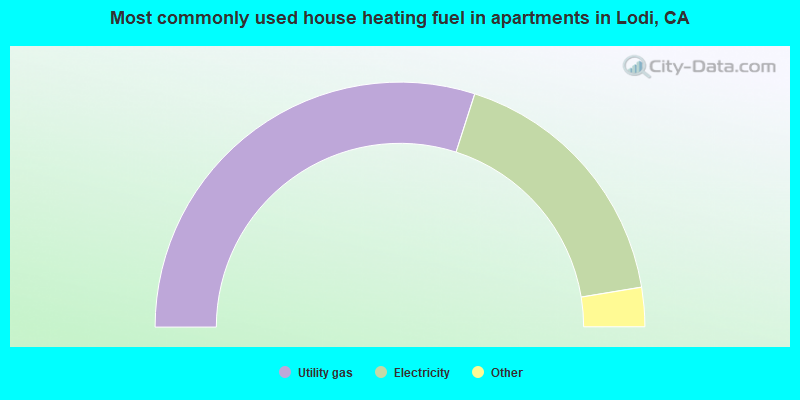
- 59.9%Utility gas
- 34.9%Electricity
- 2.5%No fuel used
- 2.1%Bottled, tank, or LP gas
- 0.3%Solar energy
- 0.2%Other fuel
- 0.1%Wood
Lodi compared to California state average:
- Unemployed percentage below state average.
- Black race population percentage significantly below state average.
- Length of stay since moving in below state average.
Lodi on our top lists:
- #15 on the list of "Top 101 cities with largest percentage of males in occupations: farming, fishing, and forestry occupations (population 50,000+)"
- #15 on the list of "Top 101 cities with largest percentage of females in occupations: farming, fishing, and forestry occupations (population 50,000+)"
- #17 on the list of "Top 101 cities with largest percentage of males in industries: agriculture, forestry, fishing and hunting (population 50,000+)"
- #19 on the list of "Top 101 cities with the highest maximum monthly sunshine amount (population 50,000+)"
- #21 on the list of "Top 101 cities with largest percentage of females in industries: agriculture, forestry, fishing and hunting (population 50,000+)"
- #29 on the list of "Top 101 cities with largest percentage of workers with very short commute times (9 minutes or less) (population 50,000+)"
- #35 on the list of "Top 101 cities with the largest sunshine amount differences during a year (population 50,000+)"
- #38 on the list of "Top 101 cities with largest percentage of females in occupations: education, training, and library occupations (population 50,000+)"
- #48 on the list of "Top 101 cities with the most residents born in Pakistan (population 500+)"
- #49 on the list of "Top 101 cities with the smallest percentage of likely homosexual households (counted as self-reported same-sex unmarried-partner households) (population 50,000+)"
- #50 on the list of "Top 101 cities with largest percentage of males in occupations: law enforcement workers including supervisors (population 50,000+)"
- #54 on the list of "Top 101 cities with largest percentage of females in industries: educational services (population 50,000+)"
- #56 on the list of "Top 101 cities with the largest differences between morning and afternoon humidity (population 50,000+)"
- #56 on the list of "Top 101 cities with the largest humidity differences during a year (population 50,000+)"
- #61 on the list of "Top 101 cities with the highest cost per building permit(population 50,000+)"
- #62 on the list of "Top 101 cities with the largest city-data.com crime index per police officer (population 50,000+)"
- #63 on the list of "Top 101 cities with largest percentage of males in industries: other services, except public administration (population 50,000+)"
- #66 on the list of "Top 101 cities with the highest number of days clear of clouds (population 50,000+)"
- #66 on the list of "Top 101 cities with the lowest number of days clear of clouds (population 50,000+)"
- #82 on the list of "Top 101 cities with largest percentage of females in occupations: food preparation and serving related occupations (population 50,000+)"
- #12 on the list of "Top 101 counties with the highest lead air pollution readings in 2012 (µg/m3)"
- #16 on the list of "Top 101 counties with the lowest lead air pollution readings in 2012 (µg/m3)"
- #31 on the list of "Top 101 counties with the highest Particulate Matter (PM2.5) Annual air pollution readings in 2012 (µg/m3)"
- #38 on the list of "Top 101 counties with the highest ground withdrawal of fresh water for public supply"
- #46 on the list of "Top 101 counties with the lowest Ozone (1-hour) air pollution readings in 2012 (ppm)"

|
|
Total of 108 patent applications in 2008-2024.