Estimated zip code population in 2022: 27,205 Zip code population in 2010: 25,393 Zip code population in 2000: 22,071
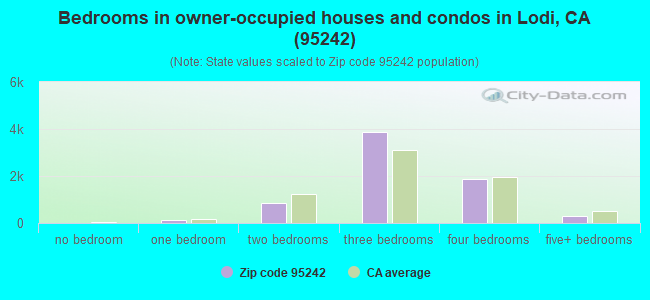
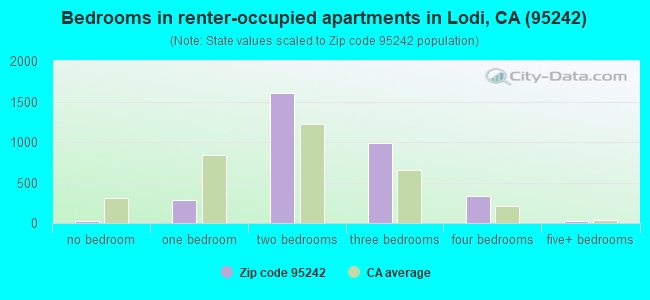
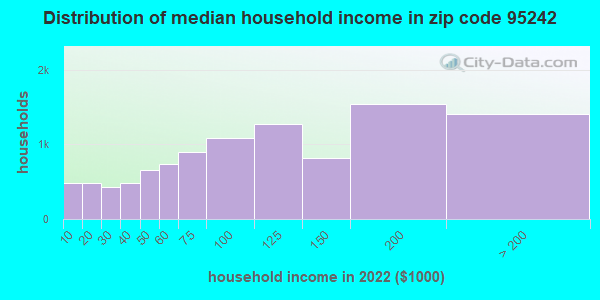
Houses and condos: 10,983 Renter-occupied apartments: 3,273
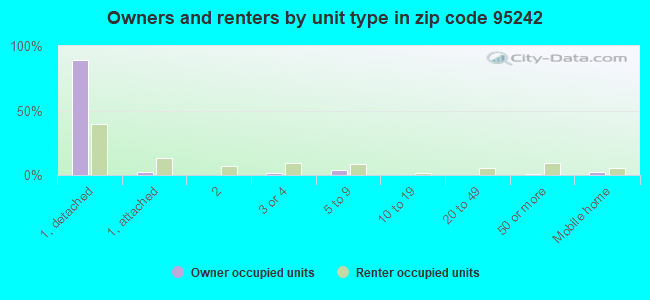
% of renters here:
32%
State:
44%
March 2022 cost of living index in zip code 95242: 100.3 (near average, U.S. average is 100)
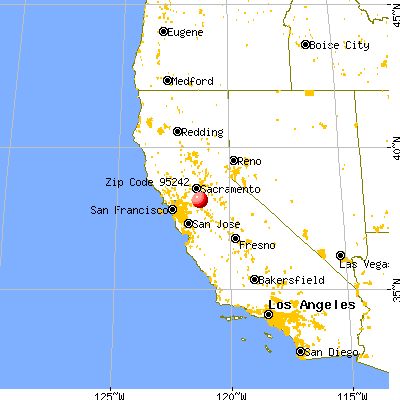
Land area: 96.0 sq. mi. Water area: 2.5 sq. mi.
Population density: 283 people per square mile
(very low).
OSM Map
General Map
Google Map
MSN Map
OSM Map
General Map
Google Map
MSN Map
OSM Map
General Map
Google Map
MSN Map
OSM Map
General Map
Google Map
MSN Map
Please wait while loading the map...
Real estate property taxes paid for housing units in 2022:
This zip code:
0.7% ($3,734)
California:
0.7% ($4,831)
Median real estate property taxes paid for housing units with mortgages in 2022: $4,037 (0.7%) Median real estate property taxes paid for housing units with no mortgage in 2022: $3,409 (0.6%)
Business Search- 14 Million verified businesses
Males: 13,420
(49.3%)
Females: 13,784
(50.7%)
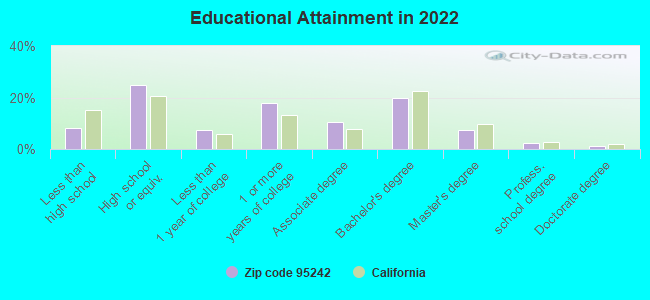
For population 25 years and over in 95242:
High school or higher: 91.4%
Bachelor's degree or higher: 30.9%
Graduate or professional degree: 11.0%
Unemployed: 7.0%
Mean travel time to work (commute): 24.3 minutes
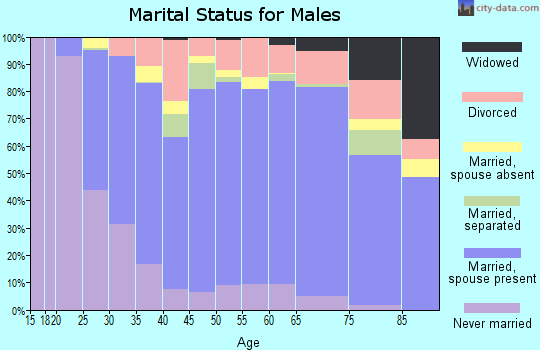
For population 15 years and over in 95242:
Never married: 28.0%
Now married: 53.8%
Separated: 1.9%
Widowed: 6.0%
Divorced: 10.3%
Zip code 95242 compared to state average:
Black race population percentage significantly below state average.
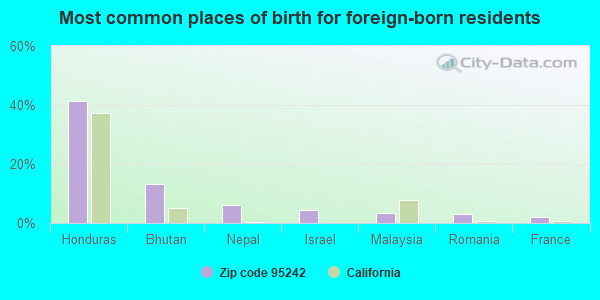
Foreign-born population percentage significantly below state average.
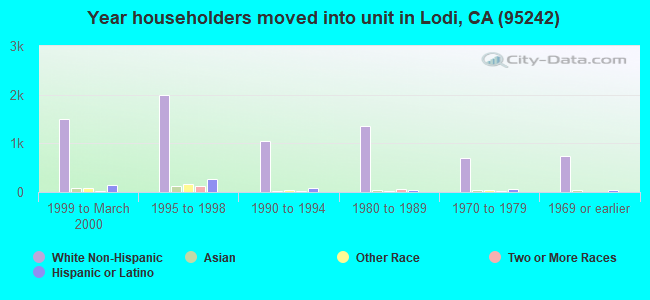
Length of stay since moving in above state average.
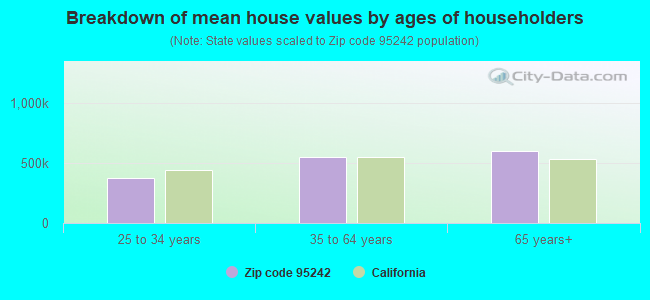
Estimated median house/condo value in 2022: $562,904
95242:
$562,904
California:
$715,900
According to our research of California and other state lists, there were 20 registered sex offenders living in 95242 zip code as of April 27, 2024. The ratio of all residents to sex offenders in zip code 95242 is 1,306 to 1. The ratio of registered sex offenders to all residents in this zip code is lower than the state average.
Median resident age:
This zip code:
40.4 years
California median age:
37.9 years
Average household size:
This zip code:
2.6 people
California:
2.8 people
Averages for the 2020 tax year for zip code 95242, filed in 2021:
Average Adjusted Gross Income (AGI) in 2020: $84,378 (Individual Income Tax Returns)
Here:
$84,378
State:
$95,910
Salary/wage: $73,477 (reported on 76.7% of returns)
Here:
$73,477
State:
$77,331
(% of AGI for various income ranges: 1256.7% for AGIs below $25k, 3746.0% for AGIs $25k-50k, 7437.2% for AGIs $50k-75k, 10074.5% for AGIs $75k-100k, 20417.6% for AGIs $100k-200k, 77885.2% for AGIs over 200k)
Taxable interest for individuals: $1,388 (reported on 44.4% of returns)
This zip code:
$1,388
California:
$2,294
(% of AGI for various income ranges: 24.4% for AGIs below $25k, 34.6% for AGIs $25k-50k, 51.3% for AGIs $50k-75k, 103.8% for AGIs $75k-100k, 185.0% for AGIs $100k-200k, 1160.0% for AGIs over 200k)
Ordinary dividends: $5,824 (reported on 22.6% of returns)
Here:
$5,824
State:
$10,949
(% of AGI for various income ranges: 48.4% for AGIs below $25k, 65.0% for AGIs $25k-50k, 149.7% for AGIs $50k-75k, 215.0% for AGIs $75k-100k, 367.6% for AGIs $100k-200k, 2551.1% for AGIs over 200k)
Net capital gain/loss in AGI: +$15,914 (reported on 21.7% of returns)
Here:
+$15,914
State:
+$49,306
(% of AGI for various income ranges: 25.5% for AGIs below $25k, 49.2% for AGIs $25k-50k, 90.6% for AGIs $50k-75k, 293.2% for AGIs $75k-100k, 626.2% for AGIs $100k-200k, 12204.4% for AGIs over 200k)
Profit/loss from business: +$17,561 (reported on 15.3% of returns)
Here:
+$17,561
State:
+$15,671
(% of AGI for various income ranges: 133.7% for AGIs below $25k, 196.0% for AGIs $25k-50k, 387.3% for AGIs $50k-75k, 348.6% for AGIs $75k-100k, 754.9% for AGIs $100k-200k, 4407.8% for AGIs over 200k)
Taxable individual retirement arrangement distribution: $19,783 (reported on 10.4% of returns)
95242:
$19,783
California:
$23,505
(% of AGI for various income ranges: 92.7% for AGIs below $25k, 149.9% for AGIs $25k-50k, 270.1% for AGIs $50k-75k, 443.1% for AGIs $75k-100k, 679.1% for AGIs $100k-200k, 2507.0% for AGIs over 200k)
Self-employed (Keogh) retirement plans: $26,970 (reported on 0.7% of returns)
95242:
$26,970
California:
$30,163
(% of AGI for various income ranges: 60.0% for AGIs $100k-200k, 696.7% for AGIs over 200k)
Total itemized deductions: $31,045 (reported on 16.4% of returns)
Here:
$31,045
State:
$39,517
(% of AGI for various income ranges: 115.0% for AGIs below $25k, 207.6% for AGIs $25k-50k, 584.3% for AGIs $50k-75k, 973.8% for AGIs $75k-100k, 1887.7% for AGIs $100k-200k, 7960.7% for AGIs over 200k)
Charity contributions: $7,191 (reported on 13.7% of returns)
Here:
$7,191
State:
$12,598
(% of AGI for various income ranges: 8.1% for AGIs below $25k, 25.3% for AGIs $25k-50k, 69.0% for AGIs $50k-75k, 146.3% for AGIs $75k-100k, 336.2% for AGIs $100k-200k, 2207.4% for AGIs over 200k)
Taxes paid: $8,439 (reported on 16.4% of returns)
95242:
$8,439
State:
$8,807
(% of AGI for various income ranges: 19.3% for AGIs below $25k, 41.4% for AGIs $25k-50k, 150.3% for AGIs $50k-75k, 284.9% for AGIs $75k-100k, 598.1% for AGIs $100k-200k, 1907.4% for AGIs over 200k)
Earned income credit: $1,991 (reported on 8.8% of returns)
Here:
$1,991
State:
$2,074
(% of AGI for various income ranges: 65.9% for AGIs below $25k, 51.7% for AGIs $25k-50k, 1.4% for AGIs $50k-75k)
Percentage of individuals using paid preparers for their 2020 taxes: 93.7%
Here:
94%
State:
92%
(% for various income ranges: 91.7% for AGIs below $25k, 94.0% for AGIs $25k-50k, 94.6% for AGIs $50k-75k, 93.2% for AGIs $75k-100k, 94.6% for AGIs $100k-200k, 95.9% for AGIs over 200k)
Averages for the 2012 tax year for zip code 95242, filed in 2013:
Average Adjusted Gross Income (AGI) in 2012: $69,032 (Individual Income Tax Returns)
Here:
$69,032
State:
$72,726
Salary/wage: $57,517 (reported on 76.5% of returns)
Here:
$57,517
State:
$59,079
(% of AGI for various income ranges: 64.2% for AGIs below $25k, 68.8% for AGIs $25k-50k, 68.9% for AGIs $50k-75k, 70.5% for AGIs $75k-100k, 72.1% for AGIs $100k-200k, 43.9% for AGIs over 200k)
Taxable interest for individuals: $1,574 (reported on 47.8% of returns)
This zip code:
$1,574
California:
$2,146
(% of AGI for various income ranges: 1.8% for AGIs below $25k, 1.1% for AGIs $25k-50k, 1.2% for AGIs $50k-75k, 0.7% for AGIs $75k-100k, 0.9% for AGIs $100k-200k, 1.3% for AGIs over 200k)
Ordinary dividends: $5,374 (reported on 25.0% of returns)
Here:
$5,374
State:
$9,308
(% of AGI for various income ranges: 3.0% for AGIs below $25k, 1.8% for AGIs $25k-50k, 1.5% for AGIs $50k-75k, 1.4% for AGIs $75k-100k, 1.6% for AGIs $100k-200k, 2.8% for AGIs over 200k)
Net capital gain/loss in AGI: +$9,219 (reported on 20.9% of returns)
Here:
+$9,219
State:
+$30,460
(% of AGI for various income ranges: 0.9% for AGIs $25k-50k, 0.2% for AGIs $50k-75k, 0.4% for AGIs $75k-100k, 1.5% for AGIs $100k-200k, 8.9% for AGIs over 200k)
Profit/loss from business: +$19,207 (reported on 15.5% of returns)
Here:
+$19,207
State:
+$17,064
(% of AGI for various income ranges: 7.4% for AGIs below $25k, 4.3% for AGIs $25k-50k, 3.9% for AGIs $50k-75k, 2.9% for AGIs $75k-100k, 3.2% for AGIs $100k-200k, 6.1% for AGIs over 200k)
Taxable individual retirement arrangement distribution: $14,392 (reported on 13.3% of returns)
95242:
$14,392
California:
$19,557
(% of AGI for various income ranges: 4.3% for AGIs below $25k, 3.7% for AGIs $25k-50k, 3.0% for AGIs $50k-75k, 3.6% for AGIs $75k-100k, 2.6% for AGIs $100k-200k, 1.6% for AGIs over 200k)
Self-employment retirement plans: $22,564 (reported on 1.0% of returns)
95242:
$22,564
California:
$24,530
(% of AGI for various income ranges: 0.4% for AGIs $50k-75k, 0.2% for AGIs $100k-200k, 0.8% for AGIs over 200k)
Total itemized deductions: $26,920 (23% of AGI, reported on 42.4% of returns)
Here:
$26,920
State:
$34,004
Here:
23.2% of AGI
State:
22.7% of AGI
(% of AGI for various income ranges: 16.3% for AGIs below $25k, 12.1% for AGIs $25k-50k, 15.5% for AGIs $50k-75k, 16.6% for AGIs $75k-100k, 18.6% for AGIs $100k-200k, 16.7% for AGIs over 200k)
Charity contributions: $3,847 (reported on 36.6% of returns)
Here:
$3,847
State:
$4,659
(% of AGI for various income ranges: 1.2% for AGIs below $25k, 1.3% for AGIs $25k-50k, 1.8% for AGIs $50k-75k, 1.9% for AGIs $75k-100k, 2.5% for AGIs $100k-200k, 2.2% for AGIs over 200k)
Taxes paid: $9,470 (reported on 42.2% of returns)
95242:
$9,470
State:
$14,448
(% of AGI for various income ranges: 2.6% for AGIs below $25k, 2.8% for AGIs $25k-50k, 4.1% for AGIs $50k-75k, 5.0% for AGIs $75k-100k, 6.9% for AGIs $100k-200k, 8.0% for AGIs over 200k)
Earned income credit: $2,047 (reported on 12.4% of returns)
Here:
$2,047
State:
$2,286
(% of AGI for various income ranges: 4.6% for AGIs below $25k, 0.9% for AGIs $25k-50k)
Percentage of individuals using paid preparers for their 2012 taxes: 61.7%
Here:
62%
State:
64%
(% for various income ranges: 53.7% for AGIs below $25k, 58.9% for AGIs $25k-50k, 64.5% for AGIs $50k-75k, 66.7% for AGIs $75k-100k, 70.8% for AGIs $100k-200k, 80.0% for AGIs over 200k)
Averages for the 2004 tax year for zip code 95242, filed in 2005:
Average Adjusted Gross Income (AGI) in 2004: $58,755 (Individual Income Tax Returns)
Here:
$58,755
State:
$58,600
Salary/wage: $49,773 (reported on 77.6% of returns)
Here:
$49,773
State:
$49,455
(% of AGI for various income ranges: 516.8% for AGIs below $10k, 63.5% for AGIs $10k-25k, 72.5% for AGIs $25k-50k, 73.0% for AGIs $50k-75k, 74.7% for AGIs $75k-100k, 56.2% for AGIs over 100k)
Taxable interest for individuals: $1,857 (reported on 59.3% of returns)
This zip code:
$1,857
California:
$2,365
(% of AGI for various income ranges: 57.9% for AGIs below $10k, 4.1% for AGIs $10k-25k, 2.3% for AGIs $25k-50k, 1.5% for AGIs $50k-75k, 1.1% for AGIs $75k-100k, 1.6% for AGIs over 100k)
Taxable dividends: $3,239 (reported on 31.1% of returns)
Here:
$3,239
State:
$4,746
(% of AGI for various income ranges: 42.1% for AGIs below $10k, 2.9% for AGIs $10k-25k, 1.5% for AGIs $25k-50k, 1.4% for AGIs $50k-75k, 1.6% for AGIs $75k-100k, 1.6% for AGIs over 100k)
Net capital gain/loss: +$16,078 (reported on 26.6% of returns)
Here:
+$16,078
State:
+$23,418
(% of AGI for various income ranges: 8.7% for AGIs below $10k, 0.8% for AGIs $10k-25k, 0.6% for AGIs $25k-50k, 1.4% for AGIs $50k-75k, 2.0% for AGIs $75k-100k, 14.2% for AGIs over 100k)
Profit/loss from business: +$22,243 (reported on 16.3% of returns)
Here:
+$22,243
State:
+$16,826
(% of AGI for various income ranges: 13.7% for AGIs below $10k, 5.6% for AGIs $10k-25k, 4.9% for AGIs $25k-50k, 4.8% for AGIs $50k-75k, 4.5% for AGIs $75k-100k, 7.7% for AGIs over 100k)
IRA payment deduction: $3,174 (reported on 3.3% of returns)
95242:
$3,174
California:
$3,192
(% of AGI for various income ranges: 2.7% for AGIs below $10k, 0.2% for AGIs $10k-25k, 0.3% for AGIs $25k-50k, 0.2% for AGIs $50k-75k, 0.2% for AGIs $75k-100k, 0.1% for AGIs over 100k)
Self-employed pension: $16,137 (reported on 1.9% of returns)
Here:
$16,137
California:
$17,688
(% of AGI for various income ranges: 0.2% for AGIs $25k-50k, 0.2% for AGIs $50k-75k, 0.4% for AGIs $75k-100k, 0.8% for AGIs over 100k)
Total itemized deductions: $23,135 (24% of AGI, reported on 45.8% of returns)
Here:
$23,135
State:
$28,113
Here:
24.4% of AGI
State:
25.3% of AGI
(% of AGI for various income ranges: 132.5% for AGIs below $10k, 16.8% for AGIs $10k-25k, 15.8% for AGIs $25k-50k, 19.5% for AGIs $50k-75k, 21.0% for AGIs $75k-100k, 16.8% for AGIs over 100k)
Charity contributions deductions: $3,454 (3% of AGI, reported on 41.5% of returns)
Here:
$3,454
State:
$3,923
Here:
3.5% of AGI
State:
3.3% of AGI
(% of AGI for various income ranges: 6.9% for AGIs below $10k, 1.6% for AGIs $10k-25k, 1.8% for AGIs $25k-50k, 2.3% for AGIs $50k-75k, 2.7% for AGIs $75k-100k, 2.7% for AGIs over 100k)
Total tax: $9,253 (reported on 80.4% of returns)
95242:
$9,253
State:
$10,761
(% of AGI for various income ranges: 18.1% for AGIs below $10k, 4.4% for AGIs $10k-25k, 7.1% for AGIs $25k-50k, 9.0% for AGIs $50k-75k, 10.0% for AGIs $75k-100k, 17.7% for AGIs over 100k)
Earned income credit: $1,636 (reported on 8.7% of returns)
Here:
$1,636
State:
$1,763
Percentage of individuals using paid preparers for their 2004 taxes: 66.2%
Here:
66%
State:
66%
(% for various income ranges: 54.7% for AGIs below $10k, 61.8% for AGIs $10k-25k, 65.4% for AGIs $25k-50k, 71.2% for AGIs $50k-75k, 70.8% for AGIs $75k-100k, 77.8% for AGIs over 100k)
Likely homosexual households (counted as self-reported same-sex unmarried-partner households)
Lesbian couples: 0.0% of all households
Gay men: 0.0% of all households
Household received Food Stamps/SNAP in the past 12 months: 646 Household did not receive Food Stamps/SNAP in the past 12 months: 9,538
Women who had a birth in the past 12 months: 364 (258 now married, 106 unmarried) Women who did not have a birth in the past 12 months: 5,616 (2,662 now married, 2,935 unmarried)
Housing units in zip code 95242 with a mortgage: 4,567 (350 second mortgage, 265 both second mortgage and home equity loan) Houses without a mortgage: 40
Median monthly owner costs for units with a mortgage: $2,261 Median monthly owner costs for units without a mortgage: $690
Residents with income below the poverty level in 2022:
This zip code:
7.7%
Whole state:
12.2%
Residents with income below 50% of the poverty level in 2022:
This zip code:
3.0%
Whole state:
6.2%
Median number of rooms in houses and condos:
Here:
6.3
State:
6.0
Median number of rooms in apartments:
Here:
4.6
State:
3.9
Notable locations in this zip code not listed on our city pages
Notable locations in zip code 95242: Castelanelli Brothers Dairy (A), De Snayer Dairy (B), Lima Ranch (C), Van Exel Dairy Number 1 (D), Kaehler Dairy (E), Simones Dairy (F), Kingdon (G), Lodi Municipal Service Center (H), White Slough Water Pollution Control Plant (I), Lodi Fire Department Station 4 (J), Lodi Fire Department Station 3 (K), Woodbridge Fire Protection District Station 4 (L). Display/hide their locations on the map
Parks in zip code 95242 include: Twin Oaks Park (1), Vinewood Park (2), Lodi Lake Park (3), Westgate Park (4), Beckman Park (5), Kofu Park (6), Lodi Municipal Lake Park (7). Display/hide their locations on the map
3,947 married couples with children.
1,286 single-parent households (607 men, 679 women).
78.6% of residents of 95242 zip code speak English at home.
12.8% of residents speak Spanish at home (68% very well, 17% well, 10% not well, 5% not at all).
5.7% of residents speak other Indo-European language at home (62% very well, 20% well, 17% not well, 1% not at all).
1.2% of residents speak Asian or Pacific Island language at home (37% very well, 21% well, 26% not well, 16% not at all).
1.6% of residents speak other language at home (79% very well, 20% well, 1% not well).
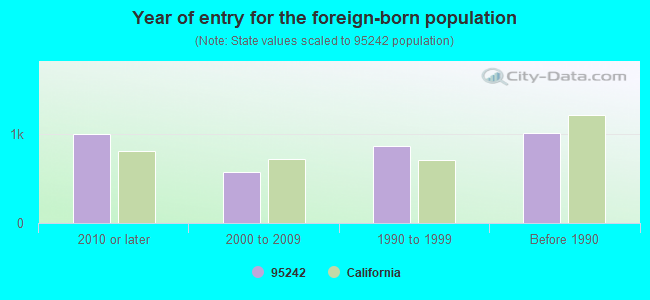
Foreign born population: 3,180 (11.7%) (48.0% of them are naturalized citizens)
Major facilities with environmental interests located in this zip code:
LODI SIMPLOT SOILBUILDERS (2929 WEST HARNEY LANE in LODI, CA)
STATE MASTER (California - Hazardous Waste Tracking) - HAZARDOU WASTE PROGRAM Small Quantity Generators, between 100 kg and 1000 kg of hazardous waste/month (Resource Conservation and Recovery Act (tracking hazardous waste)) Alternative names: J R SIMPLOT CO
LODI UNIFIED SCHOOL DISTRICT HIGH SCHOOL (3 SOUTH PACIFIC AVE in LODI, CA)
STATE MASTER (California - Hazardous Waste Tracking) - HAZARDOU WASTE PROGRAM Small Quantity Generators, between 100 kg and 1000 kg of hazardous waste/month (Resource Conservation and Recovery Act (tracking hazardous waste)) - notification Organizations: LODI U S D (CONTACT/OWNER)
Alternative names: LODI C LODI HIGH SCHOOL, LODI U S D LODI H S, LODI U S D LODI H S
HENDERSON COMMUNITY DAY (13451 EXTENSION ROAD in LODI, CA)
(National Center for Education Statistics) - STATE ID-3930377 Organizations: LODI UNIFIED (SCHOOL DISTRICT)
LAKEWOOD COMMUNITY DAY (1100 N. HAM LANE in LODI, CA)
(National Center for Education Statistics) - STATE ID-6116974 Organizations: LODI UNIFIED (SCHOOL DISTRICT)
LAKEWOOD ELEMENTARY (1100 N. HAM LANE in LODI, CA)
(National Center for Education Statistics) - STATE ID-6042139 Organizations: LODI UNIFIED (SCHOOL DISTRICT)
LODI HIGH (3 PACIFIC AVE. in LODI, CA)
(National Center for Education Statistics) - STATE ID-3934783 Organizations: LODI UNIFIED (SCHOOL DISTRICT)
LODI MIDDLE (945 S. HAM LANE in LODI, CA)
(National Center for Education Statistics) - STATE ID-6042220 Organizations: LODI UNIFIED (SCHOOL DISTRICT)
NEW HOPE CHARTER (1420 S. MILLS, #M in LODI, CA)
(National Center for Education Statistics) - STATE ID-3930435 Organizations: NEW HOPE ELEMENTARY (SCHOOL DISTRICT)
KAEHLER DAIRY (1025 E ARMSTRONG RD in LODI, CA)
National Pollutant Discharge Elimination System NON-MAJOR (Tracking pollutant discharge elimination systems) - permit Business SIC classification: DAIRY FARMS
FRANK C ALEGRE TRUCKING INC (5100 W HWY 12 in LODI, CA)
Small Quantity Generators, between 100 kg and 1000 kg of hazardous waste/month (Resource Conservation and Recovery Act (tracking hazardous waste)) - notification Organizations: FRANK AND HELEN ALEGRE (CONTACT/OWNER)
FLAG CITY CHEVRON (6421 CAPITOL AVE in LODI, CA)
CRITERIA AND HAZARDOUS AIR POLLUTANT INVENTORY (Inventory of air pollution sources) Business SIC classification: GASOLINE SERVICE STATIONS
FLAME LIQUORS (1301 W KETTLEMAN LANE in LODI, CA)
CRITERIA AND HAZARDOUS AIR POLLUTANT INVENTORY (Inventory of air pollution sources) Business SIC classification: GASOLINE SERVICE STATIONS
G.F. LIP IV, L.P. (1111 E KETTLEMAN LANE in LODI, CA)
CRITERIA AND HAZARDOUS AIR POLLUTANT INVENTORY (Inventory of air pollution sources) Business SIC classification: GASOLINE SERVICE STATIONS
Housing units lacking complete plumbing facilities: 0.7% Housing units lacking complete kitchen facilities: 2.6%
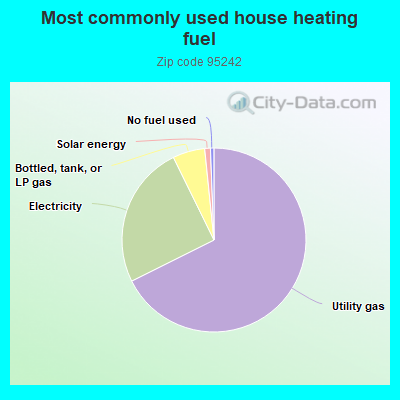
67.1%Utility gas
24.9%Electricity
5.6%Bottled, tank, or LP gas
1.0%Solar energy
0.6%No fuel used
Population in 1990: 20,669. Population change in the 1990s: +1,402 (+6.8%).
Place of birth for U.S.-born residents:
This state: 18,939
Northeast: 631
Midwest: 1,307
South: 1,348
West: 1,510
53% of the 95242 zip code residents lived in the same house 5 years ago. Out of people who lived in different houses, 66% lived in this county. Out of people who lived in different counties, 50% lived in California.
90% of the 95242 zip code residents lived in the same house 1 year ago. Out of people who lived in different houses, 58% moved from this county. Out of people who lived in different houses, 31% moved from different county within same state. Out of people who lived in different houses, 3% moved from different state. Out of people who lived in different houses, 7% moved from abroad.
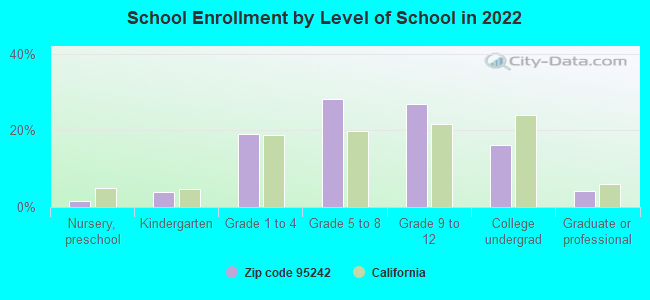
Private vs. public school enrollment:
Students in private schools in grades 1 to 8 (elementary and middle school): 430
Here:
13.7%
California:
10.5%
Students in private schools in grades 9 to 12 (high school): 222
Here:
12.6%
California:
8.5%
Students in private undergraduate colleges: 264
Here:
24.5%
California:
15.9%
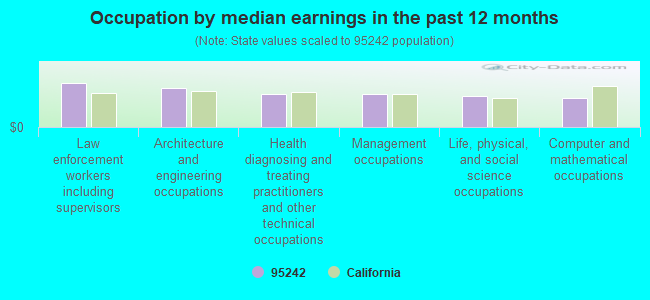
Occupation by median earnings in the past 12 months ($)
119,467Law enforcement workers including supervisors
107,035Architecture and engineering occupations
88,818Health diagnosing and treating practitioners and other technical occupations
88,547Management occupations
83,657Life, physical, and social science occupations
78,676Computer and mathematical occupations
Companies with federal contracts located in this zip code:
HERRERAS MECHANICAL DESIGN & E (647 APPLEWOOD DRIVE in LODI, CA; small business) : $411,828 in 4 contractsfrom 2001 to 2005
$187,483 with Air Force for Miscellaneous Items. Signed on 2001-09-28. Completion date: 2002-03-07.
$126,910 with Army for Aircraft Maintenance and Repair Shop Specialized Equipment. Signed on 2002-11-18. Completion date: 2003-04-23.
$88,785 with Air Force for Miscellaneous Items. Signed on 2001-09-28. Completion date: 2001-12-31.
$8,650 with Air Force for Aircraft Maintenance and Repair Shop Specialized Equipment. Signed on 2005-07-07. Completion date: 2005-11-30.
Top industries in this zip code by the number of employees in 2005:
2005 - 2018 National Fire Incident Reporting System (NFIRS) incidents
According to the data from the years 2005 - 2018 the average number of fire incidents per year is 31. The highest number of fires - 83 took place in 2018, and the least - 3 in 2015. The data has a rising trend.
When looking into fire subcategories, the most incidents belonged to: Outside Fires (58.7%), and Structure Fires (26.8%).
Fire incident types reported to NFIRS in Zip Code 95242


 Nearest zip codes: 95258, 95209, 95219, 95686, 95210, 95207.


 According to the data from the years 2005 - 2018 the average number of fire incidents per year is 31. The highest number of fires - 83 took place in 2018, and the least - 3 in 2015. The data has a rising trend.
 When looking into fire subcategories, the most incidents belonged to: Outside Fires (58.7%), and Structure Fires (26.8%).