Estimated zip code population in 2022: 42,299
Zip code population in 2010: 39,009
Zip code population in 2000: 40,594
Houses and condos: 12,784
Renter-occupied apartments: 6,093
% of renters here:
50%State:
44%
March 2022 cost of living index in zip code 95210: 99.0
(near average, U.S. average is 100)
Land area: 6.6
sq. mi.
Water area: 0.1
sq. mi.
Population density: 6,389 people per square mile (high).
OSM Map
General Map
Google Map
MSN Map
OSM Map
General Map
Google Map
MSN Map
OSM Map
General Map
Google Map
MSN Map
OSM Map
General Map
Google Map
MSN Map
Please wait while loading the map...
Real estate property taxes paid for housing units in 2022:
This zip code:
0.6% ($2,046)California:
0.7% ($4,831)
Median real estate property taxes paid for housing units with mortgages in 2022: $2,353 (0.7%)
Median real estate property taxes paid for housing units with no mortgage in 2022: $1,495 (0.5%)
Profiles of local businesses
Business Search - 14 Million verified businesses
Males: 20,447 Females: 21,853
For population 25 years and over in 95210:
High school or higher: 74.3%Bachelor's degree or higher: 10.8%Graduate or professional degree: 2.5%Unemployed: 8.3%Mean travel time to work (commute): 29.7 minutes
For population 15 years and over in 95210:
Never married: 42.9%Now married: 40.0%Separated: 2.8%Widowed: 5.9%Divorced: 8.4%
Zip code 95210 compared to state average:
Median household income below state average. Median house value below state average. Black race population percentage above state average. Median age below state average. Length of stay since moving in significantly above state average. Percentage of population with a bachelor's degree or higher significantly below state average. 16,690 39.5% Hispanic or Latino 12,500 29.6% Asian 5,394 12.8% White 4,937 11.7% Black 2,000 4.7% Two or more races 618 1.5% Native Hawaiian and Other 144 0.3% Some other race 12 0.03% American Indian
Data:
Median household income ($)
Median household income (% change since 2000)
Household income diversity
Ratio of average income to average house value (%)
Ratio of average income to average rent
Median household income ($) - White
Median household income ($) - Black or African American
Median household income ($) - Asian
Median household income ($) - Hispanic or Latino
Median household income ($) - American Indian and Alaska Native
Median household income ($) - Multirace
Median household income ($) - Other Race
Median household income for houses/condos with a mortgage ($)
Median household income for apartments without a mortgage ($)
Races - White alone (%)
Races - White alone (% change since 2000)
Races - Black alone (%)
Races - Black alone (% change since 2000)
Races - American Indian alone (%)
Races - American Indian alone (% change since 2000)
Races - Asian alone (%)
Races - Asian alone (% change since 2000)
Races - Hispanic (%)
Races - Hispanic (% change since 2000)
Races - Native Hawaiian and Other Pacific Islander alone (%)
Races - Native Hawaiian and Other Pacific Islander alone (% change since 2000)
Races - Two or more races (%)
Races - Two or more races (% change since 2000)
Races - Other race alone (%)
Races - Other race alone (% change since 2000)
Racial diversity
Unemployment (%)
Unemployment (% change since 2000)
Unemployment (%) - White
Unemployment (%) - Black or African American
Unemployment (%) - Asian
Unemployment (%) - Hispanic or Latino
Unemployment (%) - American Indian and Alaska Native
Unemployment (%) - Multirace
Unemployment (%) - Other Race
Population density (people per square mile)
Population - Males (%)
Population - Females (%)
Population - Males (%) - White
Population - Males (%) - Black or African American
Population - Males (%) - Asian
Population - Males (%) - Hispanic or Latino
Population - Males (%) - American Indian and Alaska Native
Population - Males (%) - Multirace
Population - Males (%) - Other Race
Population - Females (%) - White
Population - Females (%) - Black or African American
Population - Females (%) - Asian
Population - Females (%) - Hispanic or Latino
Population - Females (%) - American Indian and Alaska Native
Population - Females (%) - Multirace
Population - Females (%) - Other Race
Coronavirus confirmed cases (Apr 27, 2024)
Deaths caused by coronavirus (Apr 27, 2024)
Coronavirus confirmed cases (per 100k population) (Apr 27, 2024)
Deaths caused by coronavirus (per 100k population) (Apr 27, 2024)
Daily increase in number of cases (Apr 27, 2024)
Weekly increase in number of cases (Apr 27, 2024)
Cases doubled (in days) (Apr 27, 2024)
Hospitalized patients (Apr 18, 2022)
Negative test results (Apr 18, 2022)
Total test results (Apr 18, 2022)
COVID Vaccine doses distributed (per 100k population) (Sep 19, 2023)
COVID Vaccine doses administered (per 100k population) (Sep 19, 2023)
COVID Vaccine doses distributed (Sep 19, 2023)
COVID Vaccine doses administered (Sep 19, 2023)
Likely homosexual households (%)
Likely homosexual households (% change since 2000)
Likely homosexual households - Lesbian couples (%)
Likely homosexual households - Lesbian couples (% change since 2000)
Likely homosexual households - Gay men (%)
Likely homosexual households - Gay men (% change since 2000)
Cost of living index
Median gross rent ($)
Median contract rent ($)
Median monthly housing costs ($)
Median house or condo value ($)
Median house or condo value ($ change since 2000)
Mean house or condo value by units in structure - 1, detached ($)
Mean house or condo value by units in structure - 1, attached ($)
Mean house or condo value by units in structure - 2 ($)
Mean house or condo value by units in structure by units in structure - 3 or 4 ($)
Mean house or condo value by units in structure - 5 or more ($)
Mean house or condo value by units in structure - Boat, RV, van, etc. ($)
Mean house or condo value by units in structure - Mobile home ($)
Median house or condo value ($) - White
Median house or condo value ($) - Black or African American
Median house or condo value ($) - Asian
Median house or condo value ($) - Hispanic or Latino
Median house or condo value ($) - American Indian and Alaska Native
Median house or condo value ($) - Multirace
Median house or condo value ($) - Other Race
Median resident age
Resident age diversity
Median resident age - Males
Median resident age - Females
Median resident age - White
Median resident age - Black or African American
Median resident age - Asian
Median resident age - Hispanic or Latino
Median resident age - American Indian and Alaska Native
Median resident age - Multirace
Median resident age - Other Race
Median resident age - Males - White
Median resident age - Males - Black or African American
Median resident age - Males - Asian
Median resident age - Males - Hispanic or Latino
Median resident age - Males - American Indian and Alaska Native
Median resident age - Males - Multirace
Median resident age - Males - Other Race
Median resident age - Females - White
Median resident age - Females - Black or African American
Median resident age - Females - Asian
Median resident age - Females - Hispanic or Latino
Median resident age - Females - American Indian and Alaska Native
Median resident age - Females - Multirace
Median resident age - Females - Other Race
Commute - mean travel time to work (minutes)
Travel time to work - Less than 5 minutes (%)
Travel time to work - Less than 5 minutes (% change since 2000)
Travel time to work - 5 to 9 minutes (%)
Travel time to work - 5 to 9 minutes (% change since 2000)
Travel time to work - 10 to 19 minutes (%)
Travel time to work - 10 to 19 minutes (% change since 2000)
Travel time to work - 20 to 29 minutes (%)
Travel time to work - 20 to 29 minutes (% change since 2000)
Travel time to work - 30 to 39 minutes (%)
Travel time to work - 30 to 39 minutes (% change since 2000)
Travel time to work - 40 to 59 minutes (%)
Travel time to work - 40 to 59 minutes (% change since 2000)
Travel time to work - 60 to 89 minutes (%)
Travel time to work - 60 to 89 minutes (% change since 2000)
Travel time to work - 90 or more minutes (%)
Travel time to work - 90 or more minutes (% change since 2000)
Marital status - Never married (%)
Marital status - Now married (%)
Marital status - Separated (%)
Marital status - Widowed (%)
Marital status - Divorced (%)
Median family income ($)
Median family income (% change since 2000)
Median non-family income ($)
Median non-family income (% change since 2000)
Median per capita income ($)
Median per capita income (% change since 2000)
Median family income ($) - White
Median family income ($) - Black or African American
Median family income ($) - Asian
Median family income ($) - Hispanic or Latino
Median family income ($) - American Indian and Alaska Native
Median family income ($) - Multirace
Median family income ($) - Other Race
Median year house/condo built
Median year apartment built
Year house built - Built 2005 or later (%)
Year house built - Built 2000 to 2004 (%)
Year house built - Built 1990 to 1999 (%)
Year house built - Built 1980 to 1989 (%)
Year house built - Built 1970 to 1979 (%)
Year house built - Built 1960 to 1969 (%)
Year house built - Built 1950 to 1959 (%)
Year house built - Built 1940 to 1949 (%)
Year house built - Built 1939 or earlier (%)
Average household size
Household density (households per square mile)
Average household size - White
Average household size - Black or African American
Average household size - Asian
Average household size - Hispanic or Latino
Average household size - American Indian and Alaska Native
Average household size - Multirace
Average household size - Other Race
Occupied housing units (%)
Vacant housing units (%)
Owner occupied housing units (%)
Renter occupied housing units (%)
Vacancy status - For rent (%)
Vacancy status - For sale only (%)
Vacancy status - Rented or sold, not occupied (%)
Vacancy status - For seasonal, recreational, or occasional use (%)
Vacancy status - For migrant workers (%)
Vacancy status - Other vacant (%)
Residents with income below the poverty level (%)
Residents with income below 50% of the poverty level (%)
Children below poverty level (%)
Poor families by family type - Married-couple family (%)
Poor families by family type - Male, no wife present (%)
Poor families by family type - Female, no husband present (%)
Poverty status for native-born residents (%)
Poverty status for foreign-born residents (%)
Poverty among high school graduates not in families (%)
Poverty among people who did not graduate high school not in families (%)
Residents with income below the poverty level (%) - White
Residents with income below the poverty level (%) - Black or African American
Residents with income below the poverty level (%) - Asian
Residents with income below the poverty level (%) - Hispanic or Latino
Residents with income below the poverty level (%) - American Indian and Alaska Native
Residents with income below the poverty level (%) - Multirace
Residents with income below the poverty level (%) - Other Race
Air pollution - Air Quality Index (AQI)
Air pollution - CO
Air pollution - NO2
Air pollution - SO2
Air pollution - Ozone
Air pollution - PM10
Air pollution - PM25
Air pollution - Pb
Crime - Murders per 100,000 population
Crime - Rapes per 100,000 population
Crime - Robberies per 100,000 population
Crime - Assaults per 100,000 population
Crime - Burglaries per 100,000 population
Crime - Thefts per 100,000 population
Crime - Auto thefts per 100,000 population
Crime - Arson per 100,000 population
Crime - City-data.com crime index
Crime - Violent crime index
Crime - Property crime index
Crime - Murders per 100,000 population (5 year average)
Crime - Rapes per 100,000 population (5 year average)
Crime - Robberies per 100,000 population (5 year average)
Crime - Assaults per 100,000 population (5 year average)
Crime - Burglaries per 100,000 population (5 year average)
Crime - Thefts per 100,000 population (5 year average)
Crime - Auto thefts per 100,000 population (5 year average)
Crime - Arson per 100,000 population (5 year average)
Crime - City-data.com crime index (5 year average)
Crime - Violent crime index (5 year average)
Crime - Property crime index (5 year average)
1996 Presidential Elections Results (%) - Democratic Party (Clinton)
1996 Presidential Elections Results (%) - Republican Party (Dole)
1996 Presidential Elections Results (%) - Other
2000 Presidential Elections Results (%) - Democratic Party (Gore)
2000 Presidential Elections Results (%) - Republican Party (Bush)
2000 Presidential Elections Results (%) - Other
2004 Presidential Elections Results (%) - Democratic Party (Kerry)
2004 Presidential Elections Results (%) - Republican Party (Bush)
2004 Presidential Elections Results (%) - Other
2008 Presidential Elections Results (%) - Democratic Party (Obama)
2008 Presidential Elections Results (%) - Republican Party (McCain)
2008 Presidential Elections Results (%) - Other
2012 Presidential Elections Results (%) - Democratic Party (Obama)
2012 Presidential Elections Results (%) - Republican Party (Romney)
2012 Presidential Elections Results (%) - Other
2016 Presidential Elections Results (%) - Democratic Party (Clinton)
2016 Presidential Elections Results (%) - Republican Party (Trump)
2016 Presidential Elections Results (%) - Other
2020 Presidential Elections Results (%) - Democratic Party (Biden)
2020 Presidential Elections Results (%) - Republican Party (Trump)
2020 Presidential Elections Results (%) - Other
Ancestries Reported - Arab (%)
Ancestries Reported - Czech (%)
Ancestries Reported - Danish (%)
Ancestries Reported - Dutch (%)
Ancestries Reported - English (%)
Ancestries Reported - French (%)
Ancestries Reported - French Canadian (%)
Ancestries Reported - German (%)
Ancestries Reported - Greek (%)
Ancestries Reported - Hungarian (%)
Ancestries Reported - Irish (%)
Ancestries Reported - Italian (%)
Ancestries Reported - Lithuanian (%)
Ancestries Reported - Norwegian (%)
Ancestries Reported - Polish (%)
Ancestries Reported - Portuguese (%)
Ancestries Reported - Russian (%)
Ancestries Reported - Scotch-Irish (%)
Ancestries Reported - Scottish (%)
Ancestries Reported - Slovak (%)
Ancestries Reported - Subsaharan African (%)
Ancestries Reported - Swedish (%)
Ancestries Reported - Swiss (%)
Ancestries Reported - Ukrainian (%)
Ancestries Reported - United States (%)
Ancestries Reported - Welsh (%)
Ancestries Reported - West Indian (%)
Ancestries Reported - Other (%)
Educational Attainment - No schooling completed (%)
Educational Attainment - Less than high school (%)
Educational Attainment - High school or equivalent (%)
Educational Attainment - Less than 1 year of college (%)
Educational Attainment - 1 or more years of college (%)
Educational Attainment - Associate degree (%)
Educational Attainment - Bachelor's degree (%)
Educational Attainment - Master's degree (%)
Educational Attainment - Professional school degree (%)
Educational Attainment - Doctorate degree (%)
School Enrollment - Nursery, preschool (%)
School Enrollment - Kindergarten (%)
School Enrollment - Grade 1 to 4 (%)
School Enrollment - Grade 5 to 8 (%)
School Enrollment - Grade 9 to 12 (%)
School Enrollment - College undergrad (%)
School Enrollment - Graduate or professional (%)
School Enrollment - Not enrolled in school (%)
School enrollment - Public schools (%)
School enrollment - Private schools (%)
School enrollment - Not enrolled (%)
Median number of rooms in houses and condos
Median number of rooms in apartments
Housing units lacking complete plumbing facilities (%)
Housing units lacking complete kitchen facilities (%)
Density of houses
Urban houses (%)
Rural houses (%)
Households with people 60 years and over (%)
Households with people 65 years and over (%)
Households with people 75 years and over (%)
Households with one or more nonrelatives (%)
Households with no nonrelatives (%)
Population in households (%)
Family households (%)
Nonfamily households (%)
Population in families (%)
Family households with own children (%)
Median number of bedrooms in owner occupied houses
Mean number of bedrooms in owner occupied houses
Median number of bedrooms in renter occupied houses
Mean number of bedrooms in renter occupied houses
Median number of vehichles in owner occupied houses
Mean number of vehichles in owner occupied houses
Median number of vehichles in renter occupied houses
Mean number of vehichles in renter occupied houses
Mortgage status - with mortgage (%)
Mortgage status - with second mortgage (%)
Mortgage status - with home equity loan (%)
Mortgage status - with both second mortgage and home equity loan (%)
Mortgage status - without a mortgage (%)
Average family size
Average family size - White
Average family size - Black or African American
Average family size - Asian
Average family size - Hispanic or Latino
Average family size - American Indian and Alaska Native
Average family size - Multirace
Average family size - Other Race
Geographical mobility - Same house 1 year ago (%)
Geographical mobility - Moved within same county (%)
Geographical mobility - Moved from different county within same state (%)
Geographical mobility - Moved from different state (%)
Geographical mobility - Moved from abroad (%)
Place of birth - Born in state of residence (%)
Place of birth - Born in other state (%)
Place of birth - Native, outside of US (%)
Place of birth - Foreign born (%)
Housing units in structures - 1, detached (%)
Housing units in structures - 1, attached (%)
Housing units in structures - 2 (%)
Housing units in structures - 3 or 4 (%)
Housing units in structures - 5 to 9 (%)
Housing units in structures - 10 to 19 (%)
Housing units in structures - 20 to 49 (%)
Housing units in structures - 50 or more (%)
Housing units in structures - Mobile home (%)
Housing units in structures - Boat, RV, van, etc. (%)
House/condo owner moved in on average (years ago)
Renter moved in on average (years ago)
Year householder moved into unit - Moved in 1999 to March 2000 (%)
Year householder moved into unit - Moved in 1995 to 1998 (%)
Year householder moved into unit - Moved in 1990 to 1994 (%)
Year householder moved into unit - Moved in 1980 to 1989 (%)
Year householder moved into unit - Moved in 1970 to 1979 (%)
Year householder moved into unit - Moved in 1969 or earlier (%)
Means of transportation to work - Drove car alone (%)
Means of transportation to work - Carpooled (%)
Means of transportation to work - Public transportation (%)
Means of transportation to work - Bus or trolley bus (%)
Means of transportation to work - Streetcar or trolley car (%)
Means of transportation to work - Subway or elevated (%)
Means of transportation to work - Railroad (%)
Means of transportation to work - Ferryboat (%)
Means of transportation to work - Taxicab (%)
Means of transportation to work - Motorcycle (%)
Means of transportation to work - Bicycle (%)
Means of transportation to work - Walked (%)
Means of transportation to work - Other means (%)
Working at home (%)
Industry diversity
Most Common Industries - Agriculture, forestry, fishing and hunting, and mining (%)
Most Common Industries - Agriculture, forestry, fishing and hunting (%)
Most Common Industries - Mining, quarrying, and oil and gas extraction (%)
Most Common Industries - Construction (%)
Most Common Industries - Manufacturing (%)
Most Common Industries - Wholesale trade (%)
Most Common Industries - Retail trade (%)
Most Common Industries - Transportation and warehousing, and utilities (%)
Most Common Industries - Transportation and warehousing (%)
Most Common Industries - Utilities (%)
Most Common Industries - Information (%)
Most Common Industries - Finance and insurance, and real estate and rental and leasing (%)
Most Common Industries - Finance and insurance (%)
Most Common Industries - Real estate and rental and leasing (%)
Most Common Industries - Professional, scientific, and management, and administrative and waste management services (%)
Most Common Industries - Professional, scientific, and technical services (%)
Most Common Industries - Management of companies and enterprises (%)
Most Common Industries - Administrative and support and waste management services (%)
Most Common Industries - Educational services, and health care and social assistance (%)
Most Common Industries - Educational services (%)
Most Common Industries - Health care and social assistance (%)
Most Common Industries - Arts, entertainment, and recreation, and accommodation and food services (%)
Most Common Industries - Arts, entertainment, and recreation (%)
Most Common Industries - Accommodation and food services (%)
Most Common Industries - Other services, except public administration (%)
Most Common Industries - Public administration (%)
Occupation diversity
Most Common Occupations - Management, business, science, and arts occupations (%)
Most Common Occupations - Management, business, and financial occupations (%)
Most Common Occupations - Management occupations (%)
Most Common Occupations - Business and financial operations occupations (%)
Most Common Occupations - Computer, engineering, and science occupations (%)
Most Common Occupations - Computer and mathematical occupations (%)
Most Common Occupations - Architecture and engineering occupations (%)
Most Common Occupations - Life, physical, and social science occupations (%)
Most Common Occupations - Education, legal, community service, arts, and media occupations (%)
Most Common Occupations - Community and social service occupations (%)
Most Common Occupations - Legal occupations (%)
Most Common Occupations - Education, training, and library occupations (%)
Most Common Occupations - Arts, design, entertainment, sports, and media occupations (%)
Most Common Occupations - Healthcare practitioners and technical occupations (%)
Most Common Occupations - Health diagnosing and treating practitioners and other technical occupations (%)
Most Common Occupations - Health technologists and technicians (%)
Most Common Occupations - Service occupations (%)
Most Common Occupations - Healthcare support occupations (%)
Most Common Occupations - Protective service occupations (%)
Most Common Occupations - Fire fighting and prevention, and other protective service workers including supervisors (%)
Most Common Occupations - Law enforcement workers including supervisors (%)
Most Common Occupations - Food preparation and serving related occupations (%)
Most Common Occupations - Building and grounds cleaning and maintenance occupations (%)
Most Common Occupations - Personal care and service occupations (%)
Most Common Occupations - Sales and office occupations (%)
Most Common Occupations - Sales and related occupations (%)
Most Common Occupations - Office and administrative support occupations (%)
Most Common Occupations - Natural resources, construction, and maintenance occupations (%)
Most Common Occupations - Farming, fishing, and forestry occupations (%)
Most Common Occupations - Construction and extraction occupations (%)
Most Common Occupations - Installation, maintenance, and repair occupations (%)
Most Common Occupations - Production, transportation, and material moving occupations (%)
Most Common Occupations - Production occupations (%)
Most Common Occupations - Transportation occupations (%)
Most Common Occupations - Material moving occupations (%)
People in Group quarters - Institutionalized population (%)
People in Group quarters - Correctional institutions (%)
People in Group quarters - Federal prisons and detention centers (%)
People in Group quarters - Halfway houses (%)
People in Group quarters - Local jails and other confinement facilities (including police lockups) (%)
People in Group quarters - Military disciplinary barracks (%)
People in Group quarters - State prisons (%)
People in Group quarters - Other types of correctional institutions (%)
People in Group quarters - Nursing homes (%)
People in Group quarters - Hospitals/wards, hospices, and schools for the handicapped (%)
People in Group quarters - Hospitals/wards and hospices for chronically ill (%)
People in Group quarters - Hospices or homes for chronically ill (%)
People in Group quarters - Military hospitals or wards for chronically ill (%)
People in Group quarters - Other hospitals or wards for chronically ill (%)
People in Group quarters - Hospitals or wards for drug/alcohol abuse (%)
People in Group quarters - Mental (Psychiatric) hospitals or wards (%)
People in Group quarters - Schools, hospitals, or wards for the mentally retarded (%)
People in Group quarters - Schools, hospitals, or wards for the physically handicapped (%)
People in Group quarters - Institutions for the deaf (%)
People in Group quarters - Institutions for the blind (%)
People in Group quarters - Orthopedic wards and institutions for the physically handicapped (%)
People in Group quarters - Wards in general hospitals for patients who have no usual home elsewhere (%)
People in Group quarters - Wards in military hospitals for patients who have no usual home elsewhere (%)
People in Group quarters - Juvenile institutions (%)
People in Group quarters - Long-term care (%)
People in Group quarters - Homes for abused, dependent, and neglected children (%)
People in Group quarters - Residential treatment centers for emotionally disturbed children (%)
People in Group quarters - Training schools for juvenile delinquents (%)
People in Group quarters - Short-term care, detention or diagnostic centers for delinquent children (%)
People in Group quarters - Type of juvenile institution unknown (%)
People in Group quarters - Noninstitutionalized population (%)
People in Group quarters - College dormitories (includes college quarters off campus) (%)
People in Group quarters - Military quarters (%)
People in Group quarters - On base (%)
People in Group quarters - Barracks, unaccompanied personnel housing (UPH), (Enlisted/Officer), ;and similar group living quarters for military personnel (%)
People in Group quarters - Transient quarters for temporary residents (%)
People in Group quarters - Military ships (%)
People in Group quarters - Group homes (%)
People in Group quarters - Homes or halfway houses for drug/alcohol abuse (%)
People in Group quarters - Homes for the mentally ill (%)
People in Group quarters - Homes for the mentally retarded (%)
People in Group quarters - Homes for the physically handicapped (%)
People in Group quarters - Other group homes (%)
People in Group quarters - Religious group quarters (%)
People in Group quarters - Dormitories (%)
People in Group quarters - Agriculture workers' dormitories on farms (%)
People in Group quarters - Job Corps and vocational training facilities (%)
People in Group quarters - Other workers' dormitories (%)
People in Group quarters - Crews of maritime vessels (%)
People in Group quarters - Other nonhousehold living situations (%)
People in Group quarters - Other noninstitutional group quarters (%)
Residents speaking English at home (%)
Residents speaking English at home - Born in the United States (%)
Residents speaking English at home - Native, born elsewhere (%)
Residents speaking English at home - Foreign born (%)
Residents speaking Spanish at home (%)
Residents speaking Spanish at home - Born in the United States (%)
Residents speaking Spanish at home - Native, born elsewhere (%)
Residents speaking Spanish at home - Foreign born (%)
Residents speaking other language at home (%)
Residents speaking other language at home - Born in the United States (%)
Residents speaking other language at home - Native, born elsewhere (%)
Residents speaking other language at home - Foreign born (%)
Class of Workers - Employee of private company (%)
Class of Workers - Self-employed in own incorporated business (%)
Class of Workers - Private not-for-profit wage and salary workers (%)
Class of Workers - Local government workers (%)
Class of Workers - State government workers (%)
Class of Workers - Federal government workers (%)
Class of Workers - Self-employed workers in own not incorporated business and Unpaid family workers (%)
House heating fuel used in houses and condos - Utility gas (%)
House heating fuel used in houses and condos - Bottled, tank, or LP gas (%)
House heating fuel used in houses and condos - Electricity (%)
House heating fuel used in houses and condos - Fuel oil, kerosene, etc. (%)
House heating fuel used in houses and condos - Coal or coke (%)
House heating fuel used in houses and condos - Wood (%)
House heating fuel used in houses and condos - Solar energy (%)
House heating fuel used in houses and condos - Other fuel (%)
House heating fuel used in houses and condos - No fuel used (%)
House heating fuel used in apartments - Utility gas (%)
House heating fuel used in apartments - Bottled, tank, or LP gas (%)
House heating fuel used in apartments - Electricity (%)
House heating fuel used in apartments - Fuel oil, kerosene, etc. (%)
House heating fuel used in apartments - Coal or coke (%)
House heating fuel used in apartments - Wood (%)
House heating fuel used in apartments - Solar energy (%)
House heating fuel used in apartments - Other fuel (%)
House heating fuel used in apartments - No fuel used (%)
Armed forces status - In Armed Forces (%)
Armed forces status - Civilian (%)
Armed forces status - Civilian - Veteran (%)
Armed forces status - Civilian - Nonveteran (%)
Fatal accidents locations in years 2005-2021
Fatal accidents locations in 2005
Fatal accidents locations in 2006
Fatal accidents locations in 2007
Fatal accidents locations in 2008
Fatal accidents locations in 2009
Fatal accidents locations in 2010
Fatal accidents locations in 2011
Fatal accidents locations in 2012
Fatal accidents locations in 2013
Fatal accidents locations in 2014
Fatal accidents locations in 2015
Fatal accidents locations in 2016
Fatal accidents locations in 2017
Fatal accidents locations in 2018
Fatal accidents locations in 2019
Fatal accidents locations in 2020
Fatal accidents locations in 2021
Alcohol use - People drinking some alcohol every month (%)
Alcohol use - People not drinking at all (%)
Alcohol use - Average days/month drinking alcohol
Alcohol use - Average drinks/week
Alcohol use - Average days/year people drink much
Audiometry - Average condition of hearing (%)
Audiometry - People that can hear a whisper from across a quiet room (%)
Audiometry - People that can hear normal voice from across a quiet room (%)
Audiometry - Ears ringing, roaring, buzzing (%)
Audiometry - Had a job exposure to loud noise (%)
Audiometry - Had off-work exposure to loud noise (%)
Blood Pressure & Cholesterol - Has high blood pressure (%)
Blood Pressure & Cholesterol - Checking blood pressure at home (%)
Blood Pressure & Cholesterol - Frequently checking blood cholesterol (%)
Blood Pressure & Cholesterol - Has high cholesterol level (%)
Consumer Behavior - Money monthly spent on food at supermarket/grocery store
Consumer Behavior - Money monthly spent on food at other stores
Consumer Behavior - Money monthly spent on eating out
Consumer Behavior - Money monthly spent on carryout/delivered foods
Consumer Behavior - Income spent on food at supermarket/grocery store (%)
Consumer Behavior - Income spent on food at other stores (%)
Consumer Behavior - Income spent on eating out (%)
Consumer Behavior - Income spent on carryout/delivered foods (%)
Current Health Status - General health condition (%)
Current Health Status - Blood donors (%)
Current Health Status - Has blood ever tested for HIV virus (%)
Current Health Status - Left-handed people (%)
Dermatology - People using sunscreen (%)
Diabetes - Diabetics (%)
Diabetes - Had a blood test for high blood sugar (%)
Diabetes - People taking insulin (%)
Diet Behavior & Nutrition - Diet health (%)
Diet Behavior & Nutrition - Milk product consumption (# of products/month)
Diet Behavior & Nutrition - Meals not home prepared (#/week)
Diet Behavior & Nutrition - Meals from fast food or pizza place (#/week)
Diet Behavior & Nutrition - Ready-to-eat foods (#/month)
Diet Behavior & Nutrition - Frozen meals/pizza (#/month)
Drug Use - People that ever used marijuana or hashish (%)
Drug Use - Ever used hard drugs (%)
Drug Use - Ever used any form of cocaine (%)
Drug Use - Ever used heroin (%)
Drug Use - Ever used methamphetamine (%)
Health Insurance - People covered by health insurance (%)
Kidney Conditions-Urology - Avg. # of times urinating at night
Medical Conditions - People with asthma (%)
Medical Conditions - People with anemia (%)
Medical Conditions - People with psoriasis (%)
Medical Conditions - People with overweight (%)
Medical Conditions - Elderly people having difficulties in thinking or remembering (%)
Medical Conditions - People who ever received blood transfusion (%)
Medical Conditions - People having trouble seeing even with glass/contacts (%)
Medical Conditions - People with arthritis (%)
Medical Conditions - People with gout (%)
Medical Conditions - People with congestive heart failure (%)
Medical Conditions - People with coronary heart disease (%)
Medical Conditions - People with angina pectoris (%)
Medical Conditions - People who ever had heart attack (%)
Medical Conditions - People who ever had stroke (%)
Medical Conditions - People with emphysema (%)
Medical Conditions - People with thyroid problem (%)
Medical Conditions - People with chronic bronchitis (%)
Medical Conditions - People with any liver condition (%)
Medical Conditions - People who ever had cancer or malignancy (%)
Mental Health - People who have little interest in doing things (%)
Mental Health - People feeling down, depressed, or hopeless (%)
Mental Health - People who have trouble sleeping or sleeping too much (%)
Mental Health - People feeling tired or having little energy (%)
Mental Health - People with poor appetite or overeating (%)
Mental Health - People feeling bad about themself (%)
Mental Health - People who have trouble concentrating on things (%)
Mental Health - People moving or speaking slowly or too fast (%)
Mental Health - People having thoughts they would be better off dead (%)
Oral Health - Average years since last visit a dentist
Oral Health - People embarrassed because of mouth (%)
Oral Health - People with gum disease (%)
Oral Health - General health of teeth and gums (%)
Oral Health - Average days a week using dental floss/device
Oral Health - Average days a week using mouthwash for dental problem
Oral Health - Average number of teeth
Pesticide Use - Households using pesticides to control insects (%)
Pesticide Use - Households using pesticides to kill weeds (%)
Physical Activity - People doing vigorous-intensity work activities (%)
Physical Activity - People doing moderate-intensity work activities (%)
Physical Activity - People walking or bicycling (%)
Physical Activity - People doing vigorous-intensity recreational activities (%)
Physical Activity - People doing moderate-intensity recreational activities (%)
Physical Activity - Average hours a day doing sedentary activities
Physical Activity - Average hours a day watching TV or videos
Physical Activity - Average hours a day using computer
Physical Functioning - People having limitations keeping them from working (%)
Physical Functioning - People limited in amount of work they can do (%)
Physical Functioning - People that need special equipment to walk (%)
Physical Functioning - People experiencing confusion/memory problems (%)
Physical Functioning - People requiring special healthcare equipment (%)
Prescription Medications - Average number of prescription medicines taking
Preventive Aspirin Use - Adults 40+ taking low-dose aspirin (%)
Reproductive Health - Vaginal deliveries (%)
Reproductive Health - Cesarean deliveries (%)
Reproductive Health - Deliveries resulted in a live birth (%)
Reproductive Health - Pregnancies resulted in a delivery (%)
Reproductive Health - Women breastfeeding newborns (%)
Reproductive Health - Women that had a hysterectomy (%)
Reproductive Health - Women that had both ovaries removed (%)
Reproductive Health - Women that have ever taken birth control pills (%)
Reproductive Health - Women taking birth control pills (%)
Reproductive Health - Women that have ever used Depo-Provera or injectables (%)
Reproductive Health - Women that have ever used female hormones (%)
Sexual Behavior - People 18+ that ever had sex (vaginal, anal, or oral) (%)
Sexual Behavior - Males 18+ that ever had vaginal sex with a woman (%)
Sexual Behavior - Males 18+ that ever performed oral sex on a woman (%)
Sexual Behavior - Males 18+ that ever had anal sex with a woman (%)
Sexual Behavior - Males 18+ that ever had any sex with a man (%)
Sexual Behavior - Females 18+ that ever had vaginal sex with a man (%)
Sexual Behavior - Females 18+ that ever performed oral sex on a man (%)
Sexual Behavior - Females 18+ that ever had anal sex with a man (%)
Sexual Behavior - Females 18+ that ever had any kind of sex with a woman (%)
Sexual Behavior - Average age people first had sex
Sexual Behavior - Average number of female sex partners in lifetime (males 18+)
Sexual Behavior - Average number of female vaginal sex partners in lifetime (males 18+)
Sexual Behavior - Average age people first performed oral sex on a woman (18+)
Sexual Behavior - Average number of woman performed oral sex on in lifetime (18+)
Sexual Behavior - Average number of male sex partners in lifetime (males 18+)
Sexual Behavior - Average number of male anal sex partners in lifetime (males 18+)
Sexual Behavior - Average age people first performed oral sex on a man (18+)
Sexual Behavior - Average number of male oral sex partners in lifetime (18+)
Sexual Behavior - People using protection when performing oral sex (%)
Sexual Behavior - Average number of times people have vaginal or anal sex a year
Sexual Behavior - People having sex without condom (%)
Sexual Behavior - Average number of male sex partners in lifetime (females 18+)
Sexual Behavior - Average number of male vaginal sex partners in lifetime (females 18+)
Sexual Behavior - Average number of female sex partners in lifetime (females 18+)
Sexual Behavior - Circumcised males 18+ (%)
Sleep Disorders - Average hours sleeping at night
Sleep Disorders - People that has trouble sleeping (%)
Smoking-Cigarette Use - People smoking cigarettes (%)
Taste & Smell - People 40+ having problems with smell (%)
Taste & Smell - People 40+ having problems with taste (%)
Taste & Smell - People 40+ that ever had wisdom teeth removed (%)
Taste & Smell - People 40+ that ever had tonsils teeth removed (%)
Taste & Smell - People 40+ that ever had a loss of consciousness because of a head injury (%)
Taste & Smell - People 40+ that ever had a broken nose or other serious injury to face or skull (%)
Taste & Smell - People 40+ that ever had two or more sinus infections (%)
Weight - Average height (inches)
Weight - Average weight (pounds)
Weight - Average BMI
Weight - People that are obese (%)
Weight - People that ever were obese (%)
Weight - People trying to lose weight (%)
Urban population: 42,246
Rural population: 52
Estimated median house/condo value in 2022: $337,047
95210:
$337,047California:
$715,900
Median resident age: This zip code:
32.0 yearsCalifornia median age:
37.9 years
Average household size: This zip code:
3.4 peopleCalifornia:
2.8 people
Averages for the 2020 tax year for zip code 95210, filed in 2021:
Average Adjusted Gross Income (AGI) in 2020: $41,285 (Individual Income Tax Returns) Here:
$41,285State:
$95,910
Salary/wage: $37,557 (reported on 86.1% of returns )Here:
$37,557State:
$77,331
(% of AGI for various income ranges: 1209.2% for AGIs below $25k , 3774.9% for AGIs $25k-50k , 7448.7% for AGIs $50k-75k , 10797.4% for AGIs $75k-100k , 17477.0% for AGIs $100k-200k ) Taxable interest for individuals: $312 (reported on 21.0% of returns )This zip code:
$312California:
$2,294
(% of AGI for various income ranges: 4.9% for AGIs below $25k , 5.6% for AGIs $25k-50k , 12.6% for AGIs $50k-75k , 18.2% for AGIs $75k-100k , 39.8% for AGIs $100k-200k ) Ordinary dividends: $1,556 (reported on 4.5% of returns )(% of AGI for various income ranges: 3.2% for AGIs below $25k , 3.4% for AGIs $25k-50k , 13.5% for AGIs $50k-75k , 31.9% for AGIs $75k-100k , 42.6% for AGIs $100k-200k ) Net capital gain/loss in AGI: +$5,918 (reported on 6.4% of returns )Here:
+$5,918State:
+$49,306
(% of AGI for various income ranges: 1.6% for AGIs below $25k , 4.6% for AGIs $25k-50k , 21.5% for AGIs $50k-75k , 90.6% for AGIs $75k-100k , 616.8% for AGIs $100k-200k ) Profit/loss from business: +$7,191 (reported on 12.3% of returns )Here:
+$7,191State:
+$15,671
(% of AGI for various income ranges: 76.9% for AGIs below $25k , 107.7% for AGIs $25k-50k , 136.4% for AGIs $50k-75k , 232.5% for AGIs $75k-100k , 444.3% for AGIs $100k-200k ) Taxable individual retirement arrangement distribution: $12,076 (reported on 2.5% of returns )95210:
$12,076California:
$23,505
(% of AGI for various income ranges: 16.2% for AGIs below $25k , 21.7% for AGIs $25k-50k , 48.8% for AGIs $50k-75k , 108.0% for AGIs $75k-100k , 337.9% for AGIs $100k-200k ) Total itemized deductions: $24,068 (reported on 4.2% of returns )Here:
$24,068State:
$39,517
(% of AGI for various income ranges: 25.5% for AGIs below $25k , 65.1% for AGIs $25k-50k , 224.5% for AGIs $50k-75k , 475.4% for AGIs $75k-100k , 1033.8% for AGIs $100k-200k ) Charity contributions: $4,964 (reported on 3.0% of returns )(% of AGI for various income ranges: 1.5% for AGIs below $25k , 8.1% for AGIs $25k-50k , 30.1% for AGIs $50k-75k , 69.4% for AGIs $75k-100k , 193.4% for AGIs $100k-200k ) Taxes paid: $6,412 (reported on 4.2% of returns )(% of AGI for various income ranges: 3.9% for AGIs below $25k , 15.5% for AGIs $25k-50k , 61.6% for AGIs $50k-75k , 129.8% for AGIs $75k-100k , 295.1% for AGIs $100k-200k ) Earned income credit: $2,375 (reported on 27.7% of returns )(% of AGI for various income ranges: 134.4% for AGIs below $25k , 108.1% for AGIs $25k-50k , 2.4% for AGIs $50k-75k ) Percentage of individuals using paid preparers for their 2020 taxes: 93.5%(% for various income ranges: 92.9% for AGIs below $25k , 94.2% for AGIs $25k-50k , 93.6% for AGIs $50k-75k , 93.0% for AGIs $75k-100k , 92.6% for AGIs $100k-200k , 100.0% for AGIs over 200k )
Averages for the 2012 tax year for zip code 95210, filed in 2013:
Average Adjusted Gross Income (AGI) in 2012: $31,400 (Individual Income Tax Returns) Here:
$31,400State:
$72,726
Salary/wage: $28,936 (reported on 86.8% of returns )Here:
$28,936State:
$59,079
(% of AGI for various income ranges: 78.1% for AGIs below $25k , 84.2% for AGIs $25k-50k , 81.8% for AGIs $50k-75k , 79.5% for AGIs $75k-100k , 77.1% for AGIs $100k-200k , 38.0% for AGIs over 200k ) Taxable interest for individuals: $410 (reported on 20.7% of returns )This zip code:
$410California:
$2,146
(% of AGI for various income ranges: 0.3% for AGIs below $25k , 0.2% for AGIs $25k-50k , 0.3% for AGIs $50k-75k , 0.4% for AGIs $75k-100k , 0.2% for AGIs $100k-200k , 0.1% for AGIs over 200k ) Ordinary dividends: $1,600 (reported on 4.9% of returns )(% of AGI for various income ranges: 0.3% for AGIs below $25k , 0.2% for AGIs $25k-50k , 0.2% for AGIs $50k-75k , 0.4% for AGIs $75k-100k , 0.3% for AGIs $100k-200k ) Net capital gain/loss in AGI: +$1,600 (reported on 3.3% of returns )Here:
+$1,600State:
+$30,460
(% of AGI for various income ranges: 0.1% for AGIs $25k-50k , 0.2% for AGIs $75k-100k , 1.2% for AGIs $100k-200k ) Profit/loss from business: +$9,091 (reported on 11.4% of returns )Here:
+$9,091State:
+$17,064
(% of AGI for various income ranges: 8.3% for AGIs below $25k , 2.8% for AGIs $25k-50k , 1.1% for AGIs $50k-75k , 1.2% for AGIs $75k-100k , 1.9% for AGIs $100k-200k ) Taxable individual retirement arrangement distribution: $10,200 (reported on 3.6% of returns )95210:
$10,200California:
$19,557
(% of AGI for various income ranges: 0.9% for AGIs below $25k , 0.8% for AGIs $25k-50k , 1.2% for AGIs $50k-75k , 1.7% for AGIs $75k-100k , 2.5% for AGIs $100k-200k ) Total itemized deductions: $18,003 (28% of AGI, reported on 16.6% of returns )Here:
$18,003State:
$34,004
Here:
28.4% of AGIState:
22.7% of AGI
(% of AGI for various income ranges: 4.4% for AGIs below $25k , 7.8% for AGIs $25k-50k , 11.0% for AGIs $50k-75k , 15.5% for AGIs $75k-100k , 15.4% for AGIs $100k-200k , 12.0% for AGIs over 200k ) Charity contributions: $2,452 (reported on 12.6% of returns )(% of AGI for various income ranges: 0.2% for AGIs below $25k , 0.7% for AGIs $25k-50k , 1.2% for AGIs $50k-75k , 1.6% for AGIs $75k-100k , 2.1% for AGIs $100k-200k , 1.2% for AGIs over 200k ) Taxes paid: $4,500 (reported on 16.4% of returns )95210:
$4,500State:
$14,448
(% of AGI for various income ranges: 0.7% for AGIs below $25k , 1.5% for AGIs $25k-50k , 2.7% for AGIs $50k-75k , 3.8% for AGIs $75k-100k , 5.4% for AGIs $100k-200k , 5.7% for AGIs over 200k ) Earned income credit: $2,605 (reported on 38.3% of returns )(% of AGI for various income ranges: 11.2% for AGIs below $25k , 2.2% for AGIs $25k-50k ) Percentage of individuals using paid preparers for their 2012 taxes: 56.8%(% for various income ranges: 52.8% for AGIs below $25k , 59.9% for AGIs $25k-50k , 63.7% for AGIs $50k-75k , 66.7% for AGIs $75k-100k , 65.8% for AGIs $100k-200k )
Averages for the 2004 tax year for zip code 95210, filed in 2005:
Average Adjusted Gross Income (AGI) in 2004: $31,371 (Individual Income Tax Returns) Here:
$31,371State:
$58,600
Salary/wage: $29,721 (reported on 89.5% of returns )Here:
$29,721State:
$49,455
(% of AGI for various income ranges: 94.4% for AGIs below $10k , 82.9% for AGIs $10k-25k , 87.4% for AGIs $25k-50k , 86.8% for AGIs $50k-75k , 87.7% for AGIs $75k-100k , 69.2% for AGIs over 100k ) Taxable interest for individuals: $656 (reported on 32.3% of returns )This zip code:
$656California:
$2,365
(% of AGI for various income ranges: 1.7% for AGIs below $10k , 0.9% for AGIs $10k-25k , 0.5% for AGIs $25k-50k , 0.6% for AGIs $50k-75k , 0.5% for AGIs $75k-100k , 0.9% for AGIs over 100k ) Taxable dividends: $1,232 (reported on 7.8% of returns )(% of AGI for various income ranges: 0.7% for AGIs below $10k , 0.3% for AGIs $10k-25k , 0.3% for AGIs $25k-50k , 0.3% for AGIs $50k-75k , 0.1% for AGIs $75k-100k , 0.5% for AGIs over 100k ) Net capital gain/loss: +$8,389 (reported on 6.0% of returns )Here:
+$8,389State:
+$23,418
(% of AGI for various income ranges: -0.5% for AGIs below $10k , -0.1% for AGIs $10k-25k , 0.2% for AGIs $25k-50k , 0.4% for AGIs $50k-75k , 1.6% for AGIs $75k-100k , 12.1% for AGIs over 100k ) Profit/loss from business: +$8,511 (reported on 11.0% of returns )Here:
+$8,511State:
+$16,826
(% of AGI for various income ranges: 7.0% for AGIs below $10k , 5.0% for AGIs $10k-25k , 2.8% for AGIs $25k-50k , 1.9% for AGIs $50k-75k , 1.3% for AGIs $75k-100k , 3.3% for AGIs over 100k ) IRA payment deduction: $2,612 (reported on 1.4% of returns )95210:
$2,612California:
$3,192
(% of AGI for various income ranges: 0.1% for AGIs $10k-25k , 0.2% for AGIs $25k-50k , 0.1% for AGIs $50k-75k , 0.1% for AGIs $75k-100k , 0.1% for AGIs over 100k ) Self-employed pension: $8,167 (reported on 0.2% of returns )Here:
$8,167California:
$17,688
Total itemized deductions: $17,617 (31% of AGI, reported on 27.9% of returns )Here:
$17,617State:
$28,113
Here:
31.5% of AGIState:
25.3% of AGI
(% of AGI for various income ranges: 7.9% for AGIs below $10k , 9.6% for AGIs $10k-25k , 14.5% for AGIs $25k-50k , 19.8% for AGIs $50k-75k , 19.9% for AGIs $75k-100k , 17.3% for AGIs over 100k ) Charity contributions deductions: $1,988 (3% of AGI, reported on 23.4% of returns )Here:
3.4% of AGIState:
3.3% of AGI
(% of AGI for various income ranges: 0.3% for AGIs below $10k , 0.6% for AGIs $10k-25k , 1.2% for AGIs $25k-50k , 2.0% for AGIs $50k-75k , 2.1% for AGIs $75k-100k , 2.4% for AGIs over 100k ) Total tax: $3,301 (reported on 61.9% of returns )95210:
$3,301State:
$10,761
(% of AGI for various income ranges: 2.4% for AGIs below $10k , 3.1% for AGIs $10k-25k , 5.0% for AGIs $25k-50k , 7.0% for AGIs $50k-75k , 9.1% for AGIs $75k-100k , 13.9% for AGIs over 100k ) Earned income credit: $1,921 (reported on 29.6% of returns )Percentage of individuals using paid preparers for their 2004 taxes: 66.4%(% for various income ranges: 61.1% for AGIs below $10k , 67.9% for AGIs $10k-25k , 67.3% for AGIs $25k-50k , 68.0% for AGIs $50k-75k , 66.1% for AGIs $75k-100k , 71.9% for AGIs over 100k )
Estimated median household income in 2022: This zip code:
$58,588California:
$91,551
Nearest zip codes: 95207 ,
95211 ,
95209 ,
95204 ,
95212 ,
95202 .
Stockton Zip Code Map
Percentage of family households: This zip code:
52.3%California:
46.8%
Percentage of households with unmarried partners: This zip code:
7.7%California:
48.1%
Likely homosexual households (counted as self-reported same-sex unmarried-partner households)
Lesbian couples: 0.3% of all households Gay men: 0.1% of all households
Household received Food Stamps/SNAP in the past 12 months: 3,873Household did not receive Food Stamps/SNAP in the past 12 months: 8,814
Women who had a birth in the past 12 months: 839 (247 now married , 599 unmarried) Women who did not have a birth in the past 12 months: 9,522 (3,432 now married , 6,104 unmarried)
Housing units in zip code 95210 with a mortgage: 3,772 (256
second mortgage , 5
home equity loan , 150
both second mortgage and home equity loan )
Houses without a mortgage: 31
Median monthly owner costs for units with a mortgage: $1,653
Median monthly owner costs for units without a mortgage: $603
Residents with income below the poverty level in 2022:
This zip code:
20.3%Whole state:
12.2%
Residents with income below 50% of the poverty level in 2022:
This zip code:
9.6%Whole state:
6.2%
Median number of rooms in houses and condos: Median number of rooms in apartments:
Year house built (houses)
32 2020 or later343 2010 to 2019579 2000 to 20092,146 1990 to 19993,672 1980 to 19893,520 1970 to 19791,406 1960 to 1969459 1950 to 195968 1940 to 1949237 1939 or earlier
Zip code 95210 household income distribution in 2022 1,168 Less than $10,000349 $10,000 to $14,999437 $15,000 to $19,999504 $20,000 to $24,999618 $25,000 to $29,999696 $30,000 to $34,999455 $35,000 to $39,999511 $40,000 to $44,999365 $45,000 to $49,9991,172 $50,000 to $59,9991,526 $60,000 to $74,9991,773 $75,000 to $99,999754 $100,000 to $124,999684 $125,000 to $149,999794 $150,000 to $199,999407 $200,000 or moreEstimate of home value of owner-occupied houses/condos in 2022 in zip code 95210 157 Less than $10,00010 $15,000 to $19,99938 $20,000 to $24,99970 $25,000 to $29,999135 $30,000 to $34,99938 $35,000 to $39,99913 $40,000 to $49,99961 $50,000 to $59,999130 $60,000 to $69,99966 $70,000 to $79,99934 $80,000 to $89,99934 $90,000 to $99,999238 $100,000 to $124,999114 $125,000 to $149,999116 $150,000 to $174,99951 $175,000 to $199,999359 $200,000 to $249,999607 $250,000 to $299,9991,770 $300,000 to $399,999796 $400,000 to $499,999202 $500,000 to $749,9998 $1,000,000 to $1,499,99923 $2,000,000 or moreRent paid by renters in 2022 in zip code 95210 23 $100 to $14921 $150 to $19989 $200 to $24945 $250 to $29912 $300 to $34911 $350 to $39932 $400 to $44940 $450 to $49953 $500 to $54987 $550 to $59946 $600 to $64979 $650 to $69931 $700 to $749102 $750 to $799475 $800 to $899721 $900 to $9991,567 $1,000 to $1,2491,180 $1,250 to $1,499970 $1,500 to $1,999115 $2,000 to $2,4997 $2,500 to $2,99952 $3,500 or more135 No cash rent
Median gross rent in 2022: $1,395.
Median price asked for vacant for-sale houses and condos in 2022: $444,008.
Estimated median house (or condo) value in 2022 for: White Non-Hispanic householders: $326,981Black or African American householders: $387,701American Indian or Alaska Native householders: $461,735Asian householders: $371,791Native Hawaiian and other Pacific Islander householders: $600,710Some other race householders: $356,205Two or more races householders: $374,388Hispanic or Latino householders: $341,918Estimated median house or condo value in 2022: $337,047
95210:
$337,047California:
$715,900
Lower value quartile - upper value quartile: $235,884 - $416,778
Mean price in 2022: Detached houses: $406,308Here:
$406,308State:
$988,808
Townhouses or other attached units: $329,509Here:
$329,509State:
$838,546
In 2-unit structures: $281,115Here:
$281,115State:
$1,138,100
In 3-to-4-unit structures: $327,131Here:
$327,131State:
$824,253
In 5-or-more-unit structures: $400,703Here:
$400,703State:
$730,996
Mobile homes: $161,714Here:
$161,714State:
$184,506
Housing units in structures:
One, detached: 7,686One, attached: 1,332Two: 3983 or 4: 7525 to 9: 61210 to 19: 37120 to 49: 16950 or more: 688Mobile homes: 757Unemployment : 8.3%
Means of transportation to work in zip code 95210 73.5% 10,970 Drove a car alone15.6% 2,332 Carpooled0.7% 103 Bus or trolley bus0.1% 8 Subway or elevated0.0% 5 Railroad0.1% 15 Taxi0.2% 37 Bicycle0.8% 121 Walked1.3% 198 Other means5.7% 853 Worked at homeTravel time to work (commute) in zip code 95210 244 Less than 5 minutes1,033 5 to 9 minutes1,659 10 to 14 minutes3,066 15 to 19 minutes2,251 20 to 24 minutes449 25 to 29 minutes1,555 30 to 34 minutes227 35 to 39 minutes88 40 to 44 minutes1,132 45 to 59 minutes787 60 to 89 minutes1,158 90 or more minutes
Neighborhoods in zip code 95210: Percentage of zip code residents living and working in this county: 85.3%
Household type by relationship:
Households: 42,299
Male householders: 5,511 (1,107 living alone ), Female householders: 6,697 (1,326 living alone )4,957 spouses (4,909 opposite-sex spouses ), 1,180 unmarried partners , (1,139 opposite-sex unmarried partners ), 15,023 children (14,260 natural , 123 adopted , 635 stepchildren ), 2,435 grandchildren , 1,074 brothers or sisters , 1,800 parents , 74 foster children , 1,799 other relatives , 906 non-relatives In group quarters: 680 (-1 institutionalized population )
Size of family households: 2,839 2-persons , 1,605 3-persons , 1,723 4-persons , 1,430 5-persons , 768 6-persons , 925 7-or-more-persons
Size of nonfamily households: 2,433 1-person , 349 2-persons , 45 3-persons , 20 7-or-more-persons
5,001 married couples with children. single-parent households (1,433 men , 2,982 women ).
49.9% of residents of 95210 zip code speak English at home. of residents speak Spanish at home (59% very well, 22% well, 14% not well, 5% not at all ).of residents speak other Indo-European language at home (43% very well, 32% well, 16% not well, 9% not at all ).of residents speak Asian or Pacific Island language at home (47% very well, 23% well, 22% not well, 8% not at all ).of residents speak other language at home (71% very well, 21% well, 8% not well ).
Foreign born population: 11,354 (26.8%)
(56.8%
of them are naturalized citizens )
This zip code:
26.8%Whole state:
26.7%
35% Honduras 13% Malaysia 11% Nepal 10% Burma (Myanmar) 7% Thailand 5% Indonesia 4% Singapore 3% African 1% English 1% German 1% Irish 1% American 1% Italian 1% Norwegian
Year of entry for the foreign-born population
3,087 2010 or later 2,436 2000 to 2009 2,132 1990 to 1999 4,326 Before 1990
There are
425 Other Medical Specialists in Zip Code 95210.
Facilities with environmental interests located in this zip code:
KAISER STOCKTON MEDL OFS BLDG (1305 TOMMYDON in STOCKTON, CA)
STATE MASTER (California - Hazardous Waste Tracking) - HAZARDOU WASTE PROGRAM Large Quantity Generators, more that 1000 kg of hazardous waste/month (Resource Conservation and Recovery Act (tracking hazardous waste)) Business NAICS classification: OFFICES OF PHYSICIANS, MENTAL HEALTH SPECIALISTS.Organizations: ANNA MOSHER (CONTACT/OPERATOR)
, KAISER FOUNDATION HOSPITALS (CONTACT/OWNER)
Alternative names: KAISER PERMANENTE
CHEVRON STATION NO 200764 (4747 WEST LN in STOCKTON, CA)
STATE MASTER (California - Hazardous Waste Tracking) - HAZARDOU WASTE PROGRAM CRITERIA AND HAZARDOUS AIR POLLUTANT INVENTORY (Inventory of air pollution sources) Small Quantity Generators, between 100 kg and 1000 kg of hazardous waste/month (Resource Conservation and Recovery Act (tracking hazardous waste)) - notification Business SIC classification: GASOLINE SERVICE STATIONSOrganizations: CHEVRON PRODUCTS CO (CONTACT/OWNER)
Alternative names: CHEVRON USA PRODUCTS COMPANY
A SIERRA TRUCKING (8439 DUNBARTON WAY in STOCKTON, CA)
STATE MASTER (California - Hazardous Waste Tracking) - HAZARDOU WASTE PROGRAM TRANSPORTER (Resource Conservation and Recovery Act (tracking hazardous waste)) - notification Organizations: ARNULFO SIERRA (CONTACT/OWNER)
KENNEDY ELEMENTARY (630 W. PONCE DE LEON DR. in STOCKTON, CA)
(National Center for Education Statistics) - STATE ID-6042667 Organizations: STOCKTON CITY UNIFIED (SCHOOL DISTRICT)
HOLLAND ALIGNMENT BRAKE INC (3802 N WILCOX RD in STOCKTON, CA)
Small Quantity Generators, between 100 kg and 1000 kg of hazardous waste/month (Resource Conservation and Recovery Act (tracking hazardous waste)) - notification Business NAICS classification: OTHER AUTOMOTIVE MECHANICAL AND ELECTRICAL REPAIR AND MAINTENANCE.Organizations: JAMES HOLLAND (CONTACT/OWNER)
JUAN J AND TERESA BOTTELLO TRANSPORTATN (2404 AMARETTO ST in STOCKTON, CA)
TRANSPORTER (Resource Conservation and Recovery Act (tracking hazardous waste)) Organizations: JUAN J BOTELLO (CONTACT/OPERATOR)
ARCO #02130 - W/N FOOD STORE INC (7906 N EL DORADO ST in STOCKTON, CA)
CRITERIA AND HAZARDOUS AIR POLLUTANT INVENTORY (Inventory of air pollution sources) Business SIC classification: GASOLINE SERVICE STATIONSAlternative names: ARCO AM/PM 2130, ARCO AM/PM 2130 ENV COMPLIANCE
ECONO LUBE N TUNE NO 130 (6970 WEST LN in STOCKTON, CA)
Small Quantity Generators, between 100 kg and 1000 kg of hazardous waste/month (Resource Conservation and Recovery Act (tracking hazardous waste)) - notification Organizations: TOM BOYD (CONTACT/OWNER)
GALAXY RENTALS (1155 E BIANCHI RD in STOCKTON, CA)
Small Quantity Generators, between 100 kg and 1000 kg of hazardous waste/month (Resource Conservation and Recovery Act (tracking hazardous waste))
MICHAELS DRAPERY SERVICE (8026 LARRAINE AVE #214 & 216 in STOCKTON, CA)
Small Quantity Generators, between 100 kg and 1000 kg of hazardous waste/month (Resource Conservation and Recovery Act (tracking hazardous waste))
KAISER PERMANENTE MEDICAL CTR. (7373 N WEST LANE in STOCKTON, CA)
CRITERIA AND HAZARDOUS AIR POLLUTANT INVENTORY (Inventory of air pollution sources) Business SIC classification: GENERAL MEDICAL AND SURGICAL HOSPITALS
LANDMARK GRAPHICS, INC. (8030 LORRAINE AVE in STOCKTON, CA)
CRITERIA AND HAZARDOUS AIR POLLUTANT INVENTORY (Inventory of air pollution sources)
Housing units lacking complete plumbing facilities: 0.3%
Housing units lacking complete kitchen facilities: 0.9%
60.0% Utility gas 34.2% Electricity 1.9% Bottled, tank, or LP gas 1.3% Wood 0.9% Fuel oil, kerosene, etc. 0.9% No fuel used 0.8% Solar energy
Population in 1990: 33,763. Population change in the 1990s: +6,831 (+20.2%).
Place of birth for U.S.-born residents:
This state: 27,228Northeast: 407Midwest: 739South: 1,174West: 931
50% of the 95210 zip code residents lived in the same house 5 years ago.
Out of people who lived in different houses, 74% lived in this county.
Out of people who lived in different counties, 50% lived in California.
93% of the 95210 zip code residents lived in the same house 1 year ago.
Out of people who lived in different houses, 57% moved from this county.
Out of people who lived in different houses, 31% moved from different county within same state.
Out of people who lived in different houses, 8% moved from different state.
Out of people who lived in different houses, 6% moved from abroad.
Private vs. public school enrollment:
Students in private schools in grades 1 to 8 (elementary and middle school): 80
Here:
1.6%California:
10.5%
Students in private schools in grades 9 to 12 (high school): 145
Students in private undergraduate colleges: 420
Here:
20.0%California:
15.9%
Occupation by median earnings in the past 12 months ($)
113,635 Health diagnosing and treating practitioners and other technical occupations 113,095 Computer and mathematical occupations 102,978 Law enforcement workers including supervisors 59,628 Management occupations 54,558 Installation, maintenance, and repair occupations 53,334 Transportation occupations
Top industries in this zip code by the number of employees in 2005:
Health Care and Social Assistance: Offices of Physicians (except Mental Health Specialists) (500-999 employees: 1 establishment, 10-19 employees: 1 establishment, 5-9 employees: 2 establishments, 1-4 employees: 4 establishments)Accommodation and Food Services: Limited-Service Restaurants (50-99: 1, 20-49: 11, 10-19: 4, 5-9: 2, 1-4: 7)Administrative and Support and Waste Management and Remediation Services: Telemarketing Bureaus (250-499: 1, 1-4: 1)Health Care and Social Assistance: Nursing Care Facilities (100-249: 2)Health Care and Social Assistance: Services for the Elderly and Persons with Disabilities (50-99: 1, 20-49: 3, 10-19: 2)Other Services (except Public Administration): Religious Organizations (100-249: 1, 10-19: 2, 1-4: 3)
People in group quarters in 2010:
211 people in nursing facilities/skilled-nursing facilities
138 people in group homes intended for adults
85 people in college/university student housing
21 people in residential treatment centers for adults
8 people in workers' group living quarters and job corps centers
7 people in group homes for juveniles (non-correctional)
6 people in correctional residential facilities
5 people in residential treatment centers for juveniles (non-correctional)
People in group quarters in 2000:
189 people in nursing homes
150 people in college dormitories (includes college quarters off campus)
69 people in agriculture workers' dormitories on farms
57 people in other noninstitutional group quarters
39 people in homes for the mentally retarded
12 people in homes for abused, dependent, and neglected children
8 people in unknown juvenile institutions
6 people in homes for the mentally ill
Fatal accident statistics in 2014:
Fatal accident count: 3Vehicles involved in fatal accidents: 7Fatal accidents caused by drunken drivers: 2Fatalities: 4Persons involved in fatal accidents: 11Pedestrians involved in fatal accidents: 0
Fatal accident statistics in 2013:
Fatal accident count: 2Vehicles involved in fatal accidents: 3Fatal accidents caused by drunken drivers: 0Fatalities: 2Persons involved in fatal accidents: 3Pedestrians involved in fatal accidents: 2
Home Mortgage Disclosure Act Aggregated Statistics For Year 2009(Based on 11 full and 4 partial tracts) A) FHA, FSA/RHS & VA B) Conventional C) Refinancings D) Home Improvement Loans F) Non-occupant Loans on G) Loans On Manufactured Number Average Value Number Average Value Number Average Value Number Average Value Number Average Value Number Average Value
LOANS ORIGINATED 378 $119,198 382 $90,623 188 $141,209 22 $59,162 227 $82,642 2 $37,430 APPLICATIONS APPROVED, NOT ACCEPTED 27 $122,944 45 $95,416 29 $142,036 6 $7,938 23 $79,103 0 $0 APPLICATIONS DENIED 90 $115,071 117 $84,641 214 $152,506 31 $33,935 113 $78,935 2 $49,360 APPLICATIONS WITHDRAWN 72 $128,895 60 $94,236 115 $152,219 12 $77,106 40 $83,824 1 $15,000 FILES CLOSED FOR INCOMPLETENESS 12 $126,797 17 $100,712 34 $165,766 1 $180,000 17 $82,691 0 $0
Aggregated Statistics For Year 2008(Based on 11 full and 4 partial tracts) A) FHA, FSA/RHS & VA B) Conventional C) Refinancings D) Home Improvement Loans E) Loans on Dwellings For 5+ Families F) Non-occupant Loans on G) Loans On Manufactured Number Average Value Number Average Value Number Average Value Number Average Value Number Average Value Number Average Value Number Average Value
LOANS ORIGINATED 289 $153,927 555 $119,543 206 $158,956 42 $75,950 0 $0 289 $112,742 4 $62,952 APPLICATIONS APPROVED, NOT ACCEPTED 34 $146,089 109 $142,539 116 $158,638 13 $70,722 0 $0 61 $116,280 17 $94,899 APPLICATIONS DENIED 72 $140,898 222 $130,039 533 $233,379 68 $110,993 2 $185,290 137 $135,538 9 $36,886 APPLICATIONS WITHDRAWN 60 $145,239 126 $122,734 150 $194,308 20 $114,283 0 $0 78 $112,325 1 $63,000 FILES CLOSED FOR INCOMPLETENESS 4 $129,355 23 $152,068 42 $182,157 4 $233,932 0 $0 5 $213,954 0 $0
Aggregated Statistics For Year 2007(Based on 11 full and 4 partial tracts) A) FHA, FSA/RHS & VA B) Conventional C) Refinancings D) Home Improvement Loans E) Loans on Dwellings For 5+ Families F) Non-occupant Loans on G) Loans On Manufactured Number Average Value Number Average Value Number Average Value Number Average Value Number Average Value Number Average Value Number Average Value
LOANS ORIGINATED 13 $247,352 403 $208,020 1,187 $221,200 158 $138,109 4 $540,320 259 $215,706 13 $63,846 APPLICATIONS APPROVED, NOT ACCEPTED 4 $233,815 156 $212,288 391 $242,822 56 $142,086 0 $0 82 $237,071 9 $61,967 APPLICATIONS DENIED 4 $305,980 439 $226,384 1,525 $262,469 188 $166,575 0 $0 207 $258,884 22 $44,430 APPLICATIONS WITHDRAWN 4 $273,188 107 $229,021 603 $249,447 60 $139,686 0 $0 79 $249,709 4 $139,815 FILES CLOSED FOR INCOMPLETENESS 2 $230,860 52 $228,999 175 $277,553 12 $167,999 0 $0 20 $228,440 0 $0
Aggregated Statistics For Year 2006(Based on 11 full and 4 partial tracts) A) FHA, FSA/RHS & VA B) Conventional C) Refinancings D) Home Improvement Loans E) Loans on Dwellings For 5+ Families F) Non-occupant Loans on G) Loans On Manufactured Number Average Value Number Average Value Number Average Value Number Average Value Number Average Value Number Average Value Number Average Value
LOANS ORIGINATED 9 $227,901 1,242 $195,397 2,465 $236,435 374 $161,368 2 $29,980 520 $241,484 7 $44,761 APPLICATIONS APPROVED, NOT ACCEPTED 0 $0 309 $203,752 654 $238,199 73 $209,791 0 $0 130 $257,628 6 $57,960 APPLICATIONS DENIED 1 $214,000 716 $207,992 1,575 $256,347 301 $143,511 0 $0 229 $256,672 10 $145,338 APPLICATIONS WITHDRAWN 2 $327,000 348 $219,489 1,129 $258,643 92 $149,652 0 $0 124 $241,398 0 $0 FILES CLOSED FOR INCOMPLETENESS 0 $0 86 $210,005 242 $247,801 25 $231,370 0 $0 46 $243,133 0 $0
Aggregated Statistics For Year 2005(Based on 11 full and 4 partial tracts) A) FHA, FSA/RHS & VA B) Conventional C) Refinancings D) Home Improvement Loans F) Non-occupant Loans on G) Loans On Manufactured Number Average Value Number Average Value Number Average Value Number Average Value Number Average Value Number Average Value
LOANS ORIGINATED 4 $319,328 2,207 $199,963 3,406 $226,111 413 $160,995 737 $221,479 14 $88,870 APPLICATIONS APPROVED, NOT ACCEPTED 0 $0 406 $196,271 632 $218,178 66 $124,524 120 $211,433 10 $76,758 APPLICATIONS DENIED 0 $0 730 $195,243 1,580 $237,196 287 $136,345 262 $233,194 16 $109,958 APPLICATIONS WITHDRAWN 0 $0 484 $626,417 1,450 $229,260 186 $227,291 196 $224,346 4 $59,965 FILES CLOSED FOR INCOMPLETENESS 0 $0 90 $214,935 357 $213,099 25 $187,565 39 $204,613 2 $53,910
Aggregated Statistics For Year 2004(Based on 11 full and 4 partial tracts) A) FHA, FSA/RHS & VA B) Conventional C) Refinancings D) Home Improvement Loans E) Loans on Dwellings For 5+ Families F) Non-occupant Loans on G) Loans On Manufactured Number Average Value Number Average Value Number Average Value Number Average Value Number Average Value Number Average Value Number Average Value
LOANS ORIGINATED 22 $215,581 1,635 $159,385 3,115 $173,389 320 $122,480 2 $156,935 659 $172,453 10 $81,786 APPLICATIONS APPROVED, NOT ACCEPTED 2 $234,600 357 $161,729 759 $170,868 63 $85,958 0 $0 114 $175,670 5 $53,982 APPLICATIONS DENIED 17 $223,173 467 $164,322 1,432 $181,445 239 $86,033 0 $0 183 $197,701 9 $52,909 APPLICATIONS WITHDRAWN 12 $165,094 256 $163,063 1,029 $174,661 79 $121,589 0 $0 84 $179,533 0 $0 FILES CLOSED FOR INCOMPLETENESS 3 $212,437 73 $183,520 449 $179,628 23 $116,959 0 $0 48 $174,096 0 $0
Aggregated Statistics For Year 2003(Based on 11 full and 4 partial tracts) A) FHA, FSA/RHS & VA B) Conventional C) Refinancings D) Home Improvement Loans E) Loans on Dwellings For 5+ Families F) Non-occupant Loans on Number Average Value Number Average Value Number Average Value Number Average Value Number Average Value Number Average Value
LOANS ORIGINATED 157 $181,361 1,222 $143,950 4,027 $136,979 109 $39,132 2 $49,670 648 $136,917 APPLICATIONS APPROVED, NOT ACCEPTED 18 $133,877 253 $147,092 697 $144,924 28 $32,054 0 $0 105 $145,541 APPLICATIONS DENIED 16 $201,438 315 $140,384 1,692 $146,886 164 $30,538 0 $0 176 $137,254 APPLICATIONS WITHDRAWN 19 $172,494 148 $148,344 1,069 $143,865 15 $44,791 0 $0 60 $138,035 FILES CLOSED FOR INCOMPLETENESS 13 $162,010 44 $155,181 201 $139,217 12 $37,734 0 $0 28 $123,004
Aggregated Statistics For Year 2002(Based on 9 full and 2 partial tracts) A) FHA, FSA/RHS & VA B) Conventional C) Refinancings D) Home Improvement Loans F) Non-occupant Loans on Number Average Value Number Average Value Number Average Value Number Average Value Number Average Value
LOANS ORIGINATED 191 $157,426 600 $116,285 1,670 $119,075 56 $25,508 308 $107,501 APPLICATIONS APPROVED, NOT ACCEPTED 5 $133,148 103 $136,987 299 $121,575 26 $28,607 34 $120,202 APPLICATIONS DENIED 5 $147,002 133 $124,151 684 $125,564 73 $21,617 68 $125,705 APPLICATIONS WITHDRAWN 19 $131,028 45 $118,842 410 $125,729 12 $45,653 20 $107,272 FILES CLOSED FOR INCOMPLETENESS 1 $133,000 22 $147,924 247 $135,560 0 $0 12 $103,282
Aggregated Statistics For Year 2001(Based on 9 full and 2 partial tracts) A) FHA, FSA/RHS & VA B) Conventional C) Refinancings D) Home Improvement Loans E) Loans on Dwellings For 5+ Families F) Non-occupant Loans on Number Average Value Number Average Value Number Average Value Number Average Value Number Average Value Number Average Value
LOANS ORIGINATED 266 $132,624 570 $97,520 1,194 $111,536 50 $24,182 3 $109,493 210 $93,161 APPLICATIONS APPROVED, NOT ACCEPTED 20 $117,228 54 $103,871 186 $108,083 6 $10,487 0 $0 18 $97,737 APPLICATIONS DENIED 18 $134,759 154 $104,432 591 $99,804 94 $16,904 0 $0 36 $87,795 APPLICATIONS WITHDRAWN 22 $123,144 52 $92,166 354 $114,874 24 $26,049 0 $0 23 $106,054 FILES CLOSED FOR INCOMPLETENESS 1 $117,000 22 $158,532 80 $113,232 3 $31,620 0 $0 13 $88,068
Aggregated Statistics For Year 2000(Based on 9 full and 2 partial tracts) A) FHA, FSA/RHS & VA B) Conventional C) Refinancings D) Home Improvement Loans E) Loans on Dwellings For 5+ Families F) Non-occupant Loans on Number Average Value Number Average Value Number Average Value Number Average Value Number Average Value Number Average Value
LOANS ORIGINATED 304 $100,443 394 $79,837 232 $84,435 51 $27,751 1 $101,000 87 $74,366 APPLICATIONS APPROVED, NOT ACCEPTED 22 $88,082 47 $81,550 65 $72,642 30 $27,589 0 $0 9 $78,851 APPLICATIONS DENIED 42 $107,374 145 $93,887 356 $71,655 101 $21,816 0 $0 36 $79,994 APPLICATIONS WITHDRAWN 21 $111,110 56 $79,957 114 $80,407 20 $32,350 0 $0 8 $59,464 FILES CLOSED FOR INCOMPLETENESS 3 $87,630 16 $83,108 53 $93,834 2 $229,145 0 $0 5 $77,600
Aggregated Statistics For Year 1999(Based on 6 full and 5 partial tracts) A) FHA, FSA/RHS & VA B) Conventional C) Refinancings D) Home Improvement Loans E) Loans on Dwellings For 5+ Families F) Non-occupant Loans on Number Average Value Number Average Value Number Average Value Number Average Value Number Average Value Number Average Value
LOANS ORIGINATED 272 $94,140 269 $73,384 403 $81,185 51 $24,374 4 $266,465 113 $61,418 APPLICATIONS APPROVED, NOT ACCEPTED 20 $87,124 36 $94,127 102 $86,759 29 $18,628 1 $103,000 17 $66,024 APPLICATIONS DENIED 34 $89,619 68 $71,000 405 $76,925 90 $23,259 1 $84,620 49 $64,879 APPLICATIONS WITHDRAWN 44 $115,721 58 $90,804 196 $81,460 7 $27,316 3 $1,226,263 15 $72,678 FILES CLOSED FOR INCOMPLETENESS 5 $65,386 9 $73,197 82 $90,978 2 $21,660 1 $101,670 8 $76,288
Private Mortgage Insurance Companies Aggregated Statistics For Year 2009(Based on 9 full and 4 partial tracts) A) Conventional B) Refinancings C) Non-occupant Loans on Number Average Value Number Average Value Number Average Value
LOANS ORIGINATED 32 $111,171 3 $117,880 1 $153,000 APPLICATIONS APPROVED, NOT ACCEPTED 18 $133,264 5 $270,832 2 $114,930 APPLICATIONS DENIED 3 $117,110 0 $0 0 $0 APPLICATIONS WITHDRAWN 3 $127,733 0 $0 0 $0 FILES CLOSED FOR INCOMPLETENESS 3 $213,097 2 $139,915 0 $0
Aggregated Statistics For Year 2008(Based on 11 full and 4 partial tracts) A) Conventional B) Refinancings C) Non-occupant Loans on Number Average Value Number Average Value Number Average Value
LOANS ORIGINATED 183 $160,995 17 $193,684 22 $147,605 APPLICATIONS APPROVED, NOT ACCEPTED 84 $213,653 31 $267,061 14 $187,711 APPLICATIONS DENIED 26 $141,127 0 $0 7 $110,377 APPLICATIONS WITHDRAWN 9 $198,098 2 $251,345 0 $0 FILES CLOSED FOR INCOMPLETENESS 1 $238,440 0 $0 0 $0
Aggregated Statistics For Year 2007(Based on 11 full and 4 partial tracts) A) Conventional B) Refinancings C) Non-occupant Loans on Number Average Value Number Average Value Number Average Value
LOANS ORIGINATED 95 $247,936 121 $317,138 14 $242,063 APPLICATIONS APPROVED, NOT ACCEPTED 13 $249,030 27 $311,752 6 $302,780 APPLICATIONS DENIED 1 $285,000 2 $330,000 0 $0 APPLICATIONS WITHDRAWN 10 $299,477 8 $333,512 0 $0 FILES CLOSED FOR INCOMPLETENESS 0 $0 0 $0 0 $0
Aggregated Statistics For Year 2006(Based on 9 full and 4 partial tracts) A) Conventional B) Refinancings C) Non-occupant Loans on Number Average Value Number Average Value Number Average Value
LOANS ORIGINATED 20 $291,994 60 $321,006 2 $179,890 APPLICATIONS APPROVED, NOT ACCEPTED 8 $378,649 10 $269,107 2 $220,625 APPLICATIONS DENIED 0 $0 0 $0 0 $0 APPLICATIONS WITHDRAWN 2 $222,620 5 $309,332 0 $0 FILES CLOSED FOR INCOMPLETENESS 0 $0 0 $0 0 $0
Aggregated Statistics For Year 2005(Based on 11 full and 4 partial tracts) A) Conventional B) Refinancings C) Non-occupant Loans on Number Average Value Number Average Value Number Average Value
LOANS ORIGINATED 52 $303,155 60 $292,627 7 $232,807 APPLICATIONS APPROVED, NOT ACCEPTED 8 $297,766 10 $258,648 2 $292,510 APPLICATIONS DENIED 0 $0 7 $300,041 0 $0 APPLICATIONS WITHDRAWN 4 $263,178 10 $284,575 2 $349,000 FILES CLOSED FOR INCOMPLETENESS 0 $0 0 $0 0 $0
Aggregated Statistics For Year 2004(Based on 11 full and 4 partial tracts) A) Conventional B) Refinancings C) Non-occupant Loans on Number Average Value Number Average Value Number Average Value
LOANS ORIGINATED 85 $215,144 77 $200,260 10 $215,654 APPLICATIONS APPROVED, NOT ACCEPTED 33 $211,050 73 $189,339 17 $199,641 APPLICATIONS DENIED 0 $0 2 $233,860 0 $0 APPLICATIONS WITHDRAWN 5 $205,722 12 $210,635 0 $0 FILES CLOSED FOR INCOMPLETENESS 0 $0 4 $199,262 0 $0
Aggregated Statistics For Year 2003(Based on 11 full and 4 partial tracts) A) Conventional B) Refinancings C) Non-occupant Loans on Number Average Value Number Average Value Number Average Value
LOANS ORIGINATED 209 $181,077 169 $173,364 23 $159,993 APPLICATIONS APPROVED, NOT ACCEPTED 57 $180,633 87 $183,501 12 $136,841 APPLICATIONS DENIED 2 $214,870 6 $191,415 2 $179,695 APPLICATIONS WITHDRAWN 10 $177,596 8 $184,540 0 $0 FILES CLOSED FOR INCOMPLETENESS 0 $0 2 $188,925 0 $0
Aggregated Statistics For Year 2002(Based on 9 full and 2 partial tracts) A) Conventional B) Refinancings C) Non-occupant Loans on Number Average Value Number Average Value Number Average Value
LOANS ORIGINATED 150 $154,749 72 $154,875 28 $134,391 APPLICATIONS APPROVED, NOT ACCEPTED 22 $138,889 23 $148,656 4 $102,388 APPLICATIONS DENIED 2 $152,740 2 $198,070 0 $0 APPLICATIONS WITHDRAWN 11 $144,129 9 $159,112 1 $145,000 FILES CLOSED FOR INCOMPLETENESS 1 $221,000 1 $150,000 1 $221,000
Aggregated Statistics For Year 2001(Based on 9 full and 2 partial tracts) A) Conventional B) Refinancings C) Non-occupant Loans on Number Average Value Number Average Value Number Average Value
LOANS ORIGINATED 179 $127,758 108 $146,404 21 $96,121 APPLICATIONS APPROVED, NOT ACCEPTED 29 $103,703 27 $144,413 3 $55,273 APPLICATIONS DENIED 6 $172,095 10 $144,835 2 $124,785 APPLICATIONS WITHDRAWN 3 $160,723 5 $153,394 2 $157,730 FILES CLOSED FOR INCOMPLETENESS 1 $92,000 0 $0 0 $0
Aggregated Statistics For Year 2000(Based on 9 full and 2 partial tracts) A) Conventional B) Refinancings C) Non-occupant Loans on Number Average Value Number Average Value Number Average Value
LOANS ORIGINATED 97 $104,399 21 $112,651 8 $104,861 APPLICATIONS APPROVED, NOT ACCEPTED 11 $90,758 6 $113,592 0 $0 APPLICATIONS DENIED 4 $104,822 2 $132,000 0 $0 APPLICATIONS WITHDRAWN 0 $0 0 $0 0 $0 FILES CLOSED FOR INCOMPLETENESS 0 $0 0 $0 0 $0
Aggregated Statistics For Year 1999(Based on 5 full and 5 partial tracts) A) Conventional B) Refinancings C) Non-occupant Loans on Number Average Value Number Average Value Number Average Value
LOANS ORIGINATED 58 $99,545 58 $106,560 8 $79,302 APPLICATIONS APPROVED, NOT ACCEPTED 5 $109,464 8 $87,604 1 $55,850 APPLICATIONS DENIED 8 $96,594 4 $95,142 3 $85,973 APPLICATIONS WITHDRAWN 1 $128,090 3 $107,207 1 $70,000 FILES CLOSED FOR INCOMPLETENESS 1 $101,720 0 $0 0 $0
2005 - 2016 National Fire Incident Reporting System (NFIRS) incidents See full 2006 National Fire Incident Reporting System statistics for zip code 95210, California
Most common first names in zip code 95210 among deceased individuals Name Count Lived (average)
Mary 79 74.7 years John 65 73.6 years Robert 63 72.1 years James 53 71.3 years William 46 71.5 years Charles 42 69.9 years George 39 74.2 years Dorothy 38 79.1 years Donald 29 66.8 years Richard 28 67.0 years
Most common last names in zip code 95210 among deceased individuals Last name Count Lived (average)
Smith 45 74.1 years Johnson 30 71.8 years Nguyen 21 64.1 years Williams 20 72.8 years Miller 18 74.2 years Lee 17 73.7 years Brown 16 66.6 years Davis 16 71.4 years Tran 16 66.4 years Clark 15 66.8 years
Businesses in zip code 95210
Name Count Name Count
99 Cents Only Stores 1 McDonald's 2 AT&T 1 Pier 1 Imports 1 AutoZone 1 Popeyes 1 Baskin-Robbins 1 Rite Aid 1 Burger King 1 Skechers USA 1 CVS 1 Starbucks 2 Carl\s Jr. 1 Subway 4 Church's Chicken 1 T-Mobile 2 Costco 1 T.J.Maxx 1 Discount Tire 1 Taco Bell 2 El Pollo Loco 1 The Room Place 1 Firestone Complete Auto Care 1 Toyota 1 GNC 1 Toys"R"Us 1 GameStop 1 U-Haul 1 H&R Block 1 UPS 3 Honda 1 Volkswagen 1 IHOP 1 Walgreens 2 Jack In The Box 1 Wendy's 1 Kroger 1 YMCA 1 Little Caesars Pizza 1

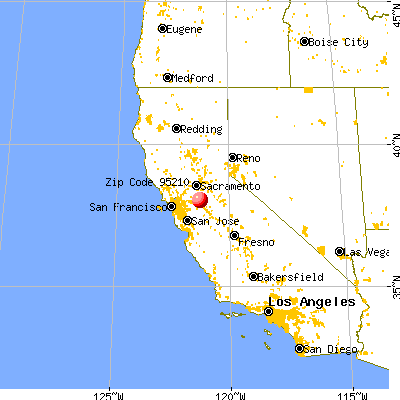


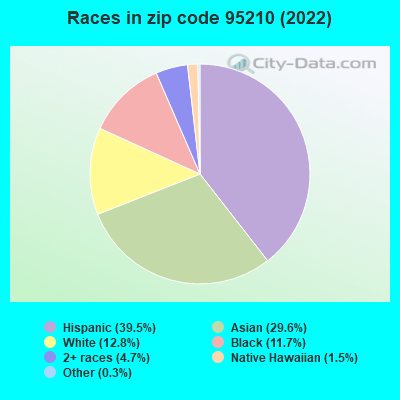


 Nearest zip codes: 95207, 95211, 95209, 95204, 95212, 95202.
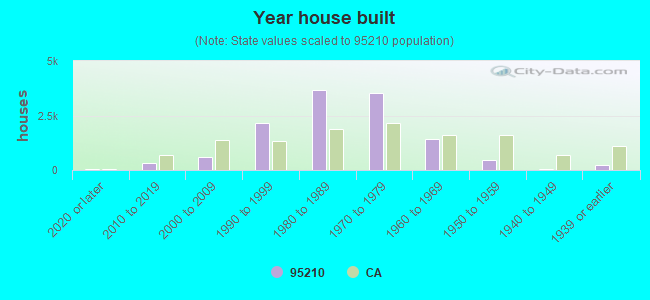
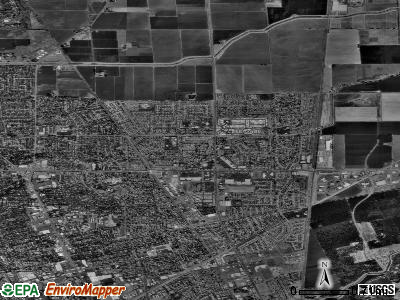
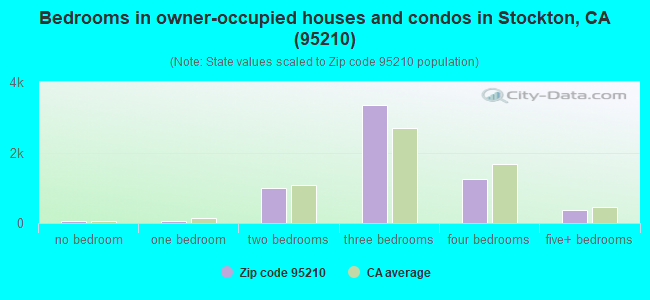
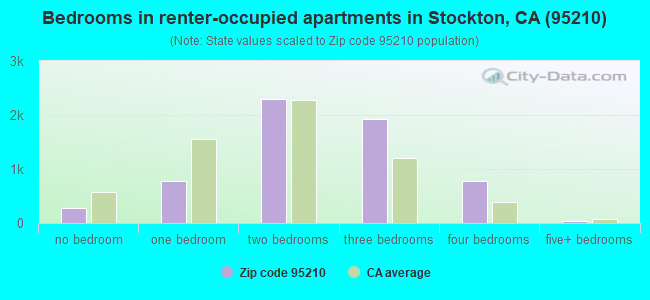
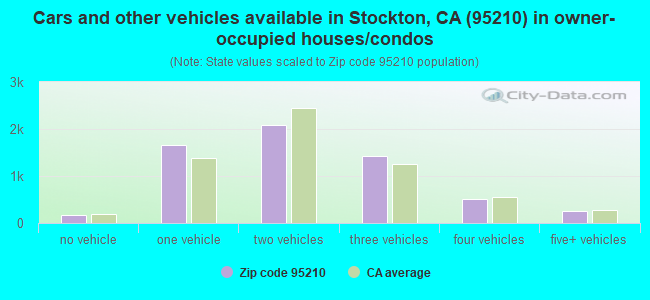
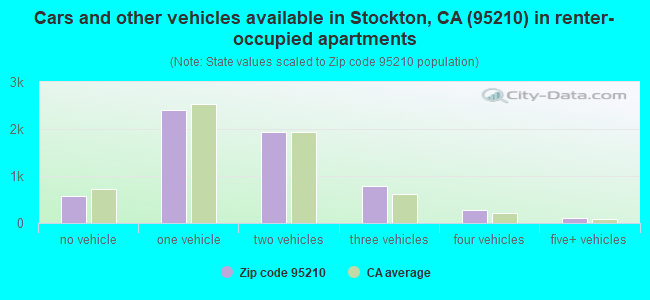


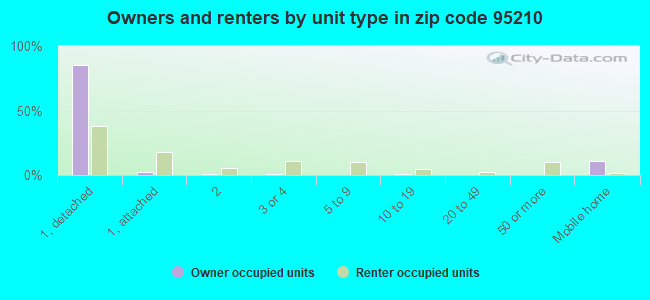
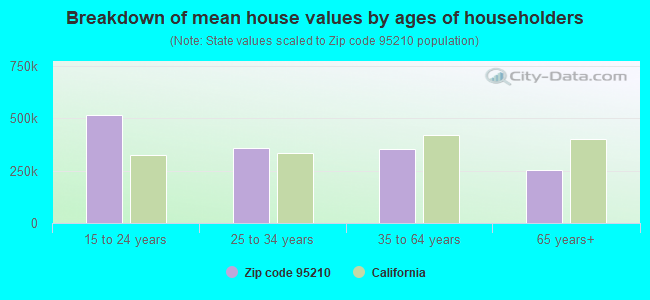


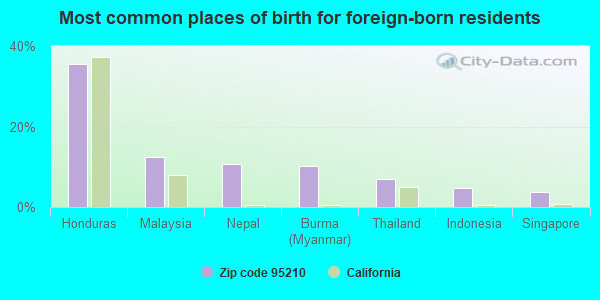
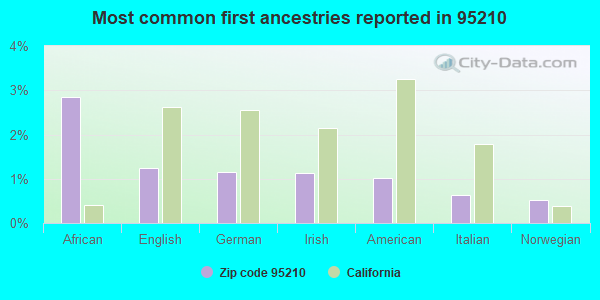
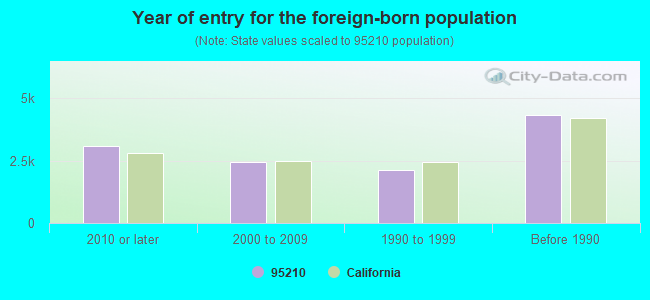


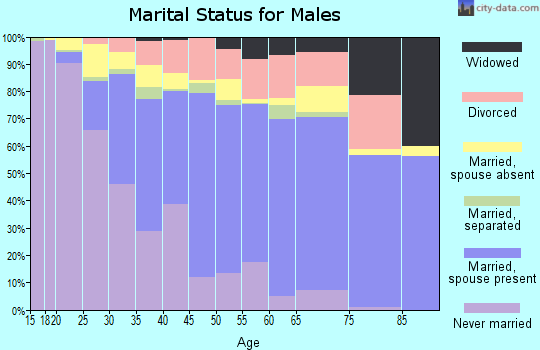

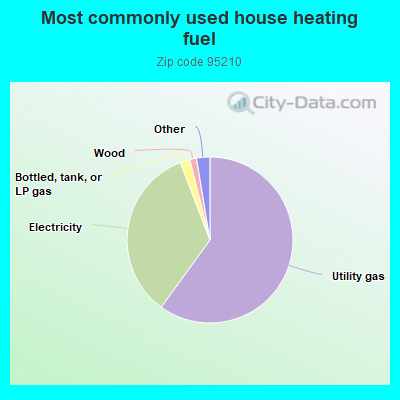
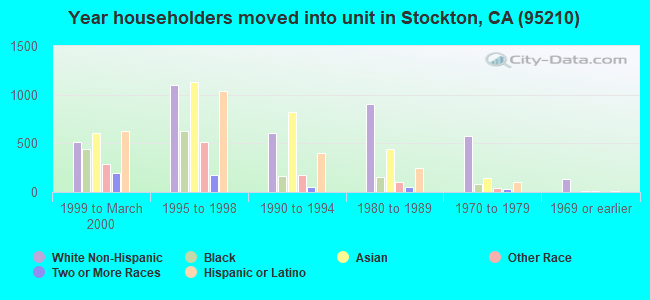
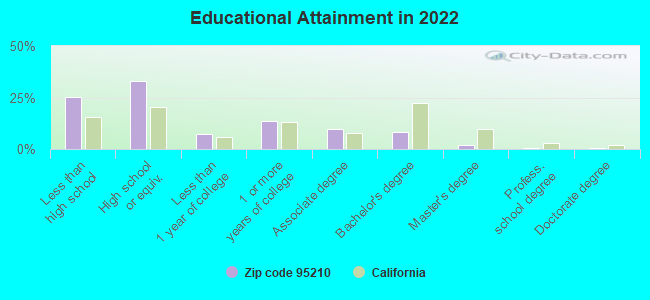
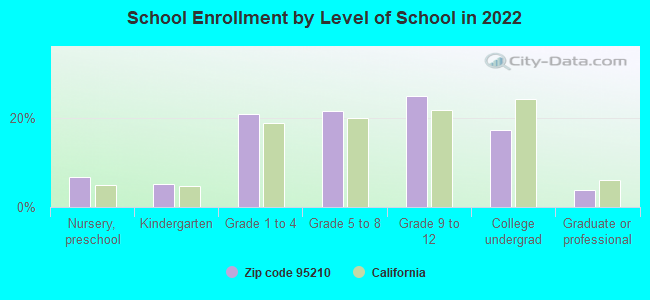
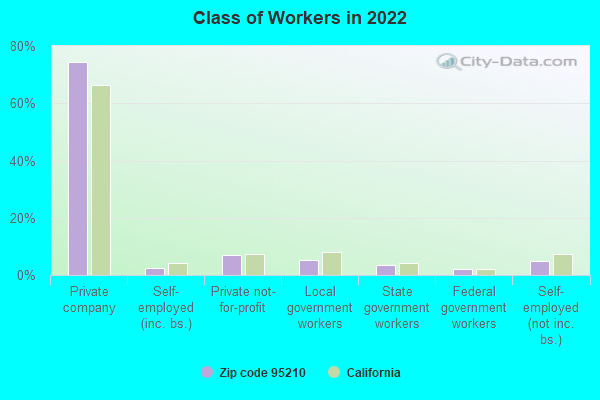
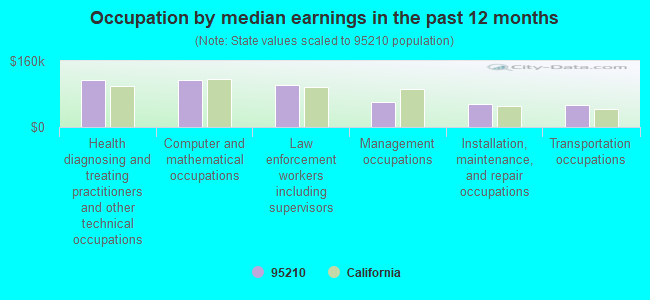
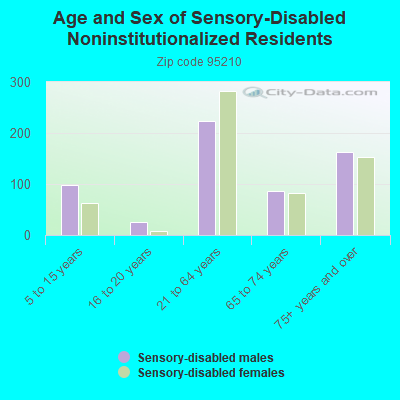
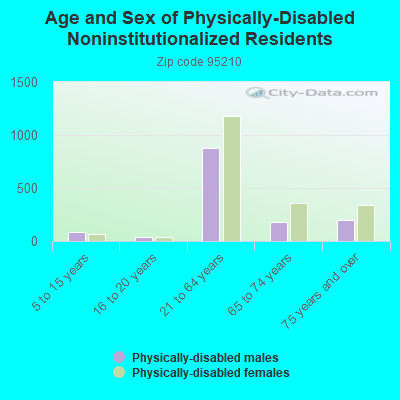
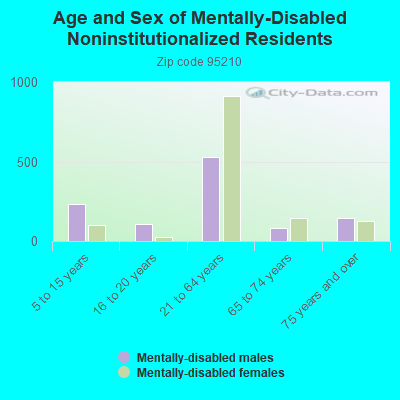
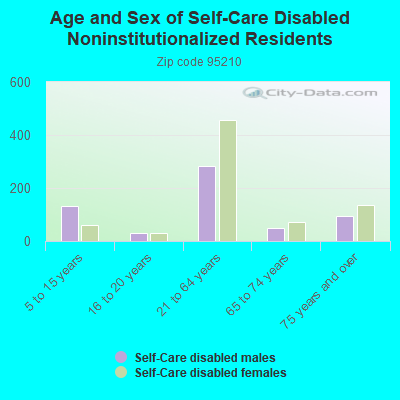
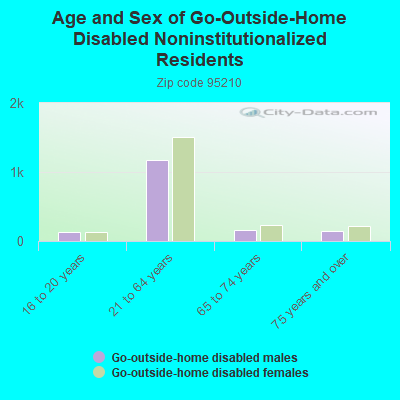
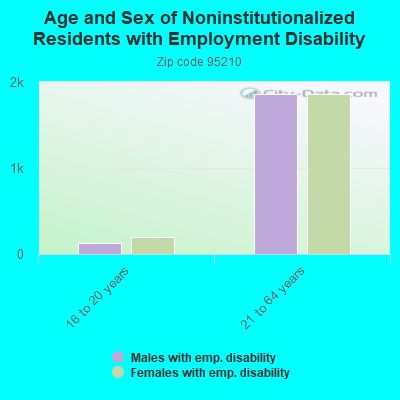
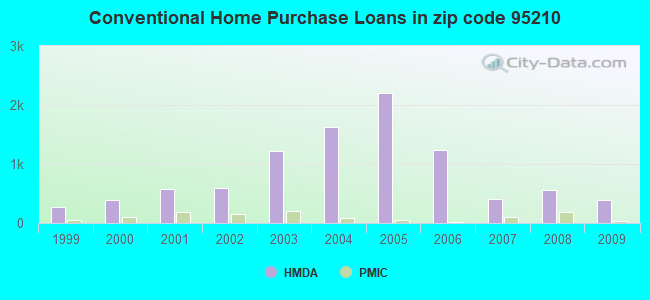
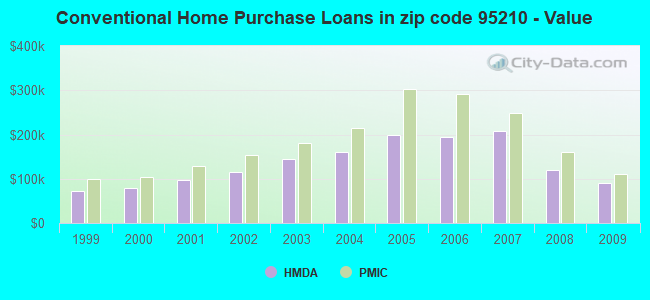
 According to the data from the years 2005 - 2016 the average number of fires per year is 59. The highest number of fire incidents - 183 took place in 2007, and the least - 1 in 2012. The data has a declining trend.
 When looking into fire subcategories, the most reports belonged to: Outside Fires (55.0%), and Structure Fires (24.5%).