Estimated zip code population in 2022: 30,153 Zip code population in 2010: 27,786 Zip code population in 2000: 30,465
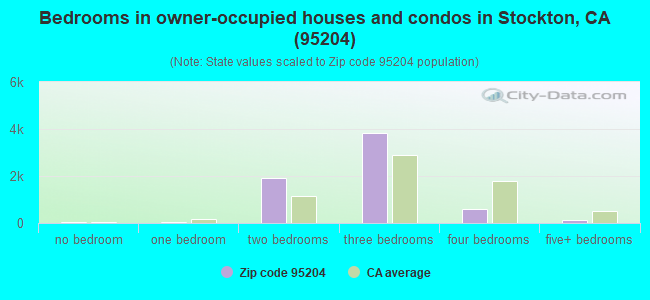
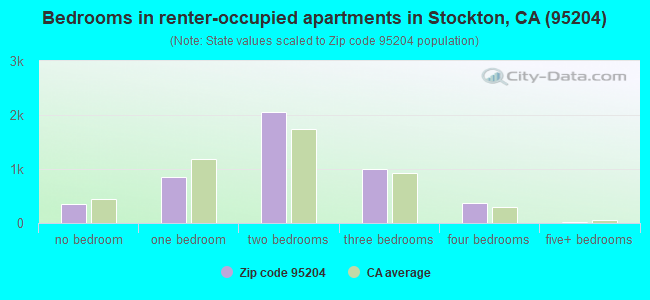
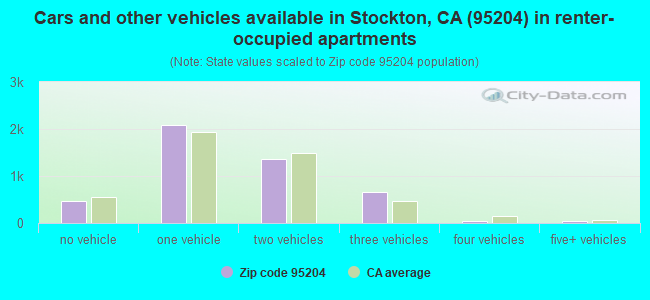
Houses and condos: 12,323 Renter-occupied apartments: 4,669
% of renters here:
41%
State:
44%
March 2022 cost of living index in zip code 95204: 98.3 (near average, U.S. average is 100)
Land area: 5.1 sq. mi. Water area: 0.3 sq. mi.
Population density: 5,912 people per square mile
(average).
OSM Map
General Map
Google Map
MSN Map
OSM Map
General Map
Google Map
MSN Map
OSM Map
General Map
Google Map
MSN Map
OSM Map
General Map
Google Map
MSN Map
Please wait while loading the map...
Real estate property taxes paid for housing units in 2022:
This zip code:
0.7% ($2,482)
California:
0.7% ($4,831)
Median real estate property taxes paid for housing units with mortgages in 2022: $2,760 (0.7%) Median real estate property taxes paid for housing units with no mortgage in 2022: $2,051 (0.6%)
Averages for the 2020 tax year for zip code 95204, filed in 2021:
Average Adjusted Gross Income (AGI) in 2020: $55,085 (Individual Income Tax Returns)
Here:
$55,085
State:
$95,910
Salary/wage: $47,499 (reported on 81.8% of returns)
Here:
$47,499
State:
$77,331
(% of AGI for various income ranges: 1199.3% for AGIs below $25k, 3939.6% for AGIs $25k-50k, 7245.7% for AGIs $50k-75k, 10295.1% for AGIs $75k-100k, 17941.4% for AGIs $100k-200k, 92638.3% for AGIs over 200k)
Taxable interest for individuals: $842 (reported on 31.0% of returns)
This zip code:
$842
California:
$2,294
(% of AGI for various income ranges: 8.5% for AGIs below $25k, 10.3% for AGIs $25k-50k, 18.6% for AGIs $50k-75k, 30.1% for AGIs $75k-100k, 102.7% for AGIs $100k-200k, 3061.7% for AGIs over 200k)
Ordinary dividends: $7,132 (reported on 10.2% of returns)
Here:
$7,132
State:
$10,949
(% of AGI for various income ranges: 15.3% for AGIs below $25k, 24.6% for AGIs $25k-50k, 44.3% for AGIs $50k-75k, 92.1% for AGIs $75k-100k, 366.2% for AGIs $100k-200k, 8255.0% for AGIs over 200k)
Net capital gain/loss in AGI: +$18,574 (reported on 10.0% of returns)
Here:
+$18,574
State:
+$49,306
(% of AGI for various income ranges: 7.0% for AGIs below $25k, 10.9% for AGIs $25k-50k, 33.0% for AGIs $50k-75k, 88.7% for AGIs $75k-100k, 657.7% for AGIs $100k-200k, 33588.3% for AGIs over 200k)
Profit/loss from business: +$10,021 (reported on 12.1% of returns)
Here:
+$10,021
State:
+$15,671
(% of AGI for various income ranges: 75.3% for AGIs below $25k, 96.0% for AGIs $25k-50k, 136.7% for AGIs $50k-75k, 194.5% for AGIs $75k-100k, 408.4% for AGIs $100k-200k, 8511.7% for AGIs over 200k)
Taxable individual retirement arrangement distribution: $16,429 (reported on 5.8% of returns)
95204:
$16,429
California:
$23,505
(% of AGI for various income ranges: 28.4% for AGIs below $25k, 46.0% for AGIs $25k-50k, 141.7% for AGIs $50k-75k, 147.8% for AGIs $75k-100k, 762.6% for AGIs $100k-200k, 3608.3% for AGIs over 200k)
Self-employed (Keogh) retirement plans: $15,000 (reported on 0.3% of returns)
95204:
$15,000
California:
$30,163
(% of AGI for various income ranges: 81.1% for AGIs $100k-200k)
Total itemized deductions: $27,670 (reported on 8.9% of returns)
Here:
$27,670
State:
$39,517
(% of AGI for various income ranges: 50.2% for AGIs below $25k, 99.9% for AGIs $25k-50k, 354.3% for AGIs $50k-75k, 691.5% for AGIs $75k-100k, 1364.3% for AGIs $100k-200k, 14195.0% for AGIs over 200k)
Charity contributions: $6,452 (reported on 6.7% of returns)
Here:
$6,452
State:
$12,598
(% of AGI for various income ranges: 3.3% for AGIs below $25k, 8.9% for AGIs $25k-50k, 43.3% for AGIs $50k-75k, 81.6% for AGIs $75k-100k, 235.3% for AGIs $100k-200k, 4368.3% for AGIs over 200k)
Taxes paid: $7,491 (reported on 8.8% of returns)
95204:
$7,491
State:
$8,807
(% of AGI for various income ranges: 8.7% for AGIs below $25k, 24.7% for AGIs $25k-50k, 99.4% for AGIs $50k-75k, 228.3% for AGIs $75k-100k, 458.8% for AGIs $100k-200k, 2278.3% for AGIs over 200k)
Earned income credit: $2,137 (reported on 19.3% of returns)
Here:
$2,137
State:
$2,074
(% of AGI for various income ranges: 106.2% for AGIs below $25k, 79.8% for AGIs $25k-50k, 1.9% for AGIs $50k-75k)
Percentage of individuals using paid preparers for their 2020 taxes: 93.1%
Here:
93%
State:
92%
(% for various income ranges: 92.3% for AGIs below $25k, 93.6% for AGIs $25k-50k, 92.6% for AGIs $50k-75k, 95.0% for AGIs $75k-100k, 93.2% for AGIs $100k-200k, 93.8% for AGIs over 200k)
Averages for the 2012 tax year for zip code 95204, filed in 2013:
Average Adjusted Gross Income (AGI) in 2012: $49,762 (Individual Income Tax Returns)
Here:
$49,762
State:
$72,726
Salary/wage: $38,946 (reported on 79.5% of returns)
Here:
$38,946
State:
$59,079
(% of AGI for various income ranges: 71.2% for AGIs below $25k, 77.4% for AGIs $25k-50k, 70.8% for AGIs $50k-75k, 68.9% for AGIs $75k-100k, 65.3% for AGIs $100k-200k, 29.4% for AGIs over 200k)
Taxable interest for individuals: $1,270 (reported on 34.2% of returns)
This zip code:
$1,270
California:
$2,146
(% of AGI for various income ranges: 0.8% for AGIs below $25k, 0.6% for AGIs $25k-50k, 0.6% for AGIs $50k-75k, 0.5% for AGIs $75k-100k, 0.8% for AGIs $100k-200k, 1.6% for AGIs over 200k)
Ordinary dividends: $6,520 (reported on 14.5% of returns)
Here:
$6,520
State:
$9,308
(% of AGI for various income ranges: 1.4% for AGIs below $25k, 0.8% for AGIs $25k-50k, 1.4% for AGIs $50k-75k, 1.6% for AGIs $75k-100k, 2.0% for AGIs $100k-200k, 3.7% for AGIs over 200k)
Net capital gain/loss in AGI: +$15,150 (reported on 10.8% of returns)
Here:
+$15,150
State:
+$30,460
(% of AGI for various income ranges: 0.1% for AGIs $25k-50k, 0.3% for AGIs $50k-75k, 0.4% for AGIs $75k-100k, 1.5% for AGIs $100k-200k, 13.9% for AGIs over 200k)
Profit/loss from business: +$13,199 (reported on 12.1% of returns)
Here:
+$13,199
State:
+$17,064
(% of AGI for various income ranges: 7.1% for AGIs below $25k, 2.4% for AGIs $25k-50k, 2.1% for AGIs $50k-75k, 1.8% for AGIs $75k-100k, 2.8% for AGIs $100k-200k, 4.1% for AGIs over 200k)
Taxable individual retirement arrangement distribution: $15,220 (reported on 9.1% of returns)
95204:
$15,220
California:
$19,557
(% of AGI for various income ranges: 2.4% for AGIs below $25k, 1.4% for AGIs $25k-50k, 2.5% for AGIs $50k-75k, 3.4% for AGIs $75k-100k, 3.9% for AGIs $100k-200k, 3.1% for AGIs over 200k)
Self-employment retirement plans: $15,483 (reported on 0.5% of returns)
95204:
$15,483
California:
$24,530
Total itemized deductions: $22,179 (21% of AGI, reported on 27.6% of returns)
Here:
$22,179
State:
$34,004
Here:
21.3% of AGI
State:
22.7% of AGI
(% of AGI for various income ranges: 8.1% for AGIs below $25k, 8.8% for AGIs $25k-50k, 12.8% for AGIs $50k-75k, 14.2% for AGIs $75k-100k, 15.9% for AGIs $100k-200k, 12.9% for AGIs over 200k)
Charity contributions: $3,271 (reported on 22.7% of returns)
Here:
$3,271
State:
$4,659
(% of AGI for various income ranges: 0.5% for AGIs below $25k, 0.8% for AGIs $25k-50k, 1.4% for AGIs $50k-75k, 1.6% for AGIs $75k-100k, 2.2% for AGIs $100k-200k, 2.0% for AGIs over 200k)
Taxes paid: $7,785 (reported on 27.4% of returns)
95204:
$7,785
State:
$14,448
(% of AGI for various income ranges: 1.3% for AGIs below $25k, 1.9% for AGIs $25k-50k, 3.2% for AGIs $50k-75k, 4.4% for AGIs $75k-100k, 6.2% for AGIs $100k-200k, 7.2% for AGIs over 200k)
Earned income credit: $2,310 (reported on 24.7% of returns)
Here:
$2,310
State:
$2,286
(% of AGI for various income ranges: 8.1% for AGIs below $25k, 1.2% for AGIs $25k-50k)
Percentage of individuals using paid preparers for their 2012 taxes: 56.1%
Here:
56%
State:
64%
(% for various income ranges: 50.4% for AGIs below $25k, 55.0% for AGIs $25k-50k, 62.7% for AGIs $50k-75k, 60.5% for AGIs $75k-100k, 69.9% for AGIs $100k-200k, 85.0% for AGIs over 200k)
Averages for the 2004 tax year for zip code 95204, filed in 2005:
Average Adjusted Gross Income (AGI) in 2004: $52,505 (Individual Income Tax Returns)
Here:
$52,505
State:
$58,600
Salary/wage: $37,862 (reported on 81.6% of returns)
Here:
$37,862
State:
$49,455
(% of AGI for various income ranges: 146.5% for AGIs below $10k, 71.6% for AGIs $10k-25k, 80.8% for AGIs $25k-50k, 79.2% for AGIs $50k-75k, 75.2% for AGIs $75k-100k, 29.1% for AGIs over 100k)
Taxable interest for individuals: $1,784 (reported on 47.2% of returns)
This zip code:
$1,784
California:
$2,365
(% of AGI for various income ranges: 9.8% for AGIs below $10k, 2.2% for AGIs $10k-25k, 1.0% for AGIs $25k-50k, 1.2% for AGIs $50k-75k, 1.5% for AGIs $75k-100k, 1.8% for AGIs over 100k)
Taxable dividends: $4,856 (reported on 19.7% of returns)
Here:
$4,856
State:
$4,746
(% of AGI for various income ranges: 5.3% for AGIs below $10k, 1.4% for AGIs $10k-25k, 0.9% for AGIs $25k-50k, 1.1% for AGIs $50k-75k, 1.5% for AGIs $75k-100k, 2.7% for AGIs over 100k)
Net capital gain/loss: +$22,100 (reported on 15.0% of returns)
Here:
+$22,100
State:
+$23,418
(% of AGI for various income ranges: -0.6% for AGIs below $10k, -0.2% for AGIs $10k-25k, 0.3% for AGIs $25k-50k, 1.0% for AGIs $50k-75k, 1.2% for AGIs $75k-100k, 14.8% for AGIs over 100k)
Profit/loss from business: +$16,058 (reported on 12.0% of returns)
Here:
+$16,058
State:
+$16,826
(% of AGI for various income ranges: -0.1% for AGIs below $10k, 5.3% for AGIs $10k-25k, 2.4% for AGIs $25k-50k, 2.7% for AGIs $50k-75k, 3.7% for AGIs $75k-100k, 4.5% for AGIs over 100k)
IRA payment deduction: $2,732 (reported on 2.2% of returns)
95204:
$2,732
California:
$3,192
(% of AGI for various income ranges: 0.3% for AGIs $10k-25k, 0.2% for AGIs $25k-50k, 0.1% for AGIs $50k-75k, 0.1% for AGIs $75k-100k, 0.0% for AGIs over 100k)
Self-employed pension: $13,780 (reported on 1.0% of returns)
Here:
$13,780
California:
$17,688
(% of AGI for various income ranges: 0.7% for AGIs below $10k, 0.1% for AGIs $25k-50k, 0.1% for AGIs $50k-75k, 0.2% for AGIs $75k-100k, 0.5% for AGIs over 100k)
Total itemized deductions: $19,130 (19% of AGI, reported on 36.1% of returns)
Here:
$19,130
State:
$28,113
Here:
19.3% of AGI
State:
25.3% of AGI
(% of AGI for various income ranges: 19.6% for AGIs below $10k, 10.4% for AGIs $10k-25k, 13.8% for AGIs $25k-50k, 17.4% for AGIs $50k-75k, 17.8% for AGIs $75k-100k, 9.9% for AGIs over 100k)
Charity contributions deductions: $2,818 (3% of AGI, reported on 31.4% of returns)
Here:
$2,818
State:
$3,923
Here:
2.7% of AGI
State:
3.3% of AGI
(% of AGI for various income ranges: 0.8% for AGIs below $10k, 0.8% for AGIs $10k-25k, 1.2% for AGIs $25k-50k, 1.7% for AGIs $50k-75k, 2.4% for AGIs $75k-100k, 1.9% for AGIs over 100k)
Total tax: $7,994 (reported on 75.5% of returns)
95204:
$7,994
State:
$10,761
(% of AGI for various income ranges: 3.8% for AGIs below $10k, 3.9% for AGIs $10k-25k, 6.6% for AGIs $25k-50k, 9.1% for AGIs $50k-75k, 10.9% for AGIs $75k-100k, 17.0% for AGIs over 100k)
Earned income credit: $1,714 (reported on 16.7% of returns)
Here:
$1,714
State:
$1,763
Percentage of individuals using paid preparers for their 2004 taxes: 63.6%
Here:
64%
State:
66%
(% for various income ranges: 56.2% for AGIs below $10k, 62.9% for AGIs $10k-25k, 62.3% for AGIs $25k-50k, 66.9% for AGIs $50k-75k, 68.3% for AGIs $75k-100k, 77.0% for AGIs over 100k)
Likely homosexual households (counted as self-reported same-sex unmarried-partner households)
Lesbian couples: 0.2% of all households
Gay men: 0.1% of all households
Household received Food Stamps/SNAP in the past 12 months: 2,776 Household did not receive Food Stamps/SNAP in the past 12 months: 8,784
Women who had a birth in the past 12 months: 410 (304 now married, 105 unmarried) Women who did not have a birth in the past 12 months: 6,752 (2,567 now married, 4,189 unmarried)
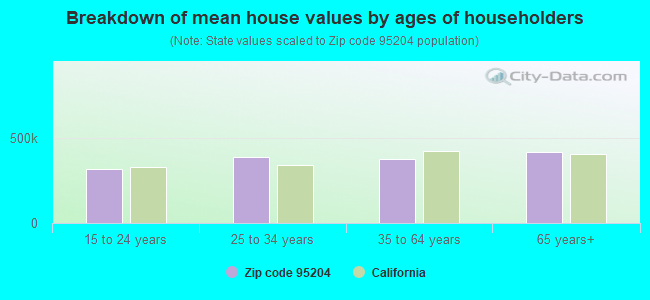
Housing units in zip code 95204 with a mortgage: 4,332 (262 second mortgage, 231 both second mortgage and home equity loan) Houses without a mortgage: 10
Median monthly owner costs for units with a mortgage: $1,846 Median monthly owner costs for units without a mortgage: $582
Residents with income below the poverty level in 2022:
This zip code:
13.9%
Whole state:
12.2%
Residents with income below 50% of the poverty level in 2022:
This zip code:
7.9%
Whole state:
6.2%
Median number of rooms in houses and condos:
Here:
5.6
State:
6.0
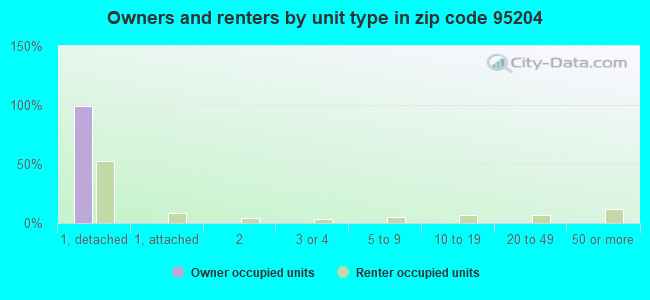
Median number of rooms in apartments:
Here:
4.3
State:
3.9
Notable locations in this zip code not listed on our city pages
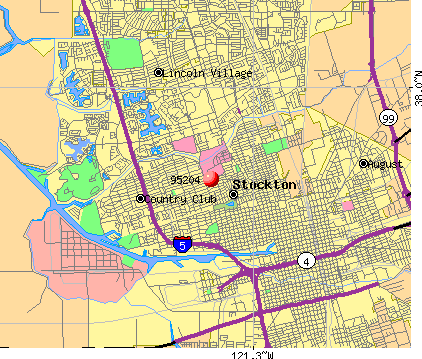
Notable locations in zip code 95204: Oxford Circle (A), Calaveras Landing (B), Stockton Country Club (C), William Knox Holt Memorial Library (D), Spanos Center (E), Faraday Hall (F). Display/hide their locations on the map
Churches in zip code 95204 include: Church of Christ (A), The Church of Jesus Christ of Latter Day Saints (B), Faith Lutheran Church (C), First Baptist Church (D), Kingdom Hall of Jehovahs Witnesses (E), Landmark Missionary Baptist Church (F), Reorganized Church of Jesus Christ of Latter Day Saints (G), Central Church of Christ (H), Central United Methodist Church (I). Display/hide their locations on the map
3,903 married couples with children.
2,185 single-parent households (361 men, 1,824 women).
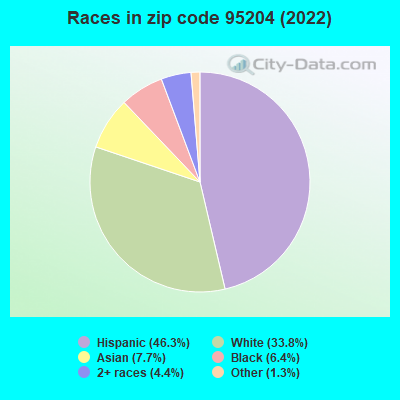
72.9% of residents of 95204 zip code speak English at home.
20.6% of residents speak Spanish at home (65% very well, 13% well, 14% not well, 8% not at all).
1.2% of residents speak other Indo-European language at home (86% very well, 2% well, 7% not well, 4% not at all).
4.8% of residents speak Asian or Pacific Island language at home (40% very well, 27% well, 24% not well, 8% not at all).
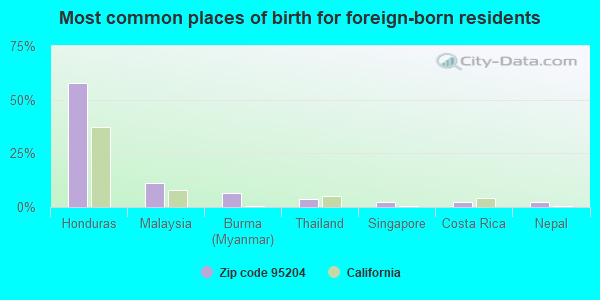
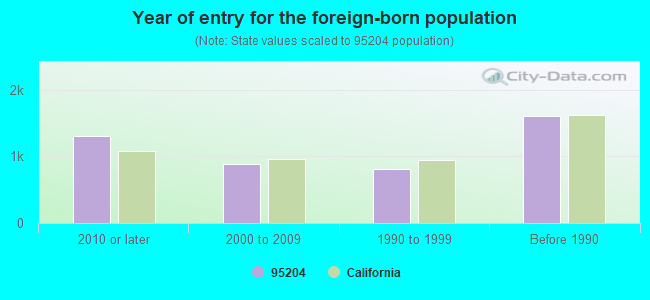
Foreign born population: 4,087 (13.6%) (57.3% of them are naturalized citizens)
Major facilities with environmental interests located in this zip code:
EQUILON ENTERPRISES (2575 COUNTRY CLUB in STOCKTON, CA) . Federal Facility
STATE MASTER (California - Hazardous Waste Tracking) - HAZARDOU WASTE PROGRAM CRITERIA AND HAZARDOUS AIR POLLUTANT INVENTORY (Inventory of air pollution sources) HAZARDOUS WASTE BIENNIAL REPORTER (Resource Conservation and Recovery Act (tracking hazardous waste)) Large Quantity Generators, more that 1000 kg of hazardous waste/month (Resource Conservation and Recovery Act (tracking hazardous waste)) Business SIC classification: GASOLINE SERVICE STATIONS Organizations: SHELL OIL PRODUCTS US (CONTACT/OPERATOR)
, EQUILON ENTERPRISES LLC DBA SHELL OIL PR (CONTACT/OWNER)
Alternative names: COUNTRY CLUB SHELL, SHELL OIL CO, SHELL SERVICE STATION 136144
AMERICAN MOULDING AND MILLWORK COMPANY (2801 NORTH WEST LANE in STOCKTON, CA)
STATE MASTER (California - Hazardous Waste Tracking) - HAZARDOU WASTE PROGRAM COMPLIANCE ACTIVITY (Tracking inspections of insecticide, fungicide, and rodenticide, and toxic substances) CRITERIA AND HAZARDOUS AIR POLLUTANT INVENTORY (Inventory of air pollution sources) Small Quantity Generators, between 100 kg and 1000 kg of hazardous waste/month (Resource Conservation and Recovery Act (tracking hazardous waste)) - notification Business SIC classification: SAWMILLS AND PLANING MILLS, GENERAL; MILLWORK Organizations: PAT HUGHES (CONTACT/OWNER)
Alternative names: AMERICAN MOLDING, AMERICAN MOLDING & MILLWORK, AMERICAN MOULDING AND MILWORK
A 1 CLEANERS (136 WEST WALNUT STREET in STOCKTON, CA)
STATE MASTER (California - Hazardous Waste Tracking) - HAZARDOU WASTE PROGRAM CRITERIA AND HAZARDOUS AIR POLLUTANT INVENTORY (Inventory of air pollution sources) Small Quantity Generators, between 100 kg and 1000 kg of hazardous waste/month (Resource Conservation and Recovery Act (tracking hazardous waste)) Business SIC classification: DRYCLEANING PLANTS, EXCEPT RUG CLEANING
MATT CHAPMAN TRUCKING (1731 BRISTOL AVE in STOCKTON, CA)
STATE MASTER (California - Hazardous Waste Tracking) - HAZARDOU WASTE PROGRAM TRANSPORTER (Resource Conservation and Recovery Act (tracking hazardous waste)) - notification Organizations: MATTHEW THOMAS CHAPMAN (CONTACT/OPERATOR)
EL DORADO ELEMENTARY (1540 N. LINCOLN ST. in STOCKTON, CA)
(National Center for Education Statistics) - STATE ID-6042543 Organizations: STOCKTON CITY UNIFIED (SCHOOL DISTRICT)
HOOVER ELEMENTARY (2900 KIRK AVE. in STOCKTON, CA)
(National Center for Education Statistics) - STATE ID-6042634 Organizations: STOCKTON CITY UNIFIED (SCHOOL DISTRICT)
CALIFORNIA SPRAY DRY (4221 E. MARIPOSA RD. in STOCKTON, CA)
AIR SYNTHETIC MINOR (AIRS/AFS) COMPLIANCE ACTIVITY (Tracking inspections of insecticide, fungicide, and rodenticide, and toxic substances) CRITERIA AND HAZARDOUS AIR POLLUTANT INVENTORY (Inventory of air pollution sources) TRI REPORTER (Tracking of toxic chemicals releasing facilities) Business SIC classification: PREPARED FEEDS AND FEED INGREDIENTS FOR ANIMALS AND FOWLS, EXCEPT DOGS AND CATS; ANIMAL AND MARINE FATS AND OILS
CANNON DRY CLEANING COMPANY (48 W HARDING WAY in STOCKTON, CA)
CRITERIA AND HAZARDOUS AIR POLLUTANT INVENTORY (Inventory of air pollution sources) Small Quantity Generators, between 100 kg and 1000 kg of hazardous waste/month (Resource Conservation and Recovery Act (tracking hazardous waste)) Business SIC classification: DRYCLEANING PLANTS, EXCEPT RUG CLEANING Organizations: RAY HENNEYS (CONTACT/OWNER)
Alternative names: CANNON CLEANERS
GCS TRANSPORTATION (2906 W CHRISTINA AVE in STOCKTON, CA)
HESS DUBOIS CLEANERS (348 W HARDING WAY in STOCKTON, CA)
Small Quantity Generators, between 100 kg and 1000 kg of hazardous waste/month (Resource Conservation and Recovery Act (tracking hazardous waste)) Organizations: DARRELL HUNTSMAN (CONTACT/OWNER)
KING AUTO BODY SHOP (1414 BOURBON in STOCKTON, CA)
CRITERIA AND HAZARDOUS AIR POLLUTANT INVENTORY (Inventory of air pollution sources) Small Quantity Generators, between 100 kg and 1000 kg of hazardous waste/month (Resource Conservation and Recovery Act (tracking hazardous waste)) Business SIC classification: TOP, BODY, AND UPHOLSTERY REPAIR SHOPS AND PAINT SHOPS Alternative names: BRALEYS BODY SHOP
MICHELOTTI COUNTRY BLVD SVC (1876 COUNTRY CLUB BLVD in STOCKTON, CA)
Small Quantity Generators, between 100 kg and 1000 kg of hazardous waste/month (Resource Conservation and Recovery Act (tracking hazardous waste)) - notification Organizations: DAVID V MICHELOTTI (CONTACT/OWNER)
MIRACLE MILE DRY CLEANERS (82 W CASTLE STREET in STOCKTON, CA)
CRITERIA AND HAZARDOUS AIR POLLUTANT INVENTORY (Inventory of air pollution sources) Small Quantity Generators, between 100 kg and 1000 kg of hazardous waste/month (Resource Conservation and Recovery Act (tracking hazardous waste)) Business SIC classification: DRYCLEANING PLANTS, EXCEPT RUG CLEANING
Housing units lacking complete plumbing facilities: 0.2% Housing units lacking complete kitchen facilities: 1.2%
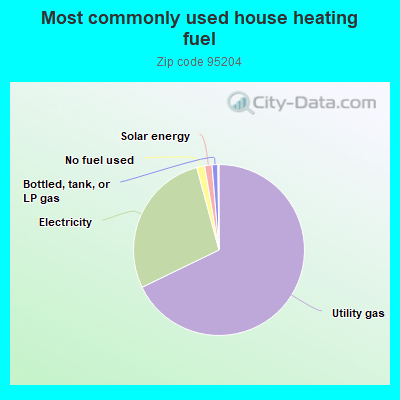
67.9%Utility gas
28.0%Electricity
1.5%No fuel used
1.4%Solar energy
1.1%Bottled, tank, or LP gas
Population in 1990: 28,860. Population change in the 1990s: +1,605 (+5.6%).
Place of birth for U.S.-born residents:
This state: 23,130
Northeast: 308
Midwest: 780
South: 718
West: 713
55% of the 95204 zip code residents lived in the same house 5 years ago. Out of people who lived in different houses, 67% lived in this county. Out of people who lived in different counties, 50% lived in California.
93% of the 95204 zip code residents lived in the same house 1 year ago. Out of people who lived in different houses, 69% moved from this county. Out of people who lived in different houses, 24% moved from different county within same state. Out of people who lived in different houses, 4% moved from different state. Out of people who lived in different houses, 3% moved from abroad.
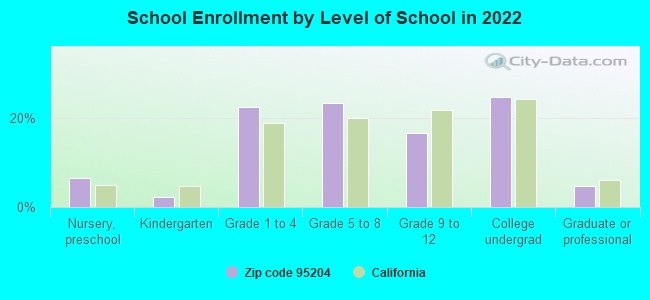
Private vs. public school enrollment:
Students in private schools in grades 1 to 8 (elementary and middle school): 204
Here:
6.1%
California:
10.5%
Students in private schools in grades 9 to 12 (high school): 80
Here:
6.6%
California:
8.5%
Students in private undergraduate colleges: 815
Here:
44.5%
California:
15.9%
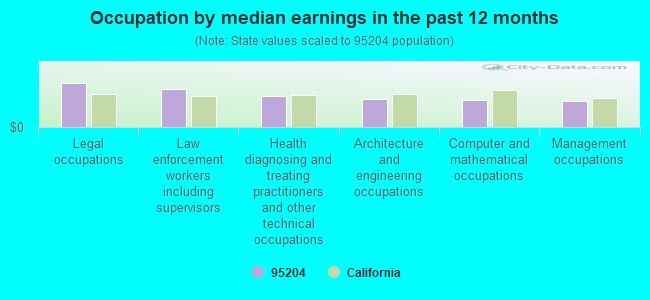
Occupation by median earnings in the past 12 months ($)
131,136Legal occupations
113,479Law enforcement workers including supervisors
93,118Health diagnosing and treating practitioners and other technical occupations
82,942Architecture and engineering occupations
80,201Computer and mathematical occupations
78,011Management occupations
Companies with federal contracts located in this zip code:
A & D RUBBER PRODUCTS CO INC (1438 BOURBON ST in STOCKTON, CA; small business) : $60,990 in 2 contractsin 2005
$36,800 with Army for Vehicular Cab, Body, and Frame Structural Components. Signed on 2005-01-20. Completion date: 2005-01-31.
$24,190, same as above.Signed on 2005-02-07. Completion date: 2005-01-31.
HOLT, WALDO (3900 RIVER DR in STOCKTON, CA; small business) : $39,962 in 4 contractsin 2005
$16,165 with Army for Environmental Studies and Assessments. Signed on 2005-05-09. Completion date: 2005-09-30.
$16,165 with U.S. Army Corps of Engineers - civil program financing only for Environmental Studies and Assessments. Signed on 2005-05-09. Completion date: 2005-09-30.
$3,816, same as above.Signed on 2005-07-14. Completion date: 2005-09-30.
$3,816 with Army for Environmental Studies and Assessments. Signed on 2005-07-14. Completion date: 2005-09-30.
Top industries in this zip code by the number of employees in 2005:
Educational Services: Colleges, Universities, and Professional Schools (over 1000 employees: 1 establishment)
Health Care and Social Assistance: General Medical and Surgical Hospitals (over 1000: 1)
Health Care and Social Assistance: Offices of Physicians (except Mental Health Specialists) (50-99: 3, 20-49: 4, 10-19: 12, 5-9: 26, 1-4: 40)
Health Care and Social Assistance: Child Day Care Services (500-999: 1, 5-9: 1, 1-4: 4)
Health Care and Social Assistance: Nursing Care Facilities (100-249: 2, 50-99: 1, 5-9: 2)
2007 - 2018 National Fire Incident Reporting System (NFIRS) incidents
According to the data from the years 2007 - 2018 the average number of fire incidents per year is 42. The highest number of fire incidents - 143 took place in 2007, and the least - 0 in 2011. The data has a dropping trend.
When looking into fire subcategories, the most incidents belonged to: Outside Fires (48.0%), and Structure Fires (32.3%).
Fire incident types reported to NFIRS in Zip Code 95204


 Nearest zip codes: 95211, 95203, 95207, 95202, 95205, 95210.
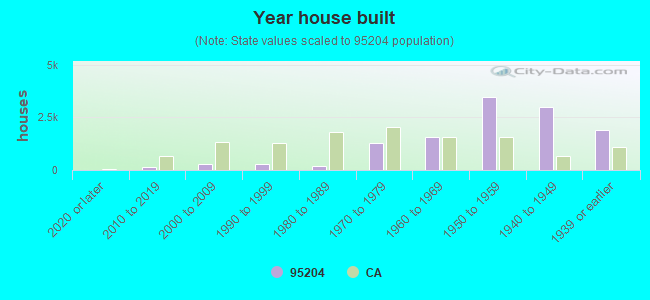


 . Federal Facility
 According to the data from the years 2007 - 2018 the average number of fire incidents per year is 42. The highest number of fire incidents - 143 took place in 2007, and the least - 0 in 2011. The data has a dropping trend.
 When looking into fire subcategories, the most incidents belonged to: Outside Fires (48.0%), and Structure Fires (32.3%).