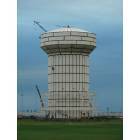
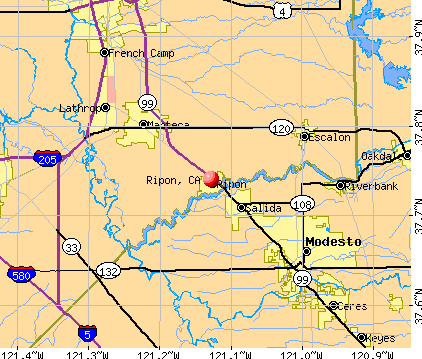
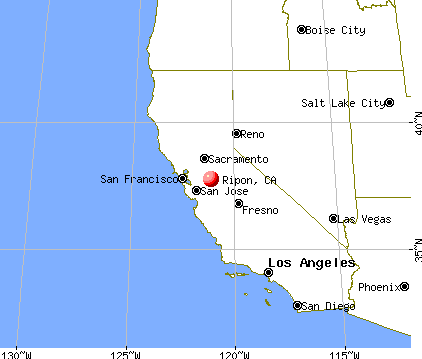
Ripon, California

Submit your own pictures of this city and show them to the world
- OSM Map
- General Map
- Google Map
- MSN Map
Population change since 2000: +60.4%
| Males: 8,302 | |
| Females: 7,970 |
| Median resident age: | 39.9 years |
| California median age: | 37.9 years |
Zip codes: 95366.
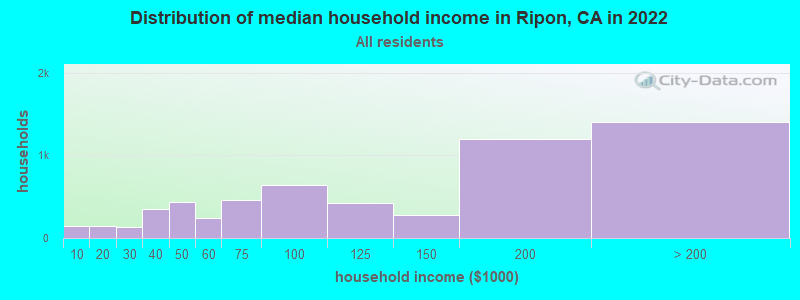
| Ripon: | $120,074 |
| CA: | $91,551 |
Estimated per capita income in 2022: $51,742 (it was $20,978 in 2000)
Ripon city income, earnings, and wages data
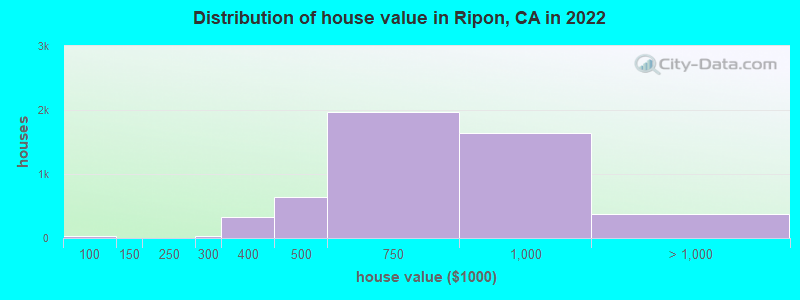
Estimated median house or condo value in 2022: $728,201 (it was $166,500 in 2000)
| Ripon: | $728,201 |
| CA: | $715,900 |
Mean prices in 2022: all housing units: $555,132; detached houses: $579,147; townhouses or other attached units: $413,977; in 2-unit structures: $846,717; in 3-to-4-unit structures: $323,925; in 5-or-more-unit structures: $223,694; mobile homes: $155,998; occupied boats, rvs, vans, etc.: $9,512
Median gross rent in 2022: $1,801.
(4.4% for White Non-Hispanic residents, 10.4% for Hispanic or Latino residents, 66.7% for Native Hawaiian and other Pacific Islander residents, 6.5% for other race residents, 1.7% for two or more races residents)
Detailed information about poverty and poor residents in Ripon, CA

Compare current foreclosures near Ripon, CA:
| Photo | Address | Area | Beds / Baths | Price | Details |
|---|---|---|---|---|---|

|
#1
Lannis Ct
Ripon, CA 95366
|
1,324 sq. feet
|
2 baths 4 beds |
show details | |

|
#2
W Colony Rd
Ripon, CA 95366
|
2,881 sq. feet
|
3 baths 5 beds |
show details | |

|
#3
Brooks Ln
Ripon, CA 95366
|
3,262 sq. feet
|
3 baths 4 beds |
show details | |

|
#4
Orange Ave
Ripon, CA 95366
|
1,125 sq. feet
|
1 baths 2 beds |
show details | |

|
#5
W Colony Rd
Ripon, CA 95366
|
2,881 sq. feet
|
2 baths 4 beds |
show details | |

|
#6
N Walnut Ave
Ripon, CA 95366
|
594 sq. feet
|
1 baths 1 beds |
show details | |

|
#7
Cheri Ct
Ripon, CA 95366
|
1,199 sq. feet
|
2 baths 3 beds |
show details | |

|
#8
S Parallel Ave # 7
Ripon, CA 95366
|
- sq. feet
|
- baths - beds |
show details | |

|
#9
Dixie Ln
Ripon, CA 95366
|
- sq. feet
|
- baths - beds |
show details | |

|
#10
W Main St # 9
Ripon, CA 95366
|
- sq. feet
|
- baths - beds |
show details |
| Photo | Address | Area | Beds / Baths | Price | Details |
|---|---|---|---|---|---|

|
#11
N Ripon Rd # 803
Ripon, CA 95366
|
- sq. feet
|
- baths - beds |
show details | |

|
#12
Aldwina Ln
Manteca, CA 95336
|
1,852 sq. feet
|
2 baths 4 beds |
show details | |

|
#13
Sacchetti Cir
Stockton, CA 95206
|
1,269 sq. feet
|
2 baths 3 beds |
show details | |

|
#14
Brookfield Ave
Lathrop, CA 95330
|
- sq. feet
|
3 baths 4 beds |
show details | |

|
#15
Liselle Ln
Modesto, CA 95358
|
1,469 sq. feet
|
3 baths 4 beds |
show details | |

|
#16
E Taylor St
Stockton, CA 95205
|
960 sq. feet
|
2 baths 3 beds |
show details | |

|
#17
Green Plz
Lathrop, CA 95330
|
3,297 sq. feet
|
2 baths 4 beds |
show details | |

|
#18
S Hunter St
Stockton, CA 95206
|
1,149 sq. feet
|
2 baths 4 beds |
show details | |

|
#19
Ustick Rd
Modesto, CA 95358
|
1,136 sq. feet
|
2 baths 3 beds |
show details | |

|
#20
Miller Ave
Modesto, CA 95354
|
990 sq. feet
|
1 baths 2 beds |
show details |
| Photo | Address | Area | Beds / Baths | Price | Details |
|---|---|---|---|---|---|

|
#21
Lambuth Ave
Oakdale, CA 95361
|
1,580 sq. feet
|
2 baths 3 beds |
show details | |

|
#22
Hinkley Ave
Oakdale, CA 95361
|
1,318 sq. feet
|
1 baths 2 beds |
show details | |

|
#23
Fern Dell Ln
Manteca, CA 95336
|
1,343 sq. feet
|
2 baths 4 beds |
show details | |

|
#24
Empire Ave
Modesto, CA 95354
|
768 sq. feet
|
1 baths 2 beds |
show details | |

|
#25
Plumas Dr.
Lathrop, CA 95330
|
1,829 sq. feet
|
2 baths 3 beds |
show details | |

|
#26
Cambria Dr
Stockton, CA 95205
|
1,019 sq. feet
|
1 baths 3 beds |
show details | |

|
#27
Attika St
Ceres, CA 95307
|
2,924 sq. feet
|
2 baths 4 beds |
show details | |

|
#28
Boston Ave
Stockton, CA 95206
|
1,294 sq. feet
|
2 baths 4 beds |
show details | |

|
#29
Acacia Ave
Manteca, CA 95336
|
826 sq. feet
|
1 baths 2 beds |
show details | |

|
#30
Section Ave
Stockton, CA 95215
|
1,038 sq. feet
|
1 baths 3 beds |
show details |
| Photo | Address | Area | Beds / Baths | Price | Details |
|---|---|---|---|---|---|

|
#31
Date St
Stockton, CA 95215
|
1,050 sq. feet
|
1 baths 3 beds |
show details | |

|
#32
Emerson Ave
Modesto, CA 95350
|
889 sq. feet
|
1 baths 3 beds |
show details | |

|
#33
Fallen Oak Dr
Modesto, CA 95355
|
3,074 sq. feet
|
3 baths 5 beds |
show details | |

|
#34
Laguna Dr
Tracy, CA 95376
|
1,577 sq. feet
|
2 baths 3 beds |
show details | |

|
#35
S Zephyr Dr
Tracy, CA 95304
|
3,590 sq. feet
|
3 baths 5 beds |
show details | |

|
#36
Treana Ct
Tracy, CA 95377
|
2,126 sq. feet
|
2 baths 4 beds |
show details | |

|
#37
Monterey Ct
Tracy, CA 95376
|
1,880 sq. feet
|
2 baths 3 beds |
show details | |

|
#38
E Washington St
Stockton, CA 95215
|
1,064 sq. feet
|
2 baths 3 beds |
show details | |

|
#39
Doubloon St
Riverbank, CA 95367
|
3,060 sq. feet
|
2 baths 5 beds |
show details | |

|
#40
Mulberry Ct
Tracy, CA 95377
|
2,720 sq. feet
|
3 baths 5 beds |
show details |
| Photo | Address | Area | Beds / Baths | Price | Details |
|---|---|---|---|---|---|

|
#41
J St
Lathrop, CA 95330
|
1,230 sq. feet
|
2 baths 3 beds |
show details | |

|
#42
Prairie Dunes Dr
Lathrop, CA 95330
|
1,714 sq. feet
|
3 baths 3 beds |
show details | |

|
#43
Golden Gate Dr
Modesto, CA 95350
|
1,530 sq. feet
|
2 baths 3 beds |
show details | |

|
#44
5th St
Modesto, CA 95351
|
1,200 sq. feet
|
1 baths 3 beds |
show details | |

|
#45
Pleasant Ave
Ceres, CA 95307
|
1,484 sq. feet
|
2 baths 4 beds |
show details | |

|
#46
Chantilly Ct
Lathrop, CA 95330
|
2,139 sq. feet
|
3 baths 4 beds |
show details | |

|
#47
Ronald Ct
Modesto, CA 95350
|
1,607 sq. feet
|
3 baths 3 beds |
show details | |

|
#48
Waddell Way
Modesto, CA 95357
|
1,210 sq. feet
|
2 baths 4 beds |
show details | |

|
#49
Modoc Ave
Modesto, CA 95358
|
912 sq. feet
|
1 baths 3 beds |
show details | |

|
Check over 1 million property listings on Foreclosure.com!
|
browse all offers | |||


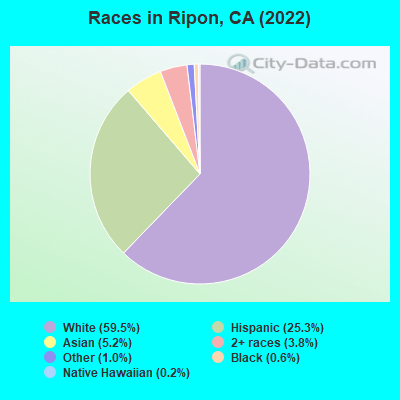
- 9,73959.5%White alone
- 4,14625.3%Hispanic
- 8585.2%Asian alone
- 6223.8%Two or more races
- 1701.0%Other race alone
- 1000.6%Black alone
- 290.2%Native Hawaiian and Other
Pacific Islander alone
According to our research of California and other state lists, there were 11 registered sex offenders living in Ripon, California as of April 27, 2024.
The ratio of all residents to sex offenders in Ripon is 1,397 to 1.
The ratio of registered sex offenders to all residents in this city is lower than the state average.
Type |
2009 |
2010 |
2011 |
2012 |
2013 |
2014 |
2015 |
2016 |
2017 |
2018 |
2019 |
2020 |
2022 |
|---|---|---|---|---|---|---|---|---|---|---|---|---|---|
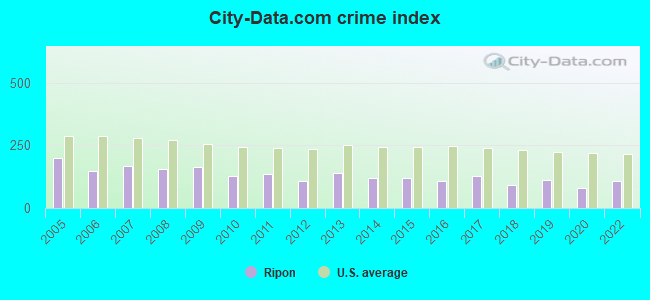
| Murders (per 100,000) | 0 (0.0) | 0 (0.0) | 0 (0.0) | 0 (0.0) | 0 (0.0) | 0 (0.0) | 0 (0.0) | 0 (0.0) | 0 (0.0) | 0 (0.0) | 0 (0.0) | 0 (0.0) | 0 (0.0) |
| Rapes (per 100,000) | 4 (26.6) | 3 (21.0) | 2 (13.8) | 1 (6.8) | 1 (6.8) | 3 (20.2) | 4 (26.4) | 2 (13.1) | 7 (44.7) | 3 (18.9) | 6 (37.3) | 2 (12.0) | 6 (35.7) |
| Robberies (per 100,000) | 7 (46.5) | 4 (28.0) | 5 (34.6) | 1 (6.8) | 5 (33.8) | 5 (33.6) | 4 (26.4) | 9 (58.8) | 4 (25.5) | 5 (31.5) | 4 (24.8) | 2 (12.0) | 6 (35.7) |
| Assaults (per 100,000) | 21 (139.6) | 15 (104.9) | 9 (62.2) | 4 (27.3) | 9 (60.8) | 10 (67.3) | 8 (52.9) | 1 (6.5) | 2 (12.8) | 2 (12.6) | 3 (18.6) | 4 (24.1) | 13 (77.4) |
| Burglaries (per 100,000) | 38 (252.7) | 33 (230.8) | 44 (304.2) | 49 (334.2) | 66 (445.9) | 31 (208.6) | 25 (165.3) | 22 (143.6) | 28 (178.8) | 27 (170.0) | 23 (142.8) | 21 (126.4) | 14 (83.4) |
| Thefts (per 100,000) | 233 (1,549) | 198 (1,385) | 246 (1,701) | 229 (1,562) | 253 (1,709) | 205 (1,380) | 186 (1,230) | 225 (1,469) | 241 (1,539) | 184 (1,159) | 206 (1,279) | 162 (975.0) | 167 (994.7) |
| Auto thefts (per 100,000) | 41 (272.6) | 20 (139.9) | 19 (131.4) | 19 (129.6) | 23 (155.4) | 22 (148.1) | 33 (218.2) | 20 (130.6) | 17 (108.6) | 14 (88.2) | 19 (118.0) | 32 (192.6) | 15 (89.3) |
| Arson (per 100,000) | 2 (13.3) | 3 (21.0) | 1 (6.9) | 2 (13.6) | 1 (6.8) | 1 (6.7) | 0 (0.0) | 0 (0.0) | 0 (0.0) | 2 (12.6) | 0 (0.0) | 1 (6.0) | 1 (6.0) |
| City-Data.com crime index | 164.6 | 128.9 | 133.7 | 109.2 | 139.7 | 121.3 | 117.9 | 108.6 | 128.7 | 92.4 | 111.6 | 81.3 | 107.6 |
The City-Data.com crime index weighs serious crimes and violent crimes more heavily. Higher means more crime, U.S. average is 246.1. It adjusts for the number of visitors and daily workers commuting into cities.
Crime rate in Ripon detailed stats: murders, rapes, robberies, assaults, burglaries, thefts, arson
Full-time law enforcement employees in 2021, including police officers: 33 (24 officers - 23 male; 1 female).
| Officers per 1,000 residents here: | 1.41 |
| California average: | 2.30 |
 Recent articles from our blog. Our writers, many of them Ph.D. graduates or candidates, create easy-to-read articles on a wide variety of topics.


Latest news from Ripon, CA collected exclusively by city-data.com from local newspapers, TV, and radio stations
Ancestries: Dutch (12.4%), German (8.9%), Irish (6.4%), Italian (6.3%), American (4.4%), English (4.3%).
Current Local Time: PST time zone
Elevation: 62 feet
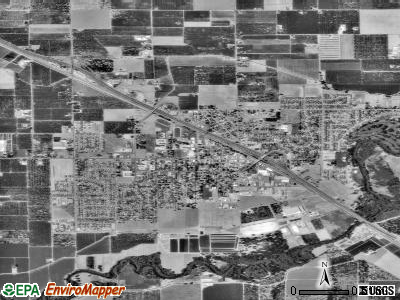
Land area: 4.10 square miles.
Population density: 3,967 people per square mile (average).
1,283 residents are foreign born (3.9% Latin America, 2.9% Asia, 1.0% Europe).
| This city: | 7.8% |
| California: | 26.5% |
Median real estate property taxes paid for housing units with mortgages in 2022: $4,984 (0.7%)
Median real estate property taxes paid for housing units with no mortgage in 2022: $4,394 (0.7%)
Nearest city with pop. 50,000+: Modesto, CA  (9.1 miles , pop. 188,856).
Nearest city with pop. 200,000+: Stockton, CA (18.8 miles , pop. 243,771).
Nearest city with pop. 1,000,000+: Los Angeles, CA (296.0 miles , pop. 3,694,820).
Nearest cities:
), ), ), ), Latitude: 37.74 N, Longitude: 121.13 W
Daytime population change due to commuting: -1,876 (-11.5%)
Workers who live and work in this city: 2,141 (26.7%)
Area code: 209
Ripon, California accommodation & food services, waste management - Economy and Business Data
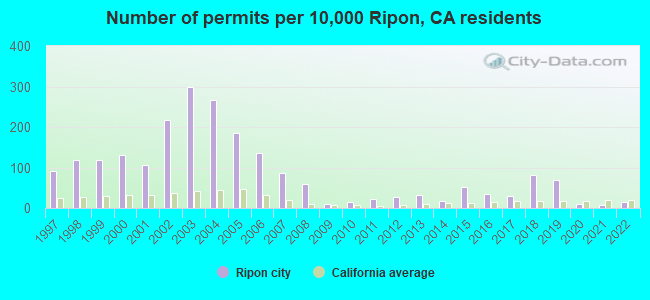
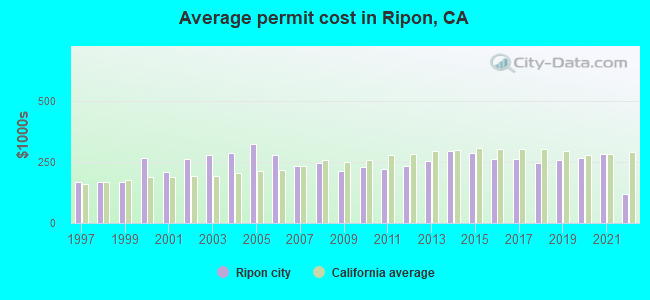
Single-family new house construction building permits:
- 2022: 14 buildings, average cost: $118,100
- 2021: 7 buildings, average cost: $284,700
- 2020: 10 buildings, average cost: $265,900
- 2019: 70 buildings, average cost: $259,700
- 2018: 82 buildings, average cost: $245,700
- 2017: 29 buildings, average cost: $263,300
- 2016: 36 buildings, average cost: $263,700
- 2015: 54 buildings, average cost: $287,000
- 2014: 17 buildings, average cost: $295,800
- 2013: 31 buildings, average cost: $255,100
- 2012: 26 buildings, average cost: $236,200
- 2011: 21 buildings, average cost: $221,000
- 2010: 15 buildings, average cost: $230,700
- 2009: 11 buildings, average cost: $213,300
- 2008: 61 buildings, average cost: $248,100
- 2007: 88 buildings, average cost: $236,400
- 2006: 138 buildings, average cost: $278,700
- 2005: 189 buildings, average cost: $323,600
- 2004: 270 buildings, average cost: $288,700
- 2003: 302 buildings, average cost: $280,900
- 2002: 220 buildings, average cost: $262,700
- 2001: 109 buildings, average cost: $208,100
- 2000: 134 buildings, average cost: $266,200
- 1999: 121 buildings, average cost: $169,200
- 1998: 120 buildings, average cost: $169,200
- 1997: 92 buildings, average cost: $169,400
| Here: | 6.8% |
| California: | 5.1% |
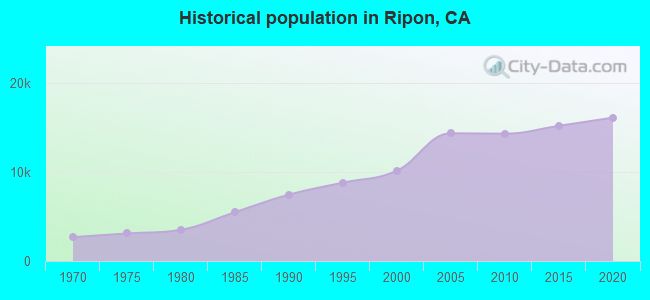
Population change in the 1990s: +2,339 (+30.0%).
- Educational services (11.4%)
- Health care (9.4%)
- Construction (9.4%)
- Accommodation & food services (6.0%)
- Public administration (4.7%)
- Finance & insurance (4.3%)
- Professional, scientific, technical services (3.6%)
- Construction (14.2%)
- Educational services (5.9%)
- Public administration (5.3%)
- Professional, scientific, technical services (5.2%)
- Agriculture, forestry, fishing & hunting (3.9%)
- Food & beverage stores (3.7%)
- Health care (3.4%)
- Educational services (18.0%)
- Health care (16.6%)
- Accommodation & food services (9.6%)
- Finance & insurance (6.0%)
- Personal & laundry services (4.8%)
- Public administration (4.1%)
- Social assistance (4.0%)
- Preschool, kindergarten, elementary, and middle school teachers (4.9%)
- Other sales and related occupations, including supervisors (4.2%)
- Other production occupations, including supervisors (3.9%)
- Secretaries and administrative assistants (3.9%)
- Other management occupations, except farmers and farm managers (3.8%)
- Other office and administrative support workers, including supervisors (3.7%)
- Driver/sales workers and truck drivers (3.4%)
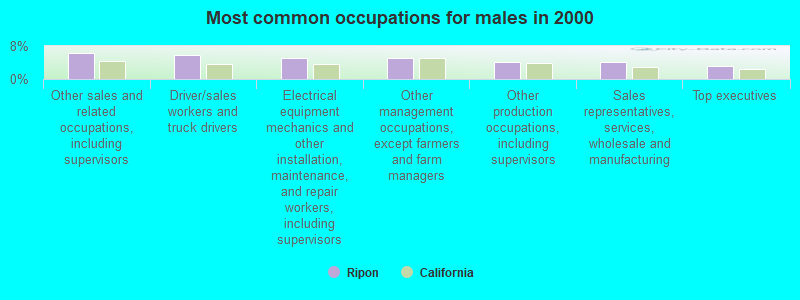
- Other sales and related occupations, including supervisors (6.3%)
- Driver/sales workers and truck drivers (5.9%)
- Electrical equipment mechanics and other installation, maintenance, and repair workers, including supervisors (5.1%)
- Other management occupations, except farmers and farm managers (5.0%)
- Other production occupations, including supervisors (4.2%)
- Sales representatives, services, wholesale and manufacturing (4.0%)
- Top executives (3.1%)
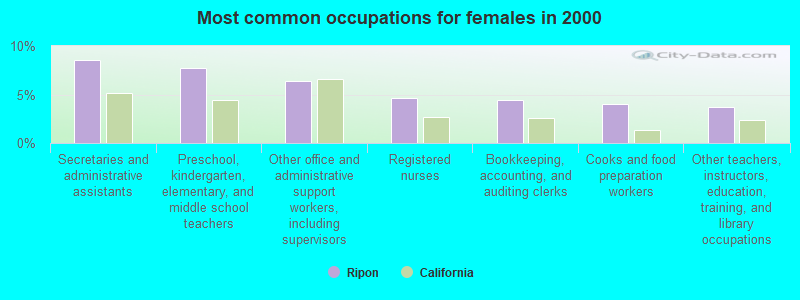
- Secretaries and administrative assistants (8.5%)
- Preschool, kindergarten, elementary, and middle school teachers (7.8%)
- Other office and administrative support workers, including supervisors (6.4%)
- Registered nurses (4.6%)
- Bookkeeping, accounting, and auditing clerks (4.5%)
- Cooks and food preparation workers (4.0%)
- Other teachers, instructors, education, training, and library occupations (3.7%)
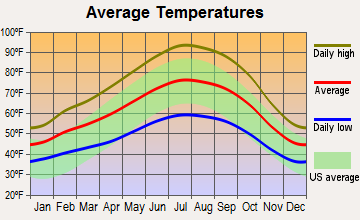
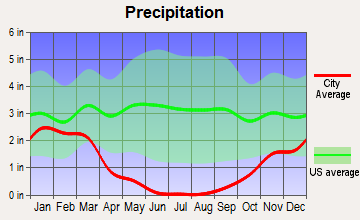
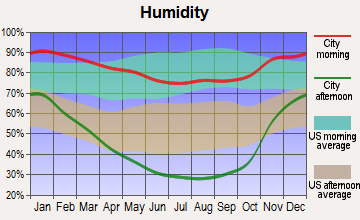
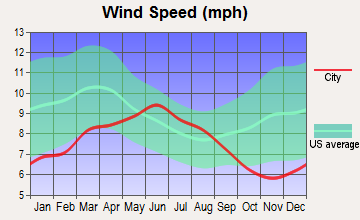
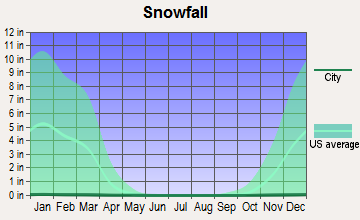
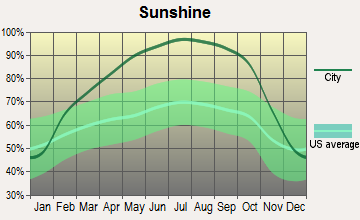
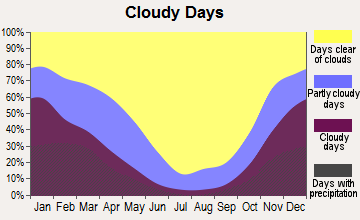
Average climate in Ripon, California
Based on data reported by over 4,000 weather stations
|
|

(lower is better)
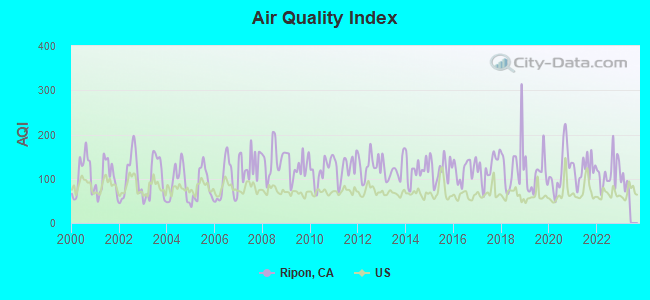
Air Quality Index (AQI) level in 2022 was 114. This is significantly worse than average.
| City: | 114 |
| U.S.: | 73 |
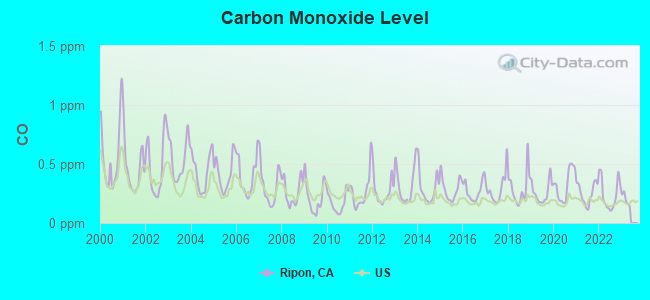
Carbon Monoxide (CO) [ppm] level in 2022 was 0.244. This is about average. Closest monitor was 9.9 miles away from the city center.
| City: | 0.244 |
| U.S.: | 0.251 |
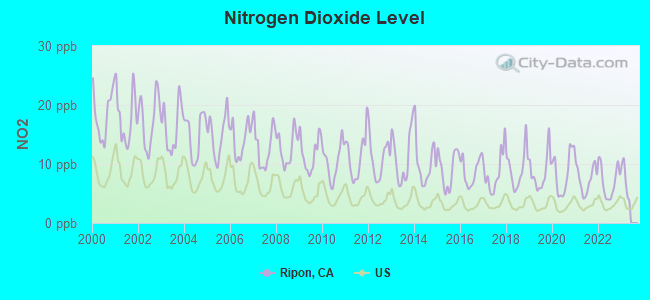
Nitrogen Dioxide (NO2) [ppb] level in 2022 was 7.04. This is worse than average. Closest monitor was 9.9 miles away from the city center.
| City: | 7.04 |
| U.S.: | 5.11 |
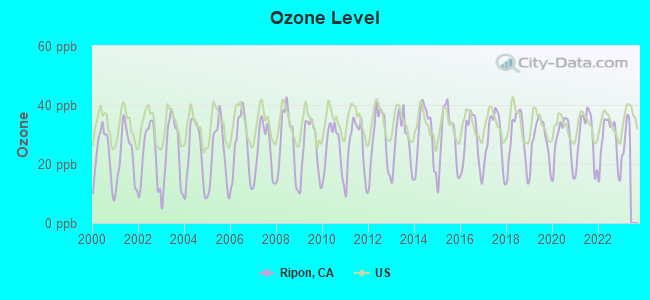
Ozone [ppb] level in 2022 was 27.6. This is better than average. Closest monitor was 0.3 miles away from the city center.
| City: | 27.6 |
| U.S.: | 33.3 |
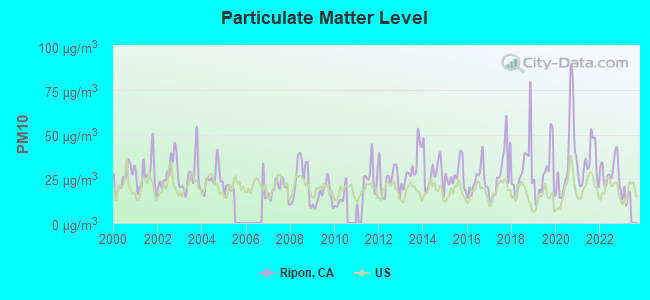
Particulate Matter (PM10) [µg/m3] level in 2022 was 29.0. This is significantly worse than average. Closest monitor was 7.5 miles away from the city center.
| City: | 29.0 |
| U.S.: | 19.2 |
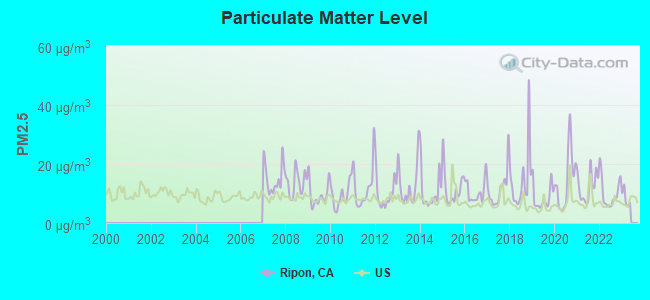
Particulate Matter (PM2.5) [µg/m3] level in 2022 was 10.2. This is worse than average. Closest monitor was 7.5 miles away from the city center.
| City: | 10.2 |
| U.S.: | 8.1 |
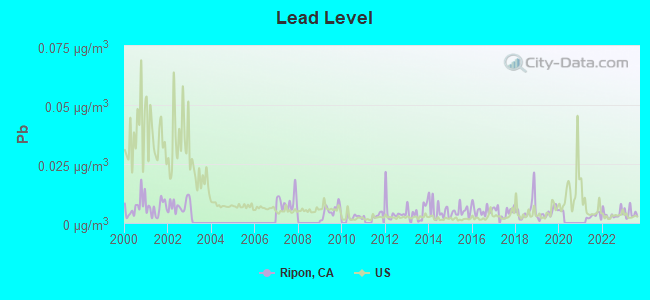
Lead (Pb) [µg/m3] level in 2023 was 0.00414. This is significantly better than average. Closest monitor was 9.6 miles away from the city center.
| City: | 0.00414 |
| U.S.: | 0.00931 |
Earthquake activity:
Ripon-area historical earthquake activity is significantly above California state average. It is 8065% greater than the overall U.S. average.On 4/18/1906 at 13:12:21, a magnitude 7.9 (7.9 UK, Class: Major, Intensity: VIII - XII) earthquake occurred 103.8 miles away from Ripon center, causing $524,000,000 total damage
On 10/18/1989 at 00:04:15, a magnitude 7.1 (6.5 MB, 7.1 MS, 6.9 MW, 7.0 ML) earthquake occurred 56.1 miles away from Ripon center, causing 62 deaths (62 shaking deaths) and 3757 injuries, causing $1,305,032,704 total damage
On 7/21/1952 at 11:52:14, a magnitude 7.7 (7.7 UK) earthquake occurred 223.5 miles away from the city center, causing $50,000,000 total damage
On 11/4/1927 at 13:51:53, a magnitude 7.5 (7.5 UK) earthquake occurred 195.5 miles away from the city center
On 12/21/1932 at 06:10:09, a magnitude 7.2 (7.2 UK) earthquake occurred 174.0 miles away from Ripon center
On 10/3/1915 at 06:52:48, a magnitude 7.6 (7.6 UK) earthquake occurred 272.6 miles away from Ripon center
Magnitude types: body-wave magnitude (MB), local magnitude (ML), surface-wave magnitude (MS), moment magnitude (MW)
Natural disasters:
The number of natural disasters in San Joaquin County (20) is greater than the US average (15).Major Disasters (Presidential) Declared: 15
Emergencies Declared: 3
Causes of natural disasters: Floods: 13, Storms: 7, Mudslides: 4, Landslides: 3, Winter Storms: 3, Drought: 1, Earthquake: 1, Freeze: 1, Heavy Rain: 1, Hurricane: 1, Tornado: 1, Wind: 1, Other: 2 (Note: some incidents may be assigned to more than one category).
Hospitals and medical centers in Ripon:
Other hospitals and medical centers near Ripon:
- GENTIVA HEALTH SERVICES - CERTIFIED (Home Health Center, about 4 miles away; MODESTO, CA)
- AMEDISYS HOME HEALTH (Home Health Center, about 6 miles away; STOCKTON, CA)
- DOCTORS HOSPITAL OF MANTECA Acute Care Hospitals (about 6 miles away; MANTECA, CA)
- ENGLISH OAKS CONV AND REHAB HOSPITAL (Nursing Home, about 6 miles away; MODESTO, CA)
- ST JUDE CARE CENTER (Nursing Home, about 7 miles away; MANTECA, CA)
- RCCA - WAWONA (Hospital, about 7 miles away; MANTECA, CA)
- ST DOMINIC'S HOSPITAL (Hospital, about 7 miles away; MANTECA, CA)
Amtrak stations near Ripon:
- 13 miles: MODESTO (1700 HELD DRIVE) . Services: ticket office, fully wheelchair accessible, enclosed waiting area, public restrooms, public payphones, vending machines, free short-term parking, free long-term parking, call for car rental service, call for taxi service, public transit connection.
- 17 miles: STOCKTON, SAN JOAQUIN ST. (STOCKTON, 735 S. SAN JOAQUIN ST.) . Services: ticket office, fully wheelchair accessible, enclosed waiting area, public restrooms, public payphones, vending machines, free short-term parking, call for car rental service, call for taxi service, public transit connection.
- 17 miles: TRACY (725 W. CLOVER RD.) - Bus Station . Services: fully wheelchair accessible, public restrooms, public payphones, snack bar, free short-term parking, call for taxi service.
Colleges/universities with over 2000 students nearest to Ripon:
- Modesto Junior College (about 9 miles; Modesto, CA; Full-time enrollment: 10,635)
- University of the Pacific (about 20 miles; Stockton, CA; FT enrollment: 4,999)
- San Joaquin Delta College (about 21 miles; Stockton, CA; FT enrollment: 12,167)
- California State University-Stanislaus (about 22 miles; Turlock, CA; FT enrollment: 7,054)
- Las Positas College (about 38 miles; Livermore, CA; FT enrollment: 5,112)
- Los Medanos College (about 45 miles; Pittsburg, CA; FT enrollment: 5,289)
- Merced College (about 46 miles; Merced, CA; FT enrollment: 6,973)
Public high schools in Ripon:
- RIPON HIGH (Students: 670, Location: 301 N. ACACIA AVE., Grades: 9-12)
- CALIFORNIA CONNECTIONS ACADEMY @ RIPON (Location: 580 N. WILMA AVE., STE. G, Grades: KG-12, Charter school)
- HARVEST HIGH (Location: 729 W. MAIN ST., Grades: 9-12)
Private high school in Ripon:
Public elementary/middle schools in Ripon:
- RIPONA ELEMENTARY (Students: 356, Location: 415 E. OREGON ST., Grades: KG-8)
- WESTON ELEMENTARY (Students: 356, Location: 1660 STANLEY DR., Grades: KG-8)
- COLONY OAK ELEMENTARY (Students: 347, Location: 22241 S. MURPHY RD., Grades: KG-8)
- RIPON ELEMENTARY (Students: 329, Location: 509 W. MAIN ST., Grades: KG-8)
- PARK VIEW ELEMENTARY (Students: 175, Location: 751 CINDY DR., Grades: KG-8)
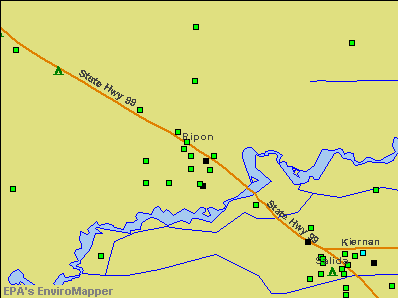
Points of interest:
Notable locations in Ripon: Ripon Consolidated Fire District Station 1 Headquarters (A), Swiss Hall (B), Ripon City Hall (C), Ripon Branch Stockton-San Joaquin County Public Library (D), Harry Knoff Auditorium (E), Clarence Smit Museum (F), Bethany Home (G). Display/hide their locations on the map
Churches in Ripon include: Almond Valley Christian Reformed Church (A), Heartland Community Church (B), Calvary Reformed Church (C), Church of Christ (D), First Baptist Church (E), First Christian Reformed Church (F), First Congregational Church (G), Free Methodist Church (H), Grace Brethren Church (I). Display/hide their locations on the map
Parks in Ripon include: Acacia Park (1), Mavis Stouffer Park (2), Wilma Avenue Park (3). Display/hide their locations on the map
Tourist attraction: California State - Parks & Recreation- Caswell State Park (2800 South Austin Road).
Hotel: BLU Lite Motel (258 East 99 Frontage Road).
Birthplace of: Kim Johnston Ulrich - Actor.
Drinking water stations with addresses in Ripon and their reported violations in the past:
GICO VALLEY FARMS (Population served: 25, Groundwater):Past health violations:ST PATRICK CATHOLIC CHURCH WTR SYS (Population served: 25, Groundwater):Past monitoring violations:
- MCL, Monthly (TCR) - In MAY-2012, Contaminant: Coliform. Follow-up actions: St Public Notif requested (MAY-01-2012)
- 3 routine major monitoring violations
Past health violations:RIPON VFW POST 1051 WATER SYSTEM (Population served: 25, Groundwater):
- MCL, Acute (TCR) - In DEC-2010, Contaminant: Coliform. Follow-up actions: St Public Notif requested (DEC-01-2010)
- MCL, Acute (TCR) - In DEC-2010, Contaminant: Coliform. Follow-up actions: St Public Notif requested (DEC-01-2010)
- MCL, Monthly (TCR) - In MAY-2006, Contaminant: Coliform. Follow-up actions: St Public Notif requested (MAY-01-2006)
- MCL, Monthly (TCR) - In MAY-2006, Contaminant: Coliform. Follow-up actions: St Public Notif requested (MAY-01-2006)
- MCL, Monthly (TCR) - In APR-2006, Contaminant: Coliform. Follow-up actions: St Public Notif received (APR-01-2006)
- MCL, Monthly (TCR) - In APR-2006, Contaminant: Coliform. Follow-up actions: St Public Notif received (APR-01-2006)
Past monitoring violations:
- 2 routine major monitoring violations
Drinking water stations with addresses in Ripon that have no violations reported:
- SPRING CREEK COUNTRY CLUB (Population served: 150, Primary Water Source Type: Groundwater)
- WEST KINGDOM HALL OF JEHOVAH WITNES (Population served: 100, Primary Water Source Type: Groundwater)
- OLDE TOWNE (Population served: 35, Primary Water Source Type: Groundwater)
| This city: | 2.9 people |
| California: | 2.9 people |
| This city: | 78.2% |
| Whole state: | 68.7% |
| This city: | 4.4% |
| Whole state: | 7.2% |
Likely homosexual households (counted as self-reported same-sex unmarried-partner households)
- Lesbian couples: 0.2% of all households
- Gay men: 0.2% of all households
111 people in nursing homes in 2000
Banks with branches in Ripon (2011 data):
- Bank of the West: Ripon Branch at 411 West Main Street, branch established on 1966/04/18. Info updated 2009/11/16: Bank assets: $62,408.3 mil, Deposits: $43,995.2 mil, headquarters in San Francisco, CA, positive income, 647 total offices, Holding Company: Bnp Paribas
- Oak Valley Community Bank: Ripon Branch at 150 N Wilma Avenue #2, branch established on 2005/12/27. Info updated 2006/11/03: Bank assets: $612.4 mil, Deposits: $536.2 mil, headquarters in Oakdale, CA, positive income, Commercial Lending Specialization, 14 total offices, Holding Company: Oak Valley Bancorp
- Bank of Stockton: Ripon Branch at 234 West Main Street, branch established on 1934/12/24. Info updated 2010/04/08: Bank assets: $2,047.8 mil, Deposits: $1,722.4 mil, headquarters in Stockton, CA, positive income, Commercial Lending Specialization, 16 total offices, Holding Company: 1867 Western Financial Corporation
For population 15 years and over in Ripon:
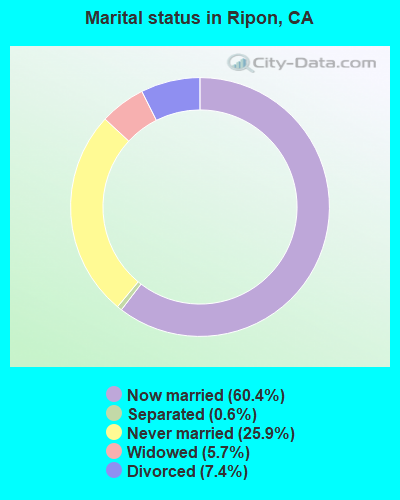
- Never married: 25.9%
- Now married: 60.4%
- Separated: 0.6%
- Widowed: 5.7%
- Divorced: 7.4%
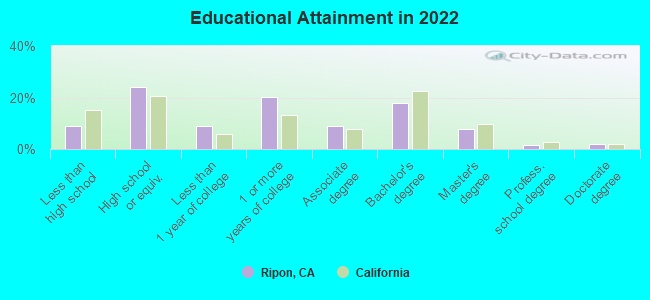
For population 25 years and over in Ripon:
- High school or higher: 90.3%
- Bachelor's degree or higher: 25.1%
- Graduate or professional degree: 9.6%
- Unemployed: 6.0%
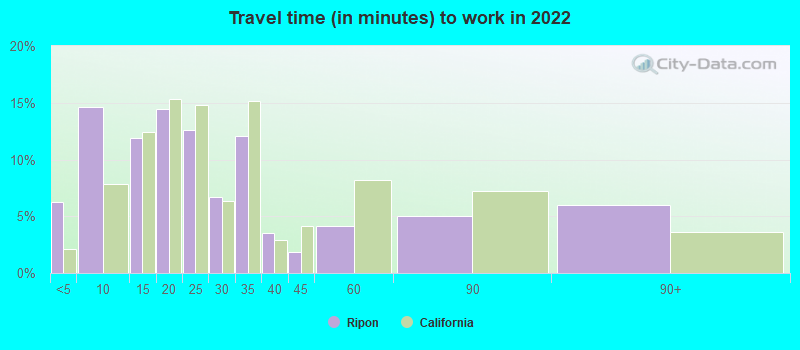
- Mean travel time to work (commute): 23.5 minutes
| Here: | 10.9 |
| California average: | 15.5 |
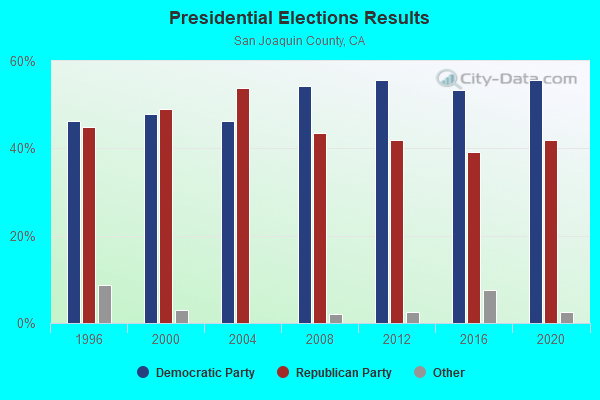
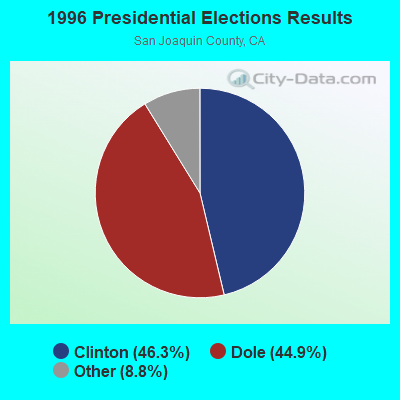
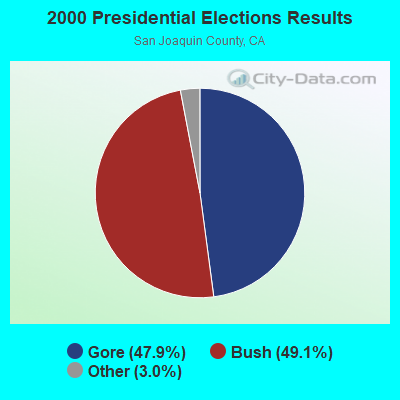
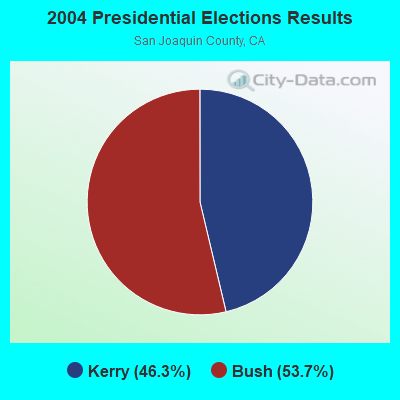
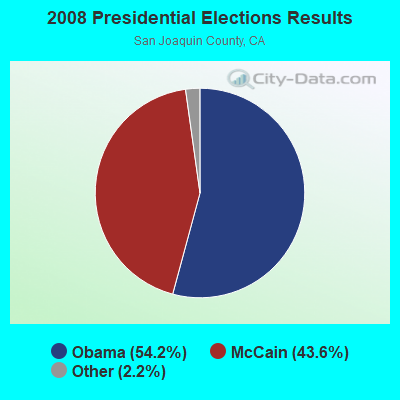
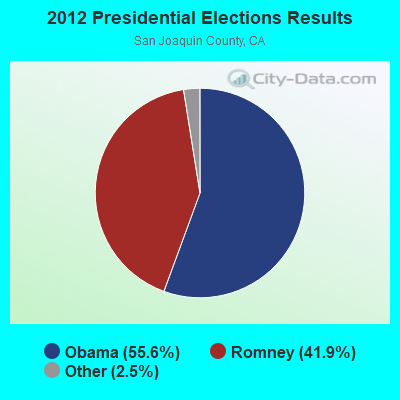
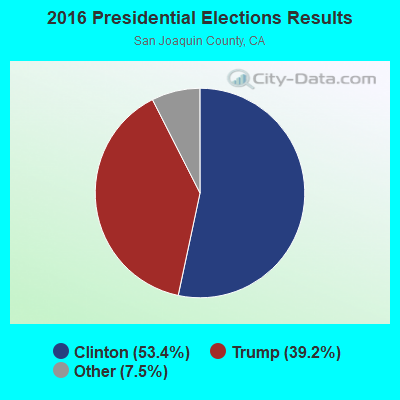

Graphs represent county-level data. Detailed 2008 Election Results
Religion statistics for Ripon, CA (based on San Joaquin County data)
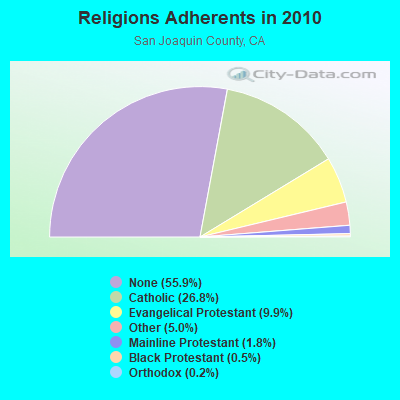
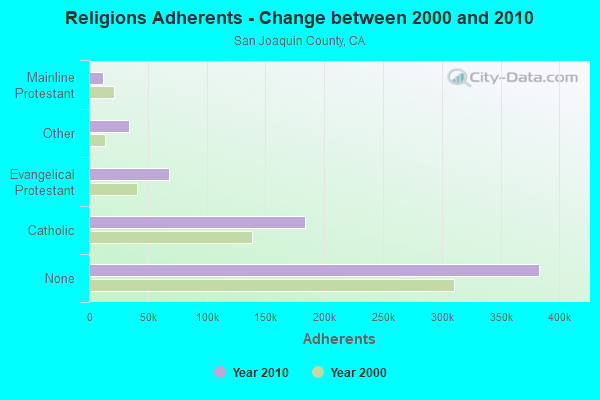
| Religion | Adherents | Congregations |
|---|---|---|
| Catholic | 183,692 | 18 |
| Evangelical Protestant | 67,940 | 304 |
| Other | 33,949 | 68 |
| Mainline Protestant | 12,067 | 43 |
| Black Protestant | 3,251 | 17 |
| Orthodox | 1,368 | 2 |
| None | 383,039 | - |
Food Environment Statistics:
| This county: | 2.34 / 10,000 pop. |
| California: | 2.14 / 10,000 pop. |
| San Joaquin County: | 0.04 / 10,000 pop. |
| California: | 0.04 / 10,000 pop. |
| San Joaquin County: | 0.67 / 10,000 pop. |
| California: | 0.62 / 10,000 pop. |
| Here: | 2.02 / 10,000 pop. |
| State: | 1.49 / 10,000 pop. |
| San Joaquin County: | 5.23 / 10,000 pop. |
| State: | 7.42 / 10,000 pop. |
| This county: | 7.1% |
| California: | 7.3% |
| Here: | 29.2% |
| California: | 21.3% |
| San Joaquin County: | 16.5% |
| State: | 17.9% |
Health and Nutrition:
| This city: | 48.6% |
| California: | 49.4% |
| Ripon: | 46.2% |
| California: | 48.0% |
| This city: | 28.9 |
| State: | 28.1 |
| This city: | 22.1% |
| California: | 20.2% |
| This city: | 10.7% |
| California: | 11.2% |
| Ripon: | 6.8 |
| California: | 6.8 |
| Ripon: | 35.1% |
| State: | 31.5% |
| This city: | 55.8% |
| California: | 56.4% |
| Ripon: | 79.2% |
| California: | 80.9% |
More about Health and Nutrition of Ripon, CA Residents
| Local government employment and payroll (March 2022) | |||||
| Function | Full-time employees | Monthly full-time payroll | Average yearly full-time wage | Part-time employees | Monthly part-time payroll |
|---|---|---|---|---|---|
| Police Protection - Officers | 24 | $218,309 | $109,155 | 0 | $0 |
| Financial Administration | 15 | $130,304 | $104,243 | 4 | $8,394 |
| Police - Other | 11 | $66,807 | $72,880 | 4 | $2,860 |
| Sewerage | 8 | $42,027 | $63,041 | 2 | $4,497 |
| Solid Waste Management | 7 | $42,027 | $72,046 | 1 | $4,497 |
| Parks and Recreation | 7 | $42,027 | $72,046 | 2 | $4,497 |
| Water Supply | 7 | $42,027 | $72,046 | 2 | $4,497 |
| Other Government Administration | 0 | $0 | 4 | $1,200 | |
| Totals for Government | 79 | $583,529 | $88,637 | 19 | $30,443 |
Ripon government finances - Expenditure in 2017 (per resident):
- Construction - Housing and Community Development: $1,366,000 ($83.95)
Regular Highways: $1,202,000 ($73.87)
Central Staff Services: $238,000 ($14.63)
Financial Administration: $185,000 ($11.37)
- Current Operations - Police Protection: $5,844,000 ($359.14)
Parks and Recreation: $1,882,000 ($115.66)
Solid Waste Management: $1,545,000 ($94.95)
Water Utilities: $1,501,000 ($92.24)
Regular Highways: $1,072,000 ($65.88)
Sewerage: $1,064,000 ($65.39)
Financial Administration: $602,000 ($37.00)
Housing and Community Development: $206,000 ($12.66)
General - Other: $173,000 ($10.63)
Central Staff Services: $164,000 ($10.08)
Transit Utilities: $102,000 ($6.27)
Libraries: $83,000 ($5.10)
- General - Interest on Debt: $64,000 ($3.93)
- Other Capital Outlay - Parks and Recreation: $105,000 ($6.45)
Protective Inspection and Regulation - Other: $75,000 ($4.61)
Regular Highways: $67,000 ($4.12)
- Total Salaries and Wages: $6,000 ($0.37)
- Water Utilities - Interest on Debt: $330,000 ($20.28)
Ripon government finances - Revenue in 2017 (per resident):
- Charges - Solid Waste Management: $1,672,000 ($102.75)
Sewerage: $1,473,000 ($90.52)
Other: $1,299,000 ($79.83)
Parks and Recreation: $891,000 ($54.76)
Regular Highways: $252,000 ($15.49)
- Federal Intergovernmental - Other: $406,000 ($24.95)
Housing and Community Development: $30,000 ($1.84)
- Local Intergovernmental - Transit Utilities: $4,000 ($0.25)
- Miscellaneous - Special Assessments: $1,183,000 ($72.70)
General Revenue - Other: $1,067,000 ($65.57)
Interest Earnings: $312,000 ($19.17)
Rents: $173,000 ($10.63)
Fines and Forfeits: $158,000 ($9.71)
Donations From Private Sources: $35,000 ($2.15)
- Revenue - Water Utilities: $2,792,000 ($171.58)
Transit Utilities: $38,000 ($2.34)
- State Intergovernmental - Highways: $283,000 ($17.39)
Other: $171,000 ($10.51)
General Local Government Support: $15,000 ($0.92)
Sewerage: $1,000 ($0.06)
- Tax - Property: $3,364,000 ($206.74)
General Sales and Gross Receipts: $3,317,000 ($203.85)
Public Utilities Sales: $441,000 ($27.10)
Other License: $325,000 ($19.97)
Occupation and Business License - Other: $162,000 ($9.96)
Other Selective Sales: $144,000 ($8.85)
Documentary and Stock Transfer: $86,000 ($5.29)
Ripon government finances - Debt in 2017 (per resident):
- Long Term Debt - Beginning Outstanding - Unspecified Public Purpose: $10,375,000 ($637.60)
Outstanding Unspecified Public Purpose: $9,795,000 ($601.95)
Retired Unspecified Public Purpose: $580,000 ($35.64)
Ripon government finances - Cash and Securities in 2017 (per resident):
- Bond Funds - Cash and Securities: $10,002,000 ($614.68)
- Other Funds - Cash and Securities: $18,879,000 ($1160.21)
6.18% of this county's 2021 resident taxpayers lived in other counties in 2020 ($75,687 average adjusted gross income)
| Here: | 6.18% |
| California average: | 5.19% |
0.01% of residents moved from foreign countries ($71 average AGI)
San Joaquin County: 0.01% California average: 0.03%
Top counties from which taxpayers relocated into this county between 2020 and 2021:
| from Alameda County, CA | |
| from Santa Clara County, CA | |
| from Stanislaus County, CA |
5.64% of this county's 2020 resident taxpayers moved to other counties in 2021 ($66,959 average adjusted gross income)
| Here: | 5.64% |
| California average: | 6.14% |
0.01% of residents moved to foreign countries ($82 average AGI)
San Joaquin County: 0.01% California average: 0.02%
Top counties to which taxpayers relocated from this county between 2020 and 2021:
| to Stanislaus County, CA | |
| to Sacramento County, CA | |
| to Alameda County, CA |
| Businesses in Ripon, CA | ||||
| Name | Count | Name | Count | |
|---|---|---|---|---|
| Ace Hardware | 1 | La Quinta | 1 | |
| Arby's | 1 | Little Caesars Pizza | 1 | |
| Baskin-Robbins | 1 | McDonald's | 1 | |
| CVS | 1 | SONIC Drive-In | 1 | |
| Carl\s Jr. | 1 | Starbucks | 1 | |
| Dennys | 1 | Subway | 2 | |
| FedEx | 3 | Taco Bell | 2 | |
| Jack In The Box | 1 | UPS | 2 | |
| Jones New York | 1 | Walgreens | 1 | |
| Kroger | 1 | |||
Strongest AM radio stations in Ripon:
- KCBC (770 AM; 50 kW; RIVERBANK, CA; Owner: KIERTRON, INC.)
- KFIV (1360 AM; 4 kW; MODESTO, CA; Owner: CAPSTAR TX LIMITED PARTNERSHIP)
- KHTK (1140 AM; 50 kW; SACRAMENTO, CA; Owner: INFINITY RADIO SUBSIDIARY OPERATIONS INC.)
- KGO (810 AM; 50 kW; SAN FRANCISCO, CA; Owner: KGO-AM RADIO, INC.)
- KLOK (1170 AM; 50 kW; SAN JOSE, CA; Owner: ENTRAVISION HOLDINGS, LLC)
- KNBR (680 AM; 50 kW; SAN FRANCISCO, CA; Owner: KNBR LICO, INC.)
- KSTN (1420 AM; 5 kW; STOCKTON, CA; Owner: SAN JOAQUIN BROADCASTING CO.)
- KTCT (1050 AM; 50 kW; SAN MATEO, CA; Owner: SUSQUEHANNA RADIO CORP.)
- KFAX (1100 AM; 50 kW; SAN FRANCISCO, CA; Owner: GOLDEN GATE BROADCASTING CO, INC.)
- KSTE (650 AM; 25 kW; RANCHO CORDOVA, CA; Owner: AMFM RADIO LICENSES, L.L.C.)
- KTRB (860 AM; 50 kW; MODESTO, CA; Owner: PAPPAS RADIO OF CALIFORNIA, A CALIFORNIA LIMITED PARTNERSHIP)
- KESP (970 AM; 1 kW; MODESTO, CA; Owner: CITADEL BROADCASTING COMPANY)
- KCBS (740 AM; 50 kW; SAN FRANCISCO, CA; Owner: INFINITY BROADCASTING OPERATIONS, INC.)
Strongest FM radio stations in Ripon:
- KOSO (93.1 FM; PATTERSON, CA; Owner: CAPSTAR TX LIMITED PARTNERSHIP)
- KMRQ (96.7 FM; MANTECA, CA; Owner: CAPSTAR TX LIMITED PARTNERSHIP)
- K238AC (95.5 FM; SALIDA, CA; Owner: FAMILY STATIONS, INC.)
- KJOY (99.3 FM; STOCKTON, CA; Owner: CITADEL BROADCASTING COMPANY)
- KUOP (91.3 FM; STOCKTON, CA; Owner: UNIVERSITY OF THE PACIFIC)
- KEJC (93.9 FM; MODESTO, CA; Owner: MODESTO COMMUNICATIONS CORPORATION)
- KKSF-FM1 (103.7 FM; PLEASANTON, ETC., CA; Owner: AMFM RADIO LICENSES, L.L.C.)
- KFRC-FM3 (99.7 FM; WALNUT CREEK, CA; Owner: INFINITY KFRC-FM, INC.)
- KZBR-FM1 (95.7 FM; WALNUT CREEK, CA; Owner: BONNEVILLE HOLDING COMPANY)
- KBLX-FM2 (102.9 FM; PLEASANTON, CA; Owner: ICBC BROADCAST HOLDINGS -CA, INC.)
- KSOL-FM3 (98.9 FM; PLEASANTON, CA; Owner: TMS LICENSE CALIFORNIA, INC)
- KISQ-FM3 (98.1 FM; CONCORD, CA; Owner: AMFM RADIO LICENSES, L.L.C.)
- KMEL-FM1 (106.1 FM; CONCORD, CA; Owner: AMFM RADIO LICENSES, L.L.C.)
- KHOP (95.1 FM; OAKDALE, CA; Owner: CITADEL BROADCASTING COMPANY)
- KBAA (94.5 FM; GILROY, CA; Owner: INFINITY RADIO OPERATIONS INC.)
- KATM (103.3 FM; MODESTO, CA; Owner: CITADEL BROADCASTING COMPANY)
- KSQL (99.1 FM; SANTA CRUZ, CA; Owner: TMS LICENSE CALIFORNIA, INC)
- KKUP (91.5 FM; CUPERTINO, CA; Owner: ASSURANCE SCIENCES FOUNDATION)
- KBRG (100.3 FM; SAN JOSE, CA; Owner: ENTRAVISION HOLDINGS, LLC)
- KHTN (104.7 FM; LOS BANOS, CA; Owner: BUCKLEY COMMUNICATIONS, INC.)
TV broadcast stations around Ripon:
- KBSV (Channel 23; CERES, CA; Owner: BET-NAHRAIN, INC.)
- KOVR (Channel 13; STOCKTON, CA; Owner: SCI - SACRAMENTO LICENSEE, LLC)
- KXTV (Channel 10; SACRAMENTO, CA; Owner: KXTV, INC.)
- KUVS (Channel 19; MODESTO, CA; Owner: KUVS LICENSE PARTNERSHIP, G.P.)
- KCRA-TV (Channel 3; SACRAMENTO, CA; Owner: KCRA HEARST-ARGYLE TELEVISION, INC.)
- KSPX (Channel 29; SACRAMENTO, CA; Owner: PAXSON SACRAMENTO LICENSE, INC.)
- KQCA (Channel 58; STOCKTON, CA; Owner: KCRA HEARST-ARGYLE TELEVISION, INC.)
- KTXL (Channel 40; SACRAMENTO, CA; Owner: CHANNEL 40, INC.)
- KMAX-TV (Channel 31; SACRAMENTO, CA; Owner: UPN STATIONS GROUP INC.)
- KVIE (Channel 6; SACRAMENTO, CA; Owner: KVIE, INC.)
- KACA-LP (Channel 61; MODESTO, CA; Owner: WORD OF GOD FELLOWSHIP, INC.)
- KMMK-LP (Channel 14; SACRAMENTO, CA; Owner: CABALLERO TELEVISION TEXAS, L.L.C.)
- KDTS-CA (Channel 52; STOCKTON, CA; Owner: WORD OF GOD FELLOWSHIP, INC.)
- KMMW-LP (Channel 47; STOCKTON, CA; Owner: CABALLERO TELEVISION TEXAS, L.L.C.)
- National Bridge Inventory (NBI) Statistics
- 20Number of bridges
- 203ft / 62.4mTotal length
- 732,186Total average daily traffic
- 99,651Total average daily truck traffic
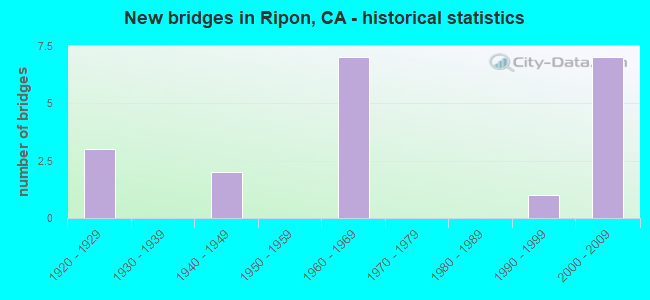
- New bridges - historical statistics
- 31920-1929
- 21940-1949
- 71960-1969
- 11990-1999
- 72000-2009
FCC Registered Commercial Land Mobile Towers: 8 (See the full list of FCC Registered Commercial Land Mobile Towers in Ripon, CA)
FCC Registered Private Land Mobile Towers: 1 (See the full list of FCC Registered Private Land Mobile Towers)
FCC Registered Broadcast Land Mobile Towers: 17 (See the full list of FCC Registered Broadcast Land Mobile Towers)
FCC Registered Microwave Towers: 29 (See the full list of FCC Registered Microwave Towers in this town)
FCC Registered Paging Towers: 1 (See the full list of FCC Registered Paging Towers)
FCC Registered Amateur Radio Licenses: 99 (See the full list of FCC Registered Amateur Radio Licenses in Ripon)
FAA Registered Aircraft: 17 (See the full list of FAA Registered Aircraft in Ripon)
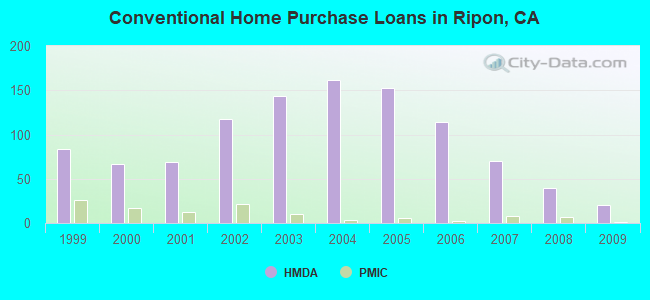
| Home Mortgage Disclosure Act Aggregated Statistics For Year 2009 (Based on 1 full and 1 partial tracts) | ||||||||||||
| A) FHA, FSA/RHS & VA Home Purchase Loans | B) Conventional Home Purchase Loans | C) Refinancings | D) Home Improvement Loans | F) Non-occupant Loans on < 5 Family Dwellings (A B C & D) | G) Loans On Manufactured Home Dwelling (A B C & D) | |||||||
|---|---|---|---|---|---|---|---|---|---|---|---|---|
| Number | Average Value | Number | Average Value | Number | Average Value | Number | Average Value | Number | Average Value | Number | Average Value | |
| LOANS ORIGINATED | 24 | $216,663 | 20 | $239,617 | 95 | $217,956 | 4 | $180,170 | 10 | $160,203 | 2 | $153,325 |
| APPLICATIONS APPROVED, NOT ACCEPTED | 2 | $199,945 | 4 | $175,480 | 8 | $190,599 | 0 | $0 | 2 | $131,150 | 0 | $0 |
| APPLICATIONS DENIED | 6 | $215,355 | 3 | $238,687 | 43 | $243,467 | 1 | $149,020 | 1 | $276,150 | 1 | $161,760 |
| APPLICATIONS WITHDRAWN | 2 | $220,335 | 3 | $343,383 | 25 | $201,091 | 1 | $39,700 | 2 | $107,650 | 1 | $144,890 |
| FILES CLOSED FOR INCOMPLETENESS | 0 | $0 | 0 | $0 | 4 | $301,672 | 0 | $0 | 0 | $0 | 0 | $0 |
Detailed HMDA statistics for the following Tracts: 0050.01 , 0050.04
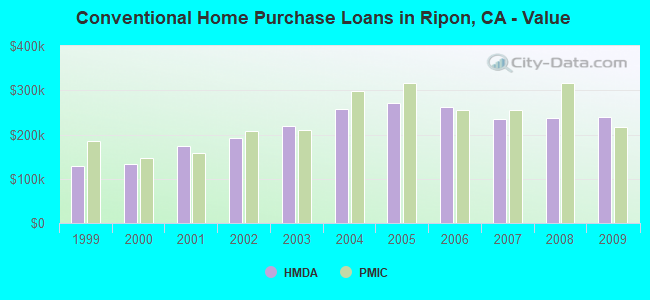
| Private Mortgage Insurance Companies Aggregated Statistics For Year 2009 (Based on 1 full and 1 partial tracts) | ||||
| A) Conventional Home Purchase Loans | B) Refinancings | |||
|---|---|---|---|---|
| Number | Average Value | Number | Average Value | |
| LOANS ORIGINATED | 1 | $217,350 | 1 | $457,880 |
| APPLICATIONS APPROVED, NOT ACCEPTED | 1 | $594,450 | 1 | $118,100 |
| APPLICATIONS DENIED | 0 | $0 | 0 | $0 |
| APPLICATIONS WITHDRAWN | 1 | $339,400 | 0 | $0 |
| FILES CLOSED FOR INCOMPLETENESS | 0 | $0 | 1 | $201,460 |
Detailed PMIC statistics for the following Tracts: 0050.01 , 0050.04
2006 - 2018 National Fire Incident Reporting System (NFIRS) incidents
- Fire incident types reported to NFIRS in Ripon, CA
- 28348.5%Outside Fires
- 13423.0%Structure Fires
- 12421.3%Mobile Property/Vehicle Fires
- 427.2%Other
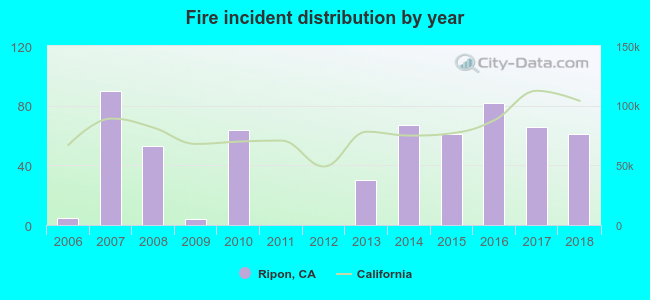 Based on the data from the years 2006 - 2018 the average number of fire incidents per year is 45. The highest number of fire incidents - 90 took place in 2007, and the least - 0 in 2011. The data has an increasing trend.
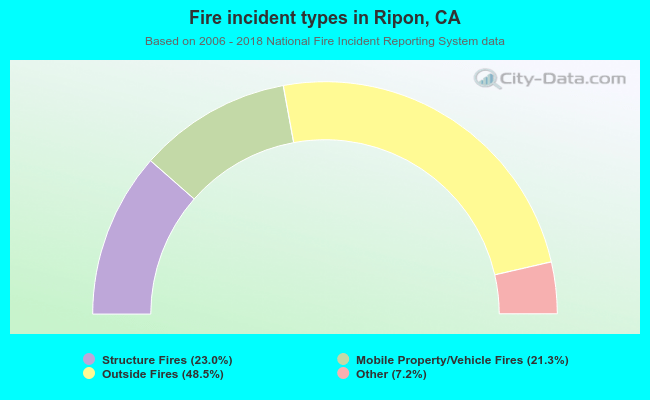 When looking into fire subcategories, the most reports belonged to: Outside Fires (48.5%), and Structure Fires (23.0%).
| Most common first names in Ripon, CA among deceased individuals | ||
| Name | Count | Lived (average) |
|---|---|---|
| John | 87 | 76.8 years |
| William | 53 | 73.7 years |
| Mary | 49 | 80.4 years |
| Henry | 39 | 80.6 years |
| James | 37 | 72.7 years |
| Robert | 27 | 72.0 years |
| George | 23 | 79.9 years |
| Anna | 23 | 85.9 years |
| Joseph | 23 | 76.1 years |
| Joe | 21 | 76.5 years |
| Most common last names in Ripon, CA among deceased individuals | ||
| Last name | Count | Lived (average) |
|---|---|---|
| Smith | 18 | 72.5 years |
| Johnson | 15 | 79.0 years |
| Dejong | 13 | 79.5 years |
| Jones | 12 | 82.6 years |
| Douma | 12 | 83.5 years |
| Viss | 11 | 75.4 years |
| Mohler | 10 | 73.8 years |
| Martin | 10 | 86.6 years |
| Eggink | 8 | 73.5 years |
| Brown | 8 | 76.0 years |
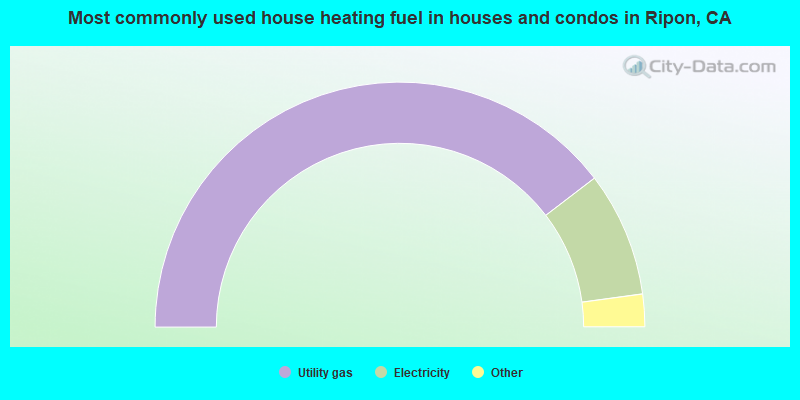
- 79.2%Utility gas
- 16.5%Electricity
- 2.8%Solar energy
- 0.9%Wood
- 0.4%Bottled, tank, or LP gas
- 0.2%No fuel used
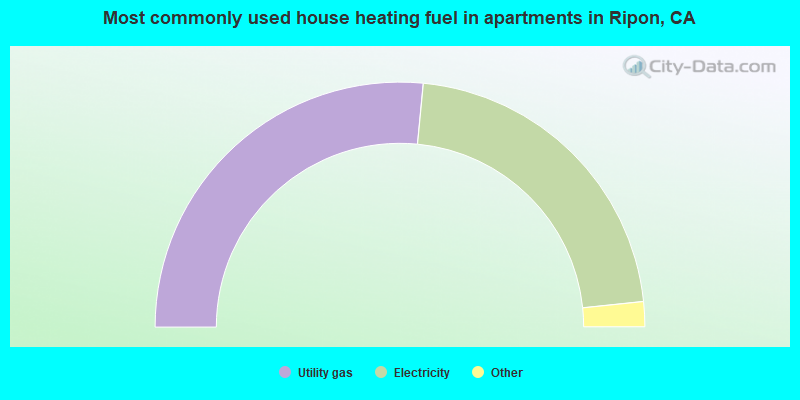
- 53.1%Utility gas
- 43.7%Electricity
- 2.4%Bottled, tank, or LP gas
- 0.8%No fuel used
Ripon compared to California state average:
- Unemployed percentage below state average.
- Black race population percentage significantly below state average.
- Median age above state average.
- Foreign-born population percentage below state average.
- Renting percentage below state average.
- Length of stay since moving in above state average.
- Number of rooms per house above state average.
- House age below state average.
Ripon on our top lists:
- #45 on the list of "Top 101 cities with the most local government spending on highway construction per resident (population 10,000+)"
- #77 (95366) on the list of "Top 101 zip codes with the largest percentage of Dutch first ancestries (pop 5,000+)"
- #12 on the list of "Top 101 counties with the highest lead air pollution readings in 2012 (µg/m3)"
- #16 on the list of "Top 101 counties with the lowest lead air pollution readings in 2012 (µg/m3)"
- #31 on the list of "Top 101 counties with the highest Particulate Matter (PM2.5) Annual air pollution readings in 2012 (µg/m3)"
- #38 on the list of "Top 101 counties with the highest ground withdrawal of fresh water for public supply"
- #46 on the list of "Top 101 counties with the lowest Ozone (1-hour) air pollution readings in 2012 (ppm)"

|
|
Total of 48 patent applications in 2008-2024.