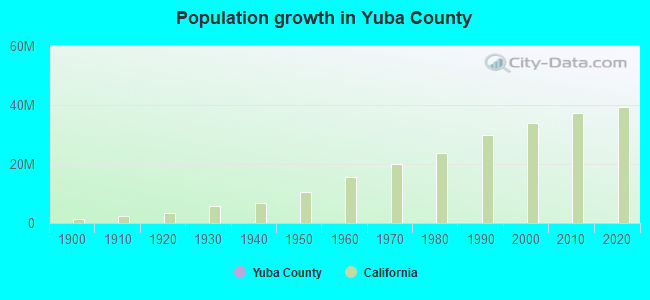
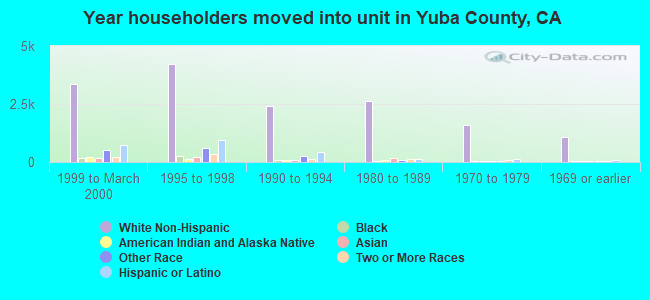
Yuba County, California (CA)
County owner-occupied free and clear houses and condos in 2010: 3,700
County owner-occupied houses and condos in 2000: 11,088
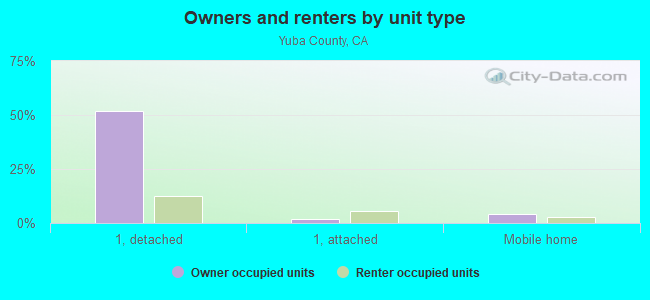
Renter-occupied apartments: 9,839 (it was 9,447 in 2000)
| % of renters here: | 46% |
| State: | 44% |
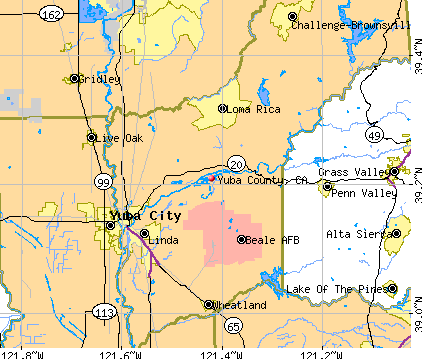
Land area: 631 sq. mi.
Water area: 13.0 sq. mi.
Population density: 134 people per square mile (average).
Industries providing employment: Educational, health and social services (21.7%), Retail trade (12.2%).
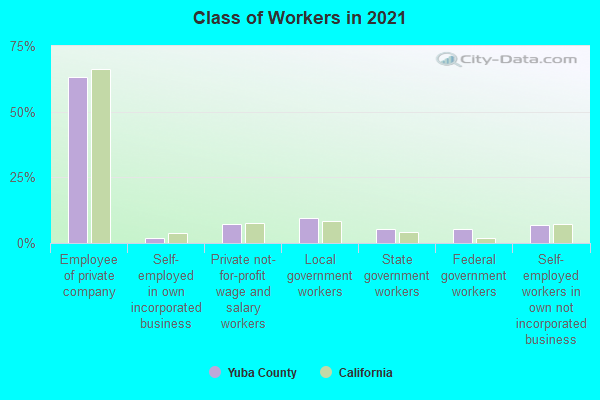
Type of workers:
- Private wage or salary: 69%
- Government: 24%
- Self-employed, not incorporated: 7%
- Unpaid family work: 0%
- OSM Map
- General Map
- Google Map
- MSN Map

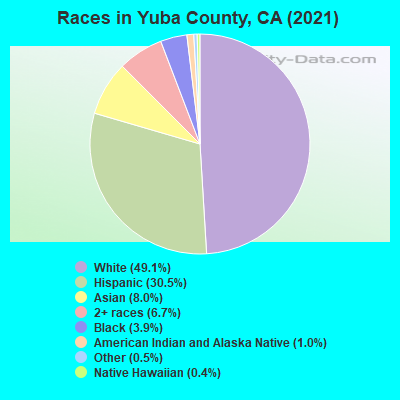
- 41,29049.0%White Non-Hispanic Alone
- 26,26531.2%Hispanic or Latino
- 7,4078.8%Asian alone
- 4,8965.8%Two or more races
- 3,2403.8%Black Non-Hispanic Alone
- 6210.7%Some other race alone
- 5910.7%American Indian and Alaska Native alone
| Median resident age: | 34.5 years |
| California median age: | 37.9 years |
| Males: 42,289 | |
| Females: 42,021 |
| Yuba County: | 2.0 people |
| California: | 3 people |
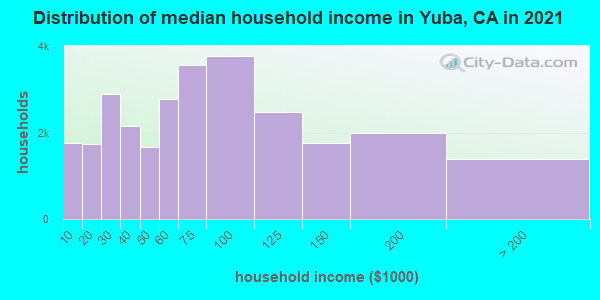
Estimated median household income in 2022: $65,052 ($30,460 in 1999)
| This county: | $65,052 |
| California: | $91,551 |
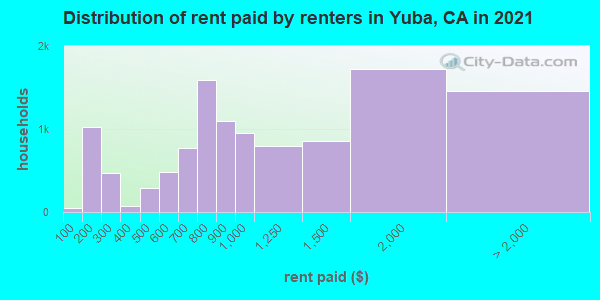
Median contract rent in 2022 for apartments: $915 (lower quartile is $711, upper quartile is $1,241)
| This county: | $915 |
| State: | $1719 |
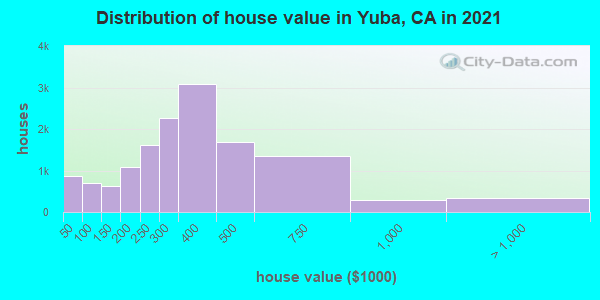
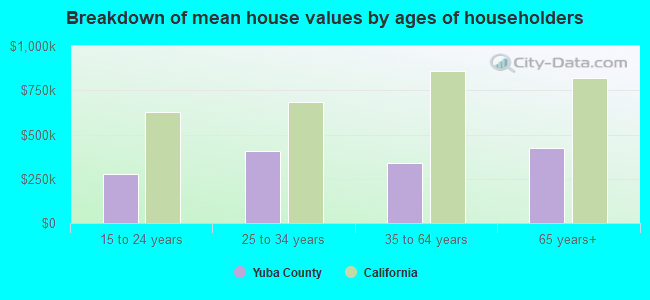
Estimated median house or condo value in 2022: $430,400 (it was $89,500 in 2000)
| Yuba: | $430,400 |
| California: | $715,900 |
Median monthly housing costs for homes and condos with a mortgage: $2,014
Median monthly housing costs for units without a mortgage: $589
Institutionalized population: 529
Crime in 2020 (reported by the sheriff's office or county police, not the county total):
- Murders: 2
- Rapes: 17
- Robberies: 40
- Assaults: 197
- Burglaries: 247
- Thefts: 608
- Auto thefts: 25
Crime in 2019 (reported by the sheriff's office or county police, not the county total):
- Murders: 5
- Rapes: 21
- Robberies: 37
- Assaults: 141
- Burglaries: 316
- Thefts: 520
- Auto thefts: 11
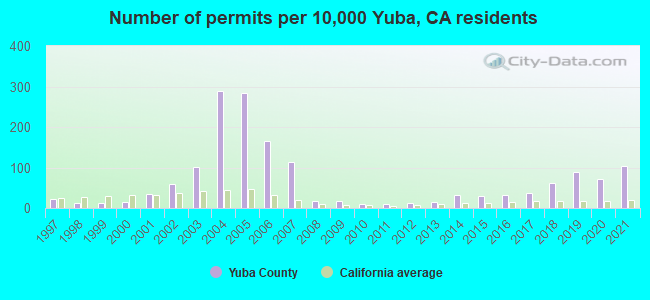
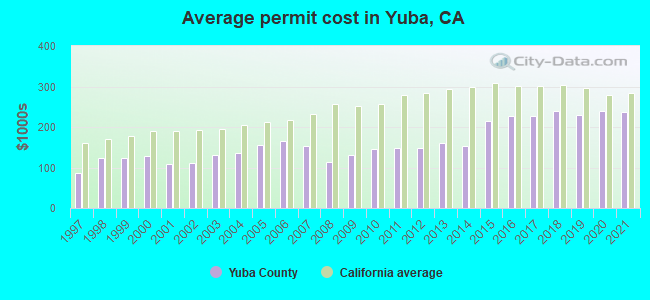
Single-family new house construction building permits:
- 2022: 467 buildings, average cost: $244,700
- 2021: 619 buildings, average cost: $237,100
- 2020: 432 buildings, average cost: $240,200
- 2019: 538 buildings, average cost: $228,800
- 2018: 373 buildings, average cost: $238,500
- 2017: 225 buildings, average cost: $228,300
- 2016: 187 buildings, average cost: $227,000
- 2015: 172 buildings, average cost: $216,000
- 2014: 201 buildings, average cost: $154,400
- 2013: 99 buildings, average cost: $160,300
- 2012: 78 buildings, average cost: $148,100
- 2011: 57 buildings, average cost: $146,900
- 2010: 62 buildings, average cost: $145,600
- 2009: 110 buildings, average cost: $132,200
- 2008: 101 buildings, average cost: $113,300
- 2007: 683 buildings, average cost: $152,400
- 2006: 993 buildings, average cost: $165,300
- 2005: 1703 buildings, average cost: $155,600
- 2004: 1746 buildings, average cost: $137,000
- 2003: 608 buildings, average cost: $130,800
- 2002: 364 buildings, average cost: $109,900
- 2001: 208 buildings, average cost: $109,200
- 2000: 82 buildings, average cost: $128,700
- 1999: 77 buildings, average cost: $124,200
- 1998: 81 buildings, average cost: $124,000
- 1997: 141 buildings, average cost: $86,100
Median real estate property taxes paid for housing units with mortgages in 2022: $3,352 (0.7%)
Median real estate property taxes paid for housing units with no mortgage in 2022: $2,166 (0.6%)
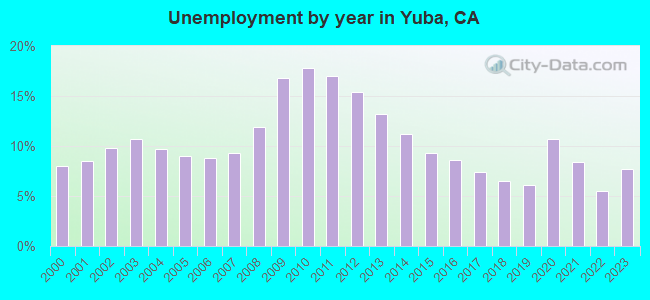
| Yuba County: | 14.7% |
| California: | 12.2% |
Median age of residents in 2022: 34.5 years old
(Males: 35.0 years old, Females: 34.1 years old)
(Median age for: White residents: 39.7 years old, Black residents: 35.4 years old, American Indian residents: 38.5 years old, Asian residents: 31.6 years old, Hispanic or Latino residents: 26.8 years old, Other race residents: 32.2 years old)
Area name: Yuba City, CA MSA
Fair market rent in 2006 for a 1-bedroom apartment in Yuba County is $493 a month.
Fair market rent for a 2-bedroom apartment is $606 a month.
Fair market rent for a 3-bedroom apartment is $882 a month.
Cities in this county include: Linda, Marysville, Olivehurst, Linda Rural, Marysville Rural, Plumas Lake, Beale AFB, Yuba Foothills, Wheatland, Loma Rica.
| Zip code | City | Number of tests | Number of tests >= 4 pCi/L |
|---|---|---|---|
| 95692 | Wheatland | 2 | 1 |
| 95901 | Marysville | 20 | 0 |
| 95903 | Beale AFB | 1 | 0 |
| 95918 | Browns Valley | 2 | 0 |
| 95919 | Brownsville | 2 | 0 |
| 95922 | Camptonville | 2 | 0 |
| 95977 | Smartville | 1 | 0 |
Neighboring counties: Clinton County, Missouri  , Jefferson County, Colorado .
| Here: | 7.1% |
| California: | 5.1% |
Current college students: 3,732
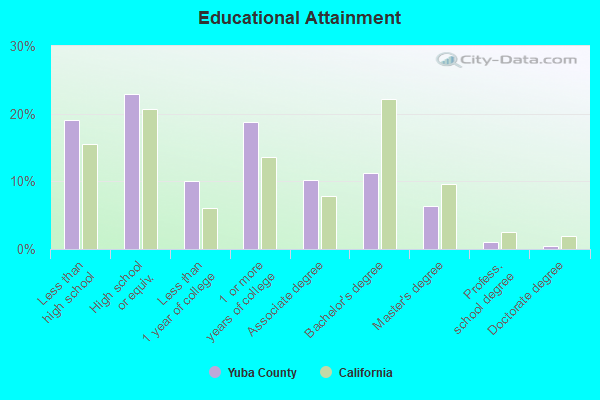
People 25 years of age or older with a high school degree or higher: 86.6%
People 25 years of age or older with a bachelor's degree or higher: 19.1%
Number of foreign born residents: 9,717 (56.6% naturalized citizens)
| Yuba County: | 11.5% |
| Whole state: | 26.7% |
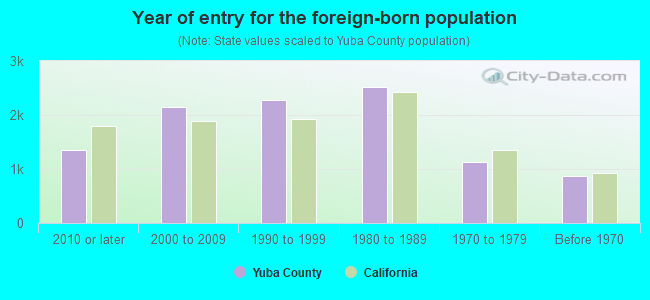
- Year of entry for the foreign-born population
- 1,7192010 or later
- 1,9602000 to 2009
- 2,2211990 to 1999
- 2,5101980 to 1989
- 1,1371970 to 1979
- 876Before 1970
Mean travel time to work (commute): $ minutes
Percentage of county residents living and working in this county: 100.0%
Housing units in structures:
- One, detached: 21,785
- One, attached: 1,516
- Two: 680
- 3 or 4: 1,882
- 5 to 9: 887
- 10 to 19: 362
- 20 to 49: 673
- 50 or more: 561
- Mobile homes: 2,363
- Boats, RVs, vans, etc.: 94
Housing units in Yuba County with a mortgage: 13,528 (888 second mortgage, 78 home equity loan, 711 both second mortgage and home equity loan)
Houses without a mortgage: 291
| Here: | 4.3% with mortgage |
| State: | 98.6% with mortgage |
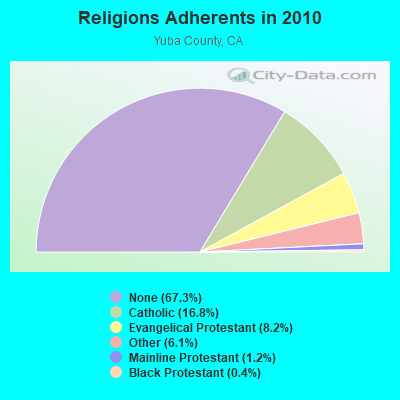
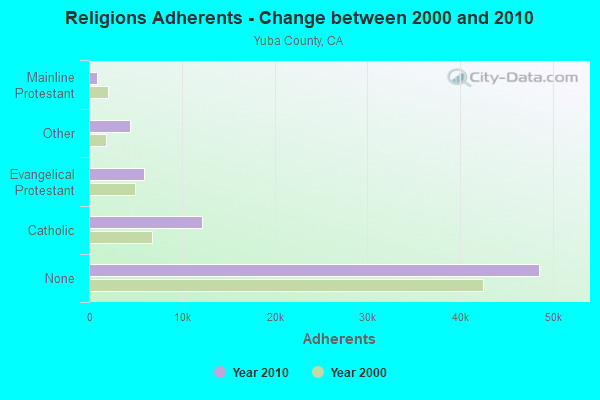
Religion statistics for Yuba County
| Religion | Adherents | Congregations |
|---|---|---|
| Catholic | 12,138 | 3 |
| Evangelical Protestant | 5,904 | 46 |
| Other | 4,406 | 9 |
| Mainline Protestant | 891 | 7 |
| Black Protestant | 266 | 1 |
| None | 48,550 | - |
Source: Clifford Grammich, Kirk Hadaway, Richard Houseal, Dale E.Jones, Alexei Krindatch, Richie Stanley and Richard H.Taylor. 2012. 2010 U.S.Religion Census: Religious Congregations & Membership Study. Association of Statisticians of American Religious Bodies. Jones, Dale E., et al. 2002. Congregations and Membership in the United States 2000. Nashville, TN: Glenmary Research Center.
Food Environment Statistics:
| Yuba County: | 1.81 / 10,000 pop. |
| State: | 2.14 / 10,000 pop. |
| Here: | 0.14 / 10,000 pop. |
| California: | 0.04 / 10,000 pop. |
| This county: | 0.84 / 10,000 pop. |
| California: | 0.62 / 10,000 pop. |
| Yuba County: | 2.09 / 10,000 pop. |
| California: | 1.49 / 10,000 pop. |
| This county: | 4.04 / 10,000 pop. |
| State: | 7.42 / 10,000 pop. |
| Yuba County: | 7.2% |
| California: | 7.3% |
| Yuba County: | 27.4% |
| State: | 21.3% |
| Here: | 16.4% |
| State: | 17.9% |
Agriculture in Yuba County:
Average size of farms: 271 acresAverage value of agricultural products sold per farm: $133,422
Average value of crops sold per acre for harvested cropland: $1135.43
The value of nursery, greenhouse, floriculture, and sod as a percentage of the total market value of agricultural products sold: 0.38%
The value of livestock, poultry, and their products as a percentage of the total market value of agricultural products sold: 21.93%
Average total farm production expenses per farm: $119,057
Harvested cropland as a percentage of land in farms: 33.82%
Irrigated harvested cropland as a percentage of land in farms: 96.63%
Average market value of all machinery and equipment per farm: $66,261
The percentage of farms operated by a family or individual: 80.76%
Average age of principal farm operators: 56 years
Average number of cattle and calves per 100 acres of all land in farms: 13.43
Milk cows as a percentage of all cattle and calves: 10.58%
All wheat for grain: 1386 harvested acres
Land in orchards: 36,240 acres
Earthquake activity:
Yuba County-area historical earthquake activity is significantly above California state average. It is 7188% greater than the overall U.S. average.On 4/18/1906 at 13:12:21, a magnitude 7.9 (7.9 UK, Class: Major, Intensity: VIII - XII) earthquake occurred 119.4 miles away from Yuba County center, causing $524,000,000 total damage
On 10/3/1915 at 06:52:48, a magnitude 7.6 (7.6 UK) earthquake occurred 226.6 miles away from the county center
On 1/31/1922 at 13:17:28, a magnitude 7.6 (7.6 UK) earthquake occurred 242.1 miles away from the county center
On 4/25/1992 at 18:06:04, a magnitude 7.2 (6.3 MB, 7.1 MS, 7.2 MW, 7.1 MW, Depth: 9.4 mi) earthquake occurred 161.3 miles away from the county center, causing $75,000,000 total damage
On 10/18/1989 at 00:04:15, a magnitude 7.1 (6.5 MB, 7.1 MS, 6.9 MW, 7.0 ML) earthquake occurred 146.3 miles away from Yuba County center, causing 62 deaths (62 shaking deaths) and 3757 injuries, causing $1,305,032,704 total damage
On 12/21/1932 at 06:10:09, a magnitude 7.2 (7.2 UK) earthquake occurred 186.2 miles away from the county center
Magnitude types: body-wave magnitude (MB), local magnitude (ML), surface-wave magnitude (MS), moment magnitude (MW)
Most recent natural disasters:
- California Wildfires, Incident Period: September 4, 2020 - November 17, 2020, FEMA Id: 4569, Natural disaster type: Fire
- California Wildfires, Incident Period: August 14, 2020 - September 26, 2020, FEMA Id: 4558, Natural disaster type: Fire
- California Covid-19 Pandemic, Incident Period: January 20, 2020, FEMA Id: 4482, Natural disaster type: Other
- California Wildfires, Incident Period: October 8, 2017 - October 31, 2017, FEMA Id: 4344, Natural disaster type: Fire
- California Severe Winter Storms, Flooding, Mudslides, Incident Period: February 1, 2017 - February 23, 2017, FEMA Id: 4308, Natural disaster type: Winter Storm, Mudslide, Flood
- California Severe Winter Storms, Flooding, And Mudslides, Incident Period: January 3, 2017 - January 12, 2017, FEMA Id: 4301, Natural disaster type: Winter Storm, Mudslide, Flood
- California Yuba Fire, Incident Period: August 14, 2009 to August 21, 2009, Fire Management Assistance Declared: August 15, 2009, FEMA Id: 2825, Natural disaster type: Fire
- California Severe Storms, Flooding, Mudslides, and Landslides, Incident Period: December 17, 2005 to January 03, 2006, Major Disaster (Presidential) Declared DR-1628: February 03, 2006, FEMA Id: 1628, Natural disaster type: Storm, Mudslide, Landslide, Flood
- California Hurricane Katrina Evacuation, Incident Period: August 29, 2005 to October 01, 2005, Emergency Declared EM-3248: September 13, 2005, FEMA Id: 3248, Natural disaster type: Hurricane
- California Extreme Fire Hazards, Incident Period: August 24, 1999 to November 29, 1999, Emergency Declared EM-3140: September 01, 1999, FEMA Id: 3140, Natural disaster type: Fire
- 12 other natural disasters have been reported since 1953.
The number of natural disasters in Yuba County (22) is greater than the US average (15).
Major Disasters (Presidential) Declared: 12
Emergencies Declared: 3
Causes of natural disasters: Floods: 12, Fires: 6, Storms: 6, Winter Storms: 5, Landslides: 3, Mudslides: 3, Drought: 1, Freeze: 1, Heavy Rain: 1, Hurricane: 1, Tornado: 1, Other: 1 (Note: some incidents may be assigned to more than one category).
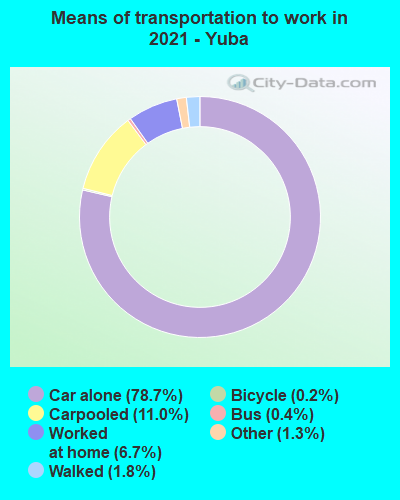
Means of transportation to work:
- Drove a car alone: 19,748 (74.4%)
- Carpooled: 2,961 (11.2%)
- Bus: 56 (0.2%)
- Taxicab, motorcycle, or other means: 350 (1.3%)
- Bicycle: 22 (0.1%)
- Walked: 427 (1.6%)
- Worked at home: 2,746 (10.3%)
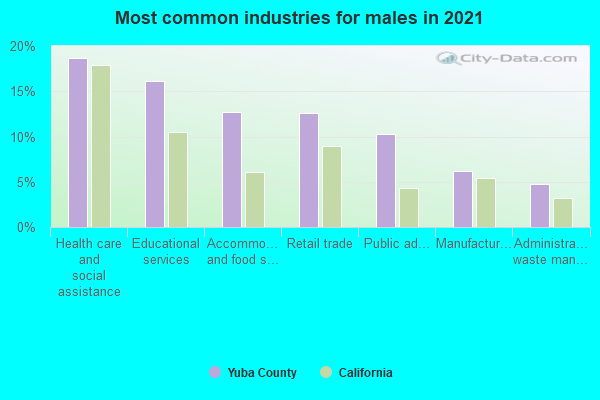
- Health care and social assistance (23%)
- Retail trade (13%)
- Public administration (11%)
- Educational services (11%)
- Manufacturing (7%)
- Accommodation and food services (7%)
- Other services, except public administration (4%)
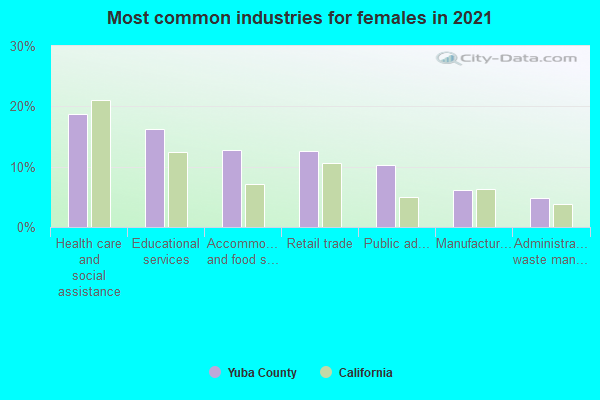
- Health care and social assistance (24%)
- Retail trade (14%)
- Public administration (11%)
- Educational services (11%)
- Manufacturing (7%)
- Accommodation and food services (7%)
- Other services, except public administration (4%)
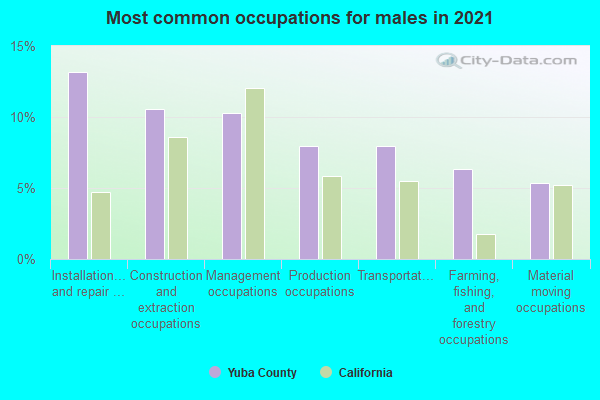
- Construction and extraction occupations (14%)
- Transportation occupations (10%)
- Installation, maintenance, and repair occupations (8%)
- Production occupations (8%)
- Sales and related occupations (7%)
- Management occupations (6%)
- Material moving occupations (6%)
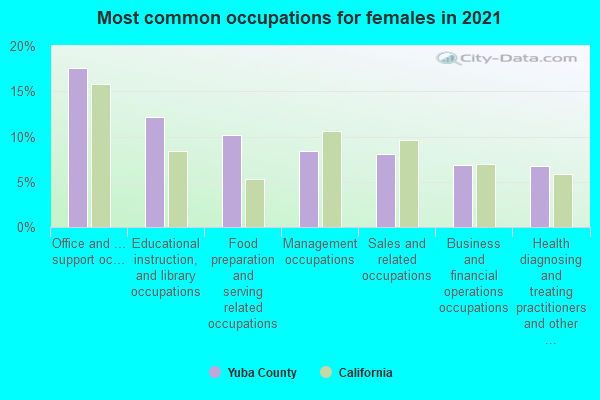
- Office and administrative support occupations (14%)
- Management occupations (12%)
- Sales and related occupations (11%)
- Educational instruction, and library occupations (10%)
- Healthcare support occupations (7%)
- Food preparation and serving related occupations (7%)
- Material moving occupations (6%)
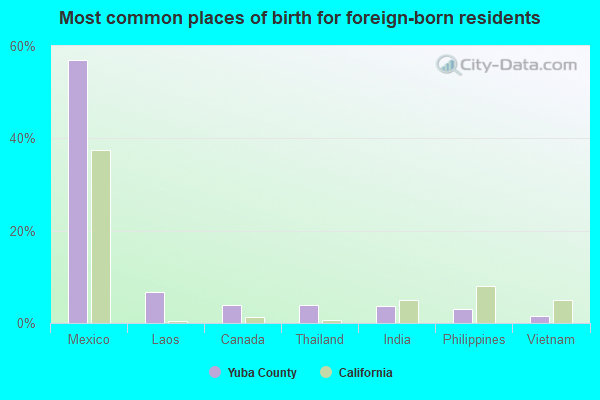
- Mexico (57%)
- Laos (8%)
- Thailand (4%)
- Canada (3%)
- Philippines (3%)
- India (3%)
- Afghanistan (2%)
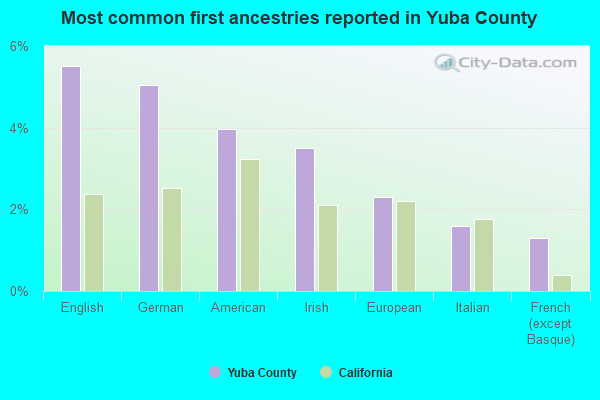
- English (6%)
- German (6%)
- American (4%)
- Irish (4%)
- European (3%)
- Italian (2%)
- French (except Basque) (1%)
People in group quarters in Yuba County, California in 2010:
- 413 people in military barracks and dormitories (nondisciplinary)
- 406 people in local jails and other municipal confinement facilities
- 82 people in nursing facilities/skilled-nursing facilities
- 73 people in group homes intended for adults
- 57 people in other noninstitutional facilities
- 40 people in residential treatment centers for adults
- 38 people in emergency and transitional shelters (with sleeping facilities) for people experiencing homelessness
- 37 people in correctional facilities intended for juveniles
- 21 people in workers' group living quarters and job corps centers
- 4 people in group homes for juveniles (non-correctional)
People in group quarters in Yuba County, California in 2000:
- 341 people in local jails and other confinement facilities (including police lockups)
- 334 people in military transient quarters for temporary residents
- 178 people in military barracks, etc.
- 97 people in other noninstitutional group quarters
- 84 people in nursing homes
- 74 people in other nonhousehold living situations
- 58 people in short-term care, detention or diagnostic centers for delinquent children
- 29 people in homes for the mentally ill
- 29 people in homes for the mentally retarded
- 26 people in other group homes
- 26 people in agriculture workers' dormitories on farms
- 25 people in homes or halfway houses for drug/alcohol abuse
- 24 people in college dormitories (includes college quarters off campus)
- 9 people in other workers' dormitories
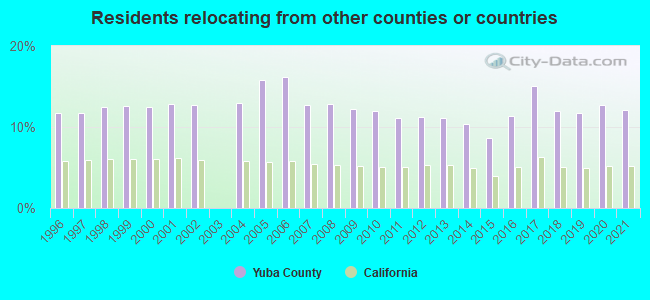
12.15% of this county's 2021 resident taxpayers lived in other counties in 2020 ($52,892 average adjusted gross income)
| Here: | 12.15% |
| California average: | 5.19% |
0.27% of residents moved from foreign countries ($1,145 average AGI)
Yuba County: 0.27% California average: 0.03%
9.65% relocated from other counties in California ($42,536 average AGI)
2.23% relocated from other states ($9,210 average AGI)
Yuba County: 2.23% California average: 1.56%
Top counties from which taxpayers relocated into this county between 2020 and 2021:
| from Sacramento County, CA | |
| from Sutter County, CA | |
| from Placer County, CA | |
| from Butte County, CA | |
| from Yolo County, CA | |
| from Nevada County, CA | |
| from Solano County, CA |
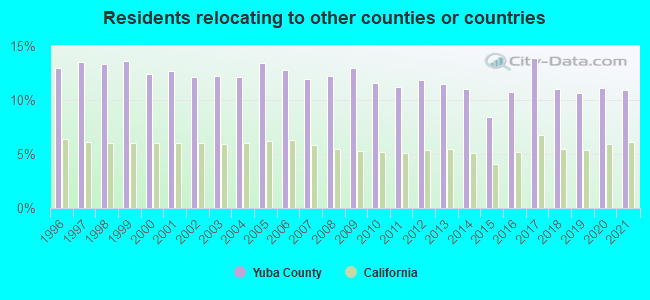
10.93% of this county's 2020 resident taxpayers moved to other counties in 2021 ($50,912 average adjusted gross income)
| Here: | 10.93% |
| California average: | 6.14% |
0.15% of residents moved to foreign countries ($622 average AGI)
Yuba County: 0.15% California average: 0.02%
7.07% relocated to other counties in California ($31,001 average AGI)
3.70% relocated to other states ($19,288 average AGI)
Yuba County: 3.70% California average: 2.55%
Top counties to which taxpayers relocated from this county between 2020 and 2021:
| to Sutter County, CA | |
| to Sacramento County, CA | |
| to Placer County, CA | |
| to Butte County, CA | |
| to Nevada County, CA | |
| to Yolo County, CA | |
| to Clark County, NV |
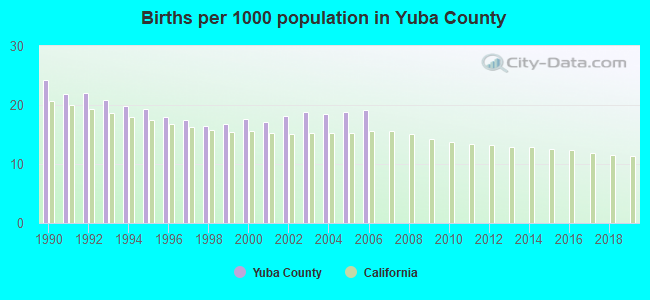
Births per 1000 population from 1990 to 1999: 19.7
Births per 1000 population from 2000 to 2006: 18.3
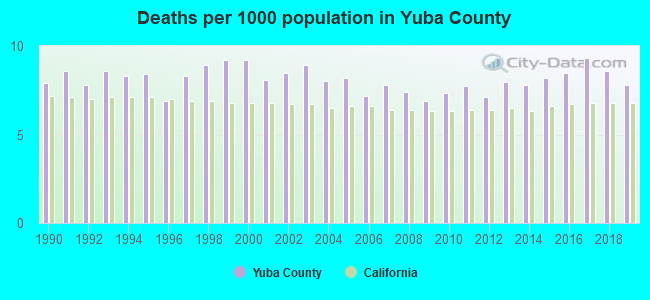
Deaths per 1000 population from 1990 to 1999: 8.3
Deaths per 1000 population from 2000 to 2009: 8.0
Deaths per 1000 population from 2010 to 2020: 8.1
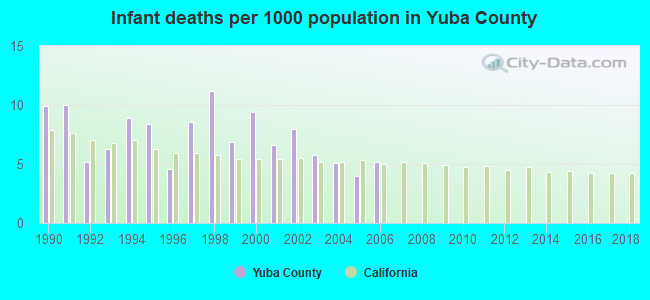
Infant deaths per 1000 live births from 1990 to 1999: 8.0
Infant deaths per 1000 live births from 2000 to 2006: 6.3
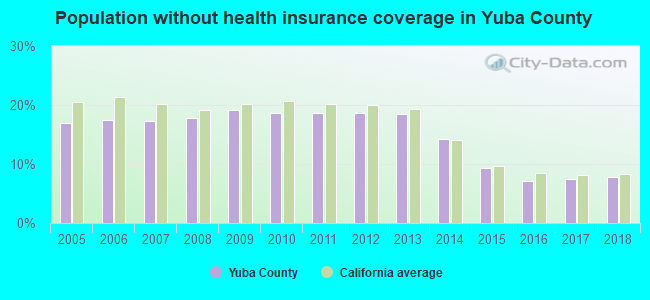
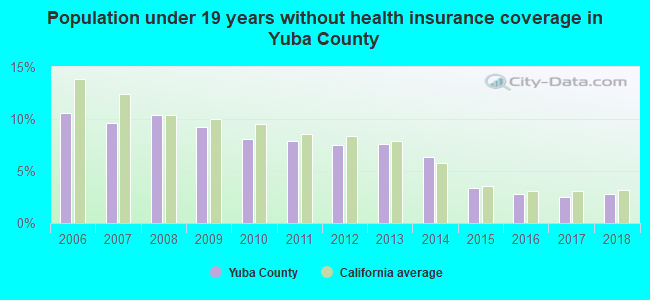
Persons under 19 years old without health insurance coverage in 2018: 2.8%
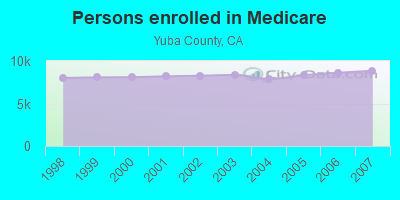
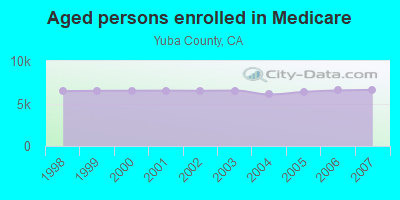
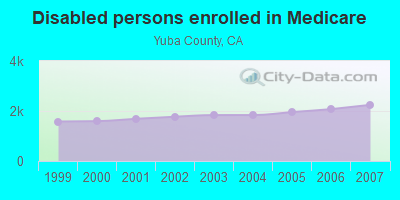
Persons enrolled in hospital insurance and/or supplemental medical insurance (Medicare) in July 1, 2007: 8,852 (6,606 aged, 2,246 disabled)
Children under 18 without health insurance coverage in 2007: 1,930 (9%)
Most common underlying causes of death in Yuba County, California in 1999 - 2019:
- Atherosclerotic heart disease (994)
- Bronchus or lung, unspecified - Malignant neoplasms (816)
- Acute myocardial infarction, unspecified (741)
- Chronic obstructive pulmonary disease, unspecified (644)
- Stroke, not specified as haemorrhage or infarction (255)
- Alzheimer disease, unspecified (214)
- Pneumonia, unspecified (199)
- Atherosclerotic cardiovascular disease, so described (147)
- Congestive heart failure (140)
- Chronic obstructive pulmonary disease with acute lower respiratory infection (127)
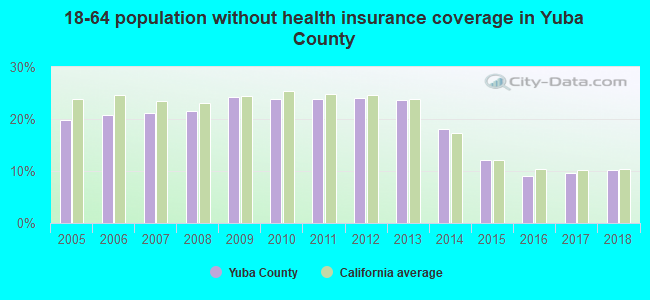
Population without health insurance coverage in 2000: 23%
Children under 18 without health insurance coverage in 2000: 18%
Homicides per 1,000,000 population from 2000 to 2006: 49.0. This is less than state average.
Suicides per 1,000,000 population from 2000 to 2006: 167.1. This is less than state average.
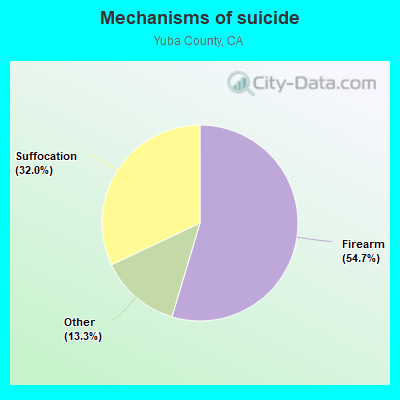
- Firearm - 91.3
- Suffocation - 53.5
- Other - 22.3
Household type by relationship:
Households: 84,310- Male householders: 14,479 (3,727 living alone), Female householders: 14,951 (2,489 living alone)
14,522 spouses (14,452 opposite-sex spouses), 3,325 unmarried partners, (2,840 opposite-sex unmarried partners), 26,395 children (25,285 natural, 286 adopted, 824 stepchildren), 2,234 grandchildren, 1,739 brothers or sisters, 1,455 parents, 0 foster children, 990 other relatives, 2,855 non-relatives
- In group quarters: 1,365
Size of family households: 7,729 2-persons, 4,355 3-persons, 4,597 4-persons, 2,311 5-persons, 1,514 6-persons, 799 7-or-more-persons.
Size of nonfamily households: 6,216 1-person, 1,329 2-persons, 270 3-persons, 310 4-persons.
14,287 married couples with children.
6,407 single-parent households (925 men, 5,482 women).
74.2% of residents of Yuba speak English at home.
17.5% of residents speak Spanish at home (66% speak English very well, 14% speak English well, 13% speak English not well, 7% don't speak English at all).
1.8% of residents speak other Indo-European language at home (66% speak English very well, 20% speak English well, 7% speak English not well, 6% don't speak English at all).
5.5% of residents speak Asian or Pacific Island language at home (61% speak English very well, 26% speak English well, 7% speak English not well, 6% don't speak English at all).
0.3% of residents speak other language at home (65% speak English very well, 32% speak English well, 3% don't speak English at all).
In fiscal year 2004:
Federal Government expenditure: $589,504,000 ($9,121 per capita)
Department of Defense expenditure: $201,207,000
Federal direct payments to individuals for retirement and disability: $157,083,000
Federal other direct payments to individuals: $85,211,000
Federal direct payments not to individuals: $12,904,000
Federal grants: $127,346,000
Federal procurement contracts: $13,064,000 ($7,565,000 Department of Defense)
Federal salaries and wages: $193,896,000 ($173,871,000 Department of Defense)
Federal Government direct loans: $1,393,000
Federal guaranteed/insured loans: $30,370,000
Federal Government insurance: $670,799,000
Population change from April 1, 2000 to July 1, 2005:
Births: 5,888| Here: | 88 per 1000 residents |
| State: | 77 per 1000 residents |
Deaths: 2,906
| Here: | 43 per 1000 residents |
| State: | 34 per 1000 residents |
Net international migration: +1,365
| Here: | +20 per 1000 residents |
| State: | +39 per 1000 residents |
Net internal migration: +2,709
| Here: | |
| State: |
Total withdrawal of fresh water for public supply: 11.13 millions of gallons per day (96% from ground, 4% from surface)
| Here: | 6.0 |
| State: | 6.0 |
| Here: | 4.5 |
| State: | 3.9 |
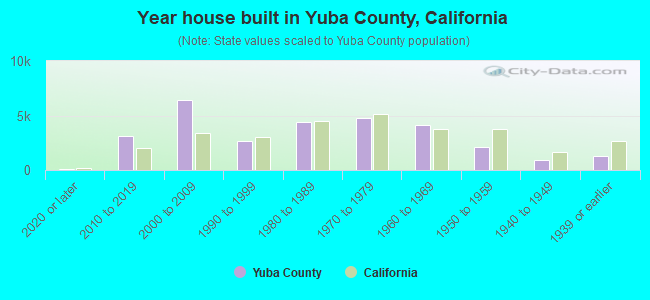
- Year house built in Yuba County, California
- 5142020 or later
- 3,3022010 to 2019
- 7,5562000 to 2009
- 3,1081990 to 1999
- 4,0961980 to 1989
- 3,4691970 to 1979
- 2,2111960 to 1969
- 3,2211950 to 1959
- 1,4011940 to 1949
- 1,9251939 or earlier
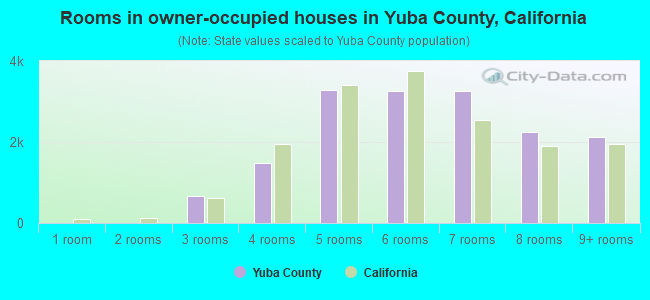
- Rooms in owner-occupied houses in Yuba County, California
- 531 room
- 02 rooms
- 1,0593 rooms
- 2,0314 rooms
- 4,6775 rooms
- 4,0936 rooms
- 3,8127 rooms
- 2,0448 rooms
- 1,7189+ rooms
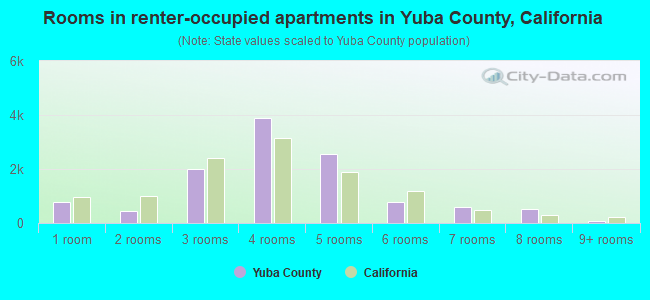
- Rooms in renter-occupied apartments in Yuba County, California
- 3211 room
- 3032 rooms
- 1,4793 rooms
- 2,9934 rooms
- 2,2375 rooms
- 1,9626 rooms
- 3097 rooms
- 3398 rooms
- 09+ rooms
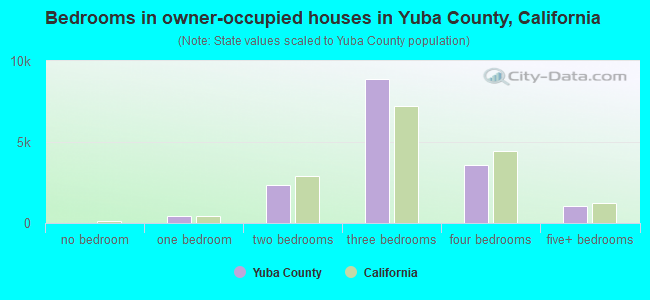
- Bedrooms in owner-occupied houses in Yuba County, California
- 101no bedroom
- 2351 bedroom
- 3,3792 bedrooms
- 9,4953 bedrooms
- 5,6154 bedrooms
- 6625+ bedrooms
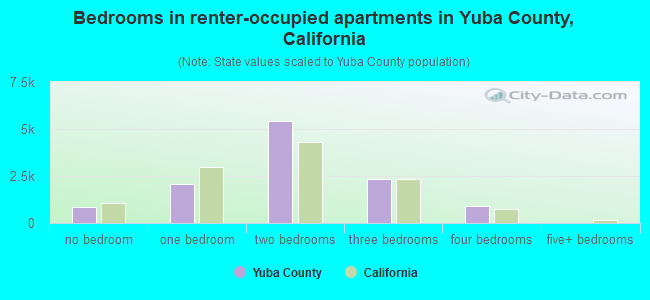
- Bedrooms in renter-occupied apartments in Yuba County, California
- 321no bedroom
- 1,3721 bedroom
- 4,5952 bedrooms
- 3,2073 bedrooms
- 2154 bedrooms
- 2335+ bedrooms
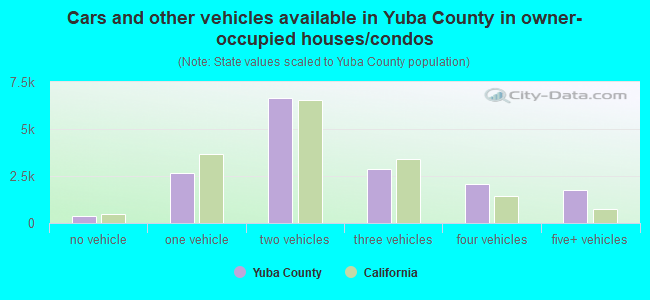
- Cars and other vehicles available in Yuba County in owner-occupied houses/condos
- 606no vehicle
- 3,1931 vehicle
- 7,3842 vehicles
- 5,1993 vehicles
- 2,5694 vehicles
- 5365+ vehicles
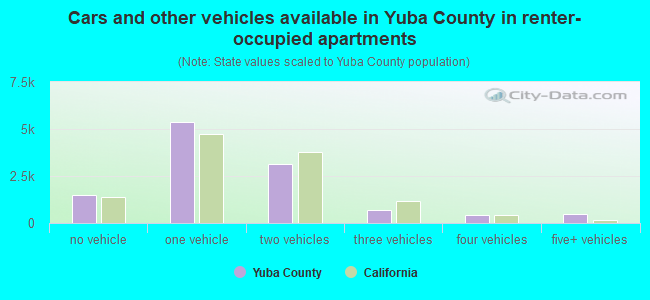
- Cars and other vehicles available in Yuba County in renter-occupied apartments
- 1,303no vehicle
- 3,9541 vehicle
- 2,1342 vehicles
- 1,7683 vehicles
- 7164 vehicles
- 685+ vehicles
86.0% of Yuba County residents lived in the same house 1 years ago.
Out of people who lived in different houses, 27% lived in this county.
Out of people who lived in different counties, 79% lived in California.
| Yuba County: | 86.0% |
| State average: | 88.9% |
Place of birth for U.S.-born residents:
- This state: 60,920
- Other state: 13,133
- Northeast: 1,687
- Midwest: 2,631
- South: 4,667
- West: 4,148
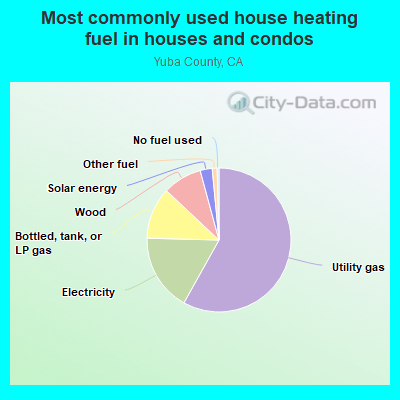
- 55.3%Utility gas
- 18.0%Electricity
- 13.9%Bottled, tank, or LP gas
- 7.1%Wood
- 3.6%Solar energy
- 1.7%Other fuel
- 0.3%No fuel used
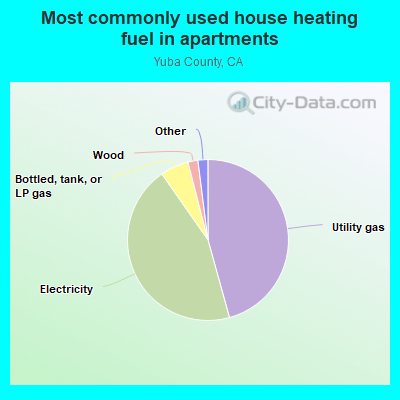
- 47.8%Utility gas
- 42.3%Electricity
- 3.8%Bottled, tank, or LP gas
- 3.8%Wood
- 2.0%Other fuel
- 0.4%Solar energy
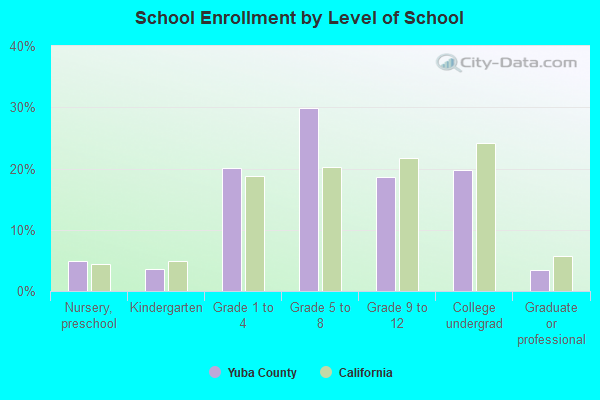
Private vs. public school enrollment:
| Here: | 7.7% |
| California: | 10.5% |
| Here: | 10.0% |
| California: | 8.5% |
| Here: | 11.0% |
| California: | 15.9% |
Yuba County government finances - Expenditure in 2020:
- Assistance and Subsidies - Public Welfare, Cash Assistance Programs - Other: $24,527,000
Public Welfare, Cash Assistance Programs - Other: $21,027,000
- Charges - Other: $30,834,000
Other: $26,842,000
Solid Waste Management: $4,694,000
Elementary and Secondary Education - Other: $1,815,000
Regular Highways: $1,703,000
Regular Highways: $1,660,000
Elementary and Secondary Education - Other: $1,474,000
Solid Waste Management: $1,133,000
Air Transportation: $489,000
Air Transportation: $342,000
Natural Resources - Other: $118,000
Natural Resources - Other: $110,000
Parks and Recreation: $12,000
Elementary and Secondary Education School Lunch: $1,000
- Construction - Electric Utilities: $10,732,000
Electric Utilities: $10,174,000
Elementary and Secondary Education: $999,000
Elementary and Secondary Education: $367,000
Health - Other: $2,000
Water Utilities: $1,000
Water Utilities: $1,000
- Current Operations - Public Welfare - Other: $36,016,000
Public Welfare - Other: $32,989,000
Electric Utilities: $25,923,000
Electric Utilities: $24,678,000
Elementary and Secondary Education: $23,845,000
Water Utilities: $23,426,000
Elementary and Secondary Education: $21,379,000
Correctional Institutions: $19,231,000
Water Utilities: $19,106,000
Police Protection: $13,774,000
Health - Other: $13,101,000
Health - Other: $11,153,000
Regular Highways: $10,332,000
Regular Highways: $10,238,000
General - Other: $9,322,000
General - Other: $8,865,000
Judicial and Legal Services: $8,202,000
Corrections - Other: $7,421,000
Central Staff Services: $6,979,000
Corrections - Other: $6,509,000
Central Staff Services: $6,211,000
Financial Administration: $3,762,000
Financial Administration: $3,361,000
Protective Inspection and Regulation - Other: $2,935,000
Judicial and Legal Services: $2,879,000
Protective Inspection and Regulation - Other: $2,736,000
Natural Resources - Other: $2,530,000
Natural Resources - Other: $1,875,000
Libraries: $847,000
Air Transportation: $515,000
Libraries: $476,000
Air Transportation: $421,000
Police Protection: $324,000
Parks and Recreation: $270,000
Parks and Recreation: $227,000
Correctional Institutions: $24,000
- Federal Intergovernmental - Other: $10,168,000
Other: $5,989,000
Electric Utilities: $3,915,000
Air Transportation: $416,000
Air Transportation: $264,000
Water Utilities: $141,000
Education: $66,000
Natural Resources: $55,000
Natural Resources: $51,000
Electric Utilities: $38,000
Education: $36,000
- General - Interest on Debt: $3,645,000
Interest on Debt: $3,617,000
- Intergovernmental to Local - Other - Elementary and Secondary Education: $10,580,000
Other - Elementary and Secondary Education: $9,227,000
Other - General - Other: $32,000
Other - General - Other: $31,000
- Intergovernmental to State - Judicial and Legal Services: $369,000
Judicial and Legal Services: $316,000
- Local Intergovernmental - Education: $6,570,000
Education: $5,424,000
Other: $3,731,000
Other: $3,534,000
Health and Hospitals: $220,000
- Long Term Debt - Beginning Outstanding - Unspecified Public Purpose: $178,525,000
Outstanding Unspecified Public Purpose: $172,075,000
Outstanding Unspecified Public Purpose: $170,795,000
Beginning Outstanding - Unspecified Public Purpose: $168,116,000
Retired Unspecified Public Purpose: $6,451,000
Issue, Unspecified Public Purpose: $4,063,000
Retired Unspecified Public Purpose: $1,385,000
- Miscellaneous - Fines and Forfeits: $17,792,000
Interest Earnings: $6,165,000
Special Assessments: $3,106,000
Special Assessments: $2,562,000
Interest Earnings: $1,878,000
General Revenue - Other: $1,451,000
General Revenue - Other: $1,110,000
Fines and Forfeits: $997,000
Rents: $197,000
Rents: $105,000
Sale of Property: $26,000
Sale of Property: $26,000
- Other Capital Outlay - Regular Highways: $20,668,000
General - Other: $11,494,000
General - Other: $11,414,000
Elementary and Secondary Education: $653,000
Electric Utilities: $313,000
Police Protection: $268,000
Electric Utilities: $265,000
Public Welfare - Other: $171,000
Regular Highways: $148,000
Health - Other: $108,000
Water Utilities: $75,000
Water Utilities: $69,000
Parks and Recreation: $62,000
Public Welfare - Other: $20,000
Police Protection: $11,000
Health - Other: $11,000
Air Transportation: $10,000
Air Transportation: $9,000
- Other Funds - Cash and Securities: $155,881,000
Cash and Securities: $116,357,000
- Revenue - Electric Utilities: $69,397,000
Electric Utilities: $60,300,000
Water Utilities: $3,743,000
Water Utilities: $555,000
- State Intergovernmental - Public Welfare: $76,740,000
Public Welfare: $68,253,000
Other: $26,179,000
Other: $25,867,000
Education: $24,660,000
Education: $21,703,000
Health and Hospitals: $6,918,000
Highways: $6,700,000
Health and Hospitals: $5,404,000
Water Utilities: $4,075,000
Highways: $4,050,000
Electric Utilities: $958,000
General Local Government Support: $265,000
General Local Government Support: $257,000
Electric Utilities: $143,000
Water Utilities: $38,000
- Tax - Property: $26,111,000
Property: $22,914,000
General Sales and Gross Receipts: $10,490,000
Occupation and Business License - Other: $8,521,000
Occupation and Business License - Other: $5,722,000
General Sales and Gross Receipts: $3,793,000
Public Utilities Sales: $1,976,000
Other License: $1,668,000
Other License: $1,505,000
Public Utilities Sales: $1,499,000
Other: $1,269,000
Documentary and Stock Transfer: $684,000
Other: $645,000
Documentary and Stock Transfer: $523,000
Other Selective Sales: $429,000
Other Selective Sales: $399,000
- Total Salaries and Wages: $12,417,000
: $11,455,000
- Water Utilities - Interest on Debt: $1,529,000
Yuba County government finances - Revenue in 2020:
- Assistance and Subsidies - Public Welfare, Cash Assistance Programs - Other: $24,527,000
Public Welfare, Cash Assistance Programs - Other: $21,027,000
- Charges - Other: $30,834,000
Other: $26,842,000
Solid Waste Management: $4,694,000
Elementary and Secondary Education - Other: $1,815,000
Regular Highways: $1,703,000
Regular Highways: $1,660,000
Elementary and Secondary Education - Other: $1,474,000
Solid Waste Management: $1,133,000
Air Transportation: $489,000
Air Transportation: $342,000
Natural Resources - Other: $118,000
Natural Resources - Other: $110,000
Parks and Recreation: $12,000
Elementary and Secondary Education School Lunch: $1,000
- Construction - Electric Utilities: $10,732,000
Electric Utilities: $10,174,000
Elementary and Secondary Education: $999,000
Elementary and Secondary Education: $367,000
Health - Other: $2,000
Water Utilities: $1,000
Water Utilities: $1,000
- Current Operations - Public Welfare - Other: $36,016,000
Public Welfare - Other: $32,989,000
Electric Utilities: $25,923,000
Electric Utilities: $24,678,000
Elementary and Secondary Education: $23,845,000
Water Utilities: $23,426,000
Elementary and Secondary Education: $21,379,000
Correctional Institutions: $19,231,000
Water Utilities: $19,106,000
Police Protection: $13,774,000
Health - Other: $13,101,000
Health - Other: $11,153,000
Regular Highways: $10,332,000
Regular Highways: $10,238,000
General - Other: $9,322,000
General - Other: $8,865,000
Judicial and Legal Services: $8,202,000
Corrections - Other: $7,421,000
Central Staff Services: $6,979,000
Corrections - Other: $6,509,000
Central Staff Services: $6,211,000
Financial Administration: $3,762,000
Financial Administration: $3,361,000
Protective Inspection and Regulation - Other: $2,935,000
Judicial and Legal Services: $2,879,000
Protective Inspection and Regulation - Other: $2,736,000
Natural Resources - Other: $2,530,000
Natural Resources - Other: $1,875,000
Libraries: $847,000
Air Transportation: $515,000
Libraries: $476,000
Air Transportation: $421,000
Police Protection: $324,000
Parks and Recreation: $270,000
Parks and Recreation: $227,000
Correctional Institutions: $24,000
- Federal Intergovernmental - Other: $10,168,000
Other: $5,989,000
Electric Utilities: $3,915,000
Air Transportation: $416,000
Air Transportation: $264,000
Water Utilities: $141,000
Education: $66,000
Natural Resources: $55,000
Natural Resources: $51,000
Electric Utilities: $38,000
Education: $36,000
- General - Interest on Debt: $3,645,000
Interest on Debt: $3,617,000
- Intergovernmental to Local - Other - Elementary and Secondary Education: $10,580,000
Other - Elementary and Secondary Education: $9,227,000
Other - General - Other: $32,000
Other - General - Other: $31,000
- Intergovernmental to State - Judicial and Legal Services: $369,000
Judicial and Legal Services: $316,000
- Local Intergovernmental - Education: $6,570,000
Education: $5,424,000
Other: $3,731,000
Other: $3,534,000
Health and Hospitals: $220,000
- Long Term Debt - Beginning Outstanding - Unspecified Public Purpose: $178,525,000
Outstanding Unspecified Public Purpose: $172,075,000
Outstanding Unspecified Public Purpose: $170,795,000
Beginning Outstanding - Unspecified Public Purpose: $168,116,000
Retired Unspecified Public Purpose: $6,451,000
Issue, Unspecified Public Purpose: $4,063,000
Retired Unspecified Public Purpose: $1,385,000
- Miscellaneous - Fines and Forfeits: $17,792,000
Interest Earnings: $6,165,000
Special Assessments: $3,106,000
Special Assessments: $2,562,000
Interest Earnings: $1,878,000
General Revenue - Other: $1,451,000
General Revenue - Other: $1,110,000
Fines and Forfeits: $997,000
Rents: $197,000
Rents: $105,000
Sale of Property: $26,000
Sale of Property: $26,000
- Other Capital Outlay - Regular Highways: $20,668,000
General - Other: $11,494,000
General - Other: $11,414,000
Elementary and Secondary Education: $653,000
Electric Utilities: $313,000
Police Protection: $268,000
Electric Utilities: $265,000
Public Welfare - Other: $171,000
Regular Highways: $148,000
Health - Other: $108,000
Water Utilities: $75,000
Water Utilities: $69,000
Parks and Recreation: $62,000
Public Welfare - Other: $20,000
Police Protection: $11,000
Health - Other: $11,000
Air Transportation: $10,000
Air Transportation: $9,000
- Other Funds - Cash and Securities: $155,881,000
Cash and Securities: $116,357,000
- Revenue - Electric Utilities: $69,397,000
Electric Utilities: $60,300,000
Water Utilities: $3,743,000
Water Utilities: $555,000
- State Intergovernmental - Public Welfare: $76,740,000
Public Welfare: $68,253,000
Other: $26,179,000
Other: $25,867,000
Education: $24,660,000
Education: $21,703,000
Health and Hospitals: $6,918,000
Highways: $6,700,000
Health and Hospitals: $5,404,000
Water Utilities: $4,075,000
Highways: $4,050,000
Electric Utilities: $958,000
General Local Government Support: $265,000
General Local Government Support: $257,000
Electric Utilities: $143,000
Water Utilities: $38,000
- Tax - Property: $26,111,000
Property: $22,914,000
General Sales and Gross Receipts: $10,490,000
Occupation and Business License - Other: $8,521,000
Occupation and Business License - Other: $5,722,000
General Sales and Gross Receipts: $3,793,000
Public Utilities Sales: $1,976,000
Other License: $1,668,000
Other License: $1,505,000
Public Utilities Sales: $1,499,000
Other: $1,269,000
Documentary and Stock Transfer: $684,000
Other: $645,000
Documentary and Stock Transfer: $523,000
Other Selective Sales: $429,000
Other Selective Sales: $399,000
- Total Salaries and Wages: $12,417,000
: $11,455,000
- Water Utilities - Interest on Debt: $1,529,000
Yuba County government finances - Debt in 2020:
- Assistance and Subsidies - Public Welfare, Cash Assistance Programs - Other: $24,527,000
Public Welfare, Cash Assistance Programs - Other: $21,027,000
- Charges - Other: $30,834,000
Other: $26,842,000
Solid Waste Management: $4,694,000
Elementary and Secondary Education - Other: $1,815,000
Regular Highways: $1,703,000
Regular Highways: $1,660,000
Elementary and Secondary Education - Other: $1,474,000
Solid Waste Management: $1,133,000
Air Transportation: $489,000
Air Transportation: $342,000
Natural Resources - Other: $118,000
Natural Resources - Other: $110,000
Parks and Recreation: $12,000
Elementary and Secondary Education School Lunch: $1,000
- Construction - Electric Utilities: $10,732,000
Electric Utilities: $10,174,000
Elementary and Secondary Education: $999,000
Elementary and Secondary Education: $367,000
Health - Other: $2,000
Water Utilities: $1,000
Water Utilities: $1,000
- Current Operations - Public Welfare - Other: $36,016,000
Public Welfare - Other: $32,989,000
Electric Utilities: $25,923,000
Electric Utilities: $24,678,000
Elementary and Secondary Education: $23,845,000
Water Utilities: $23,426,000
Elementary and Secondary Education: $21,379,000
Correctional Institutions: $19,231,000
Water Utilities: $19,106,000
Police Protection: $13,774,000
Health - Other: $13,101,000
Health - Other: $11,153,000
Regular Highways: $10,332,000
Regular Highways: $10,238,000
General - Other: $9,322,000
General - Other: $8,865,000
Judicial and Legal Services: $8,202,000
Corrections - Other: $7,421,000
Central Staff Services: $6,979,000
Corrections - Other: $6,509,000
Central Staff Services: $6,211,000
Financial Administration: $3,762,000
Financial Administration: $3,361,000
Protective Inspection and Regulation - Other: $2,935,000
Judicial and Legal Services: $2,879,000
Protective Inspection and Regulation - Other: $2,736,000
Natural Resources - Other: $2,530,000
Natural Resources - Other: $1,875,000
Libraries: $847,000
Air Transportation: $515,000
Libraries: $476,000
Air Transportation: $421,000
Police Protection: $324,000
Parks and Recreation: $270,000
Parks and Recreation: $227,000
Correctional Institutions: $24,000
- Federal Intergovernmental - Other: $10,168,000
Other: $5,989,000
Electric Utilities: $3,915,000
Air Transportation: $416,000
Air Transportation: $264,000
Water Utilities: $141,000
Education: $66,000
Natural Resources: $55,000
Natural Resources: $51,000
Electric Utilities: $38,000
Education: $36,000
- General - Interest on Debt: $3,645,000
Interest on Debt: $3,617,000
- Intergovernmental to Local - Other - Elementary and Secondary Education: $10,580,000
Other - Elementary and Secondary Education: $9,227,000
Other - General - Other: $32,000
Other - General - Other: $31,000
- Intergovernmental to State - Judicial and Legal Services: $369,000
Judicial and Legal Services: $316,000
- Local Intergovernmental - Education: $6,570,000
Education: $5,424,000
Other: $3,731,000
Other: $3,534,000
Health and Hospitals: $220,000
- Long Term Debt - Beginning Outstanding - Unspecified Public Purpose: $178,525,000
Outstanding Unspecified Public Purpose: $172,075,000
Outstanding Unspecified Public Purpose: $170,795,000
Beginning Outstanding - Unspecified Public Purpose: $168,116,000
Retired Unspecified Public Purpose: $6,451,000
Issue, Unspecified Public Purpose: $4,063,000
Retired Unspecified Public Purpose: $1,385,000
- Miscellaneous - Fines and Forfeits: $17,792,000
Interest Earnings: $6,165,000
Special Assessments: $3,106,000
Special Assessments: $2,562,000
Interest Earnings: $1,878,000
General Revenue - Other: $1,451,000
General Revenue - Other: $1,110,000
Fines and Forfeits: $997,000
Rents: $197,000
Rents: $105,000
Sale of Property: $26,000
Sale of Property: $26,000
- Other Capital Outlay - Regular Highways: $20,668,000
General - Other: $11,494,000
General - Other: $11,414,000
Elementary and Secondary Education: $653,000
Electric Utilities: $313,000
Police Protection: $268,000
Electric Utilities: $265,000
Public Welfare - Other: $171,000
Regular Highways: $148,000
Health - Other: $108,000
Water Utilities: $75,000
Water Utilities: $69,000
Parks and Recreation: $62,000
Public Welfare - Other: $20,000
Police Protection: $11,000
Health - Other: $11,000
Air Transportation: $10,000
Air Transportation: $9,000
- Other Funds - Cash and Securities: $155,881,000
Cash and Securities: $116,357,000
- Revenue - Electric Utilities: $69,397,000
Electric Utilities: $60,300,000
Water Utilities: $3,743,000
Water Utilities: $555,000
- State Intergovernmental - Public Welfare: $76,740,000
Public Welfare: $68,253,000
Other: $26,179,000
Other: $25,867,000
Education: $24,660,000
Education: $21,703,000
Health and Hospitals: $6,918,000
Highways: $6,700,000
Health and Hospitals: $5,404,000
Water Utilities: $4,075,000
Highways: $4,050,000
Electric Utilities: $958,000
General Local Government Support: $265,000
General Local Government Support: $257,000
Electric Utilities: $143,000
Water Utilities: $38,000
- Tax - Property: $26,111,000
Property: $22,914,000
General Sales and Gross Receipts: $10,490,000
Occupation and Business License - Other: $8,521,000
Occupation and Business License - Other: $5,722,000
General Sales and Gross Receipts: $3,793,000
Public Utilities Sales: $1,976,000
Other License: $1,668,000
Other License: $1,505,000
Public Utilities Sales: $1,499,000
Other: $1,269,000
Documentary and Stock Transfer: $684,000
Other: $645,000
Documentary and Stock Transfer: $523,000
Other Selective Sales: $429,000
Other Selective Sales: $399,000
- Total Salaries and Wages: $12,417,000
: $11,455,000
- Water Utilities - Interest on Debt: $1,529,000
Yuba County government finances - Cash and Securities in 2020:
- Assistance and Subsidies - Public Welfare, Cash Assistance Programs - Other: $24,527,000
Public Welfare, Cash Assistance Programs - Other: $21,027,000
- Charges - Other: $30,834,000
Other: $26,842,000
Solid Waste Management: $4,694,000
Elementary and Secondary Education - Other: $1,815,000
Regular Highways: $1,703,000
Regular Highways: $1,660,000
Elementary and Secondary Education - Other: $1,474,000
Solid Waste Management: $1,133,000
Air Transportation: $489,000
Air Transportation: $342,000
Natural Resources - Other: $118,000
Natural Resources - Other: $110,000
Parks and Recreation: $12,000
Elementary and Secondary Education School Lunch: $1,000
- Construction - Electric Utilities: $10,732,000
Electric Utilities: $10,174,000
Elementary and Secondary Education: $999,000
Elementary and Secondary Education: $367,000
Health - Other: $2,000
Water Utilities: $1,000
Water Utilities: $1,000
- Current Operations - Public Welfare - Other: $36,016,000
Public Welfare - Other: $32,989,000
Electric Utilities: $25,923,000
Electric Utilities: $24,678,000
Elementary and Secondary Education: $23,845,000
Water Utilities: $23,426,000
Elementary and Secondary Education: $21,379,000
Correctional Institutions: $19,231,000
Water Utilities: $19,106,000
Police Protection: $13,774,000
Health - Other: $13,101,000
Health - Other: $11,153,000
Regular Highways: $10,332,000
Regular Highways: $10,238,000
General - Other: $9,322,000
General - Other: $8,865,000
Judicial and Legal Services: $8,202,000
Corrections - Other: $7,421,000
Central Staff Services: $6,979,000
Corrections - Other: $6,509,000
Central Staff Services: $6,211,000
Financial Administration: $3,762,000
Financial Administration: $3,361,000
Protective Inspection and Regulation - Other: $2,935,000
Judicial and Legal Services: $2,879,000
Protective Inspection and Regulation - Other: $2,736,000
Natural Resources - Other: $2,530,000
Natural Resources - Other: $1,875,000
Libraries: $847,000
Air Transportation: $515,000
Libraries: $476,000
Air Transportation: $421,000
Police Protection: $324,000
Parks and Recreation: $270,000
Parks and Recreation: $227,000
Correctional Institutions: $24,000
- Federal Intergovernmental - Other: $10,168,000
Other: $5,989,000
Electric Utilities: $3,915,000
Air Transportation: $416,000
Air Transportation: $264,000
Water Utilities: $141,000
Education: $66,000
Natural Resources: $55,000
Natural Resources: $51,000
Electric Utilities: $38,000
Education: $36,000
- General - Interest on Debt: $3,645,000
Interest on Debt: $3,617,000
- Intergovernmental to Local - Other - Elementary and Secondary Education: $10,580,000
Other - Elementary and Secondary Education: $9,227,000
Other - General - Other: $32,000
Other - General - Other: $31,000
- Intergovernmental to State - Judicial and Legal Services: $369,000
Judicial and Legal Services: $316,000
- Local Intergovernmental - Education: $6,570,000
Education: $5,424,000
Other: $3,731,000
Other: $3,534,000
Health and Hospitals: $220,000
- Long Term Debt - Beginning Outstanding - Unspecified Public Purpose: $178,525,000
Outstanding Unspecified Public Purpose: $172,075,000
Outstanding Unspecified Public Purpose: $170,795,000
Beginning Outstanding - Unspecified Public Purpose: $168,116,000
Retired Unspecified Public Purpose: $6,451,000
Issue, Unspecified Public Purpose: $4,063,000
Retired Unspecified Public Purpose: $1,385,000
- Miscellaneous - Fines and Forfeits: $17,792,000
Interest Earnings: $6,165,000
Special Assessments: $3,106,000
Special Assessments: $2,562,000
Interest Earnings: $1,878,000
General Revenue - Other: $1,451,000
General Revenue - Other: $1,110,000
Fines and Forfeits: $997,000
Rents: $197,000
Rents: $105,000
Sale of Property: $26,000
Sale of Property: $26,000
- Other Capital Outlay - Regular Highways: $20,668,000
General - Other: $11,494,000
General - Other: $11,414,000
Elementary and Secondary Education: $653,000
Electric Utilities: $313,000
Police Protection: $268,000
Electric Utilities: $265,000
Public Welfare - Other: $171,000
Regular Highways: $148,000
Health - Other: $108,000
Water Utilities: $75,000
Water Utilities: $69,000
Parks and Recreation: $62,000
Public Welfare - Other: $20,000
Police Protection: $11,000
Health - Other: $11,000
Air Transportation: $10,000
Air Transportation: $9,000
- Other Funds - Cash and Securities: $155,881,000
Cash and Securities: $116,357,000
- Revenue - Electric Utilities: $69,397,000
Electric Utilities: $60,300,000
Water Utilities: $3,743,000
Water Utilities: $555,000
- State Intergovernmental - Public Welfare: $76,740,000
Public Welfare: $68,253,000
Other: $26,179,000
Other: $25,867,000
Education: $24,660,000
Education: $21,703,000
Health and Hospitals: $6,918,000
Highways: $6,700,000
Health and Hospitals: $5,404,000
Water Utilities: $4,075,000
Highways: $4,050,000
Electric Utilities: $958,000
General Local Government Support: $265,000
General Local Government Support: $257,000
Electric Utilities: $143,000
Water Utilities: $38,000
- Tax - Property: $26,111,000
Property: $22,914,000
General Sales and Gross Receipts: $10,490,000
Occupation and Business License - Other: $8,521,000
Occupation and Business License - Other: $5,722,000
General Sales and Gross Receipts: $3,793,000
Public Utilities Sales: $1,976,000
Other License: $1,668,000
Other License: $1,505,000
Public Utilities Sales: $1,499,000
Other: $1,269,000
Documentary and Stock Transfer: $684,000
Other: $645,000
Documentary and Stock Transfer: $523,000
Other Selective Sales: $429,000
Other Selective Sales: $399,000
- Total Salaries and Wages: $12,417,000
: $11,455,000
- Water Utilities - Interest on Debt: $1,529,000
Supplemental Security Income (SSI) in 2006:
- Total number of recipients: 3,912
- Number of aged recipients: 472
- Number of blind and disabled recipients: 3,440
- Number of recipients under 18: 335
- Number of recipients between 18 and 64: 2,645
- Number of recipients older than 64: 932
- Number of recipients also receiving OASDI: 1,639
- Amount of payments (thousands of dollars): 2,295
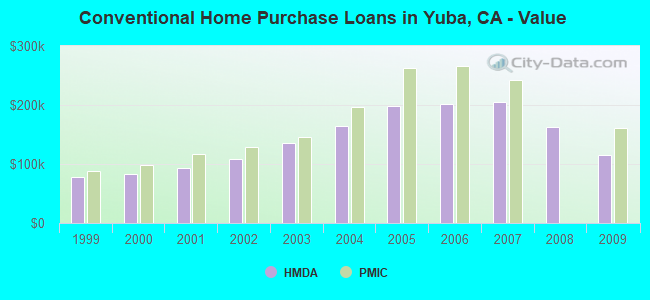
| Home Mortgage Disclosure Act Aggregated Statistics For Year 2009 (Based on 12 full tracts) | ||||||||||||||
| A) FHA, FSA/RHS & VA Home Purchase Loans | B) Conventional Home Purchase Loans | C) Refinancings | D) Home Improvement Loans | E) Loans on Dwellings For 5+ Families | F) Non-occupant Loans on < 5 Family Dwellings (A B C & D) | G) Loans On Manufactured Home Dwelling (A B C & D) | ||||||||
|---|---|---|---|---|---|---|---|---|---|---|---|---|---|---|
| Number | Average Value | Number | Average Value | Number | Average Value | Number | Average Value | Number | Average Value | Number | Average Value | Number | Average Value | |
| LOANS ORIGINATED | 794 | $167,296 | 254 | $114,677 | 570 | $198,347 | 31 | $75,258 | 3 | $165,667 | 159 | $101,881 | 37 | $181,973 |
| APPLICATIONS APPROVED, NOT ACCEPTED | 44 | $160,591 | 23 | $139,043 | 68 | $192,132 | 13 | $76,385 | 0 | $0 | 11 | $109,273 | 6 | $122,333 |
| APPLICATIONS DENIED | 139 | $168,597 | 66 | $138,197 | 374 | $196,602 | 36 | $81,167 | 2 | $595,000 | 60 | $128,183 | 40 | $155,200 |
| APPLICATIONS WITHDRAWN | 86 | $170,279 | 57 | $134,211 | 180 | $201,711 | 14 | $99,500 | 0 | $0 | 33 | $112,636 | 11 | $106,455 |
| FILES CLOSED FOR INCOMPLETENESS | 13 | $173,692 | 8 | $267,125 | 30 | $198,200 | 3 | $87,333 | 0 | $0 | 5 | $126,400 | 2 | $180,000 |
| Private Mortgage Insurance Companies Aggregated Statistics For Year 2009 (Based on 11 full tracts) | ||||||||
| A) Conventional Home Purchase Loans | B) Refinancings | C) Non-occupant Loans on < 5 Family Dwellings (A & B) | D) Loans On Manufactured Home Dwelling (A & B) | |||||
|---|---|---|---|---|---|---|---|---|
| Number | Average Value | Number | Average Value | Number | Average Value | Number | Average Value | |
| LOANS ORIGINATED | 30 | $161,367 | 6 | $279,333 | 2 | $211,000 | 0 | $0 |
| APPLICATIONS APPROVED, NOT ACCEPTED | 5 | $181,400 | 6 | $284,000 | 0 | $0 | 1 | $361,000 |
| APPLICATIONS DENIED | 8 | $217,375 | 4 | $335,000 | 0 | $0 | 0 | $0 |
| APPLICATIONS WITHDRAWN | 1 | $361,000 | 0 | $0 | 0 | $0 | 0 | $0 |
| FILES CLOSED FOR INCOMPLETENESS | 5 | $169,400 | 0 | $0 | 1 | $89,000 | 0 | $0 |
| Most common first names in Yuba County, CA among deceased individuals | ||
| Name | Count | Lived (average) |
|---|---|---|
| John | 310 | 72.2 years |
| William | 271 | 72.5 years |
| James | 261 | 70.6 years |
| Robert | 219 | 69.2 years |
| George | 191 | 73.8 years |
| Mary | 165 | 78.0 years |
| Charles | 156 | 70.5 years |
| Dorothy | 110 | 76.6 years |
| Thomas | 100 | 71.7 years |
| Frank | 93 | 74.2 years |
| Most common last names in Yuba County, CA among deceased individuals | ||
| Last name | Count | Lived (average) |
|---|---|---|
| Smith | 131 | 72.7 years |
| Miller | 88 | 75.3 years |
| Johnson | 87 | 72.6 years |
| Jones | 82 | 72.9 years |
| Davis | 76 | 70.9 years |
| Williams | 76 | 74.1 years |
| Brown | 67 | 72.1 years |
| Wilson | 55 | 74.6 years |
| Thompson | 49 | 76.0 years |
| Anderson | 48 | 76.9 years |
| Businesses in Yuba County, CA | ||||
| Name | Count | Name | Count | |
|---|---|---|---|---|
| 7-Eleven | 3 | Little Caesars Pizza | 1 | |
| Ace Hardware | 3 | McDonald's | 1 | |
| AutoZone | 1 | Motel 6 | 1 | |
| Baymont Inn | 1 | Panda Express | 1 | |
| Burger King | 3 | Pizza Hut | 1 | |
| CVS | 1 | Quiznos | 1 | |
| Carl\s Jr. | 1 | RadioShack | 1 | |
| Circle K | 1 | Rite Aid | 1 | |
| Comfort Suites | 1 | Starbucks | 1 | |
| Curves | 1 | Subway | 7 | |
| DHL | 1 | Super 8 | 1 | |
| Dennys | 1 | T-Mobile | 2 | |
| Domino's Pizza | 1 | Taco Bell | 2 | |
| FedEx | 5 | U-Haul | 3 | |
| H&R Block | 2 | UPS | 6 | |
| Jack In The Box | 1 | Walgreens | 2 | |
| KFC | 1 | Walmart | 1 | |
| Kroger | 1 | |||
Yuba County on our top lists:
- #30 on the list of "Top 101 counties with the highest percentage of residents relocating to other counties in 2011 (pop. 50,000+)"
- #33 on the list of "Top 101 counties with the highest percentage of residents relocating from foreign countries between 2010 and 2011 (pop. 50,000+)"
- #34 on the list of "Top 101 counties with the highest percentage of residents relocating to foreign countries in 2011 (pop. 50,000+)"
- #35 on the list of "Top 101 counties with highest percentage of residents voting for 3rd party candidates in the 2012 Presidential Election (pop. 50,000+)"
- #40 on the list of "Top 101 counties with the lowest surface withdrawal of fresh water for public supply (pop. 50,000+)"
- #42 on the list of "Top 101 counties with the highest percentage of residents relocating from other counties between 2010 and 2011 (pop. 50,000+)"
- #48 on the list of "Top 101 counties with the largest decrease in the number of deaths per 1000 residents 2000-2006 to 2007-2013 (pop. 50,000+)"
- #51 on the list of "Top 101 counties with the highest percentage of residents relocating to foreign countries in 2011"
- #54 on the list of "Top 101 counties with the highest percentage of residents relocating from foreign countries between 2010 and 2011"
- #69 on the list of "Top 101 counties with the smallest number of people without health insurance coverage in 2000 (pop. 50,000+)"
- #81 on the list of "Top 101 counties with the highest percentage of residents relocating to other counties in 2011"
- #93 on the list of "Top 101 counties with the highest percentage of residents relocating from other counties between 2010 and 2011"