Wheatland, California
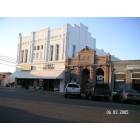
Wheatland: Downtown Wheatland
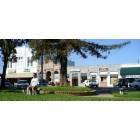
Wheatland: Historic Downtown Wheatland
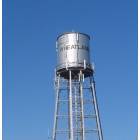
Wheatland: Water Tower
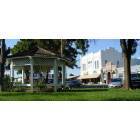
Wheatland: Gazebo in Historic Downtown Wheatland
- add
your
Submit your own pictures of this city and show them to the world
- OSM Map
- General Map
- Google Map
- MSN Map
Population change since 2000: +66.5%
| Males: 1,719 | |
| Females: 2,070 |
| Median resident age: | 40.3 years |
| California median age: | 37.9 years |
Zip codes: 95692.
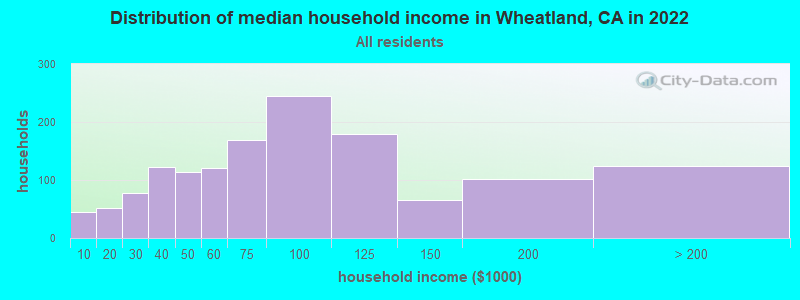
| Wheatland: | $75,097 |
| CA: | $91,551 |
Estimated per capita income in 2022: $38,383 (it was $14,889 in 2000)
Wheatland city income, earnings, and wages data
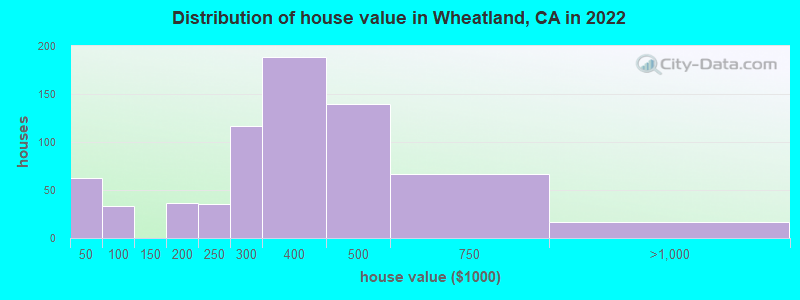
Estimated median house or condo value in 2022: $402,779 (it was $104,100 in 2000)
| Wheatland: | $402,779 |
| CA: | $715,900 |
Mean prices in 2022: all housing units: $354,321; detached houses: $351,542
Median gross rent in 2022: $1,363.
(5.8% for White Non-Hispanic residents, 7.7% for Hispanic or Latino residents, 11.8% for other race residents, 0.8% for two or more races residents)
Detailed information about poverty and poor residents in Wheatland, CA


Compare current foreclosures near Wheatland, CA:
| Photo | Address | Area | Beds / Baths | Price | Details |
|---|---|---|---|---|---|

|
#1
Brock Dr
Wheatland, CA 95692
|
1,651 sq. feet
|
2 baths 4 beds |
show details | |

|
#2
1st St
Wheatland, CA 95692
|
912 sq. feet
|
3 baths 4 beds |
show details | |

|
#3
Mcdevitt Dr
Wheatland, CA 95692
|
1,878 sq. feet
|
2 baths 4 beds |
show details | |

|
#4
Spenceville Rd # 207
Wheatland, CA 95692
|
- sq. feet
|
- baths - beds |
show details | |

|
#5
Wheatland Rd
Wheatland, CA 95692
|
- sq. feet
|
- baths - beds |
show details | |

|
#6
Camp Far West Rd
Sheridan, CA 95681
|
1,404 sq. feet
|
2 baths 3 beds |
$330,000
|
show details |

|
#7
Freeman St
Marysville, CA 95901
|
1,152 sq. feet
|
1 baths 3 beds |
show details | |

|
#8
E 22nd St
Marysville, CA 95901
|
1,176 sq. feet
|
2 baths 3 beds |
show details | |

|
#9
Chestnut St
Yuba City, CA 95991
|
640 sq. feet
|
1 baths 2 beds |
show details | |

|
#10
Norby Ct
Olivehurst, CA 95961
|
3,210 sq. feet
|
3 baths 5 beds |
show details |
| Photo | Address | Area | Beds / Baths | Price | Details |
|---|---|---|---|---|---|

|
#11
Perrara Ct
Roseville, CA 95747
|
- sq. feet
|
2 baths 4 beds |
show details | |

|
#12
Mount Darwin Ct
Roseville, CA 95747
|
2,573 sq. feet
|
2 baths 4 beds |
show details | |

|
#13
Barnwood Ln
Roseville, CA 95747
|
3,120 sq. feet
|
3 baths 5 beds |
show details | |

|
#14
246 Lariat
Lincoln, CA 95648
|
1,815 sq. feet
|
2 baths 2 beds |
show details | |

|
#15
Talon Rd
Rocklin, CA 95765
|
1,806 sq. feet
|
2 baths 4 beds |
show details | |

|
#16
Elmer Ave
Yuba City, CA 95993
|
- sq. feet
|
2 baths 3 beds |
show details | |

|
#17
Red Clover Way
Lincoln, CA 95648
|
1,343 sq. feet
|
2 baths 3 beds |
show details | |

|
#18
Turkey Hollow Trl
Browns Valley, CA 95918
|
2,117 sq. feet
|
2 baths 3 beds |
show details | |

|
#19
Colusa Hwy
Yuba City, CA 95993
|
2,586 sq. feet
|
2 baths 4 beds |
show details | |

|
#20
Erle Rd
Marysville, CA 95901
|
1,224 sq. feet
|
1 baths 3 beds |
show details |
| Photo | Address | Area | Beds / Baths | Price | Details |
|---|---|---|---|---|---|

|
#21
Covillaud St
Marysville, CA 95901
|
2,278 sq. feet
|
3 baths 3 beds |
show details | |

|
#22
Sevilla Dr
Roseville, CA 95747
|
2,284 sq. feet
|
3 baths 4 beds |
show details | |

|
#23
Pico Rivera Dr
Roseville, CA 95747
|
3,071 sq. feet
|
3 baths 5 beds |
show details | |

|
#24
Whitney Ranch Pkw 914
Rocklin, CA 95765
|
898 sq. feet
|
2 baths 2 beds |
show details | |

|
#25
Whitney Ranch Pkwy Unit 1233
Rocklin, CA 95765
|
1,050 sq. feet
|
2 baths 3 beds |
show details | |

|
#26
Longspur Loop
Lincoln, CA 95648
|
1,655 sq. feet
|
2 baths 2 beds |
show details | |

|
#27
Longspur Loop
Lincoln, CA 95648
|
1,836 sq. feet
|
2 baths 2 beds |
show details | |

|
#28
State Highway 70
Marysville, CA 95901
|
2,670 sq. feet
|
3 baths 3 beds |
show details | |

|
#29
State Highway 70
Marysville, CA 95901
|
2,670 sq. feet
|
3 baths 3 beds |
show details | |

|
#30
Paseo Penasco
Roseville, CA 95747
|
2,023 sq. feet
|
2 baths 4 beds |
show details |
| Photo | Address | Area | Beds / Baths | Price | Details |
|---|---|---|---|---|---|

|
#31
Cattail Ct
Lincoln, CA 95648
|
2,871 sq. feet
|
3 baths 4 beds |
show details | |

|
#32
Summit Dr
Rocklin, CA 95765
|
2,113 sq. feet
|
2 baths 4 beds |
show details | |

|
#33
Mary Rose Ln
Lincoln, CA 95648
|
1,473 sq. feet
|
2 baths 2 beds |
show details | |

|
#34
Hidden Hills Ln
Lincoln, CA 95648
|
1,515 sq. feet
|
2 baths 2 beds |
show details | |

|
#35
Freeman St
Marysville, CA 95901
|
1,275 sq. feet
|
1 baths 3 beds |
show details | |

|
#36
Hidden Hills Ln
Lincoln, CA 95648
|
1,813 sq. feet
|
2 baths 2 beds |
show details | |

|
#37
Cook St
Rocklin, CA 95765
|
2,113 sq. feet
|
2 baths 4 beds |
show details | |

|
#38
Sampson St
Marysville, CA 95901
|
1,322 sq. feet
|
1 baths 2 beds |
show details | |

|
#39
Sunset Blvd W
Roseville, CA 95747
|
1,520 sq. feet
|
2 baths 2 beds |
show details | |

|
#40
Buchanan St
Marysville, CA 95901
|
979 sq. feet
|
1 baths 3 beds |
show details |
| Photo | Address | Area | Beds / Baths | Price | Details |
|---|---|---|---|---|---|

|
#41
Edwards St
Marysville, CA 95901
|
1,300 sq. feet
|
2 baths 3 beds |
show details | |

|
#42
Hobart Dr
Marysville, CA 95901
|
1,487 sq. feet
|
2 baths 3 beds |
show details | |

|
#43
Parker St
Rocklin, CA 95765
|
1,417 sq. feet
|
2 baths 3 beds |
show details | |

|
#44
Cheim Blvd # 15
Marysville, CA 95901
|
1,206 sq. feet
|
2 baths 3 beds |
show details | |

|
#45
E 19th St
Marysville, CA 95901
|
1,388 sq. feet
|
2 baths 3 beds |
show details | |

|
#46
Meadow View Ln
Auburn, CA 95602
|
1,484 sq. feet
|
2 baths 3 beds |
show details | |

|
#47
E 16th St
Marysville, CA 95901
|
936 sq. feet
|
1 baths 2 beds |
show details | |

|
#48
Bryden Way
Marysville, CA 95901
|
1,188 sq. feet
|
1 baths 3 beds |
show details | |

|
#49
El Capitan Ct
Lincoln, CA 95648
|
2,176 sq. feet
|
2 baths 3 beds |
show details | |

|
Check over 1 million property listings on Foreclosure.com!
|
browse all offers | |||


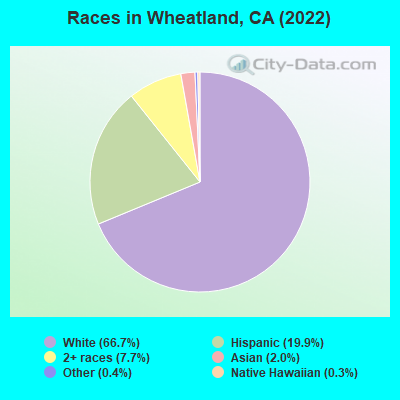
- 2,54966.7%White alone
- 76019.9%Hispanic
- 2947.7%Two or more races
- 752.0%Asian alone
- 160.4%Other race alone
- 110.3%Native Hawaiian and Other
Pacific Islander alone - 30.08%Black alone
According to our research of California and other state lists, there were 5 registered sex offenders living in Wheatland, California as of April 28, 2024.
The ratio of all residents to sex offenders in Wheatland is 737 to 1.
The ratio of registered sex offenders to all residents in this city is near the state average.
Type |
2009 |
2010 |
2011 |
2012 |
2013 |
2014 |
2015 |
2016 |
2017 |
2018 |
2019 |
2020 |
2022 |
|---|---|---|---|---|---|---|---|---|---|---|---|---|---|
| Murders (per 100,000) | 0 (0.0) | 0 (0.0) | 0 (0.0) | 0 (0.0) | 0 (0.0) | 0 (0.0) | 0 (0.0) | 0 (0.0) | 0 (0.0) | 0 (0.0) | 0 (0.0) | 0 (0.0) | 0 (0.0) |
| Rapes (per 100,000) | 0 (0.0) | 1 (28.9) | 0 (0.0) | 1 (28.5) | 0 (0.0) | 0 (0.0) | 0 (0.0) | 0 (0.0) | 0 (0.0) | 0 (0.0) | 0 (0.0) | 1 (25.5) | 0 (0.0) |
| Robberies (per 100,000) | 0 (0.0) | 0 (0.0) | 0 (0.0) | 0 (0.0) | 0 (0.0) | 1 (28.4) | 0 (0.0) | 0 (0.0) | 2 (52.2) | 0 (0.0) | 1 (25.4) | 2 (51.1) | 0 (0.0) |
| Assaults (per 100,000) | 4 (106.1) | 4 (115.7) | 8 (228.8) | 1 (28.5) | 0 (0.0) | 3 (85.2) | 1 (28.7) | 12 (317.9) | 4 (104.4) | 3 (77.1) | 5 (126.9) | 4 (102.1) | 0 (0.0) |
| Burglaries (per 100,000) | 17 (450.8) | 9 (260.4) | 18 (514.7) | 6 (171.0) | 16 (454.3) | 9 (255.6) | 14 (402.1) | 13 (344.4) | 10 (261.0) | 9 (231.2) | 8 (203.0) | 8 (204.3) | 7 (184.0) |
| Thefts (per 100,000) | 39 (1,034) | 34 (983.8) | 31 (886.5) | 25 (712.5) | 28 (795.0) | 40 (1,136) | 34 (976.5) | 28 (741.7) | 22 (574.3) | 29 (745.1) | 26 (659.9) | 39 (995.9) | 26 (683.5) |
| Auto thefts (per 100,000) | 1 (26.5) | 5 (144.7) | 3 (85.8) | 5 (142.5) | 5 (142.0) | 1 (28.4) | 11 (315.9) | 7 (185.4) | 5 (130.5) | 11 (282.6) | 9 (228.4) | 7 (178.8) | 6 (157.7) |
| Arson (per 100,000) | 0 (0.0) | 0 (0.0) | 0 (0.0) | 2 (57.0) | 0 (0.0) | 0 (0.0) | 0 (0.0) | 1 (26.5) | 1 (26.1) | 1 (25.7) | 0 (0.0) | 0 (0.0) | 1 (26.3) |
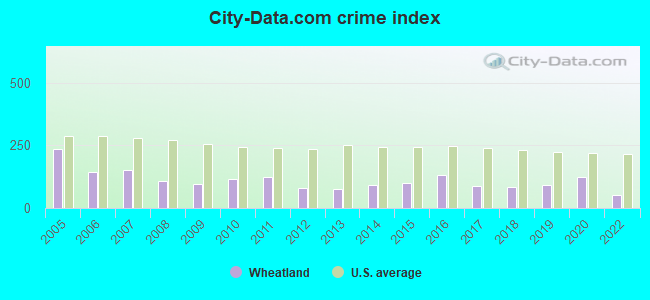
| City-Data.com crime index | 96.3 | 115.5 | 124.1 | 80.4 | 75.0 | 91.2 | 98.2 | 132.2 | 88.2 | 84.0 | 91.9 | 124.6 | 52.8 |
The City-Data.com crime index weighs serious crimes and violent crimes more heavily. Higher means more crime, U.S. average is 246.1. It adjusts for the number of visitors and daily workers commuting into cities.
Crime rate in Wheatland detailed stats: murders, rapes, robberies, assaults, burglaries, thefts, arson
Full-time law enforcement employees in 2021, including police officers: 9 (8 officers - 8 male; 0 female).
| Officers per 1,000 residents here: | 2.17 |
| California average: | 2.30 |
 Recent articles from our blog. Our writers, many of them Ph.D. graduates or candidates, create easy-to-read articles on a wide variety of topics.

 | What is it like living in Sacramento? (86 replies) |
| Nice family with a section 8 voucher but I have bad credit. Can't find anything. (13 replies) |
| Is Placer County a good place for Conservatives? (29 replies) |
| Undiscovered town in California (56 replies) |
| Reasons Not to Move To California (288 replies) |
| Curtis Park New Shopping Center Controversy (64 replies) |
Latest news from Wheatland, CA collected exclusively by city-data.com from local newspapers, TV, and radio stations
Ancestries: German (14.0%), English (8.4%), American (5.5%), Italian (4.6%), French (4.4%), Irish (4.2%).
Current Local Time: PST time zone
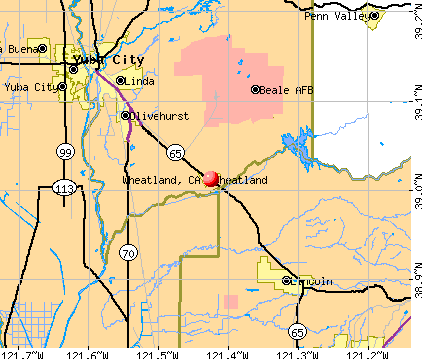
Elevation: 87 feet
Land area: 0.76 square miles.
Population density: 5,009 people per square mile (average).
206 residents are foreign born (4.1% Latin America, 1.0% Asia).
| This city: | 5.4% |
| California: | 26.5% |
Median real estate property taxes paid for housing units with mortgages in 2022: $2,916 (0.7%)
Median real estate property taxes paid for housing units with no mortgage in 2022: $2,097 (0.6%)
Nearest city with pop. 50,000+: Loomis Basin-Folsom Lake, CA  (19.4 miles , pop. 67,397).
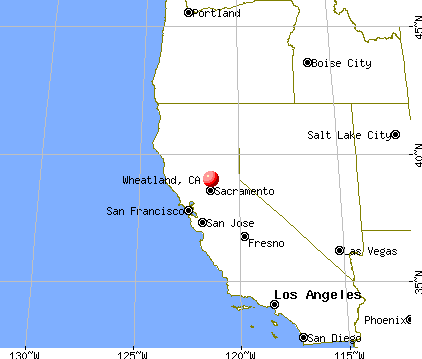
Nearest city with pop. 200,000+: Sacramento, CA (31.7 miles , pop. 407,018).
Nearest city with pop. 1,000,000+: Los Angeles, CA (380.5 miles , pop. 3,694,820).
Nearest cities:
), ), ), ), ), )Latitude: 39.01 N, Longitude: 121.43 W
Area code: 530
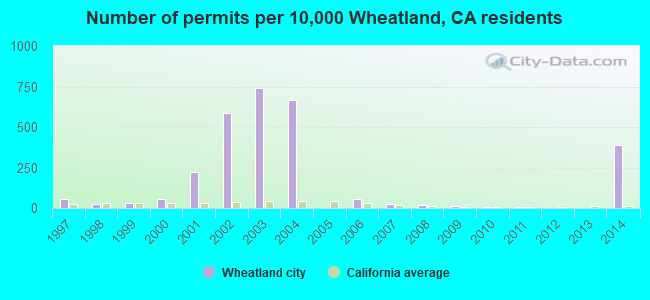
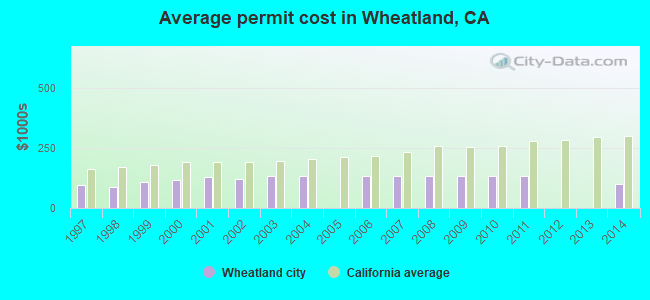
Single-family new house construction building permits:
- 2014: 88 buildings, average cost: $101,400
- 2011: 1 building, cost: $130,600
- 2010: 2 buildings, average cost: $130,600
- 2009: 3 buildings, average cost: $130,600
- 2008: 4 buildings, average cost: $130,600
- 2007: 5 buildings, average cost: $130,600
- 2006: 12 buildings, average cost: $130,600
- 2004: 151 buildings, average cost: $130,600
- 2003: 169 buildings, average cost: $131,200
- 2002: 134 buildings, average cost: $121,800
- 2001: 50 buildings, average cost: $129,000
- 2000: 13 buildings, average cost: $114,600
- 1999: 7 buildings, average cost: $107,900
- 1998: 5 buildings, average cost: $86,700
- 1997: 13 buildings, average cost: $95,900
| Here: | 7.1% |
| California: | 5.1% |
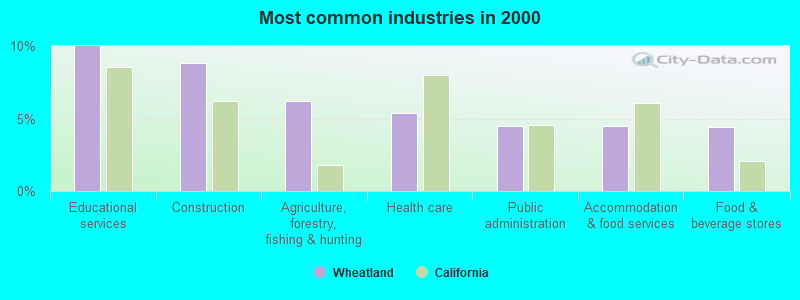
- Educational services (10.0%)
- Construction (8.8%)
- Agriculture, forestry, fishing & hunting (6.2%)
- Health care (5.4%)
- Public administration (4.5%)
- Accommodation & food services (4.5%)
- Food & beverage stores (4.4%)
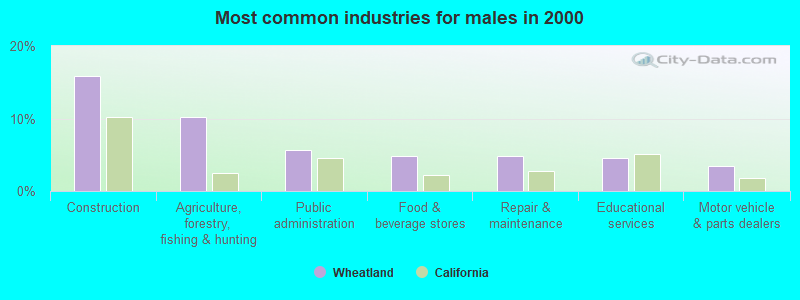
- Construction (15.8%)
- Agriculture, forestry, fishing & hunting (10.2%)
- Public administration (5.6%)
- Food & beverage stores (4.8%)
- Repair & maintenance (4.8%)
- Educational services (4.6%)
- Motor vehicle & parts dealers (3.5%)
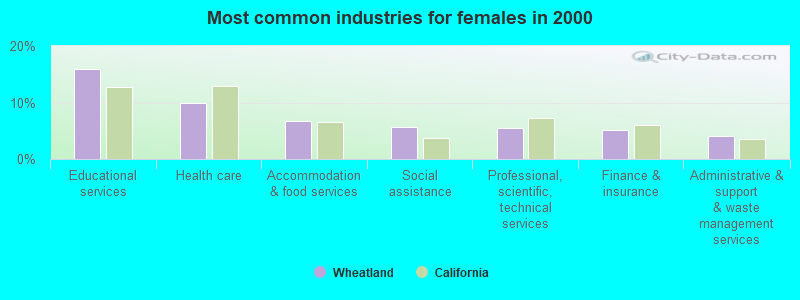
- Educational services (16.0%)
- Health care (9.9%)
- Accommodation & food services (6.8%)
- Social assistance (5.6%)
- Professional, scientific, technical services (5.4%)
- Finance & insurance (5.2%)
- Administrative & support & waste management services (4.0%)
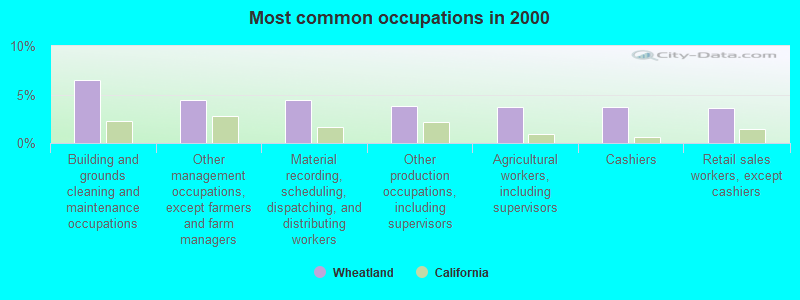
- Building and grounds cleaning and maintenance occupations (6.5%)
- Other management occupations, except farmers and farm managers (4.4%)
- Material recording, scheduling, dispatching, and distributing workers (4.4%)
- Other production occupations, including supervisors (3.8%)
- Agricultural workers, including supervisors (3.7%)
- Cashiers (3.7%)
- Retail sales workers, except cashiers (3.6%)
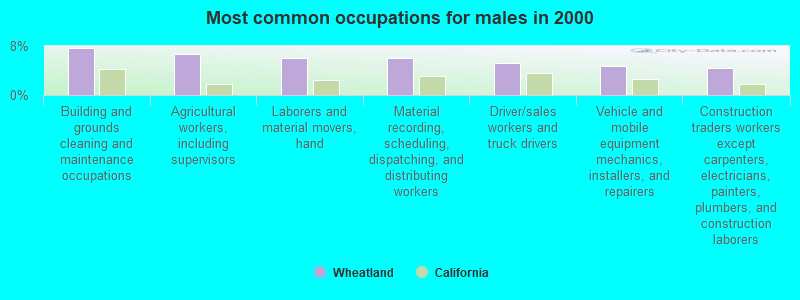
- Building and grounds cleaning and maintenance occupations (7.6%)
- Agricultural workers, including supervisors (6.7%)
- Laborers and material movers, hand (6.1%)
- Material recording, scheduling, dispatching, and distributing workers (6.1%)
- Driver/sales workers and truck drivers (5.2%)
- Vehicle and mobile equipment mechanics, installers, and repairers (4.8%)
- Construction traders workers except carpenters, electricians, painters, plumbers, and construction laborers (4.3%)
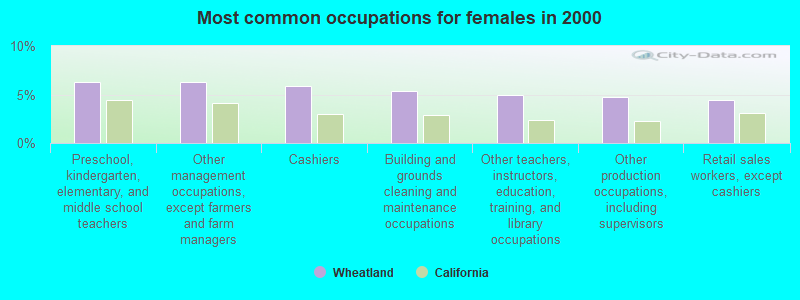
- Preschool, kindergarten, elementary, and middle school teachers (6.3%)
- Other management occupations, except farmers and farm managers (6.3%)
- Cashiers (5.9%)
- Building and grounds cleaning and maintenance occupations (5.4%)
- Other teachers, instructors, education, training, and library occupations (4.9%)
- Other production occupations, including supervisors (4.7%)
- Retail sales workers, except cashiers (4.5%)
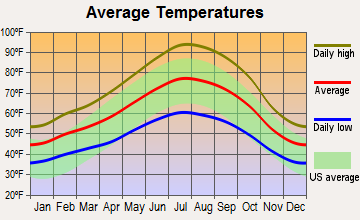
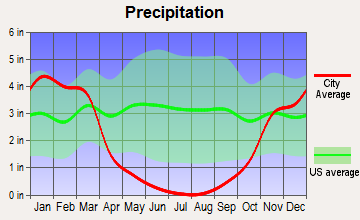
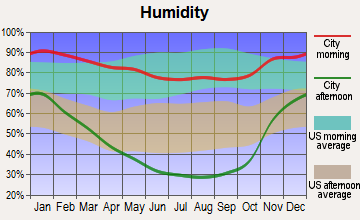
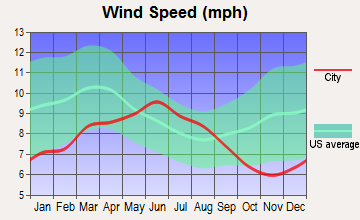
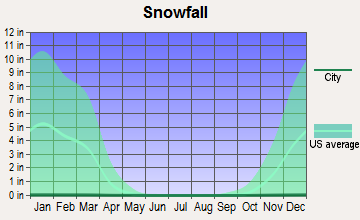
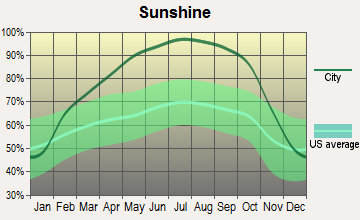
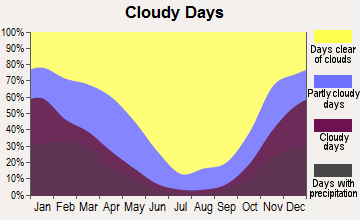
Average climate in Wheatland, California
Based on data reported by over 4,000 weather stations
|
|

(lower is better)
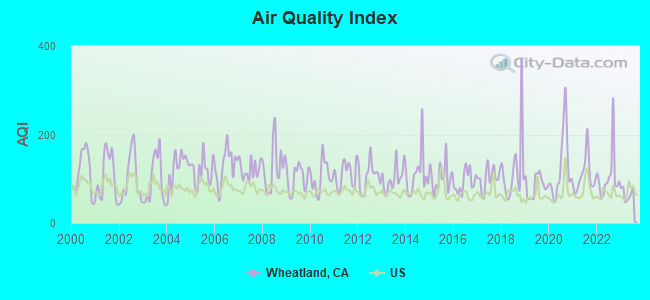
Air Quality Index (AQI) level in 2023 was 65.5. This is about average.
| City: | 65.5 |
| U.S.: | 72.6 |
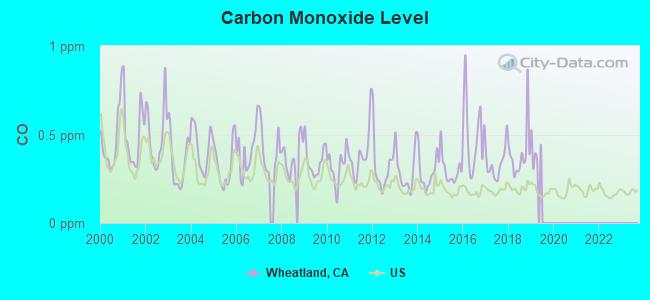
Carbon Monoxide (CO) [ppm] level in 2018 was 0.390. This is significantly worse than average. Closest monitor was 13.6 miles away from the city center.
| City: | 0.390 |
| U.S.: | 0.251 |
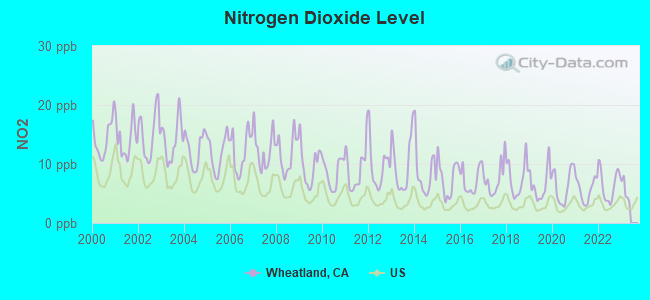
Nitrogen Dioxide (NO2) [ppb] level in 2022 was 6.45. This is worse than average. Closest monitor was 13.6 miles away from the city center.
| City: | 6.45 |
| U.S.: | 5.11 |
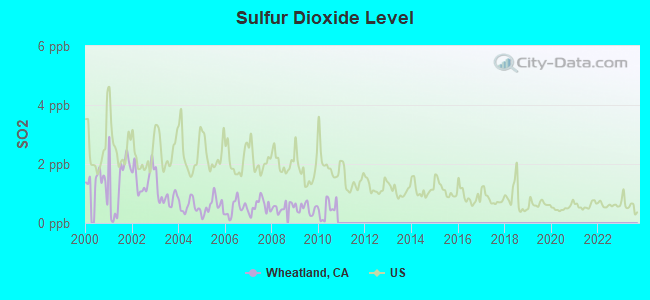
Sulfur Dioxide (SO2) [ppb] level in 2010 was 0.459. This is significantly better than average. Closest monitor was 20.9 miles away from the city center.
| City: | 0.459 |
| U.S.: | 1.515 |
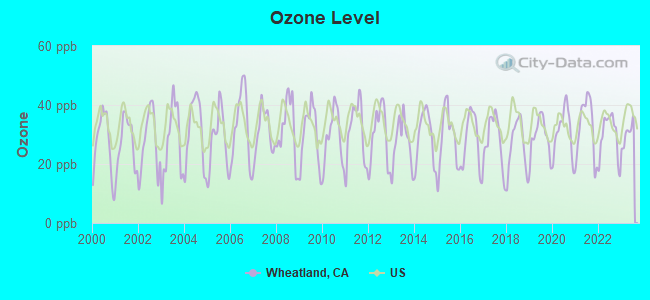
Ozone [ppb] level in 2023 was 30.2. This is about average. Closest monitor was 10.6 miles away from the city center.
| City: | 30.2 |
| U.S.: | 33.3 |
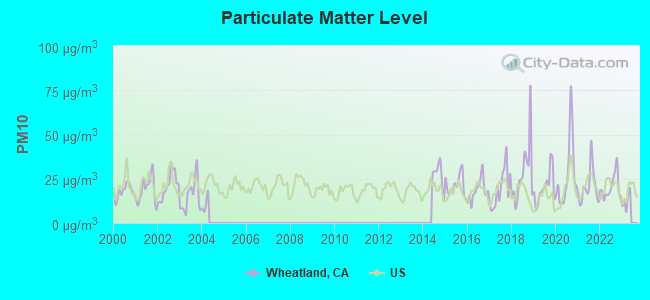
Particulate Matter (PM10) [µg/m3] level in 2022 was 20.2. This is about average. Closest monitor was 10.6 miles away from the city center.
| City: | 20.2 |
| U.S.: | 19.2 |
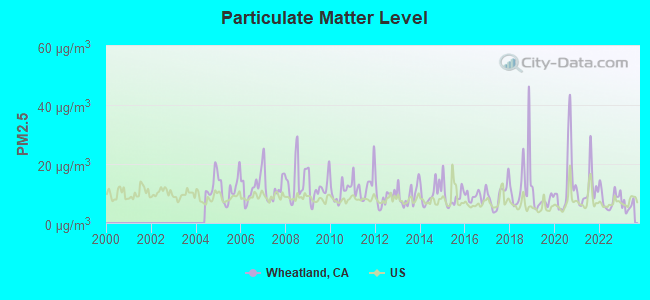
Particulate Matter (PM2.5) [µg/m3] level in 2023 was 5.70. This is significantly better than average. Closest monitor was 13.6 miles away from the city center.
| City: | 5.70 |
| U.S.: | 8.11 |
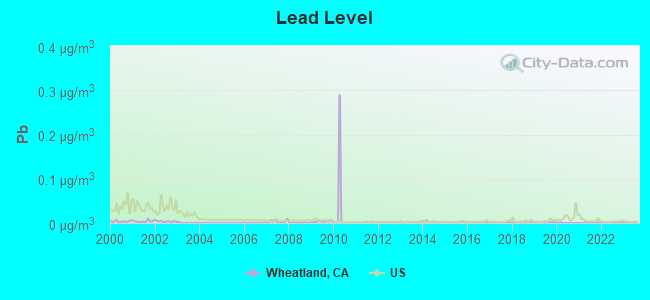
Lead (Pb) [µg/m3] level in 2023 was 0.00140. This is significantly better than average. Closest monitor was 20.3 miles away from the city center.
| City: | 0.00140 |
| U.S.: | 0.00931 |
Earthquake activity:
Wheatland-area historical earthquake activity is significantly above California state average. It is 7373% greater than the overall U.S. average.On 4/18/1906 at 13:12:21, a magnitude 7.9 (7.9 UK, Class: Major, Intensity: VIII - XII) earthquake occurred 110.3 miles away from Wheatland center, causing $524,000,000 total damage
On 10/3/1915 at 06:52:48, a magnitude 7.6 (7.6 UK) earthquake occurred 232.7 miles away from the city center
On 1/31/1922 at 13:17:28, a magnitude 7.6 (7.6 UK) earthquake occurred 248.3 miles away from Wheatland center
On 10/18/1989 at 00:04:15, a magnitude 7.1 (6.5 MB, 7.1 MS, 6.9 MW, 7.0 ML) earthquake occurred 132.9 miles away from the city center, causing 62 deaths (62 shaking deaths) and 3757 injuries, causing $1,305,032,704 total damage
On 4/25/1992 at 18:06:04, a magnitude 7.2 (6.3 MB, 7.1 MS, 7.2 MW, 7.1 MW, Depth: 9.4 mi) earthquake occurred 168.4 miles away from the city center, causing $75,000,000 total damage
On 12/21/1932 at 06:10:09, a magnitude 7.2 (7.2 UK) earthquake occurred 183.5 miles away from Wheatland center
Magnitude types: body-wave magnitude (MB), local magnitude (ML), surface-wave magnitude (MS), moment magnitude (MW)
Natural disasters:
The number of natural disasters in Yuba County (22) is greater than the US average (15).Major Disasters (Presidential) Declared: 12
Emergencies Declared: 3
Causes of natural disasters: Floods: 12, Fires: 6, Storms: 6, Winter Storms: 5, Landslides: 3, Mudslides: 3, Drought: 1, Freeze: 1, Heavy Rain: 1, Hurricane: 1, Tornado: 1, Other: 1 (Note: some incidents may be assigned to more than one category).
Hospitals and medical centers near Wheatland:
- RIDEOUT MEMORIAL HOSPITAL Acute Care Hospitals (about 13 miles away; MARYSVILLE, CA)
- MARYSVILLE CARE CENTER (Nursing Home, about 13 miles away; MARYSVILLE, CA)
- MARYSVILLE DIALYSIS CENTER (Dialysis Facility, about 13 miles away; MARYSVILLE, CA)
- SUTTER NORTH HOME HEALTH (Home Health Center, about 14 miles away; YUBA CITY, CA)
- SUTTER SURGICAL HOSPITAL - NORTH VALLEY Acute Care Hospitals (about 14 miles away; YUBA CITY, CA)
- FREMONT MEDICAL CENTER (Hospital, about 14 miles away; YUBA CITY, CA)
- FREMONT-RIDEOUT HOME HEALTH (Home Health Center, about 14 miles away; YUBA CITY, CA)
Amtrak stations near Wheatland:
- 13 miles: MARYSVILLE (6TH & A STS.) - Bus Station
- 19 miles: ROCKLIN (ROCKLIN RD. & RAILROAD AVE.) - Bus Station . Services: partially wheelchair accessible, free short-term parking.
- 20 miles: ROSEVILLE (201 PACIFIC ST.) . Services: partially wheelchair accessible, public payphones, free short-term parking, free long-term parking, taxi stand, intercity bus service.
Colleges/universities with over 2000 students nearest to Wheatland:
- Yuba College (about 10 miles; Marysville, CA; Full-time enrollment: 4,737)
- Sierra College (about 20 miles; Rocklin, CA; FT enrollment: 11,488)
- American River College (about 26 miles; Sacramento, CA; FT enrollment: 20,452)
- Universal Technical Institute of Northern California Inc (about 26 miles; Sacramento, CA; FT enrollment: 3,193)
- University of Phoenix-Sacramento Valley Campus (about 28 miles; Sacramento, CA; FT enrollment: 2,855)
- Folsom Lake College (about 30 miles; Folsom, CA; FT enrollment: 5,308)
- California State University-Sacramento (about 32 miles; Sacramento, CA; FT enrollment: 22,234)
Public high schools in Wheatland:
- WHEATLAND UNION HIGH (Students: 534, Location: 1010 WHEATLAND RD., Grades: 9-12)
- WHEATLAND COMMUNITY DAY HIGH (Location: 1010 WHEATLAND RD., Grades: 7-12)
Public elementary/middle schools in Wheatland:
- BEAR RIVER (Students: 386, Location: 100 WHEATLAND PARK DR., Grades: 4-8)
- WHEATLAND ELEMENTARY (Students: 252, Location: 111 HOOPER ST., Grades: KG-3)
User-submitted facts and corrections:
- Justin Evans is from wheatland. he is the greateast person to come from your town.
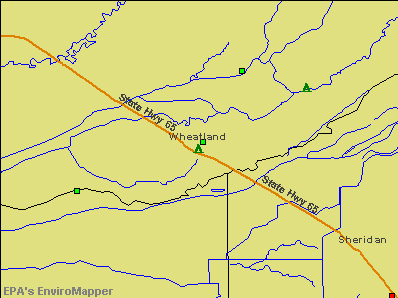
Points of interest:
Notable locations in Wheatland: Wheatland City Hall (A), Wheatland Fire Department Station 3 (B). Display/hide their locations on the map
Church in Wheatland: First Christian Church (A). Display/hide its location on the map
Birthplace of: Lawrence Wright - College basketball player (Bradley Braves).
Drinking water stations with addresses in Wheatland and their reported violations in the past:
RED HILL SALOON (Population served: 25, Groundwater):Past health violations:Past monitoring violations:
- MCL, Monthly (TCR) - Between JAN-2012 and MAR-2012, Contaminant: Coliform. Follow-up actions: St AO (w/o penalty) issued (FEB-09-2012), St Compliance achieved (FEB-13-2012)
- One routine major monitoring violation
| This city: | 2.8 people |
| California: | 2.9 people |
| This city: | 75.1% |
| Whole state: | 68.7% |
| This city: | 6.7% |
| Whole state: | 7.2% |
Likely homosexual households (counted as self-reported same-sex unmarried-partner households)
- Lesbian couples: 0.1% of all households
- Gay men: 0.0% of all households
Banks with branches in Wheatland (2011 data):
- Umpqua Bank: Wheatland Branch at 114 D Street, branch established on 1997/03/10. Info updated 2011/09/02: Bank assets: $11,556.7 mil, Deposits: $9,325.3 mil, headquarters in Roseburg, OR, positive income, Commercial Lending Specialization, 193 total offices, Holding Company: Umpqua Holdings Corporation
For population 15 years and over in Wheatland:
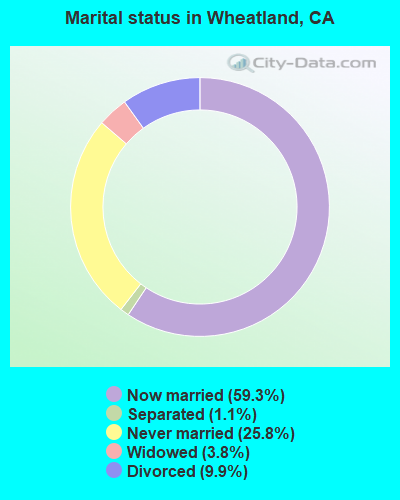
- Never married: 25.8%
- Now married: 59.3%
- Separated: 1.1%
- Widowed: 3.8%
- Divorced: 9.9%
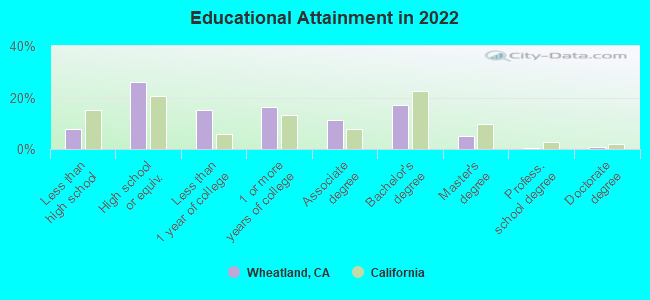
For population 25 years and over in Wheatland:
- High school or higher: 91.6%
- Bachelor's degree or higher: 21.4%
- Graduate or professional degree: 7.1%
- Unemployed: 11.0%
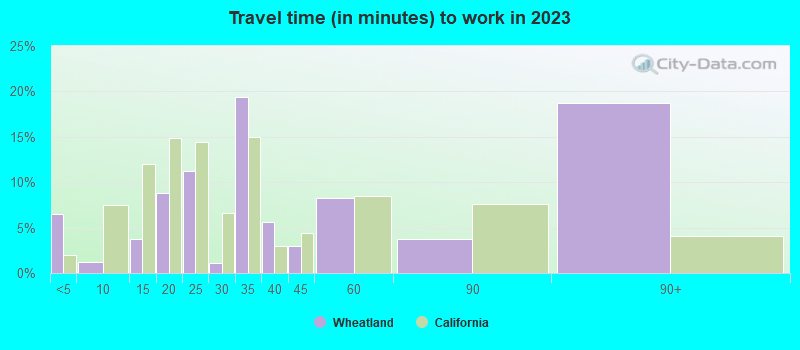
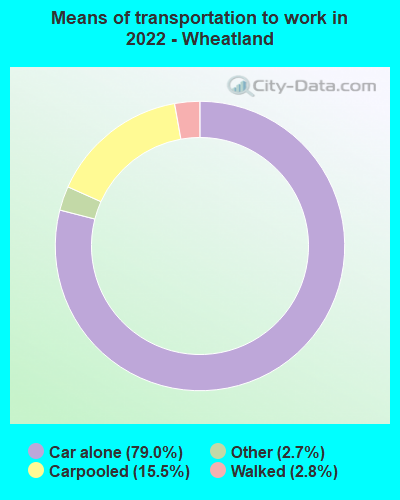
- Mean travel time to work (commute): 31.6 minutes
| Here: | 10.3 |
| California average: | 15.5 |
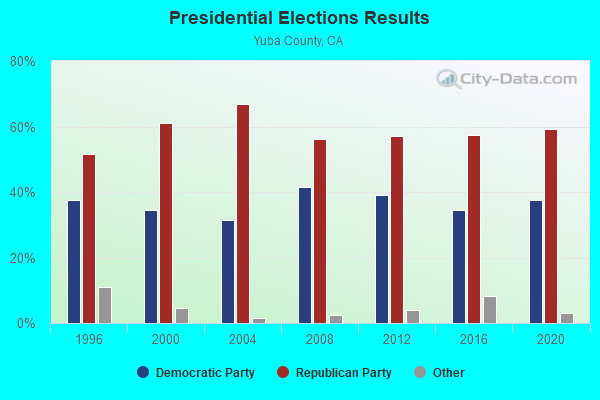
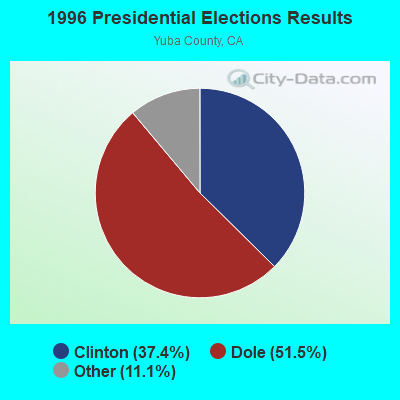
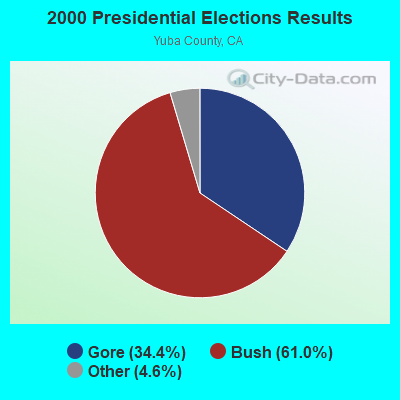
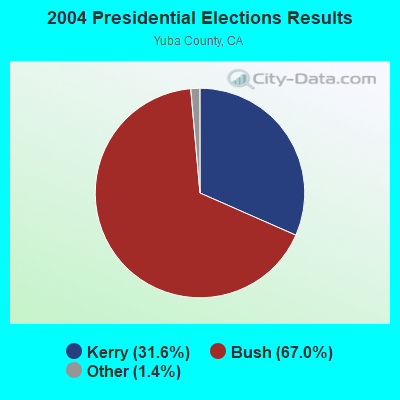
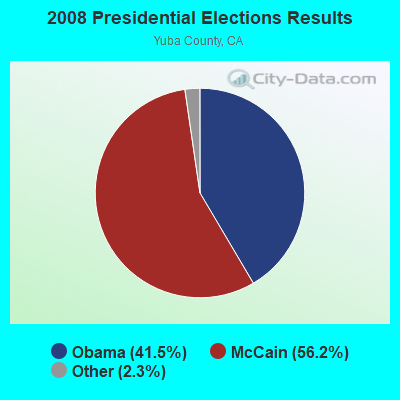
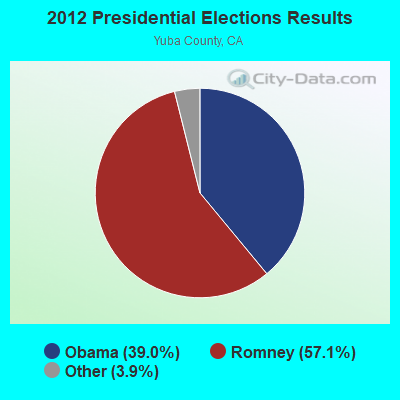
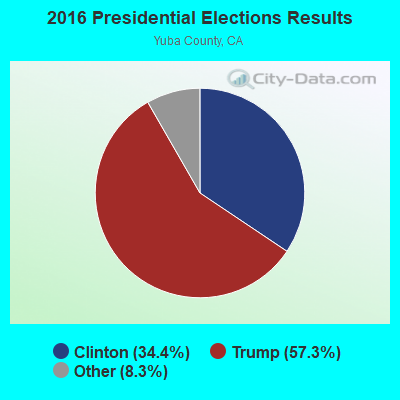
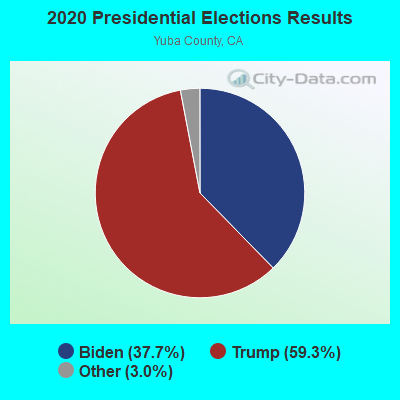
Graphs represent county-level data. Detailed 2008 Election Results
Religion statistics for Wheatland, CA (based on Yuba County data)
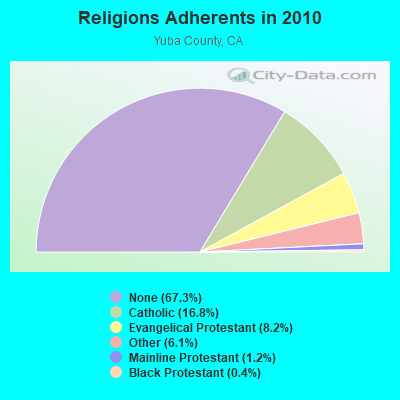
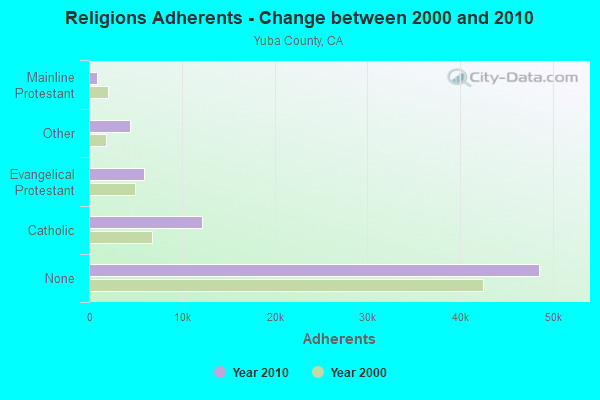
| Religion | Adherents | Congregations |
|---|---|---|
| Catholic | 12,138 | 3 |
| Evangelical Protestant | 5,904 | 46 |
| Other | 4,406 | 9 |
| Mainline Protestant | 891 | 7 |
| Black Protestant | 266 | 1 |
| None | 48,550 | - |
Food Environment Statistics:
| Yuba County: | 1.81 / 10,000 pop. |
| State: | 2.14 / 10,000 pop. |
| Yuba County: | 0.14 / 10,000 pop. |
| State: | 0.04 / 10,000 pop. |
| Yuba County: | 0.84 / 10,000 pop. |
| California: | 0.62 / 10,000 pop. |
| Yuba County: | 2.09 / 10,000 pop. |
| State: | 1.49 / 10,000 pop. |
| Yuba County: | 4.04 / 10,000 pop. |
| California: | 7.42 / 10,000 pop. |
| Here: | 7.2% |
| California: | 7.3% |
| This county: | 27.4% |
| California: | 21.3% |
| Yuba County: | 16.4% |
| California: | 17.9% |
Health and Nutrition:
| This city: | 50.7% |
| California: | 49.4% |
| Wheatland: | 48.3% |
| California: | 48.0% |
| Wheatland: | 28.4 |
| California: | 28.1 |
| This city: | 19.7% |
| State: | 20.2% |
| Here: | 11.2% |
| California: | 11.2% |
| This city: | 6.9 |
| California: | 6.8 |
| Wheatland: | 33.4% |
| California: | 31.5% |
| This city: | 56.1% |
| California: | 56.4% |
| Wheatland: | 79.5% |
| California: | 80.9% |
More about Health and Nutrition of Wheatland, CA Residents
| Local government employment and payroll (March 2022) | |||||
| Function | Full-time employees | Monthly full-time payroll | Average yearly full-time wage | Part-time employees | Monthly part-time payroll |
|---|---|---|---|---|---|
| Police Protection - Officers | 8 | $58,131 | $87,197 | 3 | $1,455 |
| Parks and Recreation | 3 | $11,376 | $45,504 | 0 | $0 |
| Financial Administration | 3 | $12,841 | $51,364 | 3 | $19,964 |
| Sewerage | 2 | $10,342 | $62,052 | 1 | $1,554 |
| Other Government Administration | 1 | $6,027 | $72,324 | 11 | $6,311 |
| Water Supply | 1 | $6,728 | $80,736 | 1 | $5,135 |
| Police - Other | 0 | $0 | 2 | $6,056 | |
| Totals for Government | 18 | $105,445 | $70,297 | 21 | $40,476 |
Wheatland government finances - Expenditure in 2017 (per resident):
- Construction - Sewerage: $127,000 ($33.52)
- Current Operations - Police Protection: $1,008,000 ($266.03)
Regular Highways: $969,000 ($255.74)
Central Staff Services: $583,000 ($153.87)
Sewerage: $540,000 ($142.52)
Water Utilities: $537,000 ($141.73)
Local Fire Protection: $158,000 ($41.70)
Protective Inspection and Regulation - Other: $88,000 ($23.23)
Financial Administration: $64,000 ($16.89)
General - Other: $1,000 ($0.26)
- General - Interest on Debt: $153,000 ($40.38)
- Other Capital Outlay - Sewerage: $160,000 ($42.23)
Local Fire Protection: $33,000 ($8.71)
Water Utilities: $25,000 ($6.60)
Police Protection: $17,000 ($4.49)
Central Staff Services: $11,000 ($2.90)
- Water Utilities - Interest on Debt: $118,000 ($31.14)
Wheatland government finances - Revenue in 2017 (per resident):
- Charges - Sewerage: $876,000 ($231.20)
Other: $114,000 ($30.09)
- Federal Intergovernmental - Other: $628,000 ($165.74)
- Miscellaneous - General Revenue - Other: $132,000 ($34.84)
Interest Earnings: $62,000 ($16.36)
Rents: $51,000 ($13.46)
Special Assessments: $49,000 ($12.93)
Fines and Forfeits: $12,000 ($3.17)
- Revenue - Water Utilities: $804,000 ($212.19)
- State Intergovernmental - Other: $142,000 ($37.48)
Highways: $73,000 ($19.27)
General Local Government Support: $5,000 ($1.32)
- Tax - General Sales and Gross Receipts: $782,000 ($206.39)
Property: $644,000 ($169.97)
Public Utilities Sales: $113,000 ($29.82)
Other License: $71,000 ($18.74)
Amusements License: $42,000 ($11.08)
Occupation and Business License - Other: $12,000 ($3.17)
Documentary and Stock Transfer: $10,000 ($2.64)
Other: $8,000 ($2.11)
Wheatland government finances - Debt in 2017 (per resident):
- Long Term Debt - Beginning Outstanding - Unspecified Public Purpose: $6,342,000 ($1673.79)
Outstanding Unspecified Public Purpose: $6,206,000 ($1637.90)
Retired Unspecified Public Purpose: $136,000 ($35.89)
Wheatland government finances - Cash and Securities in 2017 (per resident):
- Other Funds - Cash and Securities: $9,791,000 ($2584.06)
12.15% of this county's 2021 resident taxpayers lived in other counties in 2020 ($52,892 average adjusted gross income)
| Here: | 12.15% |
| California average: | 5.19% |
0.27% of residents moved from foreign countries ($1,145 average AGI)
Yuba County: 0.27% California average: 0.03%
Top counties from which taxpayers relocated into this county between 2020 and 2021:
| from Sacramento County, CA | |
| from Sutter County, CA | |
| from Placer County, CA |
10.93% of this county's 2020 resident taxpayers moved to other counties in 2021 ($50,912 average adjusted gross income)
| Here: | 10.93% |
| California average: | 6.14% |
0.15% of residents moved to foreign countries ($622 average AGI)
Yuba County: 0.15% California average: 0.02%
Top counties to which taxpayers relocated from this county between 2020 and 2021:
| to Sutter County, CA | |
| to Sacramento County, CA | |
| to Placer County, CA |
Businesses in Wheatland, CA
- Ace Hardware: 1
- Subway: 1
Strongest AM radio stations in Wheatland:
- KFBK (1530 AM; 50 kW; SACRAMENTO, CA; Owner: AMFM RADIO LICENSES, L.L.C.)
- KFIA (710 AM; 25 kW; CARMICHAEL, CA; Owner: VISTA BROADCASTING INC.)
- KMYC (1410 AM; 5 kW; MARYSVILLE, CA; Owner: THOMAS F. HUTH)
- KSTE (650 AM; 25 kW; RANCHO CORDOVA, CA; Owner: AMFM RADIO LICENSES, L.L.C.)
- KHTK (1140 AM; 50 kW; SACRAMENTO, CA; Owner: INFINITY RADIO SUBSIDIARY OPERATIONS INC.)
- KLIB (1110 AM; 10 kW; ROSEVILLE, CA; Owner: WAY BROADCASTING, INC.)
- KAHI (950 AM; 10 kW; AUBURN, CA; Owner: IHR EDUCATIONAL BROADCASTING)
- KUBA (1600 AM; 5 kW; YUBA CITY, CA; Owner: HARLAN COMMUNICATIONS, INC.)
- KFSG (1690 AM; 10 kW; ROSEVILLE, CA; Owner: WAY BROADCASTING, INC.)
- KCBS (740 AM; 50 kW; SAN FRANCISCO, CA; Owner: INFINITY BROADCASTING OPERATIONS, INC.)
- KNCO (830 AM; 5 kW; GRASS VALLEY, CA; Owner: NEVADA COUNTY BROADCASTERS, INC.)
- KCBC (770 AM; 50 kW; RIVERBANK, CA; Owner: KIERTRON, INC.)
- KSMH (1620 AM; 10 kW; WEST SACRAMENTO, CA; Owner: IHR EDUCATIONAL BROADCASTING)
Strongest FM radio stations in Wheatland:
- KXCL (103.9 FM; YUBA CITY, CA; Owner: HARLAN COMMUNICATIONS, INC.)
- KRCX-FM (99.9 FM; MARYSVILLE, CA; Owner: ENTRAVISION HOLDINGS, LLC)
- KMJE (101.5 FM; GRIDLEY, CA; Owner: RESULTS RADIO LICENSEE, LLC)
- K213BZ (90.5 FM; RICHVALE, CA; Owner: FAMILY STATIONS, INC.)
- KKCY (103.1 FM; COLUSA, CA; Owner: RESULTS RADIO LICENSEE, LLC)
- KVMR (89.5 FM; NEVADA CITY, CA; Owner: NEVADA CITY COMMUNITY BROADCAST GRUP)
- KLVS (99.3 FM; GRASS VALLEY, CA; Owner: EDUCATIONAL MEDIA FOUNDATION)
- K258AQ (99.5 FM; YANKEE HILL, CA; Owner: CALVARY CHAPEL OF TWIN FALLS, INC.)
- KYIX (104.9 FM; SOUTH OROVILLE, CA; Owner: BUTTE BROADCASTING COMPANY, INC.)
- KNCO-FM (94.1 FM; GRASS VALLEY, CA; Owner: NEVADA COUNTY BROADCASTERS, INC.)
- KNDL (89.9 FM; ANGWIN, CA; Owner: HOWELL MOUNTAIN BROADCASTING COMPANY)
- KLVR (91.9 FM; SANTA ROSA, CA; Owner: EDUCATIONAL MEDIA FOUNDATION)
- KXTS (100.9 FM; CALISTOGA, CA; Owner: SINCLAIR TELECABLE, INC.)
- KBBF (89.1 FM; SANTA ROSA, CA; Owner: BILINGUAL B/CING. FOUNDATION, INC.)
- KHHZ (97.7 FM; OROVILLE, CA; Owner: CLEAR CHANNEL BROADCASTING LICENSES, INC.)
- KHAP (89.1 FM; CHICO, CA; Owner: FAMILY STATIONS, INC.)
- KUIC (95.3 FM; VACAVILLE, CA; Owner: KUIC, INC.)
- KHGQ (100.3 FM; QUINCY, CA; Owner: KEILY MILLER)
- KHYL (101.1 FM; AUBURN, CA; Owner: AMFM RADIO LICENSES, L.L.C.)
- K284AG (104.7 FM; WOODLAND, CA; Owner: EDUCATIONAL MEDIA FOUNDATION)
TV broadcast stations around Wheatland:
- KEZT-CA (Channel 23; SACRAMENTO, CA; Owner: TELEFUTURA SACRAMENTO LLC)
- KMMK-LP (Channel 14; SACRAMENTO, CA; Owner: CABALLERO TELEVISION TEXAS, L.L.C.)
- KSPX (Channel 29; SACRAMENTO, CA; Owner: PAXSON SACRAMENTO LICENSE, INC.)
- KTXL (Channel 40; SACRAMENTO, CA; Owner: CHANNEL 40, INC.)
- KQCA (Channel 58; STOCKTON, CA; Owner: KCRA HEARST-ARGYLE TELEVISION, INC.)
- KCRA-TV (Channel 3; SACRAMENTO, CA; Owner: KCRA HEARST-ARGYLE TELEVISION, INC.)
- KOVR (Channel 13; STOCKTON, CA; Owner: SCI - SACRAMENTO LICENSEE, LLC)
- KXTV (Channel 10; SACRAMENTO, CA; Owner: KXTV, INC.)
- KVIE (Channel 6; SACRAMENTO, CA; Owner: KVIE, INC.)
- KUVS (Channel 19; MODESTO, CA; Owner: KUVS LICENSE PARTNERSHIP, G.P.)
- KMAX-TV (Channel 31; SACRAMENTO, CA; Owner: UPN STATIONS GROUP INC.)
- K27FX (Channel 27; EUREKA, CA; Owner: MS COMMUNICATIONS, LLC)
- K17EH (Channel 17; EUREKA, CA; Owner: MS COMMUNICATIONS, LLC)
- KSAO-LP (Channel 49; SACRAMENTO, CA; Owner: GARY M. COCOLA FAMILY TRUST, GARY M. COCOLA TRUSTEE)
- KBTV-LP (Channel 8; SACRAMENTO, CA; Owner: INCISOR COMMUNICATIONS, L.L.C.)
- KMUM-CA (Channel 15; SACRAMENTO, CA; Owner: CABALLERO TELEVISION TEXAS, L.L.C.)
- K69FB (Channel 69; SACRAMENTO, CA; Owner: TRINITY BROADCASTING NETWORK)
- K22FR (Channel 22; SACRAMENTO, CA; Owner: NATIONAL MINORITY T.V., INC.)
- K27EU (Channel 27; SACRAMENTO, CA; Owner: ABUNDANT LIFE BROADCASTING, INC.)
- KCSO-LP (Channel 33; SACRAMENTO, CA; Owner: SAINTE 51, L.P.)
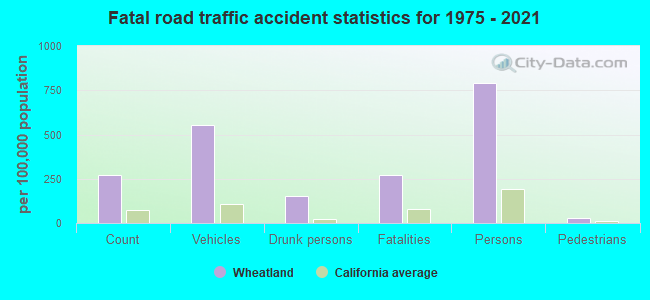
Wheatland fatal accident list:
Sep 5, 2015 08:50 PM, Spenceville Rd, Lat: 39.021747, Lon: -121.404556, Vehicles: 1, Persons: 3, Fatalities: 1, Drunk persons involved: 1
May 7, 2001 07:20 AM, Sr-65, Vehicles: 5, Persons: 5, Fatalities: 1
May 25, 1997 01:10 AM, 65, Vehicles: 2, Persons: 2, Fatalities: 1
May 27, 1988 03:45 PM, 65, Vehicles: 2, Persons: 4, Fatalities: 1, Drunk persons involved: 1
Nov 10, 1985 05:00 AM, Vehicles: 1, Persons: 2, Fatalities: 1, Drunk persons involved: 1
- National Bridge Inventory (NBI) Statistics
- 7Number of bridges
- 98ft / 29.6mTotal length
- 73,902Total average daily traffic
- 3,744Total average daily truck traffic
- 121,802Total future (year 2040) average daily traffic
FCC Registered Cell Phone Towers:
2 (See the full list of FCC Registered Cell Phone Towers in Wheatland)FCC Registered Antenna Towers:
13 (See the full list of FCC Registered Antenna Towers)FCC Registered Broadcast Land Mobile Towers:
6- Camp Far West Telemetry Sta 13 Km Ne (Lat: 39.051278 Lon: -121.317167), Type: Tower, Structure height: 6 m, Overall height: 8 m, Call Sign: KHI59,
Assigned Frequencies: 169.475 MHz, Grant Date: 05/27/2011, Expiration Date: 06/24/2021, Cancellation Date: 12/14/2011, Certifier: Glen S Nash, Registrant: State Of California, 601 Sequoia Pacific Blvd, Sacramento, CA 95811-0231, Phone: (916) 657-6113, Fax: (916) 657-9468, Email:
- 413 Second St (Lat: 39.011861 Lon: -120.425194), Call Sign: KEG371,
Assigned Frequencies: 154.920 MHz, 460.025 MHz, Grant Date: 06/04/2014, Expiration Date: 08/17/2024, Registrant: State Of California, 601 Sequoia-Pacific Blvd., Sacramento, CA 95811-0231, Phone: (916) 894-5096, Fax: (916) 894-5392, Email:
- Lat: 39.030944 Lon: -121.513639, Call Sign: WQMI674,
Assigned Frequencies: 451.687 MHz, 456.687 MHz, Grant Date: 08/17/2010, Expiration Date: 08/17/2020, Cancellation Date: 10/17/2020, Certifier: Aaron Hawkins, Registrant: Washington Radio Reports, 1588 Fairfield Road Ste 7, Gettysburg, PA 17325, Phone: (717) 334-0668, Fax: (717) 334-6440, Email:
- Lat: 39.006722 Lon: -121.430639, Call Sign: WQMQ960,
Assigned Frequencies: 452.187 MHz, 452.412 MHz, 452.662 MHz, 452.687 MHz, 452.887 MHz, Grant Date: 10/26/2010, Expiration Date: 10/26/2020, Cancellation Date: 12/26/2020, Certifier: Mick Shatswell, Registrant: Bearcom Operating LP, Dallas, TX 75355, Phone: (214) 765-7136, Fax: (214) 355-1714, Email:
- PACIFIC GAS ELECTRIC, 3736 Rancho Road (Lat: 39.064056 Lon: -121.506528), Type: Building, Structure height: 9 m, Call Sign: WQWK893,
Assigned Frequencies: 462.900 MHz, Grant Date: 09/24/2015, Expiration Date: 09/24/2025, Cancellation Date: 09/24/2015, Certifier: Michael Graning, Registrant: Visiplex, Inc., 1287 North Barclay Boulevard, Buffalo Grove, IL 60089, Phone: (847) 229-0250, Fax: (847) 229-0259, Email:
- MOB, Lat: 39.001306 Lon: -121.432639, Call Sign: WQXK528,
Assigned Frequencies: 451.187 MHz, 452.712 MHz, 456.362 MHz, 457.637 MHz, 462.337 MHz, Grant Date: 03/31/2016, Expiration Date: 03/31/2026, Certifier: Meghan Bishop, Registrant: Bearcom Operating LLC, Dallas, TX 75355-9001, Phone: (800) 458-9887, Email:
FCC Registered Microwave Towers:
6- WHEATLAND, 1336 Oakly Lane (Lat: 38.995917 Lon: -121.441917), Type: Mtower, Structure height: 38.1 m, Overall height: 41.8 m, Call Sign: WMI803,
Assigned Frequencies: 11245.0 MHz, 11285.0 MHz, 11245.0 MHz, 11285.0 MHz, 11245.0 MHz, 11285.0 MHz, 11245.0 MHz, 11285.0 MHz, 11325.0 MHz, 11365.0 MHz... (+6 more), Grant Date: 12/29/2020, Expiration Date: 02/01/2031, Registrant: Verizon Wireless, 5055 North Point Pkwy, Np2ne Network Engineering, Alpharetta, GA 30022, Phone: (770) 797-1070, Email:
- THE REAL BEALE 2, 6240 Ostrom Road (Lat: 39.079000 Lon: -121.372111), Type: Mast, Structure height: 45.7 m, Call Sign: WQNR240,
Assigned Frequencies: 10755.0 MHz, 10755.0 MHz, 10755.0 MHz, 10755.0 MHz, 10835.0 MHz, 10835.0 MHz, 10835.0 MHz, 10835.0 MHz, 19380.0 MHz, 19460.0 MHz... (+34 more), Grant Date: 03/23/2021, Expiration Date: 04/26/2031, Certifier: Pamelia Y Hoof, Registrant: Verizon Wireless, 5055 North Point Pkwy, Np2ne Network Engineering, Alpharetta, GA 30022, Phone: (770) 797-1070, Email:
- WHEATLAND SLEEPTRAIN, 2677 Forty Mile Road (Lat: 39.029361 Lon: -121.508139), Type: Mast, Structure height: 9.1 m, Call Sign: WQSX467,
Assigned Frequencies: 10755.0 MHz, Grant Date: 12/04/2013, Expiration Date: 12/04/2023, Cancellation Date: 11/24/2020, Certifier: Gregory M Romano, Registrant: Verizon, 1300 I St Nw - Suite 500 East, Washington, DC 20005, Phone: (202) 515-2453, Email:
- SLEEPTRAIN WHEATLAND, 2677 Forty Mile Rd (Lat: 39.031083 Lon: -121.510306), Type: Building, Structure height: 3.7 m, Call Sign: WQXT213,
Assigned Frequencies: 10735.0 MHz, 10735.0 MHz, 10735.0 MHz, 10735.0 MHz, 10935.0 MHz, 10935.0 MHz, 10935.0 MHz, 10935.0 MHz, Grant Date: 06/01/2016, Expiration Date: 06/01/2026, Certifier: Gregory M Romano, Registrant: Verizon Wireless, 5055 North Point Pkwy, Np2ne Network Engineering, Alpharetta, GA 30022, Phone: (770) 797-1070, Email:
- OLIVEHURST, Rancho Rd (Lat: 39.048111 Lon: -121.482417), Type: Pole, Structure height: 45.7 m, Call Sign: WQYR326,
Assigned Frequencies: 10995.0 MHz, 10995.0 MHz, 10995.0 MHz, 10995.0 MHz, 10995.0 MHz, 10995.0 MHz, 10995.0 MHz, 11155.0 MHz, 11155.0 MHz, 11155.0 MHz... (+12 more), Grant Date: 12/19/2016, Expiration Date: 12/19/2026, Certifier: Gregory M Romano, Registrant: Cellco Partnership, 5055 North Point Pkwy, Np2ne Network Engineering, Alpharetta, GA 30022, Phone: (770) 797-1070, Email:
- ERLE MW SITE, Erle Mw Site, 2691 Ca-65 (Lat: 39.039250 Lon: -121.467222), Type: Ltower, Structure height: 68.6 m, Call Sign: KFH46,
Assigned Frequencies: 6226.89 MHz, 6226.89 MHz, 6226.89 MHz, 6226.89 MHz, 6226.89 MHz, 6226.89 MHz, 6226.89 MHz, 6226.89 MHz, 6226.89 MHz, 6226.89 MHz, 6226.89 MHz, 6226.89 MHz, Grant Date: 10/21/2021, Expiration Date: 11/21/2031, Registrant: Prokarma, 222 So 15th St. Suite 505n, Omaha, NE 68102, Phone: (402) 522-5068, Fax: (402) 346-6676, Email:
FCC Registered Amateur Radio Licenses:
27 (See the full list of FCC Registered Amateur Radio Licenses in Wheatland)FAA Registered Aircraft:
2- Aircraft: CESSNA 182H (Category: Land, Seats: 4, Weight: Up to 12,499 Pounds, Speed: 119 mph), Engine: CONT MOTOR O-470 SERIES (230 HP) (Reciprocating)
N-Number: 8350S, N8350S, N-8350S, Serial Number: 18256450, Year manufactured: 1965, Airworthiness Date: 07/19/1965, Certificate Issue Date: 03/05/1991
Registrant (Individual): Jeffery L Pierce, P O Box 29, Wheatland, CA 05692 - Aircraft: AERONCA 7BCM (Category: Land, Seats: 2, Weight: Up to 12,499 Pounds, Speed: 90 mph), Engine: CONT MOTOR A&C65 SERIES (65 HP) (Reciprocating)
N-Number: 84443, N84443, N-84443, Serial Number: 7AC-3143, Year manufactured: 1946, Airworthiness Date: 10/22/1955, Certificate Issue Date: 10/17/1983
Registrant (Individual): Jeffery L Pierce, Po Box 29, Wheatland, CA 95692
| Home Mortgage Disclosure Act Aggregated Statistics For Year 2009 (Based on 1 partial tract) | ||
| C) Refinancings | ||
|---|---|---|
| Number | Average Value | |
| LOANS ORIGINATED | 1 | $140,230 |
| APPLICATIONS APPROVED, NOT ACCEPTED | 0 | $0 |
| APPLICATIONS DENIED | 0 | $0 |
| APPLICATIONS WITHDRAWN | 0 | $0 |
| FILES CLOSED FOR INCOMPLETENESS | 0 | $0 |
Detailed HMDA statistics for the following Tracts: 0408.00
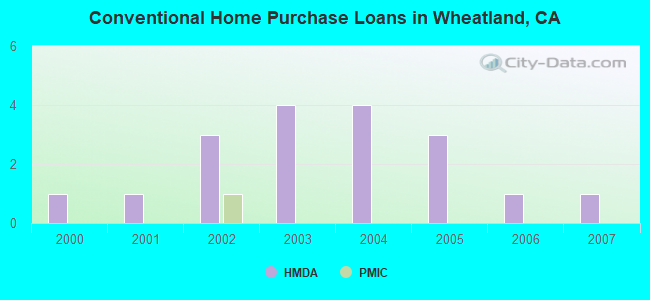
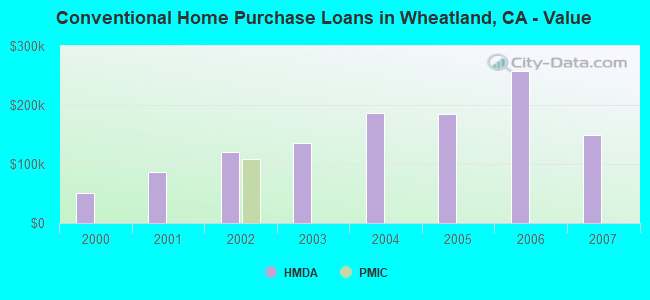
| Private Mortgage Insurance Companies Aggregated Statistics For Year 2002 (Based on 1 partial tract) | ||
| A) Conventional Home Purchase Loans | ||
|---|---|---|
| Number | Average Value | |
| LOANS ORIGINATED | 1 | $108,800 |
| APPLICATIONS APPROVED, NOT ACCEPTED | 0 | $0 |
| APPLICATIONS DENIED | 0 | $0 |
| APPLICATIONS WITHDRAWN | 0 | $0 |
| FILES CLOSED FOR INCOMPLETENESS | 0 | $0 |
Detailed PMIC statistics for the following Tracts: 0408.00
2005 - 2018 National Fire Incident Reporting System (NFIRS) incidents
- Fire incident types reported to NFIRS in Wheatland, CA
- 16460.1%Outside Fires
- 5319.4%Structure Fires
- 4115.0%Mobile Property/Vehicle Fires
- 155.5%Other
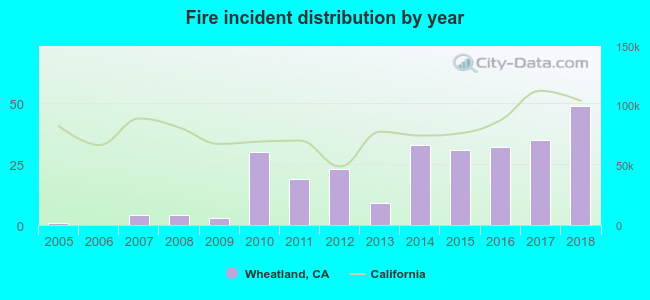 Based on the data from the years 2005 - 2018 the average number of fires per year is 20. The highest number of reported fire incidents - 49 took place in 2018, and the least - 0 in 2006. The data has a rising trend.
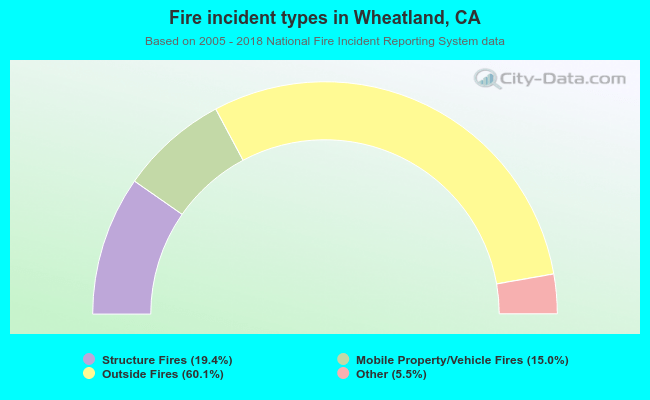 When looking into fire subcategories, the most incidents belonged to: Outside Fires (60.1%), and Structure Fires (19.4%).
| Most common first names in Wheatland, CA among deceased individuals | ||
| Name | Count | Lived (average) |
|---|---|---|
| John | 29 | 70.2 years |
| Robert | 19 | 67.3 years |
| James | 18 | 71.9 years |
| William | 15 | 80.3 years |
| Charles | 14 | 70.2 years |
| George | 12 | 77.1 years |
| Richard | 10 | 69.7 years |
| Helen | 9 | 76.0 years |
| Mary | 8 | 80.9 years |
| Ruth | 8 | 78.2 years |
| Most common last names in Wheatland, CA among deceased individuals | ||
| Last name | Count | Lived (average) |
|---|---|---|
| Harrison | 11 | 68.7 years |
| Foster | 8 | 68.7 years |
| Sohrakoff | 8 | 74.5 years |
| Muck | 7 | 76.4 years |
| Jones | 7 | 82.8 years |
| Brown | 7 | 74.0 years |
| Wilson | 6 | 81.3 years |
| Anderson | 6 | 82.7 years |
| Akins | 5 | 70.4 years |
| Nichols | 5 | 78.2 years |
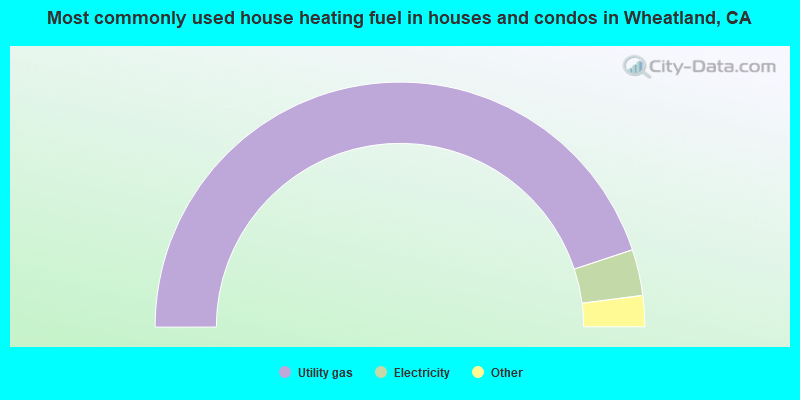
- 89.8%Utility gas
- 6.1%Electricity
- 2.9%Wood
- 1.1%Solar energy
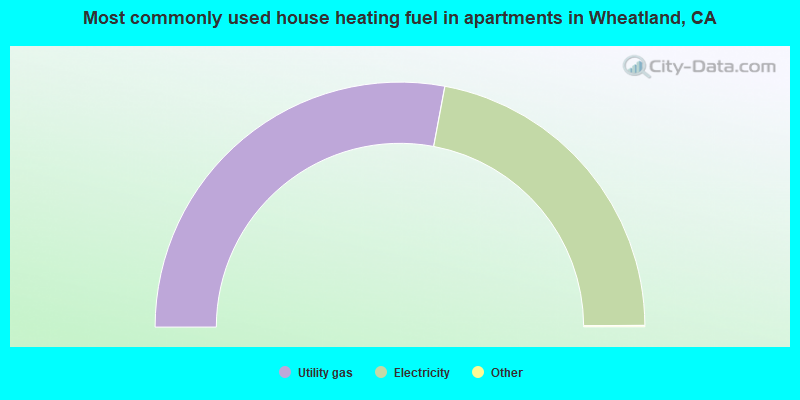
- 56.0%Utility gas
- 44.0%Electricity
Wheatland compared to California state average:
- Median house value below state average.
- Black race population percentage significantly below state average.
- Foreign-born population percentage significantly below state average.
- Length of stay since moving in significantly below state average.
- House age below state average.
Wheatland on our top lists:
- #39 on the list of "Top 101 cities with the most residents born in Cambodia (population 500+)"
- #30 on the list of "Top 101 counties with the highest percentage of residents relocating to other counties in 2011 (pop. 50,000+)"
- #33 on the list of "Top 101 counties with the highest percentage of residents relocating from foreign countries between 2010 and 2011 (pop. 50,000+)"
- #34 on the list of "Top 101 counties with the highest percentage of residents relocating to foreign countries in 2011 (pop. 50,000+)"
- #35 on the list of "Top 101 counties with highest percentage of residents voting for 3rd party candidates in the 2012 Presidential Election (pop. 50,000+)"
- #40 on the list of "Top 101 counties with the lowest surface withdrawal of fresh water for public supply (pop. 50,000+)"

|
Total of 2 patent applications in 2008-2024.