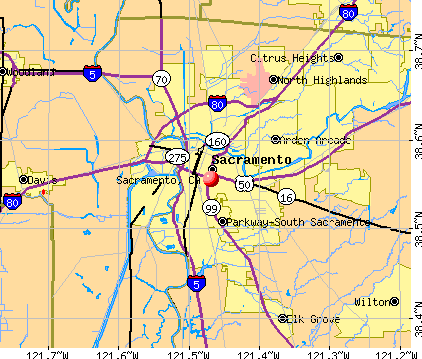
Sacramento, California

Sacramento: Riverfront fountain in Sacramento, CA

Sacramento: Sacramento from my model airplane
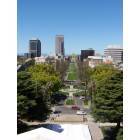
Sacramento: Capitol Mall - View from the Capitol

Sacramento: Tower Bridge in Sacramento, CA

Sacramento: Old Sacramento & Sacramento from a model airplane
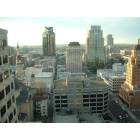
Sacramento: Sacramento, CA
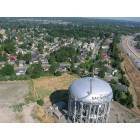
Sacramento: Water Tower from a model airplane
Sacramento: The Capitol from a model airplane over the Tower Bridge
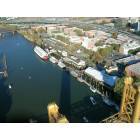
Sacramento: sac river /american river splits
Sacramento: sac river
Sacramento: Sacramento, CA - July 2006
- see
83
more - add
your
Submit your own pictures of this city and show them to the world
- OSM Map
- General Map
- Google Map
- MSN Map
Population change since 2000: +29.7%
 |
| Males: 259,704 | |
| Females: 268,297 |
| Median resident age: | 36.0 years |
| California median age: | 37.9 years |
Zip codes: 95811, 95814, 95815, 95816, 95817, 95818, 95819, 95822, 95833, 95834, 95835, 95837.
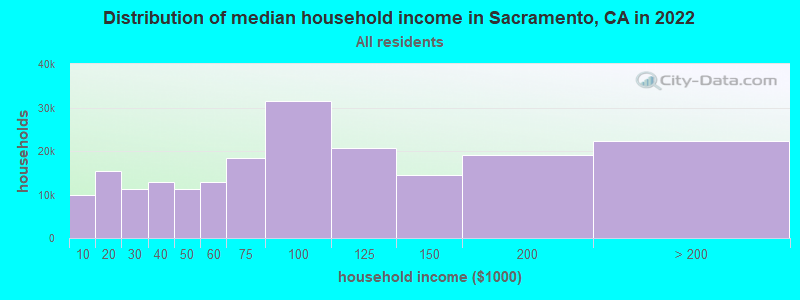
Sacramento Zip Code Map| Sacramento: | $80,254 |
| CA: | $91,551 |
Estimated per capita income in 2022: $40,502 (it was $18,721 in 2000)
Sacramento city income, earnings, and wages data
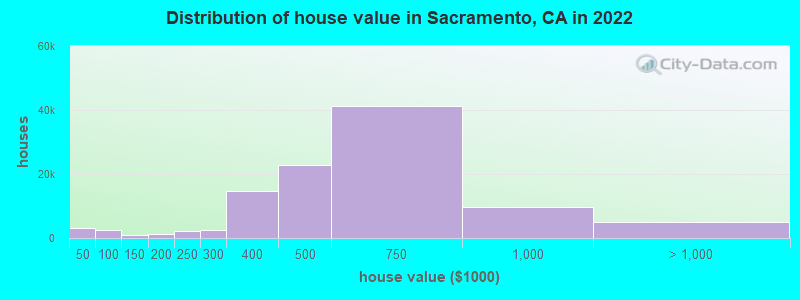
Estimated median house or condo value in 2022: $520,200 (it was $126,000 in 2000)
| Sacramento: | $520,200 |
| CA: | $715,900 |
Mean prices in 2022: all housing units: $549,576; detached houses: $569,448; townhouses or other attached units: $493,704; in 2-unit structures: $747,500; in 3-to-4-unit structures: $507,225; in 5-or-more-unit structures: $446,228; mobile homes: $98,695; occupied boats, rvs, vans, etc.: $339,144
Median gross rent in 2022: $1,650.
(10.8% for White Non-Hispanic residents, 19.0% for Black residents, 14.6% for Hispanic or Latino residents, 16.1% for American Indian residents, 14.8% for Native Hawaiian and other Pacific Islander residents, 18.6% for other race residents, 11.9% for two or more races residents)
Detailed information about poverty and poor residents in Sacramento, CA


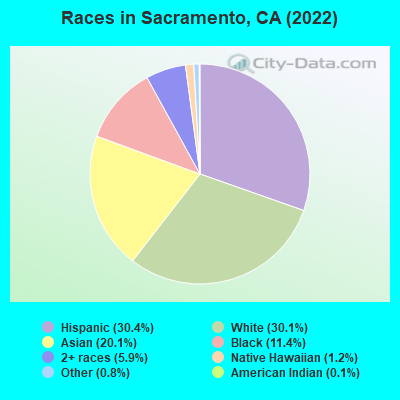
- 160,69030.4%Hispanic
- 158,88330.1%White alone
- 106,00320.1%Asian alone
- 59,99111.4%Black alone
- 31,2375.9%Two or more races
- 6,4021.2%Native Hawaiian and Other
Pacific Islander alone - 4,1220.8%Other race alone
- 6980.1%American Indian alone
According to our research of California and other state lists, there were 2,165 registered sex offenders living in Sacramento, California as of April 27, 2024.
The ratio of all residents to sex offenders in Sacramento is 229 to 1.
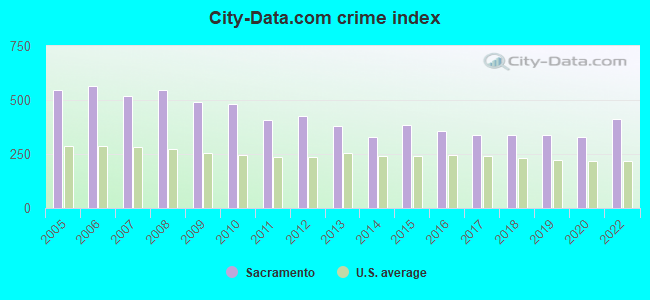
The City-Data.com crime index weighs serious crimes and violent crimes more heavily. Higher means more crime, U.S. average is 246.1. It adjusts for the number of visitors and daily workers commuting into cities.
- means the value is smaller than the state average.- means the value is about the same as the state average.
- means the value is bigger than the state average.
- means the value is much bigger than the state average.
Crime rate in Sacramento detailed stats: murders, rapes, robberies, assaults, burglaries, thefts, arson
Full-time law enforcement employees in 2021, including police officers: 997 (716 officers - 596 male; 120 female).
| Officers per 1,000 residents here: | 1.38 |
| California average: | 2.30 |
 Recent articles from our blog. Our writers, many of them Ph.D. graduates or candidates, create easy-to-read articles on a wide variety of topics.

 | Downtown Sacramento Projects Rising 2020 (86 replies) |
| Why I am glad I left the Sacramento region.... (171 replies) |
| Lady Bird's Sacramento (57 replies) |
| Considering a move from Denver to Sacramento (41 replies) |
| Sacramento compared to Fresno: my limited observations (42 replies) |
| Another Fabulous Comfortable Sacramento Summer (7 replies) |
Latest news from Sacramento, CA collected exclusively by city-data.com from local newspapers, TV, and radio stations
Ancestries: American (2.5%), German (2.3%), Irish (2.1%), English (2.0%), European (1.8%), Italian (1.4%).
Current Local Time: PST time zone
Elevation: 20 feet
Land area: 97.2 square miles.
Population density: 5,434 people per square mile (average).
111,395 residents are foreign born (10.5% Asia, 7.1% Latin America).
| This city: | 21.2% |
| California: | 26.5% |
Median real estate property taxes paid for housing units with mortgages in 2022: $4,013 (0.8%)
Median real estate property taxes paid for housing units with no mortgage in 2022: $2,694 (0.6%)
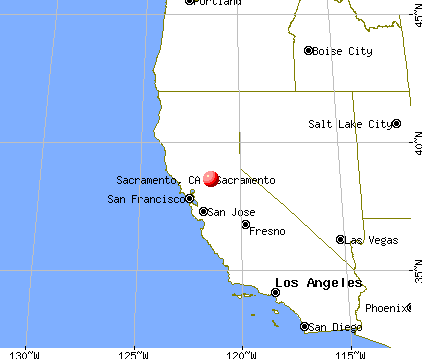
Nearest city with pop. 1,000,000+: Los Angeles, CA  (353.9 miles , pop. 3,694,820).
Nearest cities:
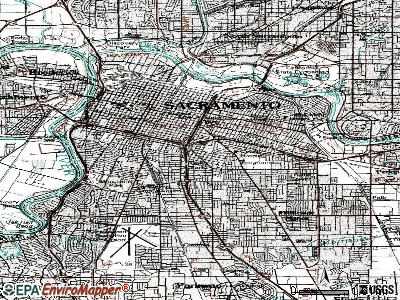
), ), ), ), Latitude: 38.56 N, Longitude: 121.47 W
Daytime population change due to commuting: +82,957 (+15.7%)
Workers who live and work in this city: 153,754 (60.0%)
Detailed articles:
- Sacramento: Introduction
- Sacramento Basic Facts
- Sacramento: Communications
- Sacramento: Convention Facilities
- Sacramento: Economy
- Sacramento: Education and Research
- Sacramento: Geography and Climate
- Sacramento: Health Care
- Sacramento: History
- Sacramento: Municipal Government
- Sacramento: Population Profile
- Sacramento: Recreation
- Sacramento: Transportation
Sacramento tourist attractions:
- ARCO Arena, Sacramento, California
- Holiday Inn Sacramento-Capitol Plaza
- Cathedral of the Blessed Sacrament
- Carpenter Hill
- Capitol Park
- California State University-Sacramento
- California State Library
- California State Indian Museum
- California Military Museum
- California Exposition & State Fair
- California Department of Parks and Recreation
- California Delta
- California Capitol
- Blue Diamond Almond's Retail Store
- Alleys
- American River Bicycle Trail
- American River Parkway
- Central Pacific Passenger Depot
- Cesar Chavez Park
- Chautauqua Playhouse
- City Water Intake Facility
- Aerie Art Garden
- Codfish Creek Trail
- Country Club Lanes
- Crest Theater
- Crocker Art Museum
- Curtis Park
- Discovery Museum Gold Rush History Center
- Discovery Museum Science and Space Center
- Funderland
- Land Park Lanes
- Leland Stanford Mansion State Historic Park
- Lemon Hill
- Libby's Cannery
- Loch Leven Lakes Trail
- La Raza Galeria Posada
- McKinley Park
- Marco Dog Park
- Lower American River
- Nimbus Dam
- Arco Arena
- River Park
- Paddlewheel Showroom
- Old City Cemetery
- Our Lady of Guadalupe Church
- Thistle Dew Dessert Theatre
- Towe Auto Museum
- Hyatt Regency Sacramento
- Stevens Trail
- Studio Theatre
- Sutter's Fort
- Tahoe Park
- Team Experience
- The Actor's Workshop
- The B Street Theatre
- The California Museum for History, Women and the Arts
- The Matthew McKinley
- Raging Waters
- Sacramento City Actor's Theatre
- Sacramento City College
- Sacramento City Museum
- Sacramento Community Center
- Sacramento Convention Center
- Sacramento Memorial Auditorium
- Sacramento River Water Intake Structure
- Sacramento Theatre Company
- Residence Inn Sacramento Downtown at Capitol Park
- Sacramento Zoo - Sacramento, California - large zoo with over 600 animals
- California State Railroad Museum in Sacramento More than Just Trains
- Fairytale Town in Sacramento, California a Child's Delight
- Sheraton Grand Sacramento Hotel in California is a Historic City Gem
- Arden Fair in Sacramento, California is an Over-the-Top Shopping Experience
- La Rivage Hotel in Sacramento, California Offers Luxury on the River
Sacramento, California accommodation & food services, waste management - Economy and Business Data
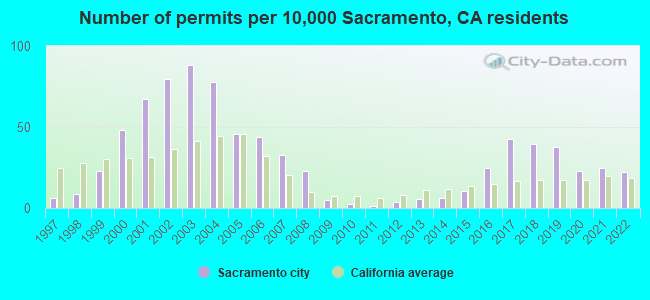
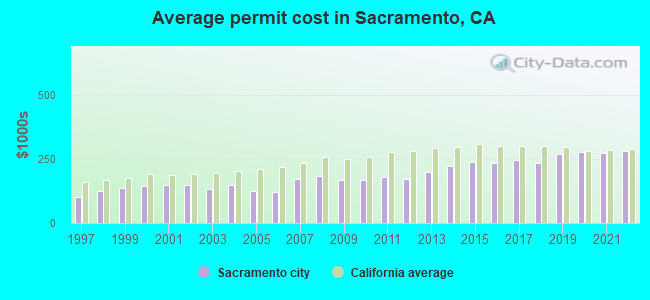
Single-family new house construction building permits:
- 2022: 905 buildings, average cost: $282,700
- 2021: 1004 buildings, average cost: $275,400
- 2020: 935 buildings, average cost: $277,800
- 2019: 1538 buildings, average cost: $268,800
- 2018: 1610 buildings, average cost: $233,300
- 2017: 1728 buildings, average cost: $246,100
- 2016: 1017 buildings, average cost: $236,300
- 2015: 438 buildings, average cost: $237,900
- 2014: 256 buildings, average cost: $224,000
- 2013: 232 buildings, average cost: $200,100
- 2012: 142 buildings, average cost: $173,100
- 2011: 61 buildings, average cost: $181,500
- 2010: 95 buildings, average cost: $169,400
- 2009: 199 buildings, average cost: $166,900
- 2008: 934 buildings, average cost: $185,300
- 2007: 1337 buildings, average cost: $172,000
- 2006: 1785 buildings, average cost: $120,600
- 2005: 1856 buildings, average cost: $125,200
- 2004: 3155 buildings, average cost: $149,000
- 2003: 3603 buildings, average cost: $134,000
- 2002: 3242 buildings, average cost: $148,500
- 2001: 2739 buildings, average cost: $147,800
- 2000: 1954 buildings, average cost: $143,300
- 1999: 922 buildings, average cost: $138,300
- 1998: 350 buildings, average cost: $126,300
- 1997: 258 buildings, average cost: $102,200
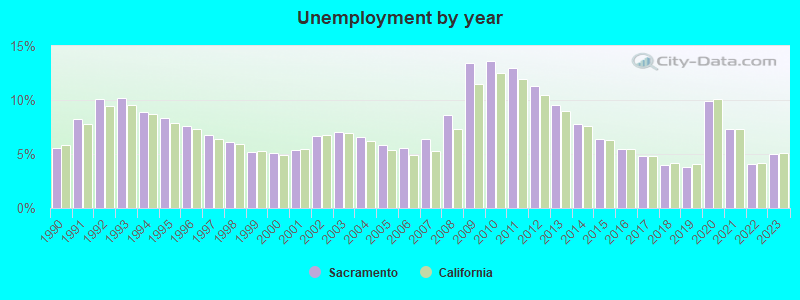
| Here: | 5.0% |
| California: | 5.1% |
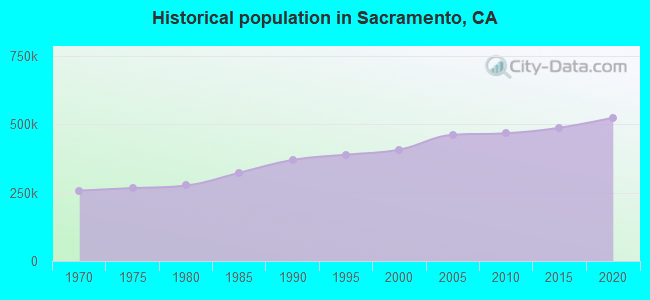
Population change in the 1990s: +8,762 (+2.2%).
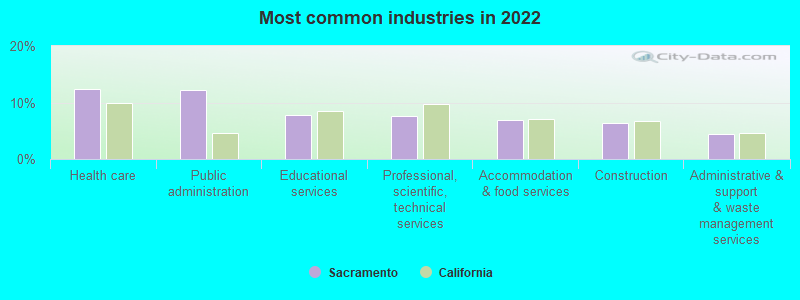
- Health care (12.4%)
- Public administration (12.1%)
- Educational services (7.8%)
- Professional, scientific, technical services (7.6%)
- Accommodation & food services (7.0%)
- Construction (6.3%)
- Administrative & support & waste management services (4.3%)
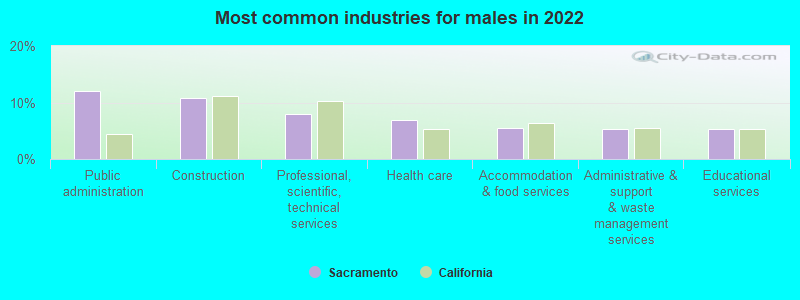
- Public administration (12.1%)
- Construction (10.8%)
- Professional, scientific, technical services (8.0%)
- Health care (7.0%)
- Accommodation & food services (5.4%)
- Administrative & support & waste management services (5.4%)
- Educational services (5.4%)
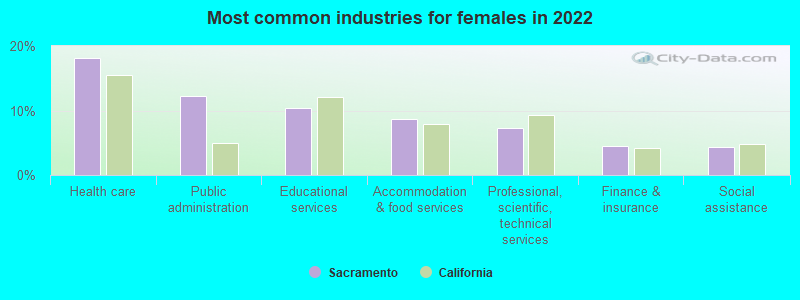
- Health care (18.2%)
- Public administration (12.2%)
- Educational services (10.4%)
- Accommodation & food services (8.7%)
- Professional, scientific, technical services (7.2%)
- Finance & insurance (4.4%)
- Social assistance (4.3%)
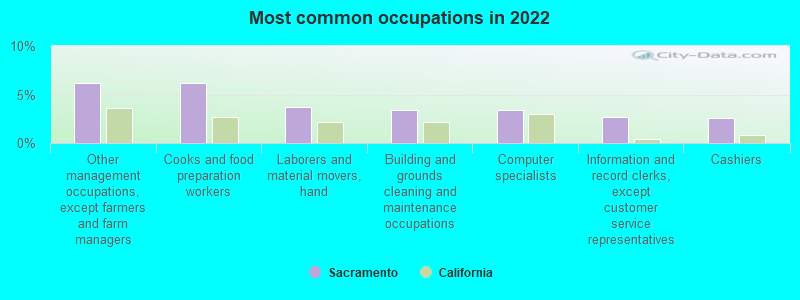
- Other management occupations, except farmers and farm managers (6.2%)
- Cooks and food preparation workers (6.2%)
- Laborers and material movers, hand (3.7%)
- Building and grounds cleaning and maintenance occupations (3.4%)
- Computer specialists (3.4%)
- Information and record clerks, except customer service representatives (2.6%)
- Cashiers (2.6%)
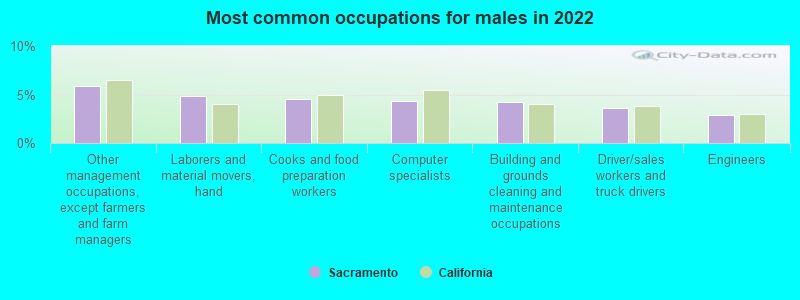
- Other management occupations, except farmers and farm managers (5.8%)
- Laborers and material movers, hand (4.8%)
- Cooks and food preparation workers (4.6%)
- Computer specialists (4.4%)
- Building and grounds cleaning and maintenance occupations (4.3%)
- Driver/sales workers and truck drivers (3.6%)
- Engineers (2.9%)
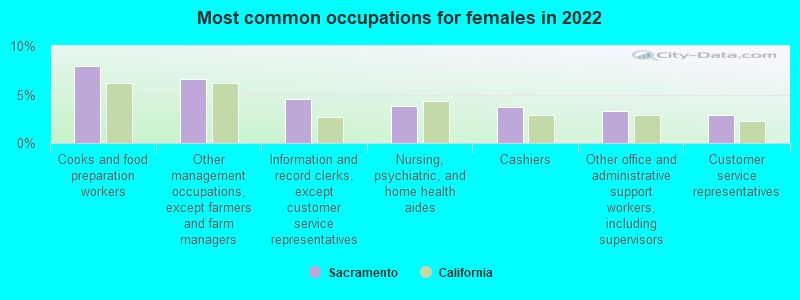
- Cooks and food preparation workers (7.9%)
- Other management occupations, except farmers and farm managers (6.6%)
- Information and record clerks, except customer service representatives (4.5%)
- Nursing, psychiatric, and home health aides (3.9%)
- Cashiers (3.7%)
- Other office and administrative support workers, including supervisors (3.3%)
- Customer service representatives (2.9%)
Average climate in Sacramento, California
Based on data reported by over 4,000 weather stations


|
|


(lower is better)
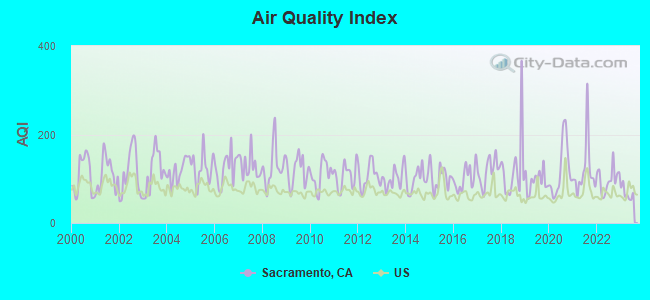
Air Quality Index (AQI) level in 2023 was 67.3. This is about average.
| City: | 67.3 |
| U.S.: | 72.6 |
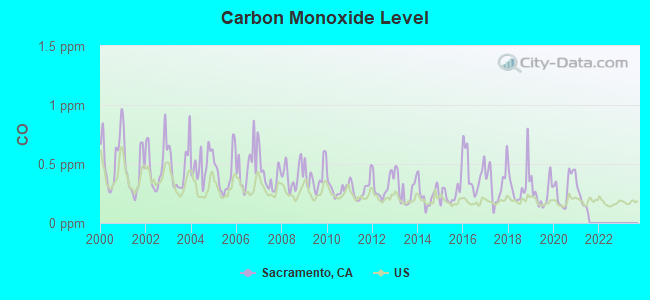
Carbon Monoxide (CO) [ppm] level in 2021 was 0.194. This is better than average. Closest monitor was 1.6 miles away from the city center.
| City: | 0.194 |
| U.S.: | 0.251 |
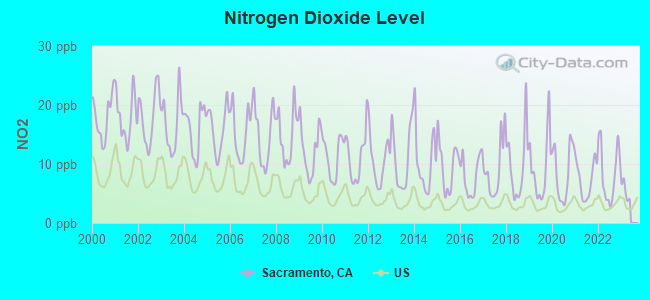
Nitrogen Dioxide (NO2) [ppb] level in 2022 was 8.43. This is significantly worse than average. Closest monitor was 0.6 miles away from the city center.
| City: | 8.43 |
| U.S.: | 5.11 |
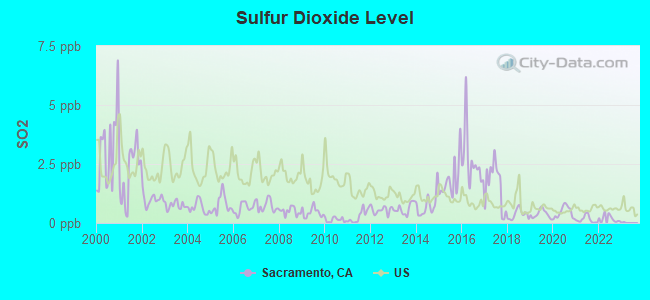
Sulfur Dioxide (SO2) [ppb] level in 2022 was 0.207. This is significantly better than average. Closest monitor was 0.6 miles away from the city center.
| City: | 0.207 |
| U.S.: | 1.515 |
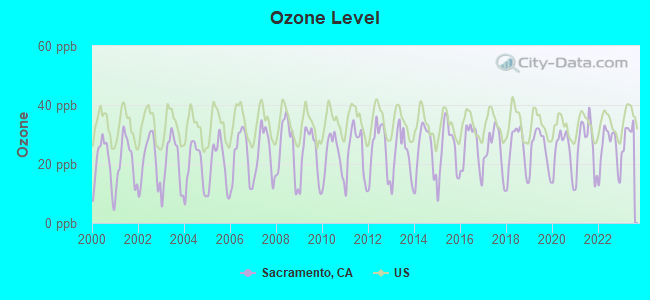
Ozone [ppb] level in 2023 was 30.0. This is about average. Closest monitor was 1.6 miles away from the city center.
| City: | 30.0 |
| U.S.: | 33.3 |
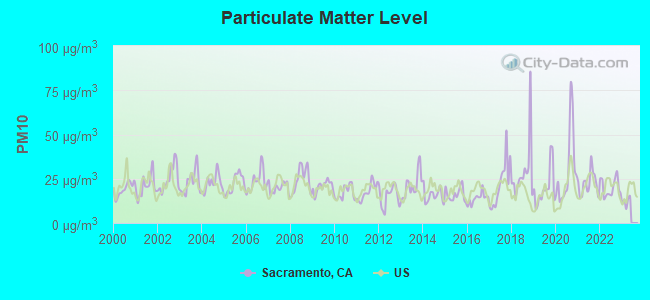
Particulate Matter (PM10) [µg/m3] level in 2022 was 19.9. This is about average. Closest monitor was 0.6 miles away from the city center.
| City: | 19.9 |
| U.S.: | 19.2 |
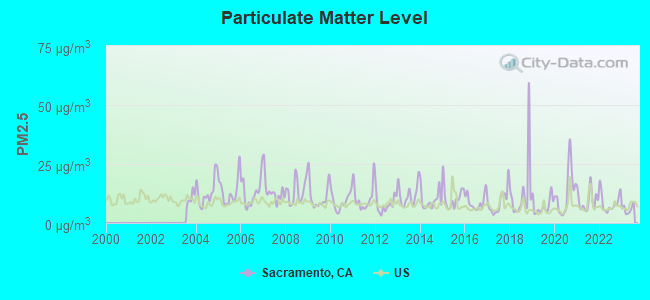
Particulate Matter (PM2.5) [µg/m3] level in 2023 was 5.86. This is better than average. Closest monitor was 0.6 miles away from the city center.
| City: | 5.86 |
| U.S.: | 8.11 |
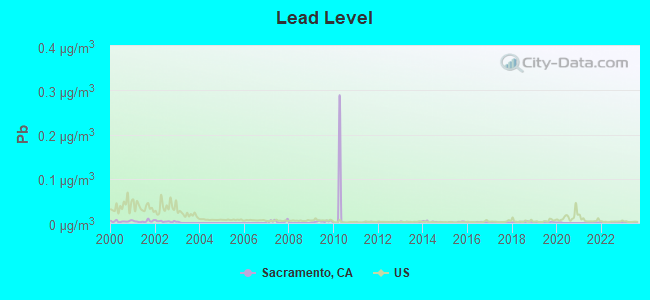
Lead (Pb) [µg/m3] level in 2023 was 0.00140. This is significantly better than average. Closest monitor was 0.6 miles away from the city center.
| City: | 0.00140 |
| U.S.: | 0.00931 |
Earthquake activity:
Sacramento-area historical earthquake activity is significantly above California state average. It is 7699% greater than the overall U.S. average.On 4/18/1906 at 13:12:21, a magnitude 7.9 (7.9 UK, Class: Major, Intensity: VIII - XII) earthquake occurred 91.6 miles away from Sacramento center, causing $524,000,000 total damage
On 10/18/1989 at 00:04:15, a magnitude 7.1 (6.5 MB, 7.1 MS, 6.9 MW, 7.0 ML) earthquake occurred 101.3 miles away from the city center, causing 62 deaths (62 shaking deaths) and 3757 injuries, causing $1,305,032,704 total damage
On 10/3/1915 at 06:52:48, a magnitude 7.6 (7.6 UK) earthquake occurred 250.8 miles away from Sacramento center
On 7/21/1952 at 11:52:14, a magnitude 7.7 (7.7 UK) earthquake occurred 281.4 miles away from the city center, causing $50,000,000 total damage
On 1/31/1922 at 13:17:28, a magnitude 7.6 (7.6 UK) earthquake occurred 263.3 miles away from Sacramento center
On 12/21/1932 at 06:10:09, a magnitude 7.2 (7.2 UK) earthquake occurred 183.2 miles away from Sacramento center
Magnitude types: body-wave magnitude (MB), local magnitude (ML), surface-wave magnitude (MS), moment magnitude (MW)
Natural disasters:
The number of natural disasters in Sacramento County (18) is near the US average (15).Major Disasters (Presidential) Declared: 11
Emergencies Declared: 3
Causes of natural disasters: Floods: 13, Winter Storms: 6, Storms: 5, Mudslides: 4, Landslides: 3, Drought: 1, Earthquake: 1, Heavy Rain: 1, Hurricane: 1, Tornado: 1, Wind: 1, Other: 1 (Note: some incidents may be assigned to more than one category).
Main business address for: OPHTHALMIC IMAGING SYSTEMS (SURGICAL & MEDICAL INSTRUMENTS & APPARATUS), PLACER SIERRA BANCSHARES (STATE COMMERCIAL BANKS), ALTERNATIVE TECHNOLOGY RESOURCES INC (SERVICES-COMPUTER PROGRAMMING SERVICES), MCCLATCHY CO (NEWSPAPERS: PUBLISHING OR PUBLISHING & PRINTING), AMERICAN RIVER BANKSHARES (STATE COMMERCIAL BANKS).
Hospitals in Sacramento:
- COMMUITY HOSPITAL OF SACRAMENTO (provides emergency services, 2251 HAWTHORNE STREET)
- COMMUNITY HOSP AND HEALTH SCIENCE CTR (provides emergency services, 2251 HAWTHORNE ST)
- KAISER FOUNDATION HOSP SO SACRAMENTO (Voluntary non-profit - Other, provides emergency services, 6600 BRUCEVILLE ROAD)
- KAISER FOUNDATION HOSPITAL - SACRAMENTO (Voluntary non-profit - Private, provides emergency services, 2025 MORSE AVENUE)
- KAISER FOUNDATION HOSPITAL-HOSPICE (3240 ARDEN WAY)
- MADELEINE HEALTHCARE SERVICES (2277 FAIR OAKS BLVD, SUITE 350)
- METHODIST HOSPITAL OF SACRAMENTO (Voluntary non-profit - Other, 7500 HOSPITAL DRIVE)
- QUALITY QUEST (96 TRISTAN CIRCLE)
- SUTTER GENERAL HOSPITAL (Voluntary non-profit - Private, 2801 L STREET)
- UNIVERSITY OF CALIFORNIA DAVIS MEDICAL CENTER (Voluntary non-profit - Other, 2315 STOCKTON BOULEVARD)
- VITAS HEALTHCARE CORPORATION OF CALIFORNIA (3841 N FREEWAY BOULEVARD SUITE 210)
Airports and heliports located in Sacramento:
- Sacramento International Airport (SMF) (Runways: 2, Commercial Ops: 80,029, Air Taxi Ops: 15,346, Itinerant Ops: 6,780, Local Ops: 2,022, Military Ops: 3,192)
- Sacramento Mather Airport (MHR) (Runways: 4, Commercial Ops: 4,781, Air Taxi Ops: 12,493, Itinerant Ops: 36,778, Local Ops: 13,713, Military Ops: 31,702)
- Sacramento Executive Airport (SAC) (Runways: 4, Air Taxi Ops: 3,736, Itinerant Ops: 66,054, Local Ops: 17,713, Military Ops: 510)
- Mc Clellan Airfield Airport (MCC) (Runways: 5, Air Taxi Ops: 5,000, Itinerant Ops: 6,000, Local Ops: 4,000, Military Ops: 3,000)
- Lauppes Strip Airport (CA22) (Runways: 1)
- California Highway Patrol Hq Heliport (61CN)
- Kaiser Permanente South Sacramento Heliport (6CN6)
- Lake Park Helistop Heliport (1CL6)
- Uc Davis Medical Center Tower Ii Heliport (3CL0)
Amtrak station:
SACRAMENTO (401 I ST.) . Services: ticket office, partially wheelchair accessible, enclosed waiting area, public restrooms, public payphones, vending machines, paid short-term parking, paid long-term parking, call for car rental service, call for taxi service, public transit connection.Biggest Colleges/Universities in Sacramento:
- California State University-Sacramento (Full-time enrollment: 22,234; Location: 6000 J St; Public; Website: www.csus.edu; Offers Doctor's degree)
- American River College (Full-time enrollment: 20,452; Location: 4700 College Oak Dr; Public; Website: www.arc.losrios.edu/)
- Sacramento City College (Full-time enrollment: 15,963; Location: 3835 Freeport Blvd; Public; Website: www.scc.losrios.edu/)
- Cosumnes River College (Full-time enrollment: 9,327; Location: 8401 Center Parkway; Public; Website: www.crc.losrios.edu/)
- Universal Technical Institute of Northern California Inc (Full-time enrollment: 3,193; Location: 4100 Duckhorn Drive; Private, for-profit; Website: www.uti.edu/)
- University of Phoenix-Sacramento Valley Campus (Full-time enrollment: 2,855; Location: 2860 Gateway Oaks Drive; Private, for-profit; Website: www.phoenix.edu; Offers Master's degree)
- Carrington College California-Sacramento (Full-time enrollment: 1,556; Location: 8909 Folsom Blvd; Private, for-profit; Website: www.carrington.edu)
- The Art Institute of California-Argosy University Sacramento (Full-time enrollment: 1,157; Location: 2850 Gateway Oaks Dr., Suite 100; Private, for-profit; Website: www.artinstitutes.edu/sacramento/)
- Charles A Jones Career and Education Center (Full-time enrollment: 1,066; Location: 5451 Lemon Hill Ave; Public; Website: www.caj.scusd.edu)
- MTI College (Full-time enrollment: 953; Location: 5221 Madison Ave; Private, for-profit; Website: sacramento.mticollege.edu)
- Marinello Schools of Beauty-Sacramento (Full-time enrollment: 926; Location: 5522 Garfield Ave; Private, for-profit; Website: www.marinello.com)
- Kaplan College-Sacramento (Full-time enrollment: 895; Location: 4330 Watt Ave., Suite 400; Private, for-profit; Website: www.kaplancollege.com/sacramento-ca/)
- Anthem College-Sacramento (Full-time enrollment: 682; Location: 9738 Lincoln Village Drive #100; Private, for-profit; Website: www.anthem.edu)
- Asher College (Full-time enrollment: 655; Location: 1215 Howe Ave Suite 101; Private, for-profit; Website: www.asher.edu)
- Le Cordon Bleu College of Culinary Arts-Sacramento (Full-time enrollment: 576; Location: 2450 Del Paso Road; Private, for-profit; Website: www.chefs.edu/Sacramento)
- Paul Mitchell the School-Sacramento (Full-time enrollment: 412; Location: 2100 Arden Way Ste 265; Private, for-profit; Website: thecaliforniaacademy.com)
- International Academy of Design and Technology-Sacramento (Full-time enrollment: 336; Location: 2450 Del Paso Road-St 250; Private, for-profit; Website: www.iadtsacramento.com)
- Federico Beauty Institute (Full-time enrollment: 294; Location: 1515 Sports Drive Ste 100; Private, for-profit; Website: federico.edu)
- Epic Bible College (Full-time enrollment: 199; Location: 4330 Auburn Boulevard; Private, not-for-profit; Website: EPIC.edu)
- CET-Sacramento (Full-time enrollment: 157; Location: 8376 Fruitridge Road; Private, not-for-profit; Website: www.cetweb.org/index.php)
Biggest public high schools in Sacramento:
- SHELDON HIGH (Students: 1,699, Location: 8333 KINGSBRIDGE DR., Grades: 9-12)
- JOHN F. KENNEDY HIGH (Students: 1,513, Location: 6715 GLORIA DR., Grades: 9-12)
- C. K. MCCLATCHY HIGH (Students: 1,437, Location: 3066 FREEPORT BLVD., Grades: 9-12)
- LUTHER BURBANK HIGH (Students: 1,338, Location: 3500 FLORIN RD., Grades: 9-12)
- GRANT UNION HIGH (Students: 1,258, Location: 1400 GRAND AVE., Grades: 9-12)
- EL CAMINO FUNDAMENTAL HIGH (Students: 1,208, Location: 4300 EL CAMINO AVE., Grades: 9-12)
- ROSEMONT HIGH (Students: 1,207, Location: 9594 KIEFER BLVD., Grades: 9-12)
- HIRAM W. JOHNSON HIGH (Students: 1,195, Location: 6879 14TH AVE., Grades: 9-12)
- INDERKUM HIGH (Students: 1,149, Location: 2500 NEW MARKET DR., Grades: 9-12)
- FLORIN HIGH (Students: 1,145, Location: 7956 COTTONWOOD LN., Grades: 9-12)
Biggest private high schools in Sacramento:
- BRADSHAW CHRISTIAN SCHOOL (Students: 1,150, Location: 8324 BRADSHAW RD, Grades: PK-12)
- ST FRANCIS HIGH SCHOOL (Students: 1,112, Location: 5900 ELVAS AVE, Grades: 9-12, Girls only)
- CAPITAL CHRISTIAN SCHOOL (Students: 1,065, Location: 9470 MICRON AVE, Grades: PK-12)
- CHRISTIAN BROTHERS HIGH SCHOOL (Students: 976, Location: 4315 MARTIN LUTHER KING JR BLVD, Grades: 9-12)
- SACRAMENTO COUNTRY DAY SCHOOL (Students: 468, Location: 2636 LATHAM DR, Grades: PK-12)
- AL-ARQAM ISLAMIC SCHOOL (Students: 331, Location: 6990 65TH ST, Grades: PK-12)
- CRISTO REY HIGH SCHOOL (Students: 283, Location: 6200 MCMAHON DR, Grades: 9-12)
- POINT QUEST EDUCATION (Students: 116, Location: 6600 44TH ST STE A, Grades: UG-12)
- NORTHERN CA PREP SCHOOL (Students: 83, Location: 6046 LEMON HILL AVE, Grades: UG-12)
- SIERRA SCHOOL EASTERN (Students: 76, Location: 1150 EASTERN AVE, Grades: 1-12)
Biggest public elementary/middle schools in Sacramento:
- SUTTER MIDDLE (Students: 1,253, Location: 3150 I ST., Grades: 7-8)
- T. R. SMEDBERG MIDDLE (Students: 1,134, Location: 8239 KINGSBRIDGE DR., Grades: 7-8)
- ANTELOPE CROSSING MIDDLE (Students: 955, Location: 9200 PALMERSON DR., Grades: 6-8)
- JAMES RUTTER MIDDLE (Students: 909, Location: 7350 PALMER HOUSE DR., Grades: 7-8)
- FOOTHILL RANCH MIDDLE (Students: 873, Location: 5001 DIABLO DR., Grades: 5-8)
- NATOMAS MIDDLE (Students: 814, Location: 3200 N. PARK DR., Grades: 6-8)
- SAMUEL JACKMAN MIDDLE (Students: 802, Location: 7925 KENTWAL DR., Grades: 7-8)
- ALBERT EINSTEIN MIDDLE (Students: 763, Location: 9325 MIRANDY DR., Grades: 7-8)
- SMYTHE ACADEMY OF ARTS AND SCIENCES (Students: 756, Location: 2781 N.GATE BLVD., Grades: KG-8, Charter school)
- ARDEN MIDDLE (Students: 702, Location: 1640 WATT AVE., Grades: 6-8)
Biggest private elementary/middle schools in Sacramento:
- ST MARY SCHOOL (Students: 384, Location: 1351 58TH ST, Grades: KG-8)
- ST IGNATIUS PARISH SCHOOL (Students: 384, Location: 3245 ARDEN WAY, Grades: PK-8)
- HOLY SPIRIT PARISH SCHOOL (Students: 311, Location: 3920 W LAND PARK DR, Grades: KG-8)
- ST FRANCIS OF ASSISI ELEMENTARY SCHOOL (Students: 310, Location: 2500 K ST, Grades: KG-8)
- SACRED HEART ELEMENTARY SCHOOL (Students: 302, Location: 856 39TH ST, Grades: KG-8)
- ST ROBERT SCHOOL (Students: 261, Location: 2251 IRVIN WAY, Grades: PK-8)
- PRESENTATION OF THE BLESSED MARY SCHOOL (Students: 260, Location: 3100 NORRIS AVE, Grades: PK-8)
- ST CHARLES BORROMEO SCHOOL (Students: 218, Location: 7580 CENTER PKWY, Grades: PK-8)
- SHALOM SCHOOL (Students: 208, Location: 2320 SIERRA BLVD, Grades: PK-6)
- MERRYHILL SCHOOL CALVINE (Students: 186, Location: 9036 CALVINE RD, Grades: KG-6)
User-submitted facts and corrections:
- You did not include Sutter Memorial Hospital, 5151 F Street in your list of hospitals.
- Justice Anthony Kennedy was also born in Sacramento, 7-23-1936. added by Gonzo
Points of interest:
Notable locations in Sacramento: Camp Pollock (A), Bing Maloney Golf Course (B), California State Exposition (C), Sacramento Wastewater Treatment Plant (D), William Land Municipal Golf Course (E), Waterworld USA (F), Sacramento Zoo (G), Sacramento Amtrak Station (H), Cal Expo Horse Race Track (I), Dippenbrock Landing (J), E A Fairbairn Treatment Plant (K), Campus Commons Golf Course (L), Peoples Market (M), Sacramento Filtration Plant (N), Westfield Shoppingtown Downtown Plaza (O), Sacramento Marina (P), Fairytale Town (Q), Swallows Nest Country Club (R), Haggin Oaks Municipal Golf Course North (S), City College Light Rail Station (T). Display/hide their locations on the map
Shopping Centers: South Hills Shopping Center (1), Meadowview Plaza Shopping Center (2), Franklin and Florin Shopping Center (3), Farmers Center Shopping Center (4), Valley Hi Village Shopping Center (5), Southpointe Shopping Center (6), Point West Plaza Shopping Center (7), Northgate Shopping Center (8), Market Square at Arden Fair Shopping Center (9). Display/hide their locations on the map
Main business address in Sacramento include: OPHTHALMIC IMAGING SYSTEMS (A), PLACER SIERRA BANCSHARES (B), ALTERNATIVE TECHNOLOGY RESOURCES INC (C), AMERICAN RIVER BANKSHARES (D). Display/hide their locations on the map
Churches in Sacramento include: Calvary Christian Center (A), Calvary Church of Deliverance (B), Christian Outreach Fellowship Church (C), Del Paso Church of God (D), Del Paso General Baptist Church (E), Faith Temple Church of God in Christ (F), First Samoan Assembly of God Church (G), Greater Grace Community Apostolic Church (H), Kingdom Hall Jehovahs Witnesses (I). Display/hide their locations on the map
Cemeteries: Saint Josephs Cemetery (1), Home of Peace Cemetery (2), Sunset Lawn Cemetery (3), Sacramento Memorial Lawn Cemetery (4), East Lawn Memorial Cemetery (5), Elder Creek Cemetery (6), Masonic Lawn Cemetery (7). Display/hide their locations on the map
Lakes and reservoirs: Lake Greenhaven (A), Fishermans Lake (B). Display/hide their locations on the map
Streams, rivers, and creeks: Elder Creek (A), Laguna Creek (B), Magpie Creek (C), Strawberry Creek (D), Steelhead Creek (E), Florin Creek (F), Chicken Ranch Slough (G), American River (H), Dry Creek (I). Display/hide their locations on the map
Parks in Sacramento include: McKinley Park (1), Alkali Playground (2), Miller Park (3), Baer Park (4), Bahnfieth Park (5), California Vietnam Veterans Memorial (6), Hornet Stadium (7), Muir Playground (8), Wells Fargo Pavilion (9). Display/hide their locations on the map
Tourist attractions: California State Railroad Museum (111 I Street) (1), California State Railroad Museum - Business Office (111 I Street) (2), California Military Museum (1119 2nd St) (3), Sports Travel (Ski & Helicopter Tours; 4601 Francis Court) (4), All Things Watercolor (Art Museums; 8344 Citadel Way ) (5), Winterset Ski & Snowboard Adventures (Ski & Helicopter Tours; 4601 Francis Court) (6), Discovery Museum Science & Space Center (Cultural Attractions- Events- & Facilities; 3615 Auburn Boulevard) (7), Discovery Museum History Center (Cultural Attractions- Events- & Facilities; 101 I Street) (8), Croker Art Museum (Cultural Attractions- Events- & Facilities; 216 O Street) (9). Display/hide their approximate locations on the map
Hotels: Best Western Sutter House (1100 H Street) (1), Best for Less Motel-Cababa Lodge (430 16th Street) (2), AAA Residence Inn (3721 Watt Avenue) (3), 49ER Motor Lodge (2730 Auburn Boulevard) (4), Best Western John Jay Inn (15 Massie Court) (5), Best Choice Value Inns & Suites (228 Jibboom Street) (6), Best Western Sandman Motel (236 Jibboom Street) (7), American Inn (626 16th Street) (8), Best Western Expo Inn (1413 Howe Avenue) (9). Display/hide their approximate locations on the map
Courts: California State - Judicial Council- Office of Governmental Affairs (770 L Street Suite 700) (1), Sacramento County Office of Education - Juvenile Court Schools (10474 Mather Boulevard) (2), California State - Supreme Court- Clerk's Office (Library Courts Building) (3), Federal Bureau Of Investigation Resident Agency - Sacramento (901 Tower Way) (4), United States Government - Courts- Bankruptcy Court- Clerk (501 I Street) (5), United States Government - Courts- District Court- Clerk Of The Us District C (501 I Street) (6). Display/hide their approximate locations on the map
Birthplace of: Dustin Lance Black - Film director, Aimée Crocker - Socialite, Thomas Kinkade - Painter, Teal Wicks - Singer, Hiram Johnson, Jon Hinck - Lawyer, Geno Petralli - Baseball player, Christina Von Eerie - Professional wrestler, Scott Boras - Lawyer, Mr. Lobo - Television personality.
Drinking water stations with addresses in Sacramento and their reported violations in the past:
CALIFORNIA STATE FAIR (Address: UNIT 800 , Population served: 90,000, Groundwater):Past monitoring violations:UCD MEDICAL CENTER (Population served: 2,340, Groundwater):
- Monitoring and Reporting (DBP) - In OCT-01-2007, Contaminant: DBP Stage 1. Follow-up actions: St Formal NOV issued (NOV-16-2007)
- Monitoring and Reporting (DBP) - Between OCT-2007 and DEC-2007, Contaminant: Total Haloacetic Acids (HAA5). Follow-up actions: St Formal NOV issued (NOV-16-2007)
- Monitoring and Reporting (DBP) - Between OCT-2007 and DEC-2007, Contaminant: TTHM. Follow-up actions: St Formal NOV issued (NOV-16-2007)
- One routine major monitoring violation
Past monitoring violations:SACRAMENTO SIKH SOCIETY (Population served: 300, Groundwater):
- 2 routine major monitoring violations
- 2 regular monitoring violations
Past monitoring violations:COZY VILLA MHP [SWS] (Population served: 136, Groundwater):
- One regular monitoring violation
Past monitoring violations:OCEAN KING BUILDING (SWS) (Population served: 100, Groundwater):
- 11 routine major monitoring violations
- 2 minor monitoring violations
Past monitoring violations:SAHOTA TRUCK PLAZA (Population served: 100, Groundwater):
- 6 routine major monitoring violations
- One regular monitoring violation
Past monitoring violations:HAMILTON STREET PARK (Population served: 100, Groundwater):
- 5 routine major monitoring violations
- 4 regular monitoring violations
Past monitoring violations:BLUE SPRUCE MOBILE HOME PARK (Population served: 90, Groundwater):
- Monitoring, Repeat Major (TCR) - In FEB-2014, Contaminant: Coliform (TCR). Follow-up actions: St AO (w/o penalty) issued (MAR-28-2014)
- 3 routine major monitoring violations
- 4 minor monitoring violations
- 2 regular monitoring violations
Past monitoring violations:
- 6 regular monitoring violations
Drinking water stations with addresses in Sacramento that have no violations reported:
- CALAM - LINCOLN OAKS (Population served: 46,606, Primary Water Source Type: Purch surface water)
- CALAM - PARKWAY (Population served: 44,949, Primary Water Source Type: Purch surface water)
- CALAM - ANTELOPE (Population served: 34,168, Primary Water Source Type: Purch surface water)
- CALAM - SUBURBAN (Population served: 33,914, Primary Water Source Type: Groundwater)
- CALAM - ARDEN (Population served: 4,204, Primary Water Source Type: Groundwater)
- CALAM - WEST PLACER (Population served: 3,188, Primary Water Source Type: Purch surface water)
- SLAVIC MISSIONARY CHURCH INC (Population served: 1,800, Primary Water Source Type: Groundwater)
- CALAM - ISLETON (Population served: 1,254, Primary Water Source Type: Groundwater)
- CALAM - WALNUT GROVE (Population served: 644, Primary Water Source Type: Groundwater)
- SACRAMENTO RACEWAY (Population served: 500, Primary Water Source Type: Groundwater)
| This city: | 2.6 people |
| California: | 2.9 people |
| This city: | 59.4% |
| Whole state: | 68.7% |
| This city: | 9.0% |
| Whole state: | 7.2% |
Likely homosexual households (counted as self-reported same-sex unmarried-partner households)
- Lesbian couples: 0.8% of all households
- Gay men: 0.6% of all households
People in group quarters in Sacramento in 2010:
- 2,144 people in local jails and other municipal confinement facilities
- 1,493 people in college/university student housing
- 1,367 people in nursing facilities/skilled-nursing facilities
- 937 people in other noninstitutional facilities
- 663 people in group homes intended for adults
- 486 people in emergency and transitional shelters (with sleeping facilities) for people experiencing homelessness
- 355 people in residential treatment centers for adults
- 334 people in workers' group living quarters and job corps centers
- 182 people in mental (psychiatric) hospitals and psychiatric units in other hospitals
- 110 people in correctional residential facilities
- 85 people in hospitals with patients who have no usual home elsewhere
- 79 people in group homes for juveniles (non-correctional)
- 42 people in residential treatment centers for juveniles (non-correctional)
- 18 people in in-patient hospice facilities
- 13 people in correctional facilities intended for juveniles
- 6 people in residential schools for people with disabilities
People in group quarters in Sacramento in 2000:
- 1,996 people in local jails and other confinement facilities (including police lockups)
- 1,917 people in nursing homes
- 1,814 people in other noninstitutional group quarters
- 907 people in college dormitories (includes college quarters off campus)
- 427 people in short-term care, detention or diagnostic centers for delinquent children
- 357 people in homes or halfway houses for drug/alcohol abuse
- 305 people in homes for the mentally retarded
- 230 people in job corps and vocational training facilities
- 193 people in mental (psychiatric) hospitals or wards
- 185 people in homes for the mentally ill
- 96 people in other group homes
- 92 people in military transient quarters for temporary residents
- 90 people in hospitals/wards and hospices for chronically ill
- 90 people in other nonhousehold living situations
- 67 people in homes for the physically handicapped
- 58 people in halfway houses
- 58 people in hospices or homes for chronically ill
- 58 people in homes for abused, dependent, and neglected children
- 41 people in residential treatment centers for emotionally disturbed children
- 32 people in other hospitals or wards for chronically ill
- 31 people in schools, hospitals, or wards for the intellectually disabled
- 25 people in religious group quarters
- 8 people in unknown juvenile institutions
- 7 people in orthopedic wards and institutions for the physically handicapped
- 5 people in other types of correctional institutions
- 3 people in other workers' dormitories
Banks with most branches in Sacramento (2011 data):
- Bank of America, National Association: 20 branches. Info updated 2009/11/18: Bank assets: $1,451,969.3 mil, Deposits: $1,077,176.8 mil, headquarters in Charlotte, NC, positive income, 5782 total offices, Holding Company: Bank Of America Corporation
- JPMorgan Chase Bank, National Association: 19 branches. Info updated 2011/11/10: Bank assets: $1,811,678.0 mil, Deposits: $1,190,738.0 mil, headquarters in Columbus, OH, positive income, International Specialization, 5577 total offices, Holding Company: Jpmorgan Chase & Co.
- Wells Fargo Bank, National Association: 19 branches. Info updated 2011/04/05: Bank assets: $1,161,490.0 mil, Deposits: $905,653.0 mil, headquarters in Sioux Falls, SD, positive income, 6395 total offices, Holding Company: Wells Fargo & Company
- U.S. Bank National Association: 11 branches. Info updated 2012/01/30: Bank assets: $330,470.8 mil, Deposits: $236,091.5 mil, headquarters in Cincinnati, OH, positive income, 3121 total offices, Holding Company: U.S. Bancorp
- Citibank, National Association: 5618 Freeport Blvd Branch, Arden Way Branch, Marconi Ave Branch, 436 Howe Ave Branch, Alhambra Blvd Branch, 7231 Greenhaven Dr Branch. Info updated 2012/01/10: Bank assets: $1,288,658.0 mil, Deposits: $882,541.0 mil, headquarters in Sioux Falls, SD, positive income, International Specialization, 1048 total offices, Holding Company: Citigroup Inc.
- The Merchants National Bank of Sacramento: The Merchants National Bank Of Sacra, Merchants National Branch, Mnb Mobile Branch, Mnb Mobile Branch. Info updated 2006/11/03: Bank assets: $184.9 mil, Deposits: $164.5 mil, local headquarters, positive income, Mortgage Lending Specialization, 4 total offices, Holding Company: Merchants Holding Company
- American River Bank: Limited Service (Courier) Branch, at 1545 River Park Drive, Capitol Mall Office, Business Park Drive Branch. Info updated 2006/11/03: Bank assets: $581.6 mil, Deposits: $467.4 mil, local headquarters, positive income, Commercial Lending Specialization, 12 total offices, Holding Company: American River Bankshares
- Tri Counties Bank: Sacramento Arden Fair, North Natomas, Natomas Arena Blvd Branch, Antelope Branch. Info updated 2011/09/26: Bank assets: $2,554.4 mil, Deposits: $2,191.2 mil, headquarters in Chico, CA, positive income, Commercial Lending Specialization, 71 total offices, Holding Company: Trico Bancshares
- Bank of the West: Sacramento Main Branch, Country Club Branch, Arden Branch, Loehmann's Plaza Branch. Info updated 2009/11/16: Bank assets: $62,408.3 mil, Deposits: $43,995.2 mil, headquarters in San Francisco, CA, positive income, 647 total offices, Holding Company: Bnp Paribas
- 22 other banks with 36 local branches
For population 15 years and over in Sacramento:
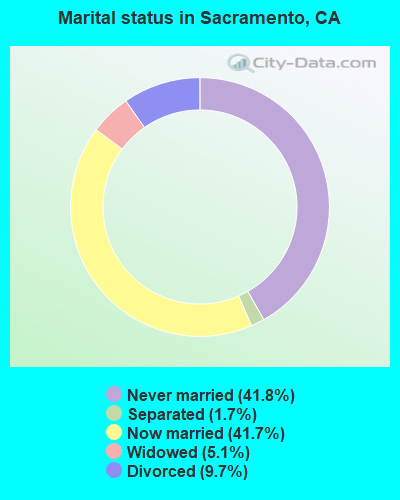
- Never married: 41.8%
- Now married: 41.7%
- Separated: 1.7%
- Widowed: 5.1%
- Divorced: 9.7%
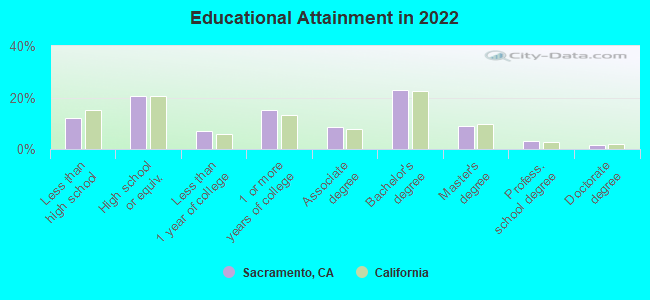
For population 25 years and over in Sacramento:
- High school or higher: 88.0%
- Bachelor's degree or higher: 36.9%
- Graduate or professional degree: 13.8%
- Unemployed: 4.0%
- Mean travel time to work (commute): 19.2 minutes
| Here: | 14.0 |
| California average: | 15.5 |


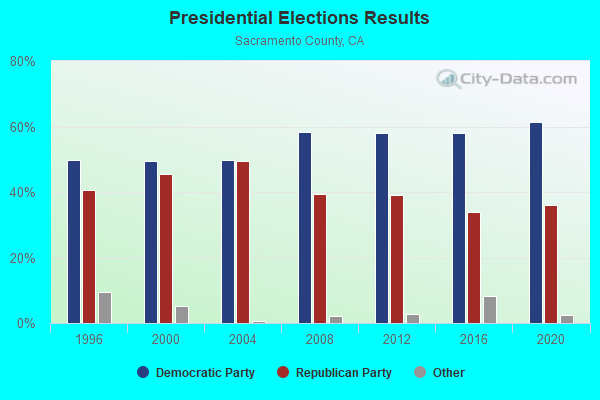
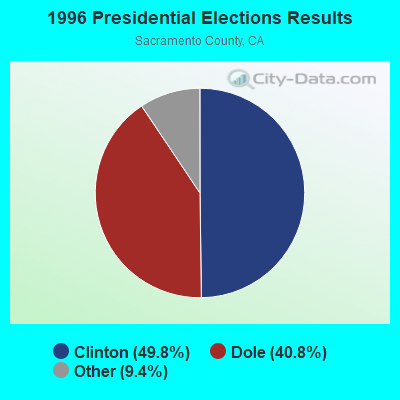
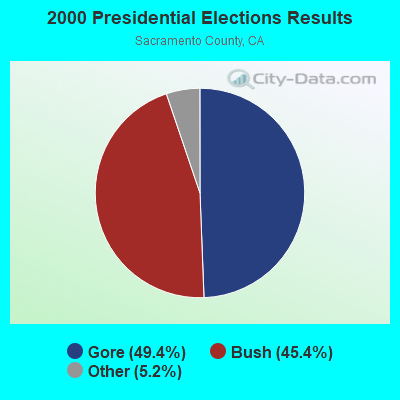
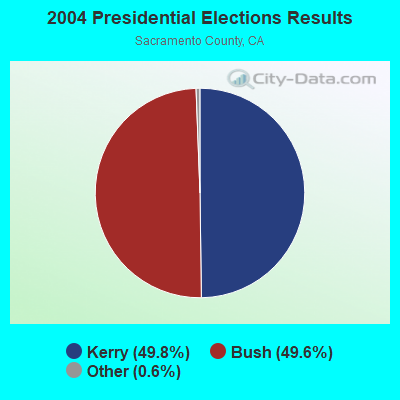
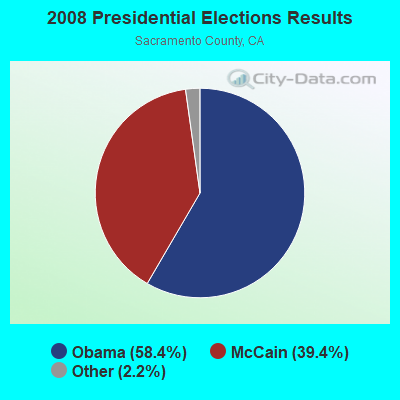
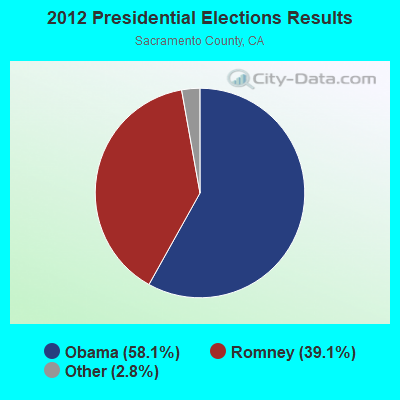
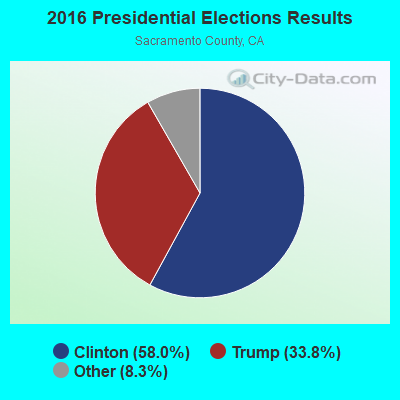
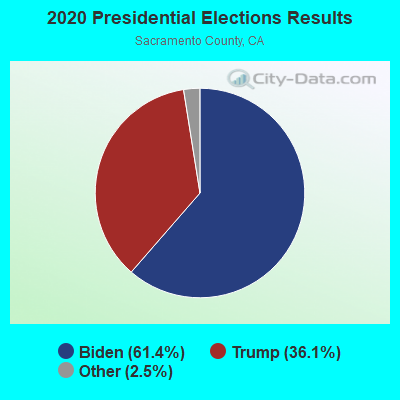
Graphs represent county-level data. Detailed 2008 Election Results
Neighborhoods in Sacramento:
(Sacramento, California Neighborhood Map)- Airport neighborhood
- Alhambra Triangle neighborhood
- Alkali Flats neighborhood
- American River Parkway neighborhood
- Arden Fair neighborhood
- Ben Ali neighborhood
- Brentwood neighborhood
- Cal Expo neighborhood
- Campus Commons neighborhood
- Cannon Industrial Park neighborhood
- Carleton Tract neighborhood
- Central Oak Park neighborhood
- Colonial Heights neighborhood
- Colonial Village neighborhood
- Curtis Park neighborhood
- Del Paso Heights neighborhood
- Del Paso Park neighborhood
- Dos Rios Triangle neighborhood
- Downtown neighborhood
- East Del Paso Heights neighborhood
- East Sacramento neighborhood
- Erikson Industrial Park neighborhood
- Fairgrounds neighborhood
- Florin Fruitridge Industrial Park neighborhood
- Freeport Manor neighborhood
- Fruitridge Manor neighborhood
- Gardenland neighborhood
- Glen Elder neighborhood
- Glenwood Meadows neighborhood
- Golf Course Terrace neighborhood
- Granite Regional Park neighborhood
- Hansen Park Golf Course Site neighborhood
- Hollywood Park neighborhood
- Johnson Business Park neighborhood
- Johnson Heights neighborhood
- Land Park neighborhood
- Lawrence Park neighborhood
- Little Pocket neighborhood
- Mangen Park neighborhood
- Mansion Flats neighborhood
- Meadowview neighborhood
- Med Center neighborhood
- Newton Booth neighborhood
- Noralto neighborhood
- North City Farms neighborhood
- North Oak Park neighborhood
- Northgate neighborhood
- Northpointe neighborhood
- Norwood Tech neighborhood
- Oak Knoll neighborhood
- Old North Sacramento neighborhood
- Packard Bell neighborhood
- Pocket neighborhood
- Point West neighborhood
- Raley Industrial Park neighborhood
- Richards (Southern Pacific) neighborhood
- Richmond Grove neighborhood
- River Park neighborhood
- Robla neighborhood
- Sacramento City College (SCC) neighborhood
- Sierra Oaks neighborhood
- South City Farms neighborhood
- South East neighborhood
- South Hagginwood neighborhood
- South Land Park neighborhood
- South Natomas neighborhood
- South Oak Park neighborhood
- Southside Park neighborhood
- Strawberry Manor neighborhood
- Swanston Estates neighborhood
- Tahoe Park neighborhood
- Tahoe Park East neighborhood
- Tahoe Park South neighborhood
- Tallac Village neighborhood
- Upper Land Park neighborhood
- Village Green neighborhood
- West Del Paso Heights neighborhood
- West Tahoe Park neighborhood
- Wills Acres neighborhood
- Woodbine neighborhood
- Woodlake neighborhood
- Z'berg Park neighborhood
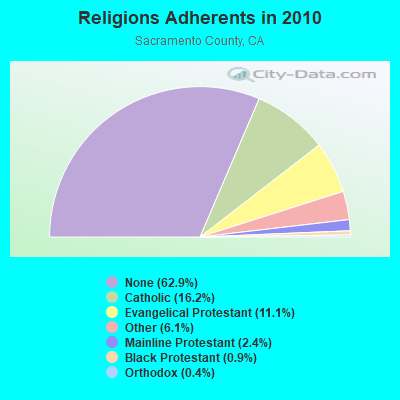
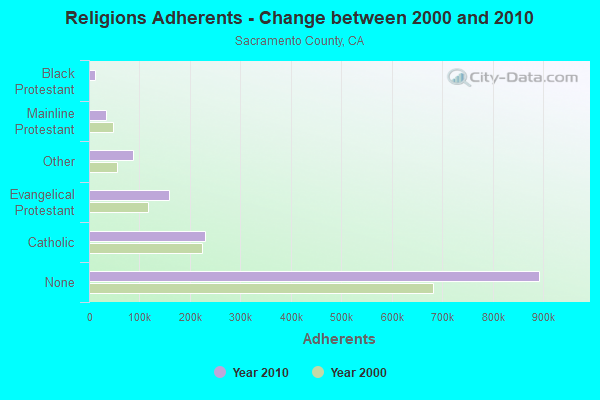
Religion statistics for Sacramento, CA (based on Sacramento County data)
| Religion | Adherents | Congregations |
|---|---|---|
| Catholic | 229,725 | 45 |
| Evangelical Protestant | 157,621 | 493 |
| Other | 86,390 | 183 |
| Mainline Protestant | 33,989 | 105 |
| Black Protestant | 12,585 | 38 |
| Orthodox | 5,675 | 12 |
| None | 892,803 | - |
Food Environment Statistics:
| This county: | 1.85 / 10,000 pop. |
| State: | 2.14 / 10,000 pop. |
| Here: | 0.07 / 10,000 pop. |
| State: | 0.04 / 10,000 pop. |
| Here: | 0.62 / 10,000 pop. |
| State: | 0.62 / 10,000 pop. |
| Sacramento County: | 1.69 / 10,000 pop. |
| State: | 1.49 / 10,000 pop. |
| Here: | 6.68 / 10,000 pop. |
| California: | 7.42 / 10,000 pop. |
| This county: | 7.8% |
| California: | 7.3% |
| Sacramento County: | 25.0% |
| State: | 21.3% |
| Sacramento County: | 15.4% |
| California: | 17.9% |
Health and Nutrition:
| This city: | 50.5% |
| California: | 49.4% |
| Sacramento: | 48.8% |
| California: | 48.0% |
| This city: | 28.1 |
| California: | 28.1 |
| Sacramento: | 19.0% |
| California: | 20.2% |
| This city: | 12.6% |
| California: | 11.2% |
| Here: | 6.8 |
| California: | 6.8 |
| Sacramento: | 31.1% |
| California: | 31.5% |
| This city: | 56.9% |
| California: | 56.4% |
| This city: | 81.4% |
| California: | 80.9% |
More about Health and Nutrition of Sacramento, CA Residents
| Local government employment and payroll (March 2022) | |||||
| Function | Full-time employees | Monthly full-time payroll | Average yearly full-time wage | Part-time employees | Monthly part-time payroll |
|---|---|---|---|---|---|
| Police Protection - Officers | 692 | $9,297,285 | $161,225 | 38 | $48,469 |
| Firefighters | 624 | $8,372,012 | $161,000 | 0 | $0 |
| Parks and Recreation | 384 | $2,209,446 | $69,045 | 443 | $373,062 |
| Water Supply | 344 | $2,690,920 | $93,869 | 4 | $9,385 |
| Other and Unallocable | 331 | $2,236,150 | $81,069 | 2 | $3,075 |
| Police - Other | 294 | $1,983,557 | $80,962 | 32 | $109,058 |
| Financial Administration | 274 | $2,309,878 | $101,163 | 1 | $2,583 |
| Streets and Highways | 271 | $2,213,925 | $98,034 | 1 | $1,895 |
| Other Government Administration | 246 | $1,995,156 | $97,325 | 16 | $85,354 |
| Solid Waste Management | 160 | $978,913 | $73,418 | 0 | $0 |
| Sewerage | 133 | $1,093,607 | $98,671 | 0 | $0 |
| Housing and Community Development (Local) | 106 | $830,535 | $94,023 | 1 | $2,586 |
| Judicial and Legal | 58 | $722,254 | $149,432 | 0 | $0 |
| Fire - Other | 47 | $297,279 | $75,901 | 0 | $0 |
| Natural Resources | 31 | $178,449 | $69,077 | 0 | $0 |
| Welfare | 3 | $24,520 | $98,080 | 0 | $0 |
| Totals for Government | 3,998 | $37,433,884 | $112,358 | 538 | $635,465 |
Sacramento government finances - Expenditure in 2021 (per resident):
- Construction - General - Other: $181,718,000 ($344.16)
Regular Highways: $74,973,000 ($141.99)
Parks and Recreation: $72,895,000 ($138.06)
Housing and Community Development: $40,461,000 ($76.63)
Water Utilities: $34,827,000 ($65.96)
Sewerage: $29,037,000 ($54.99)
Police Protection: $15,361,000 ($29.09)
Solid Waste Management: $831,000 ($1.57)
Public Welfare - Other: $804,000 ($1.52)
Local Fire Protection: $600,000 ($1.14)
Libraries: $581,000 ($1.10)
General Public Buildings: $510,000 ($0.97)
Parking Facilities: $379,000 ($0.72)
Health - Other: $56,000 ($0.11)
Central Staff Services: $19,000 ($0.04)
- Current Operations - Police Protection: $211,124,000 ($399.86)
Housing and Community Development: $193,115,000 ($365.75)
General - Other: $192,379,000 ($364.35)
Local Fire Protection: $145,352,000 ($275.29)
Central Staff Services: $130,769,000 ($247.67)
Water Utilities: $65,268,000 ($123.61)
Solid Waste Management: $62,440,000 ($118.26)
Parks and Recreation: $60,549,000 ($114.68)
Sewerage: $56,073,000 ($106.20)
Protective Inspection and Regulation - Other: $35,850,000 ($67.90)
Regular Highways: $28,669,000 ($54.30)
Health - Other: $26,206,000 ($49.63)
Libraries: $21,222,000 ($40.19)
Parking Facilities: $17,356,000 ($32.87)
Financial Administration: $13,999,000 ($26.51)
Judicial and Legal Services: $7,378,000 ($13.97)
Public Welfare - Other: $3,343,000 ($6.33)
Sea and Inland Port Facilities: $1,000,000 ($1.89)
- General - Interest on Debt: $93,936,000 ($177.91)
- Other Capital Outlay - Local Fire Protection: $11,312,000 ($21.42)
Police Protection: $2,728,000 ($5.17)
General - Other: $1,100,000 ($2.08)
Health - Other: $620,000 ($1.17)
Sewerage: $295,000 ($0.56)
Financial Administration: $96,000 ($0.18)
Parks and Recreation: $78,000 ($0.15)
Water Utilities: $71,000 ($0.13)
Judicial and Legal Services: $15,000 ($0.03)
- Water Utilities - Interest on Debt: $12,953,000 ($24.53)
Sacramento government finances - Revenue in 2021 (per resident):
- Charges - Other: $201,911,000 ($382.41)
Sewerage: $84,677,000 ($160.37)
Solid Waste Management: $73,465,000 ($139.14)
Parking Facilities: $11,494,000 ($21.77)
Regular Highways: $1,291,000 ($2.45)
Parks and Recreation: $573,000 ($1.09)
- Federal Intergovernmental - Other: $157,970,000 ($299.19)
Housing and Community Development: $3,007,000 ($5.70)
- Miscellaneous - Donations From Private Sources: $70,226,000 ($133.00)
Special Assessments: $50,637,000 ($95.90)
General Revenue - Other: $39,861,000 ($75.49)
Rents: $9,881,000 ($18.71)
Fines and Forfeits: $7,891,000 ($14.95)
Interest Earnings: $4,835,000 ($9.16)
Sale of Property: $5,000 ($0.01)
- Revenue - Water Utilities: $144,070,000 ($272.86)
- State Intergovernmental - Other: $34,133,000 ($64.65)
Highways: $19,929,000 ($37.74)
General Local Government Support: $936,000 ($1.77)
Water Utilities: $185,000 ($0.35)
Public Welfare: $30,000 ($0.06)
- Tax - General Sales and Gross Receipts: $234,213,000 ($443.58)
Property: $199,441,000 ($377.73)
Public Utilities Sales: $67,823,000 ($128.45)
Occupation and Business License - Other: $33,923,000 ($64.25)
Other License: $30,662,000 ($58.07)
Documentary and Stock Transfer: $15,570,000 ($29.49)
Other Selective Sales: $3,093,000 ($5.86)
Sacramento government finances - Debt in 2021 (per resident):
- Long Term Debt - Beginning Outstanding - Unspecified Public Purpose: $2,206,020,000 ($4178.06)
Outstanding Unspecified Public Purpose: $2,050,376,000 ($3883.28)
Beginning Outstanding - Public Debt for Private Purpose: $202,544,000 ($383.61)
Outstanding Nonguaranteed - Industrial Revenue: $189,160,000 ($358.26)
Retired Unspecified Public Purpose: $183,741,000 ($347.99)
Issue, Unspecified Public Purpose: $28,097,000 ($53.21)
Retired Nonguaranteed - Public Debt for Private Purpose: $13,384,000 ($25.35)
Sacramento government finances - Cash and Securities in 2021 (per resident):
- Bond Funds - Cash and Securities: $223,656,000 ($423.59)
- Other Funds - Cash and Securities: $526,519,000 ($997.19)
- Sinking Funds - Cash and Securities: $217,569,000 ($412.06)
5.68% of this county's 2021 resident taxpayers lived in other counties in 2020 ($67,729 average adjusted gross income)
| Here: | 5.68% |
| California average: | 5.19% |
0.01% of residents moved from foreign countries ($150 average AGI)
Sacramento County: 0.01% California average: 0.03%
Top counties from which taxpayers relocated into this county between 2020 and 2021:
| from Placer County, CA | |
| from Alameda County, CA | |
| from Yolo County, CA |
6.10% of this county's 2020 resident taxpayers moved to other counties in 2021 ($74,281 average adjusted gross income)
| Here: | 6.10% |
| California average: | 6.14% |
0.01% of residents moved to foreign countries ($109 average AGI)
Sacramento County: 0.01% California average: 0.02%
Top counties to which taxpayers relocated from this county between 2020 and 2021:
| to Placer County, CA | |
| to Yolo County, CA | |
| to El Dorado County, CA |
| Businesses in Sacramento, CA | ||||
| Name | Count | Name | Count | |
|---|---|---|---|---|
| 24 Hour Fitness | 6 | Johnny Rockets | 2 | |
| 7-Eleven | 17 | Jones New York | 14 | |
| 99 Cents Only Stores | 7 | Journeys | 2 | |
| ALDO | 1 | Juicy Couture | 1 | |
| AMF Bowling | 3 | Justice | 1 | |
| AT&T | 13 | KFC | 15 | |
| Abercrombie & Fitch | 1 | Kincaid | 1 | |
| Abercrombie Kids | 1 | Kmart | 1 | |
| Ace Hardware | 4 | Kohl's | 2 | |
| Aeropostale | 3 | Kroger | 11 | |
| American Eagle Outfitters | 2 | La Quinta | 2 | |
| Ann Taylor | 1 | La-Z-Boy | 1 | |
| Apple Store | 1 | Lane Bryant | 2 | |
| Applebee's | 2 | Lane Furniture | 7 | |
| Arby's | 4 | LensCrafters | 2 | |
| Audi | 1 | Little Caesars Pizza | 13 | |
| AutoZone | 13 | Long John Silver's | 5 | |
| Avenue | 2 | Macy's | 3 | |
| BMW | 1 | Marriott | 9 | |
| Baja Fresh Mexican Grill | 2 | Marshalls | 1 | |
| Bakers | 1 | MasterBrand Cabinets | 11 | |
| Banana Republic | 1 | Mazda | 1 | |
| Barnes & Noble | 2 | McDonald's | 27 | |
| Baskin-Robbins | 13 | Men's Wearhouse | 2 | |
| Bath & Body Works | 4 | Motel 6 | 7 | |
| Bebe | 1 | Motherhood Maternity | 5 | |
| Bed Bath & Beyond | 2 | New Balance | 8 | |
| Best Western | 5 | New York & Co | 1 | |
| Big O Tires | 3 | Nike | 31 | |
| Blockbuster | 10 | Nissan | 1 | |
| Brooks Brothers | 1 | Nordstrom | 2 | |
| Brookstone | 1 | Office Depot | 4 | |
| Budget Car Rental | 4 | OfficeMax | 4 | |
| Burger King | 15 | Old Navy | 2 | |
| Burlington Coat Factory | 1 | Olive Garden | 1 | |
| CVS | 10 | On The Border | 1 | |
| Cache | 1 | Outback | 1 | |
| Carl\s Jr. | 15 | Outback Steakhouse | 1 | |
| Casual Male XL | 2 | Pac Sun | 2 | |
| Catherines | 1 | Panda Express | 15 | |
| Chevrolet | 2 | Panera Bread | 4 | |
| Chick-Fil-A | 1 | Papa John's Pizza | 3 | |
| Chico's | 2 | Payless | 10 | |
| Chipotle | 8 | Penske | 4 | |
| Chuck E. Cheese's | 1 | PetSmart | 3 | |
| Church's Chicken | 3 | Pier 1 Imports | 2 | |
| Cinnabon | 3 | Pizza Hut | 6 | |
| Circle K | 6 | Popeyes | 3 | |
| Clarion | 1 | Pottery Barn Kids | 1 | |
| Cold Stone Creamery | 4 | Quality | 2 | |
| Coldwater Creek | 1 | Quiznos | 8 | |
| Comfort Inn | 1 | RadioShack | 10 | |
| Comfort Suites | 1 | Ramada | 2 | |
| Costco | 2 | Red Lobster | 1 | |
| Curves | 8 | Rite Aid | 22 | |
| DHL | 7 | SAS Shoes | 1 | |
| Dairy Queen | 3 | Safeway | 7 | |
| Days Inn | 1 | Sam's Club | 2 | |
| Decora Cabinetry | 4 | Sears | 9 | |
| Dennys | 7 | Sephora | 2 | |
| Discount Tire | 2 | Sheraton | 1 | |
| Domino's Pizza | 1 | Skechers USA | 3 | |
| DressBarn | 1 | Soma Intimates | 1 | |
| Dressbarn | 1 | Sprint Nextel | 4 | |
| Econo Lodge | 1 | Staples | 2 | |
| El Pollo Loco | 4 | Starbucks | 59 | |
| Express | 2 | Subaru | 1 | |
| Extended Stay America | 2 | Subway | 64 | |
| Famous Footwear | 1 | Super 8 | 4 | |
| FedEx | 126 | T-Mobile | 27 | |
| Firestone Complete Auto Care | 3 | Taco Bell | 19 | |
| Foot Locker | 2 | Talbots | 2 | |
| Ford | 3 | Target | 6 | |
| Forever 21 | 2 | The Athlete's Foot | 1 | |
| Fredericks Of Hollywood | 1 | The Cheesecake Factory | 1 | |
| GNC | 18 | The Limited | 2 | |
| GameStop | 13 | The Room Place | 3 | |
| Gap | 2 | Torrid | 2 | |
| Goodwill | 1 | Toyota | 1 | |
| Gymboree | 2 | Toys"R"Us | 2 | |
| H&R Block | 23 | Trader Joe's | 2 | |
| Hawthorn | 1 | Travelodge | 1 | |
| Hilton | 6 | U-Haul | 30 | |
| Holiday Inn | 6 | UPS | 115 | |
| Home Depot | 6 | Urban Outfitters | 1 | |
| HomeTown Buffet | 2 | Vans | 11 | |
| Homestead Studio Suites | 1 | Verizon Wireless | 6 | |
| Honda | 1 | Victoria's Secret | 2 | |
| Hot Topic | 1 | Volkswagen | 2 | |
| Hyatt | 3 | Vons | 7 | |
| IHOP | 7 | Walgreens | 13 | |
| J.Crew | 1 | Walmart | 4 | |
| JCPenney | 1 | Wendy's | 6 | |
| Jack In The Box | 17 | Wet Seal | 1 | |
| Jamba Juice | 14 | Whole Foods Market | 1 | |
| JoS. A. Bank | 1 | YMCA | 8 | |
Strongest AM radio stations in Sacramento:
- KSMH (1620 AM; 10 kW; WEST SACRAMENTO, CA; Owner: IHR EDUCATIONAL BROADCASTING)
- KIID (1470 AM; 5 kW; SACRAMENTO, CA; Owner: ABC, INC.)
- KSTE (650 AM; 25 kW; RANCHO CORDOVA, CA; Owner: AMFM RADIO LICENSES, L.L.C.)
- KSQR (1240 AM; 1 kW; SACRAMENTO, CA; Owner: MOON BROADCASTING SACRAMENTO, LLC)
- KHTK (1140 AM; 50 kW; SACRAMENTO, CA; Owner: INFINITY RADIO SUBSIDIARY OPERATIONS INC.)
- KFBK (1530 AM; 50 kW; SACRAMENTO, CA; Owner: AMFM RADIO LICENSES, L.L.C.)
- KFIA (710 AM; 25 kW; CARMICHAEL, CA; Owner: VISTA BROADCASTING INC.)
- KCTC (1320 AM; 5 kW; SACRAMENTO, CA; Owner: ENTERCOM SACRAMENTO LICENSE, LLC)
- KLIB (1110 AM; 10 kW; ROSEVILLE, CA; Owner: WAY BROADCASTING, INC.)
- KFSG (1690 AM; 10 kW; ROSEVILLE, CA; Owner: WAY BROADCASTING, INC.)
- KCBC (770 AM; 50 kW; RIVERBANK, CA; Owner: KIERTRON, INC.)
- KCBS (740 AM; 50 kW; SAN FRANCISCO, CA; Owner: INFINITY BROADCASTING OPERATIONS, INC.)
- KTKZ (1380 AM; 5 kW; SACRAMENTO, CA; Owner: VISTA BROADCASTING, INC.)
Strongest FM radio stations in Sacramento:
- KBMB (103.5 FM; SACRAMENTO, CA; Owner: DIAMOND RADIO, INC.)
- K233AB (94.5 FM; SACRAMENTO, CA; Owner: YOUR CHRISTIAN COMPANION NETWORK, INC.)
- KSEG (96.9 FM; SACRAMENTO, CA; Owner: ENTERCOM SACRAMENTO LICENSE, LLC)
- KYMX (96.1 FM; SACRAMENTO, CA; Owner: INFINITY RADIO OPERATIONS INC.)
- KXCL (103.9 FM; YUBA CITY, CA; Owner: HARLAN COMMUNICATIONS, INC.)
- KXPR (90.9 FM; SACRAMENTO, CA; Owner: CALIFORNIA STATE UNIVERSITY)
- KGBY (92.5 FM; SACRAMENTO, CA; Owner: AMFM RADIO LICENSES, L.L.C.)
- KEDR (88.1 FM; SACRAMENTO, CA; Owner: FAMILY STATIONS, INC.)
- KUIC (95.3 FM; VACAVILLE, CA; Owner: KUIC, INC.)
- KDND (107.9 FM; SACRAMENTO, CA; Owner: ENTERCOM SACRAMENTO LICENSE, LLC)
- KKSF-FM1 (103.7 FM; PLEASANTON, ETC., CA; Owner: AMFM RADIO LICENSES, L.L.C.)
- KBLX-FM2 (102.9 FM; PLEASANTON, CA; Owner: ICBC BROADCAST HOLDINGS -CA, INC.)
- KSOL-FM3 (98.9 FM; PLEASANTON, CA; Owner: TMS LICENSE CALIFORNIA, INC)
- KFRC-FM3 (99.7 FM; WALNUT CREEK, CA; Owner: INFINITY KFRC-FM, INC.)
- KZBR-FM1 (95.7 FM; WALNUT CREEK, CA; Owner: BONNEVILLE HOLDING COMPANY)
- K290AI (105.9 FM; NATOMAS, CA; Owner: EDUCATIONAL MEDIA FOUNDATION)
- KQEI-FM (89.3 FM; NORTH HIGHLANDS, CA; Owner: KQED, INC.)
- KSFM (102.5 FM; WOODLAND, CA; Owner: INFINITY RADIO OF SACRAMENTO, INC.)
- KISQ-FM3 (98.1 FM; CONCORD, CA; Owner: AMFM RADIO LICENSES, L.L.C.)
- KMEL-FM1 (106.1 FM; CONCORD, CA; Owner: AMFM RADIO LICENSES, L.L.C.)
TV broadcast stations around Sacramento:
- KRJR-LP (Channel 47; SACRAMENTO, CA; Owner: WORD OF GOD FELLOWSHIP, INC.)
- K61DW (Channel 61; SACRAMENTO, CA; Owner: DR. W. R. PORTEE)
- KSTV-LP (Channel 60; SACRAMENTO, CA; Owner: GARY M. COCOLA FAMILY TRUST, GARY M. COCOLA TRUSTEE)
- KEZT-CA (Channel 23; SACRAMENTO, CA; Owner: TELEFUTURA SACRAMENTO LLC)
- K69FB (Channel 69; SACRAMENTO, CA; Owner: TRINITY BROADCASTING NETWORK)
- KMMK-LP (Channel 14; SACRAMENTO, CA; Owner: CABALLERO TELEVISION TEXAS, L.L.C.)
- KSPX (Channel 29; SACRAMENTO, CA; Owner: PAXSON SACRAMENTO LICENSE, INC.)
- KTXL (Channel 40; SACRAMENTO, CA; Owner: CHANNEL 40, INC.)
- KCSO-LP (Channel 33; SACRAMENTO, CA; Owner: SAINTE 51, L.P.)
- KQCA (Channel 58; STOCKTON, CA; Owner: KCRA HEARST-ARGYLE TELEVISION, INC.)
- KVIE (Channel 6; SACRAMENTO, CA; Owner: KVIE, INC.)
- KMAX-TV (Channel 31; SACRAMENTO, CA; Owner: UPN STATIONS GROUP INC.)
- KCRA-TV (Channel 3; SACRAMENTO, CA; Owner: KCRA HEARST-ARGYLE TELEVISION, INC.)
- KOVR (Channel 13; STOCKTON, CA; Owner: SCI - SACRAMENTO LICENSEE, LLC)
- KXTV (Channel 10; SACRAMENTO, CA; Owner: KXTV, INC.)
- KUVS (Channel 19; MODESTO, CA; Owner: KUVS LICENSE PARTNERSHIP, G.P.)
- K17EH (Channel 17; EUREKA, CA; Owner: MS COMMUNICATIONS, LLC)
- KSAO-LP (Channel 49; SACRAMENTO, CA; Owner: GARY M. COCOLA FAMILY TRUST, GARY M. COCOLA TRUSTEE)
- KBTV-LP (Channel 8; SACRAMENTO, CA; Owner: INCISOR COMMUNICATIONS, L.L.C.)
- KMUM-CA (Channel 15; SACRAMENTO, CA; Owner: CABALLERO TELEVISION TEXAS, L.L.C.)
- K22FR (Channel 22; SACRAMENTO, CA; Owner: NATIONAL MINORITY T.V., INC.)
- K27EU (Channel 27; SACRAMENTO, CA; Owner: ABUNDANT LIFE BROADCASTING, INC.)
- K27FX (Channel 27; EUREKA, CA; Owner: MS COMMUNICATIONS, LLC)
- National Bridge Inventory (NBI) Statistics
- 603Number of bridges
- 12,999ft / 3,962mTotal length
- $16,964,000Total costs
- 28,365,247Total average daily traffic
- 1,863,303Total average daily truck traffic
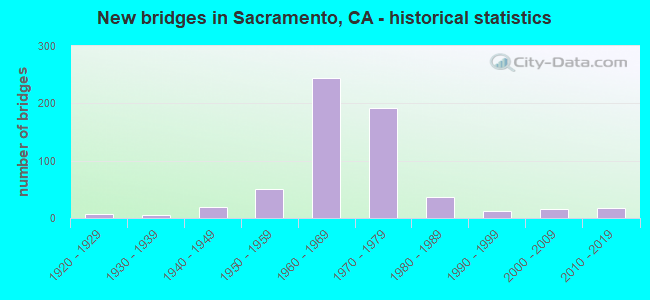
- New bridges - historical statistics
- 11910-1919
- 71920-1929
- 61930-1939
- 191940-1949
- 511950-1959
- 2451960-1969
- 1921970-1979
- 361980-1989
- 131990-1999
- 152000-2009
- 182010-2019
FCC Registered Antenna Towers: 1,361 (See the full list of FCC Registered Antenna Towers)
FCC Registered Commercial Land Mobile Towers: 43 (See the full list of FCC Registered Commercial Land Mobile Towers in Sacramento, CA)
FCC Registered Private Land Mobile Towers: 29 (See the full list of FCC Registered Private Land Mobile Towers)
FCC Registered Broadcast Land Mobile Towers: 343 (See the full list of FCC Registered Broadcast Land Mobile Towers)
FCC Registered Microwave Towers: 660 (See the full list of FCC Registered Microwave Towers in this town)
FCC Registered Paging Towers: 56 (See the full list of FCC Registered Paging Towers)
FCC Registered Maritime Coast & Aviation Ground Towers: 58 (See the full list of FCC Registered Maritime Coast & Aviation Ground Towers)
FCC Registered Amateur Radio Licenses: 2,952 (See the full list of FCC Registered Amateur Radio Licenses in Sacramento)
FAA Registered Aircraft Manufacturers and Dealers: 20 (See the full list of FAA Registered Manufacturers and Dealers in Sacramento)
FAA Registered Aircraft: 414 (See the full list of FAA Registered Aircraft)
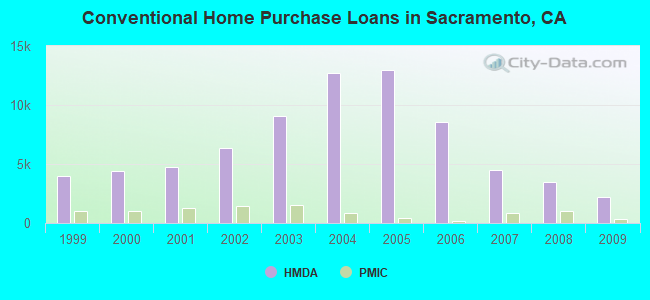
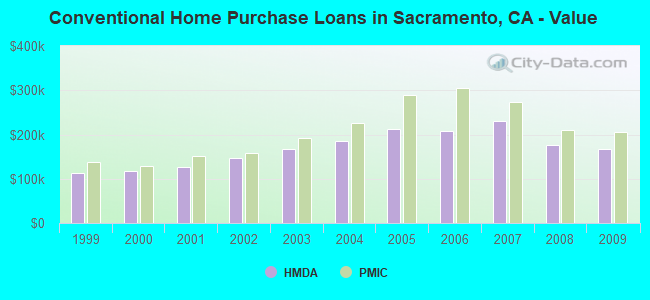
| Home Mortgage Disclosure Act Aggregated Statistics For Year 2009 (Based on 85 full and 19 partial tracts) | ||||||||||||||
| A) FHA, FSA/RHS & VA Home Purchase Loans | B) Conventional Home Purchase Loans | C) Refinancings | D) Home Improvement Loans | E) Loans on Dwellings For 5+ Families | F) Non-occupant Loans on < 5 Family Dwellings (A B C & D) | G) Loans On Manufactured Home Dwelling (A B C & D) | ||||||||
|---|---|---|---|---|---|---|---|---|---|---|---|---|---|---|
| Number | Average Value | Number | Average Value | Number | Average Value | Number | Average Value | Number | Average Value | Number | Average Value | Number | Average Value | |
| LOANS ORIGINATED | 2,213 | $173,576 | 2,183 | $166,293 | 4,688 | $232,543 | 294 | $159,669 | 23 | $2,512,276 | 1,130 | $123,816 | 9 | $54,033 |
| APPLICATIONS APPROVED, NOT ACCEPTED | 216 | $175,618 | 298 | $155,559 | 593 | $232,789 | 56 | $82,748 | 1 | $132,000 | 162 | $143,458 | 7 | $47,867 |
| APPLICATIONS DENIED | 451 | $164,673 | 647 | $136,399 | 2,027 | $212,768 | 291 | $79,214 | 14 | $722,377 | 567 | $127,941 | 11 | $47,315 |
| APPLICATIONS WITHDRAWN | 358 | $163,525 | 507 | $147,951 | 1,419 | $221,277 | 137 | $111,319 | 8 | $4,466,750 | 361 | $128,409 | 4 | $135,165 |
| FILES CLOSED FOR INCOMPLETENESS | 70 | $143,456 | 88 | $165,012 | 260 | $204,377 | 21 | $106,863 | 0 | $0 | 75 | $134,168 | 0 | $0 |
Detailed mortgage data for all 105 tracts in Sacramento, CA
| Private Mortgage Insurance Companies Aggregated Statistics For Year 2009 (Based on 79 full and 17 partial tracts) | ||||||
| A) Conventional Home Purchase Loans | B) Refinancings | C) Non-occupant Loans on < 5 Family Dwellings (A & B) | ||||
|---|---|---|---|---|---|---|
| Number | Average Value | Number | Average Value | Number | Average Value | |
| LOANS ORIGINATED | 303 | $205,170 | 52 | $295,655 | 4 | $117,060 |
| APPLICATIONS APPROVED, NOT ACCEPTED | 118 | $195,813 | 35 | $290,672 | 3 | $201,790 |
| APPLICATIONS DENIED | 51 | $190,016 | 18 | $291,109 | 1 | $173,130 |
| APPLICATIONS WITHDRAWN | 16 | $197,162 | 5 | $356,342 | 0 | $0 |
| FILES CLOSED FOR INCOMPLETENESS | 23 | $196,829 | 7 | $260,341 | 2 | $120,000 |
2005 - 2018 National Fire Incident Reporting System (NFIRS) incidents
- Fire incident types reported to NFIRS in Sacramento, CA
- 21,21558.4%Outside Fires
- 7,42620.4%Structure Fires
- 6,02816.6%Mobile Property/Vehicle Fires
- 1,6564.6%Other
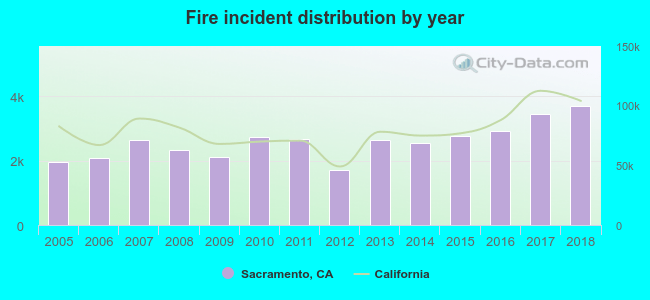 According to the data from the years 2005 - 2018 the average number of fires per year is 2595. The highest number of fires - 3,714 took place in 2018, and the least - 1,712 in 2012. The data has a growing trend.
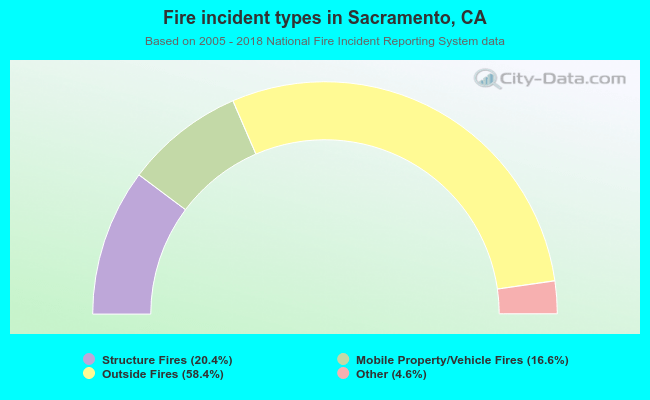 When looking into fire subcategories, the most reports belonged to: Outside Fires (58.4%), and Structure Fires (20.4%).
Fire-safe hotels and motels in Sacramento, California:
- La Quinta Motor Inn #631, 4604 Madison Ave, Sacramento, California 95841 , Phone: (916) 348-0900, Fax: (916) 331-7160
- Hilton Sacramento Arden West, 2200 Harvard St, Sacramento, California 95815 , Phone: (916) 922-4700, Fax: (916) 922-8418
- SureStay Plus Hotel by Best Western Sacramento Cal Expo, 1900 Canterbury Rd, Sacramento, California 95815 , Phone: (916) 927-3492, Fax: (916) 641-8594
- Red Lion Hotel Woodlake-Sacramento, 500 Leisure Ln, Sacramento, California 95815 , Phone: (916) 922-2020, Fax: (916) 920-7310
- Best Western Sutter House, 1100 H St, Sacramento, California 95814 , Phone: (916) 441-1314
- Clarion Hotel Sacramento, 700 16TH St, Sacramento, California 95814 , Phone: (916) 444-8000, Fax: (916) 442-8129
- Good Nite Inn Sacramento, 25 Howe Ave, Sacramento, California 95826 , Phone: (916) 386-8408, Fax: (916) 386-1608
- Vagabond Executive Inn, 2030 Arden Way, Sacramento, California 95825 , Phone: (916) 929-5600, Fax: (916) 929-2419
- 55 other hotels and motels
| Most common first names in Sacramento, CA among deceased individuals | ||
| Name | Count | Lived (average) |
|---|---|---|
| John | 3,427 | 73.6 years |
| Mary | 2,960 | 79.0 years |
| William | 2,899 | 73.2 years |
| Robert | 2,510 | 69.6 years |
| James | 2,499 | 70.3 years |
| George | 1,916 | 75.5 years |
| Charles | 1,778 | 73.3 years |
| Frank | 1,331 | 75.9 years |
| Helen | 1,326 | 80.1 years |
| Dorothy | 1,286 | 77.9 years |
| Most common last names in Sacramento, CA among deceased individuals | ||
| Last name | Count | Lived (average) |
|---|---|---|
| Smith | 1,380 | 73.4 years |
| Johnson | 1,158 | 72.9 years |
| Williams | 869 | 72.3 years |
| Brown | 851 | 73.3 years |
| Jones | 730 | 71.6 years |
| Miller | 703 | 75.9 years |
| Davis | 610 | 71.9 years |
| Anderson | 575 | 73.9 years |
| Lee | 541 | 72.9 years |
| Wilson | 482 | 73.5 years |
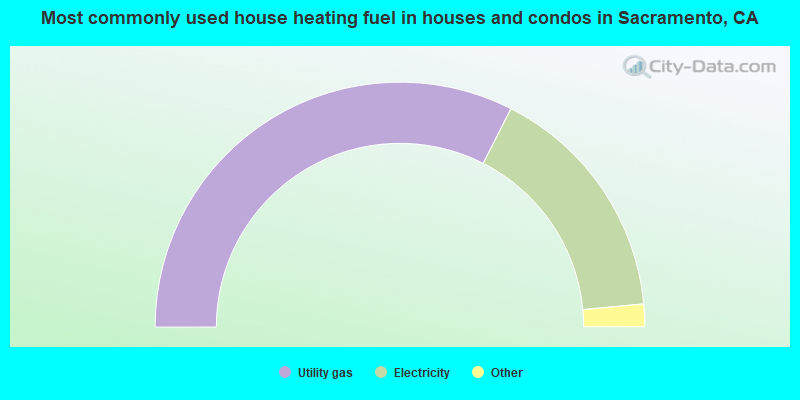
- 65.0%Utility gas
- 32.0%Electricity
- 1.4%Bottled, tank, or LP gas
- 1.1%Solar energy
- 0.4%Wood
- 0.1%No fuel used
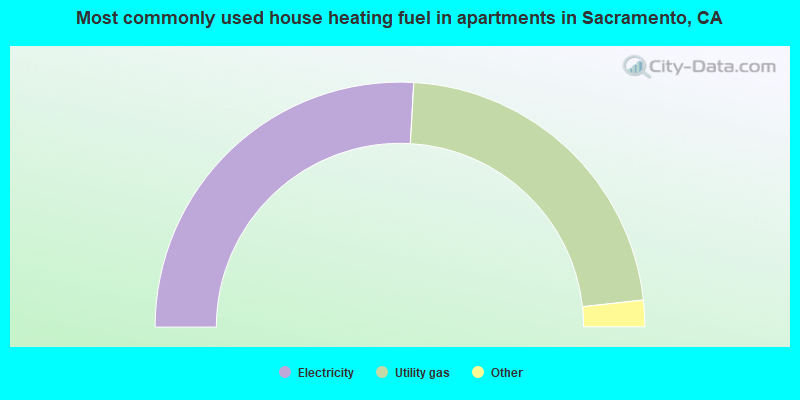
- 51.8%Electricity
- 44.7%Utility gas
- 1.9%Bottled, tank, or LP gas
- 1.1%No fuel used
- 0.3%Other fuel
- 0.2%Solar energy
Sacramento compared to California state average:
- Unemployed percentage significantly below state average.
- Black race population percentage above state average.
Sacramento, CA compared to other similar cities:
Sacramento on our top lists:
- #2 on the list of "Top 101 cities with the highest maximum monthly sunshine amount (population 50,000+)"
- #11 on the list of "Top 100 most racially diverse cities (pop. 50,000+)"
- #15 on the list of "Top 101 cities with largest percentage of females in industries: public administration (population 50,000+)"
- #20 on the list of "Top 101 cities with the largest sunshine amount differences during a year (population 50,000+)"
- #21 on the list of "Top 101 cities with the largest percentage of likely lesbian couples (counted as self-reported female-female unmarried-partner households) (population 50,000+)"
- #31 on the list of "Top 101 cities with the largest percentage of likely homosexual households (counted as self-reported same-sex unmarried-partner households) (population 50,000+)"
- #40 on the list of "Top 101 cities with largest percentage of males in industries: public administration (population 50,000+)"
- #40 on the list of "Top 101 cities with largest percentage of females in industries: utilities (population 50,000+)"
- #42 on the list of "Top 100 biggest cities"
- #43 on the list of "Top 101 biggest cities in 2013"
- #50 on the list of "Top 101 cities with the most mentions on city-data.com forum"
- #53 on the list of "Top 101 cities with the largest percentage of likely gay men couples (counted as self-reported male-male unmarried-partner households) (population 50,000+)"
- #53 on the list of "Top 101 cities with largest percentage of females in occupations: business and financial operations occupations (population 50,000+)"
- #54 on the list of "Top 101 cities with the highest number of days clear of clouds (population 50,000+)"
- #54 on the list of "Top 101 cities with the lowest number of days clear of clouds (population 50,000+)"
- #57 on the list of "Top 101 cities with largest percentage of males in occupations: personal care and service occupations (population 50,000+)"
- #57 on the list of "Top 101 cities with the highest number of auto thefts per 100,000 residents, excludes tourist destinations and others with a lot of outsiders visiting based on city industries data (population 50,000+)"
- #60 on the list of "Top 101 cities with the largest city-data.com crime index per police officer (population 50,000+)"
- #65 on the list of "Top 101 cities with the largest humidity differences during a year (population 50,000+)"
- #67 on the list of "Top 101 cities with the largest differences between morning and afternoon humidity (population 50,000+)"
- #14 (95814) on the list of "Top 101 zip codes with the most museums in 2005"
- #31 (95814) on the list of "Top 101 zip codes with the most Internet business establishments in 2005"
- #36 (95814) on the list of "Top 101 zip codes with the most full service restaurants in 2005"
- #36 (95814) on the list of "Top 101 zip codes with the most offices of lawyers in 2005"
- #12 on the list of "Top 101 counties with the highest percentage of residents that drank alcohol in the past 30 days"
- #18 on the list of "Top 101 counties with the highest ground withdrawal of fresh water for public supply"
- #19 on the list of "Top 101 counties with the highest total withdrawal of fresh water for public supply"
- #23 on the list of "Top 101 counties with the most Other adherents"
- #25 on the list of "Top 101 counties with the most Other congregations (pop. 50,000+)"

|
|
Total of 1587 patent applications in 2008-2024.