Estimated zip code population in 2022: 303 Zip code population in 2010: 315 Zip code population in 2000: 254
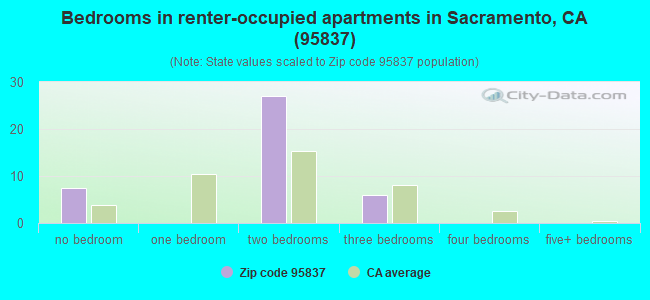
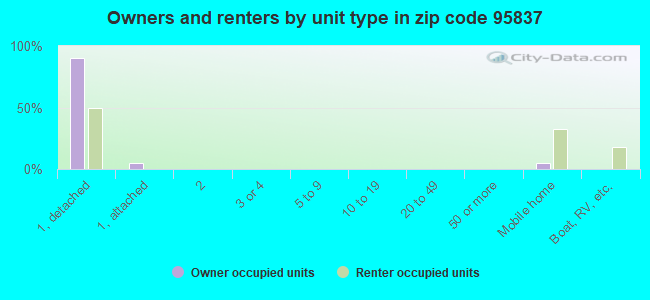
Houses and condos: 131 Renter-occupied apartments: 40
% of renters here:
33%
State:
44%
March 2022 cost of living index in zip code 95837: 103.9 (near average, U.S. average is 100)
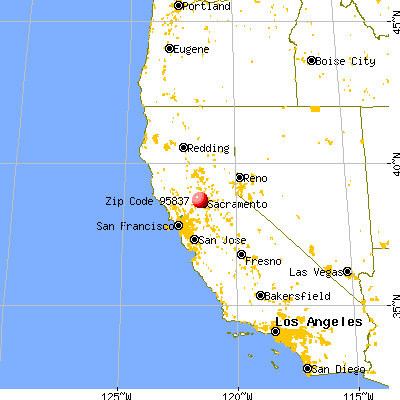
Land area: 18.1 sq. mi. Water area: 0.4 sq. mi.
Population density: 17 people per square mile
(very low).
OSM Map
General Map
Google Map
MSN Map
OSM Map
General Map
Google Map
MSN Map
OSM Map
General Map
Google Map
MSN Map
OSM Map
General Map
Google Map
MSN Map
Please wait while loading the map...
Real estate property taxes paid for housing units in 2022:
This zip code:
0.6% ($6,432)
California:
0.7% ($4,831)
Median real estate property taxes paid for housing units with mortgages in 2022: $9,038 (0.6%) Median real estate property taxes paid for housing units with no mortgage in 2022: $4,756 (0.5%)
Business Search- 14 Million verified businesses
Males: 168
(55.5%)
Females: 134
(44.5%)
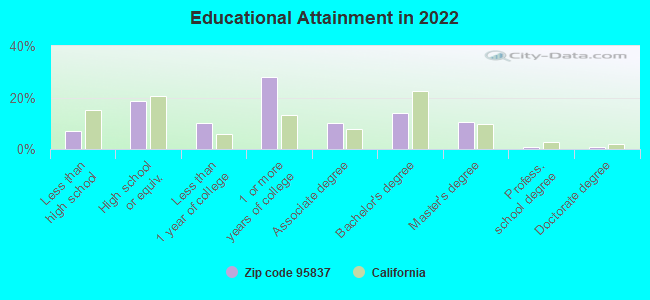
For population 25 years and over in 95837:
High school or higher: 91.6%
Bachelor's degree or higher: 25.9%
Graduate or professional degree: 12.3%
Unemployed: 6.3%
Mean travel time to work (commute): 31.1 minutes
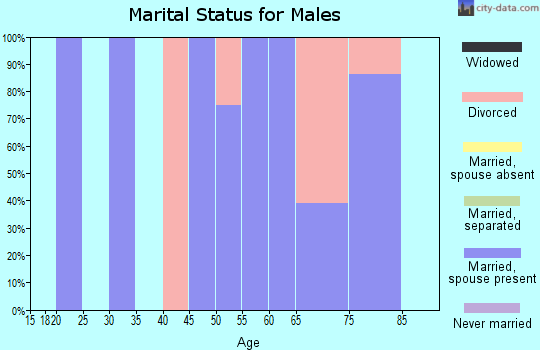
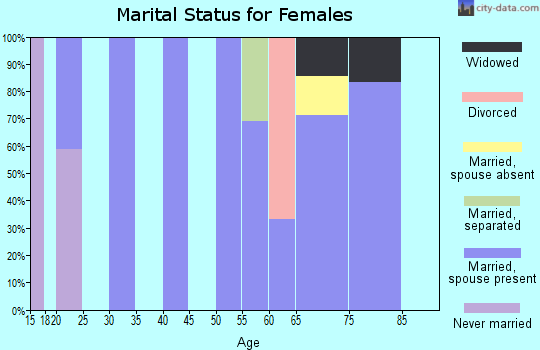
For population 15 years and over in 95837:
Never married: 34.9%
Now married: 39.5%
Separated: 0.6%
Widowed: 4.1%
Divorced: 21.0%
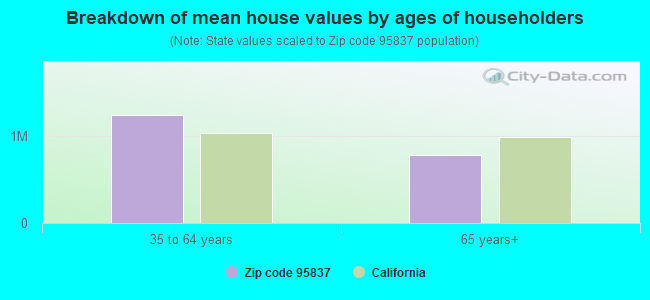
Zip code 95837 compared to state average:
Median house value above state average.
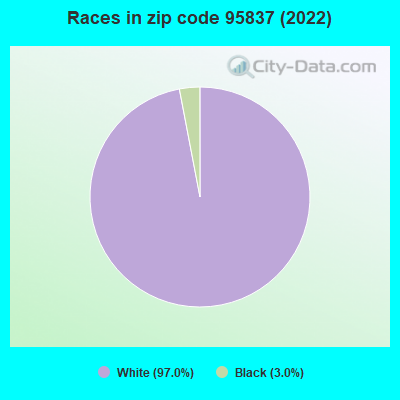
Hispanic race population percentage significantly below state average.
Median age significantly above state average.
Foreign-born population percentage significantly below state average.
Length of stay since moving in significantly above state average.
Averages for the 2020 tax year for zip code 95837, filed in 2021:
Average Adjusted Gross Income (AGI) in 2020: $146,264 (Individual Income Tax Returns)
Here:
$146,264
State:
$95,910
Salary/wage: $117,775 (reported on 57.1% of returns)
Here:
$117,775
State:
$77,331
(% of AGI for various income ranges: 6460.0% for AGIs $25k-50k)
Taxable interest for individuals: $1,250 (reported on 42.9% of returns)
This zip code:
$1,250
California:
$2,294
(% of AGI for various income ranges: 42.5% for AGIs $25k-50k)
Ordinary dividends: $5,020 (reported on 35.7% of returns)
Here:
$5,020
State:
$10,949
(% of AGI for various income ranges: 240.0% for AGIs $25k-50k)
Net capital gain/loss in AGI: +$5,860 (reported on 35.7% of returns)
Here:
+$5,860
State:
+$49,306
(% of AGI for various income ranges: )
Profit/loss from business: +$15,800 (reported on 21.4% of returns)
Here:
+$15,800
State:
+$15,671
(% of AGI for various income ranges: )
Total itemized deductions: $40,000 (reported on 28.6% of returns)
Here:
$40,000
State:
$39,517
(% of AGI for various income ranges: 1677.5% for AGIs $25k-50k)
Charity contributions: $5,000 (reported on 21.4% of returns)
Here:
$5,000
State:
$12,598
(% of AGI for various income ranges: )
Taxes paid: $10,900 (reported on 28.6% of returns)
95837:
$10,900
State:
$8,807
(% of AGI for various income ranges: 512.5% for AGIs $25k-50k)
Percentage of individuals using paid preparers for their 2020 taxes: 78.6%
Here:
79%
State:
92%
(% for various income ranges: 75.0% for AGIs below $25k, 75.0% for AGIs $25k-50k, 66.7% for AGIs $75k-100k, 100.0% for AGIs over 200k)
Averages for the 2012 tax year for zip code 95837, filed in 2013:
Average Adjusted Gross Income (AGI) in 2012: $135,727 (Individual Income Tax Returns)
Here:
$135,727
State:
$72,726
Salary/wage: $109,614 (reported on 63.6% of returns)
Here:
$109,614
State:
$59,079
Taxable interest for individuals: $1,633 (reported on 54.5% of returns)
This zip code:
$1,633
California:
$2,146
(% of AGI for various income ranges: 1.9% for AGIs below $25k, 1.8% for AGIs $100k-200k, 0.2% for AGIs over 200k)
Ordinary dividends: $6,150 (reported on 36.4% of returns)
Here:
$6,150
State:
$9,308
Net capital gain/loss in AGI: +$2,300 (reported on 27.3% of returns)
Here:
+$2,300
State:
+$30,460
Total itemized deductions: $46,167 (20% of AGI, reported on 54.5% of returns)
Here:
$46,167
State:
$34,004
Here:
20.4% of AGI
State:
22.7% of AGI
Charity contributions: $4,133 (reported on 54.5% of returns)
Here:
$4,133
State:
$4,659
Taxes paid: $21,850 (reported on 54.5% of returns)
95837:
$21,850
State:
$14,448
Percentage of individuals using paid preparers for their 2012 taxes: 63.6%
Here:
64%
State:
64%
Averages for the 2004 tax year for zip code 95837, filed in 2005:
Average Adjusted Gross Income (AGI) in 2004: $122,728 (Individual Income Tax Returns)
Here:
$122,728
State:
$58,600
Salary/wage: $88,708 (reported on 70.6% of returns)
Here:
$88,708
State:
$49,455
(% of AGI for various income ranges: 163.8% for AGIs below $10k, 55.1% for AGIs $10k-25k, 66.3% for AGIs $25k-50k, 48.0% for AGIs $50k-75k, 50.3% for AGIs over 100k)
Taxable interest for individuals: $1,616 (reported on 63.2% of returns)
This zip code:
$1,616
California:
$2,365
(% of AGI for various income ranges: 17.0% for AGIs below $10k, 2.7% for AGIs $25k-50k, 0.6% for AGIs $50k-75k, 0.8% for AGIs over 100k)
Taxable dividends: $2,538 (reported on 38.2% of returns)
Here:
$2,538
State:
$4,746
Net capital gain/loss: +$24,359 (reported on 28.7% of returns)
Here:
+$24,359
State:
+$23,418
Profit/loss from business: +$55,067 (reported on 22.1% of returns)
Here:
+$55,067
State:
+$16,826
Total itemized deductions: $49,231 (21% of AGI, reported on 47.8% of returns)
Here:
$49,231
State:
$28,113
Here:
21.2% of AGI
State:
25.3% of AGI
Charity contributions deductions: $4,586 (2% of AGI, reported on 42.6% of returns)
Here:
$4,586
State:
$3,923
Here:
1.9% of AGI
State:
3.3% of AGI
Total tax: $27,486 (reported on 78.7% of returns)
95837:
$27,486
State:
$10,761
(% of AGI for various income ranges: 5.6% for AGIs $10k-25k, 7.4% for AGIs $25k-50k, 10.8% for AGIs $50k-75k, 19.1% for AGIs over 100k)
Earned income credit: $1,300 (reported on 7.4% of returns)
Here:
$1,300
State:
$1,763
Percentage of individuals using paid preparers for their 2004 taxes: 61.8%
Here:
62%
State:
66%
(% for various income ranges: 40.0% for AGIs below $10k, 83.3% for AGIs $10k-25k, 65.0% for AGIs $50k-75k, 78.8% for AGIs over 100k)
Household received Food Stamps/SNAP in the past 12 months: 21 Household did not receive Food Stamps/SNAP in the past 12 months: 100
Women who did not have a birth in the past 12 months: 59 (6 now married, 53 unmarried)
Housing units in zip code 95837 with a mortgage: 51 (25 second mortgage, 26 both second mortgage and home equity loan) Median monthly owner costs for units with a mortgage: $3,876 Median monthly owner costs for units without a mortgage: $855
Residents with income below the poverty level in 2022:
This zip code:
13.2%
Whole state:
12.2%
Residents with income below 50% of the poverty level in 2022:
This zip code:
6.3%
Whole state:
6.2%
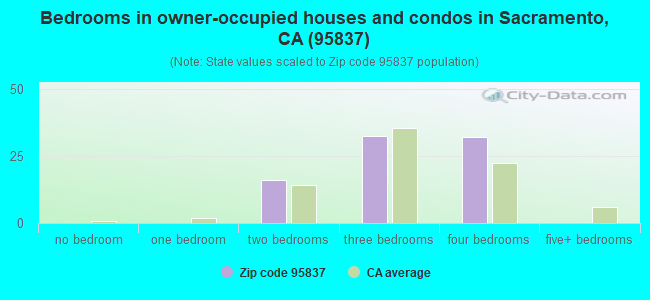
Median number of rooms in houses and condos:
Here:
7.6
State:
6.0
Median number of rooms in apartments:
Here:
5.0
State:
3.9
Notable locations in this zip code not listed on our city pages
Notable locations in zip code 95837: Central Pumping Station (A), Elkhorn Pumping Station (B), Teal Bend Golf Club (C), Prichard Lake Pumping Station (D), Sacramento City Fire Department Station 3 (E), Sacramento County Airport System Fire Department Station 98 (F). Display/hide their locations on the map
Size of family households: 28 2-persons, 53 3-persons, 6 4-persons
Size of nonfamily households: 24 1-person, 7 2-persons
15 married couples with children.
0 single-parent households ().
91.1% of residents of 95837 zip code speak English at home.
2.0% of residents speak Spanish at home (100% very well).
5.9% of residents speak other Indo-European language at home (100% very well).
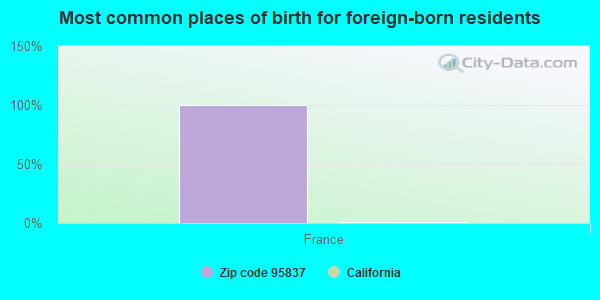
Foreign born population: 4 (1.3%) (100.0% of them are naturalized citizens)
This zip code:
1.3%
Whole state:
26.7%
100%France
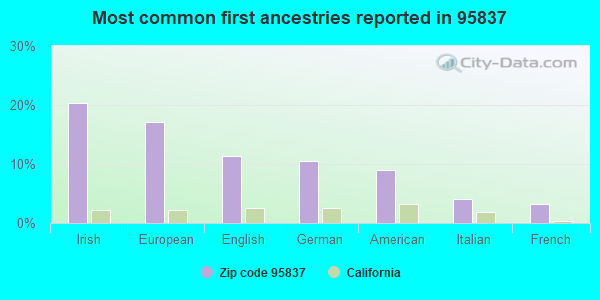
20%Irish
17%European
11%English
11%German
9%American
4%Italian
3%French
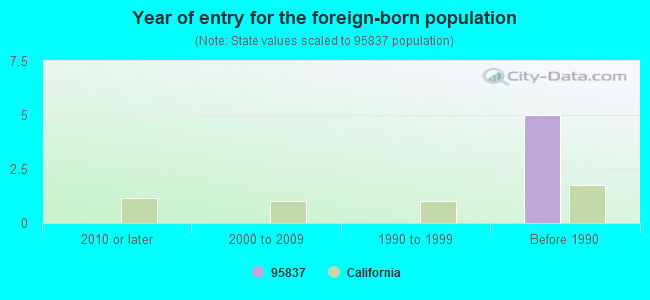
Year of entry for the foreign-born population
02010 or later
02000 to 2009
01990 to 1999
5Before 1990
Facilities with environmental interests located in this zip code:
CHEVRON USA INC SACRAMENTO METRO ARPT (ARPT BLVD & INT 5 in SACRAMENTO, CA)
STATE MASTER (California - Hazardous Waste Tracking) - HAZARDOU WASTE PROGRAM Large Quantity Generators, more that 1000 kg of hazardous waste/month (Resource Conservation and Recovery Act (tracking hazardous waste)) Organizations: CHEVRON PRODUCTS CO. (CONTACT/OPERATOR)
Alternative names: CHEVRON 1001558 SAC AP
ALLIED AVIATION SACRAMENTO INTL AIRPORT (7201 EARHART DR in SACRAMENTO, CA)
STATE MASTER (California - Hazardous Waste Tracking) - HAZARDOU WASTE PROGRAM Small Quantity Generators, between 100 kg and 1000 kg of hazardous waste/month (Resource Conservation and Recovery Act (tracking hazardous waste)) TRI REPORTER (Tracking of toxic chemicals releasing facilities) Business SIC classification: PETROLEUM BULK STATIONS AND TERMINALS Business NAICS classification: OTHER AIRPORT OPERATIONS. Organizations: ALLIED AVIATION FUELING COMPANY INC (CONTACT/OPERATOR)
, SACRAMENTO COUNTY AIRPORT SYSTEMS (CONTACT/OWNER)
Alternative names: ALLIED AVIATION FUELING CO INC
EQUILON ENTERPRISES (7001 AIRPORT BLVD in SACRAMENTO, CA) . Federal Facility
STATE MASTER (California - Hazardous Waste Tracking) - HAZARDOU WASTE PROGRAM Small Quantity Generators, between 100 kg and 1000 kg of hazardous waste/month (Resource Conservation and Recovery Act (tracking hazardous waste)) - notification Organizations: EQUILON ENTERPRISES, LLC (CONTACT/OWNER)
Alternative names: SHELL OIL CO
KILGORE DUMP - APN72-260-20 (KILGORE ROAD in SACRAMENTO, CA)
CRITERIA AND HAZARDOUS AIR POLLUTANT INVENTORY (Inventory of air pollution sources) Business SIC classification: REFUSE SYSTEMS Business NAICS classification: SOLID WASTE LANDFILL.
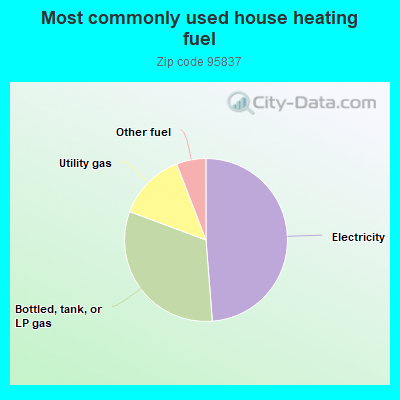
49.2%Electricity
32.2%Bottled, tank, or LP gas
13.6%Utility gas
5.9%Other fuel
Population in 1990: 259.
Place of birth for U.S.-born residents:
This state: 181
Northeast: 22
Midwest: 14
South: 19
West: 57
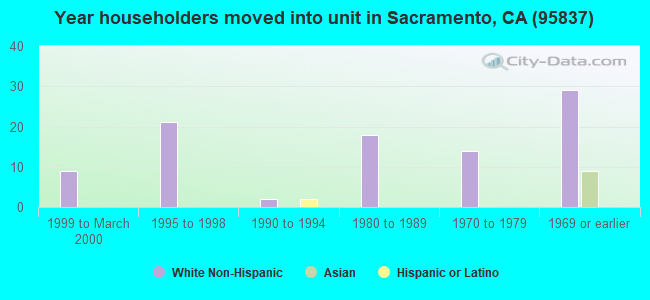
67% of the 95837 zip code residents lived in the same house 5 years ago. Out of people who lived in different houses, 46% lived in this county. Out of people who lived in different counties, 50% lived in California.
97% of the 95837 zip code residents lived in the same house 1 year ago. Out of people who lived in different houses, 100% moved from different county within same state.
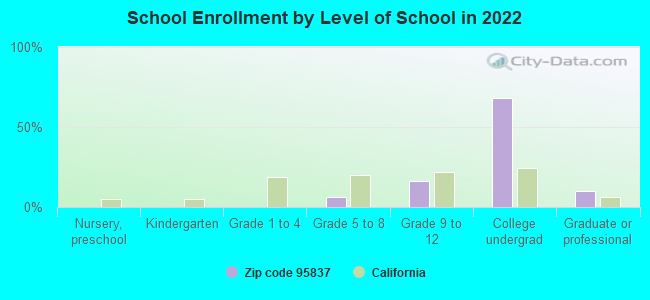
Private vs. public school enrollment:
Students in private schools in grades 1 to 8 (elementary and middle school): 5
Here:
100.0%
California:
10.5%
Students in private schools in grades 9 to 12 (high school): 4
Here:
45.1%
California:
8.5%
Students in private undergraduate colleges: 2
Here:
7.0%
California:
15.9%
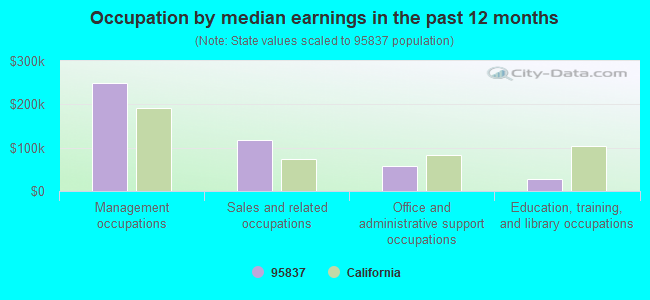
Occupation by median earnings in the past 12 months ($)
248,553Management occupations
118,753Sales and related occupations
56,737Office and administrative support occupations
27,589Education, training, and library occupations
Top industries in this zip code by the number of employees in 2005:
Real Estate and Rental and Leasing: Passenger Car Rental (50-99 employees: 2 establishments, 20-49 employees: 7 establishments, 10-19 employees: 1 establishment, 5-9 employees: 2 establishments, 1-4 employees: 12 establishments)
Other Services (except Public Administration): Parking Lots and Garages (100-249: 2, 20-49: 1)
Accommodation and Food Services: Limited-Service Restaurants (100-249: 1, 20-49: 1)
Accommodation and Food Services: Food Service Contractors (50-99: 1)
Fatal accident statistics in 2014:
Fatal accident count: 1
Vehicles involved in fatal accidents: 1
Fatal accidents caused by drunken drivers: 0
Fatalities: 1
Persons involved in fatal accidents: 1
Pedestrians involved in fatal accidents: 0
Fatal accident statistics in 2013:
Fatal accident count: 1
Vehicles involved in fatal accidents: 1
Fatal accidents caused by drunken drivers: 1
Fatalities: 1
Persons involved in fatal accidents: 3
Pedestrians involved in fatal accidents: 0
Home Mortgage Disclosure Act Aggregated Statistics For Year 2009 (Based on 2 partial tracts)
A) FHA, FSA/RHS & VA Home Purchase Loans
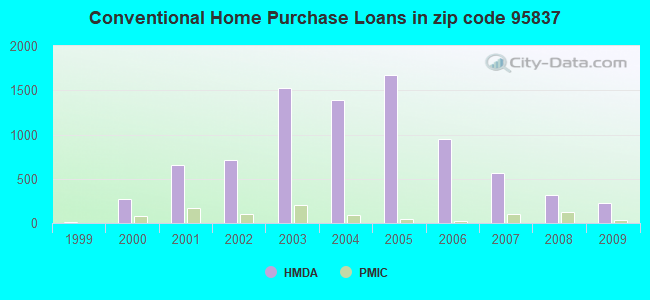
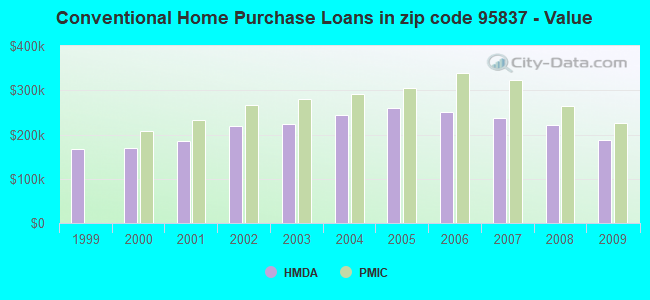
B) Conventional Home Purchase Loans
C) Refinancings
D) Home Improvement Loans
F) Non-occupant Loans on < 5 Family Dwellings (A B C & D)
G) Loans On Manufactured Home Dwelling (A B C & D)
Number
Average Value
Number
Average Value
Number
Average Value
Number
Average Value
Number
Average Value
Number
Average Value
LOANS ORIGINATED
220
$223,927
228
$187,545
329
$238,561
4
$92,300
79
$175,694
1
$165,060
APPLICATIONS APPROVED, NOT ACCEPTED
14
$241,086
29
$212,950
44
$246,512
1
$12,860
11
$195,630
0
$0
APPLICATIONS DENIED
41
$239,843
57
$193,213
138
$261,743
6
$93,585
24
$195,139
0
$0
APPLICATIONS WITHDRAWN
31
$216,229
38
$191,769
99
$254,929
5
$119,192
7
$165,940
1
$47,820
FILES CLOSED FOR INCOMPLETENESS
6
$206,280
13
$199,628
16
$280,882
1
$5,140
3
$186,653
0
$0
Aggregated Statistics For Year 2008 (Based on 2 partial tracts)
A) FHA, FSA/RHS & VA Home Purchase Loans
B) Conventional Home Purchase Loans
C) Refinancings
D) Home Improvement Loans
F) Non-occupant Loans on < 5 Family Dwellings (A B C & D)
G) Loans On Manufactured Home Dwelling (A B C & D)
Number
Average Value
Number
Average Value
Number
Average Value
Number
Average Value
Number
Average Value
Number
Average Value
LOANS ORIGINATED
181
$259,714
312
$222,457
132
$260,061
9
$80,729
67
$196,555
2
$96,410
APPLICATIONS APPROVED, NOT ACCEPTED
18
$277,982
56
$232,584
32
$275,949
1
$51,420
12
$204,180
1
$43,710
APPLICATIONS DENIED
35
$272,364
107
$246,667
161
$326,022
19
$114,153
33
$213,658
0
$0
APPLICATIONS WITHDRAWN
35
$260,200
63
$234,206
64
$298,477
6
$189,912
15
$225,254
0
$0
FILES CLOSED FOR INCOMPLETENESS
6
$260,528
15
$253,501
16
$272,751
1
$25,710
4
$173,542
0
$0
Aggregated Statistics For Year 2007 (Based on 2 partial tracts)
A) FHA, FSA/RHS & VA Home Purchase Loans
B) Conventional Home Purchase Loans
C) Refinancings
D) Home Improvement Loans
F) Non-occupant Loans on < 5 Family Dwellings (A B C & D)
G) Loans On Manufactured Home Dwelling (A B C & D)
Number
Average Value
Number
Average Value
Number
Average Value
Number
Average Value
Number
Average Value
Number
Average Value
LOANS ORIGINATED
23
$287,103
563
$237,560
398
$292,203
48
$154,153
83
$249,393
0
$0
APPLICATIONS APPROVED, NOT ACCEPTED
3
$290,010
89
$271,781
134
$304,909
15
$145,793
21
$275,636
1
$77,130
APPLICATIONS DENIED
9
$289,552
225
$274,711
441
$324,904
63
$156,219
53
$281,267
1
$147,060
APPLICATIONS WITHDRAWN
5
$254,632
104
$232,596
165
$329,206
11
$146,173
15
$282,810
0
$0
FILES CLOSED FOR INCOMPLETENESS
1
$161,970
23
$232,329
51
$391,074
1
$156,320
6
$291,123
1
$149,120
Aggregated Statistics For Year 2006 (Based on 2 partial tracts)
A) FHA, FSA/RHS & VA Home Purchase Loans
B) Conventional Home Purchase Loans
C) Refinancings
D) Home Improvement Loans
E) Loans on Dwellings For 5+ Families
F) Non-occupant Loans on < 5 Family Dwellings (A B C & D)
G) Loans On Manufactured Home Dwelling (A B C & D)
Number
Average Value
Number
Average Value
Number
Average Value
Number
Average Value
Number
Average Value
Number
Average Value
Number
Average Value
LOANS ORIGINATED
7
$272,233
947
$250,387
722
$312,459
102
$158,248
1
$8,381,460
156
$271,224
0
$0
APPLICATIONS APPROVED, NOT ACCEPTED
0
$0
220
$265,477
187
$311,935
30
$183,587
0
$0
35
$250,548
0
$0
APPLICATIONS DENIED
1
$264,810
351
$270,545
441
$339,251
77
$181,987
0
$0
58
$289,122
3
$75,073
APPLICATIONS WITHDRAWN
1
$260,700
201
$266,409
222
$352,290
21
$201,640
0
$0
32
$262,451
1
$18,000
FILES CLOSED FOR INCOMPLETENESS
0
$0
41
$259,859
59
$382,992
3
$226,763
0
$0
6
$282,382
0
$0
Aggregated Statistics For Year 2005 (Based on 2 partial tracts)
A) FHA, FSA/RHS & VA Home Purchase Loans
B) Conventional Home Purchase Loans
C) Refinancings
D) Home Improvement Loans
F) Non-occupant Loans on < 5 Family Dwellings (A B C & D)
G) Loans On Manufactured Home Dwelling (A B C & D)
Number
Average Value
Number
Average Value
Number
Average Value
Number
Average Value
Number
Average Value
Number
Average Value
LOANS ORIGINATED
1
$161,460
1,677
$259,055
1,057
$326,989
120
$200,414
224
$271,780
2
$81,500
APPLICATIONS APPROVED, NOT ACCEPTED
0
$0
268
$266,216
171
$340,984
18
$233,047
45
$268,355
2
$25,710
APPLICATIONS DENIED
1
$298,750
366
$283,029
397
$340,713
67
$162,426
69
$287,050
2
$156,315
APPLICATIONS WITHDRAWN
2
$220,850
344
$257,243
274
$331,805
28
$228,341
44
$233,236
2
$69,415
FILES CLOSED FOR INCOMPLETENESS
0
$0
57
$287,248
82
$375,040
4
$151,560
7
$307,859
0
$0
Aggregated Statistics For Year 2004 (Based on 2 partial tracts)
A) FHA, FSA/RHS & VA Home Purchase Loans
B) Conventional Home Purchase Loans
C) Refinancings
D) Home Improvement Loans
F) Non-occupant Loans on < 5 Family Dwellings (A B C & D)
G) Loans On Manufactured Home Dwelling (A B C & D)
Number
Average Value
Number
Average Value
Number
Average Value
Number
Average Value
Number
Average Value
Number
Average Value
LOANS ORIGINATED
8
$259,864
1,395
$243,936
971
$280,529
108
$146,833
197
$252,240
2
$132,405
APPLICATIONS APPROVED, NOT ACCEPTED
2
$198,480
212
$242,773
161
$281,089
16
$126,043
25
$276,454
0
$0
APPLICATIONS DENIED
2
$217,505
267
$260,530
328
$278,700
55
$105,822
49
$253,343
1
$2,060
APPLICATIONS WITHDRAWN
2
$253,245
328
$245,283
253
$278,239
23
$157,770
39
$226,011
0
$0
FILES CLOSED FOR INCOMPLETENESS
0
$0
46
$250,840
59
$309,653
9
$107,353
7
$228,379
0
$0
Aggregated Statistics For Year 2003 (Based on 2 partial tracts)
A) FHA, FSA/RHS & VA Home Purchase Loans
B) Conventional Home Purchase Loans
C) Refinancings
D) Home Improvement Loans
E) Loans on Dwellings For 5+ Families
F) Non-occupant Loans on < 5 Family Dwellings (A B C & D)
Number
Average Value
Number
Average Value
Number
Average Value
Number
Average Value
Number
Average Value
Number
Average Value
LOANS ORIGINATED
96
$236,591
1,526
$223,892
897
$241,518
66
$54,482
0
$0
119
$232,561
APPLICATIONS APPROVED, NOT ACCEPTED
7
$234,916
225
$218,944
143
$241,998
14
$42,091
1
$8,484,300
21
$246,767
APPLICATIONS DENIED
7
$251,591
224
$229,912
229
$225,990
39
$62,086
0
$0
33
$256,445
APPLICATIONS WITHDRAWN
15
$233,515
395
$217,115
197
$233,569
10
$55,328
0
$0
30
$236,892
FILES CLOSED FOR INCOMPLETENESS
2
$257,100
45
$241,137
43
$247,318
6
$59,390
0
$0
5
$187,580
Aggregated Statistics For Year 2002 (Based on 2 partial tracts)
A) FHA, FSA/RHS & VA Home Purchase Loans
B) Conventional Home Purchase Loans
C) Refinancings
D) Home Improvement Loans
F) Non-occupant Loans on < 5 Family Dwellings (A B C & D)
Number
Average Value
Number
Average Value
Number
Average Value
Number
Average Value
Number
Average Value
LOANS ORIGINATED
20
$246,045
717
$219,096
425
$212,257
38
$44,099
40
$210,244
APPLICATIONS APPROVED, NOT ACCEPTED
3
$207,393
84
$231,274
56
$190,024
11
$75,214
4
$286,668
APPLICATIONS DENIED
5
$223,266
75
$224,651
109
$197,264
26
$47,563
6
$240,217
APPLICATIONS WITHDRAWN
3
$237,390
116
$221,820
76
$199,077
8
$74,109
7
$218,756
FILES CLOSED FOR INCOMPLETENESS
0
$0
26
$208,449
24
$228,669
2
$26,995
0
$0
Aggregated Statistics For Year 2001 (Based on 2 partial tracts)
A) FHA, FSA/RHS & VA Home Purchase Loans
B) Conventional Home Purchase Loans
C) Refinancings
D) Home Improvement Loans
F) Non-occupant Loans on < 5 Family Dwellings (A B C & D)
Number
Average Value
Number
Average Value
Number
Average Value
Number
Average Value
Number
Average Value
LOANS ORIGINATED
20
$194,574
652
$184,983
204
$185,480
11
$26,225
22
$175,997
APPLICATIONS APPROVED, NOT ACCEPTED
1
$88,960
84
$178,978
31
$147,476
7
$35,847
4
$152,590
APPLICATIONS DENIED
0
$0
69
$192,527
52
$151,818
9
$27,824
2
$174,830
APPLICATIONS WITHDRAWN
4
$180,355
102
$177,596
48
$159,199
2
$31,365
4
$127,778
FILES CLOSED FOR INCOMPLETENESS
0
$0
27
$178,923
16
$147,254
4
$26,868
1
$254,530
Aggregated Statistics For Year 2000 (Based on 2 partial tracts)
A) FHA, FSA/RHS & VA Home Purchase Loans
B) Conventional Home Purchase Loans
C) Refinancings
D) Home Improvement Loans
F) Non-occupant Loans on < 5 Family Dwellings (A B C & D)
Number
Average Value
Number
Average Value
Number
Average Value
Number
Average Value
Number
Average Value
LOANS ORIGINATED
22
$182,097
274
$169,894
9
$197,453
7
$30,559
7
$150,220
APPLICATIONS APPROVED, NOT ACCEPTED
1
$218,020
32
$172,578
2
$145,520
6
$34,880
1
$78,670
APPLICATIONS DENIED
3
$186,140
43
$182,924
6
$62,047
4
$59,005
1
$105,410
APPLICATIONS WITHDRAWN
3
$160,943
70
$180,330
1
$85,360
1
$15,430
2
$203,110
FILES CLOSED FOR INCOMPLETENESS
1
$81,760
3
$214,593
2
$153,230
0
$0
0
$0
Aggregated Statistics For Year 1999 (Based on 1 partial tract)
A) FHA, FSA/RHS & VA Home Purchase Loans
B) Conventional Home Purchase Loans
C) Refinancings
D) Home Improvement Loans
F) Non-occupant Loans on < 5 Family Dwellings (A B C & D)
Detailed PMIC statistics for the following Tracts:0071.00
2006 - 2018 National Fire Incident Reporting System (NFIRS) incidents
Based on the data from the years 2006 - 2018 the average number of fire incidents per year is 19. The highest number of reported fire incidents - 28 took place in 2006, and the least - 10 in 2012. The data has a decreasing trend.
When looking into fire subcategories, the most reports belonged to: Outside Fires (59.4%), and Mobile Property/Vehicle Fires (33.6%).
Fire incident types reported to NFIRS in Zip Code 95837


 Nearest zip codes: 95691, 95835, 95776, 95834, 95833, 95605.


 Based on the data from the years 2006 - 2018 the average number of fire incidents per year is 19. The highest number of reported fire incidents - 28 took place in 2006, and the least - 10 in 2012. The data has a decreasing trend.
 When looking into fire subcategories, the most reports belonged to: Outside Fires (59.4%), and Mobile Property/Vehicle Fires (33.6%).