Estimated zip code population in 2022: 40,568 Zip code population in 2010: 37,293 Zip code population in 2000: 31,414
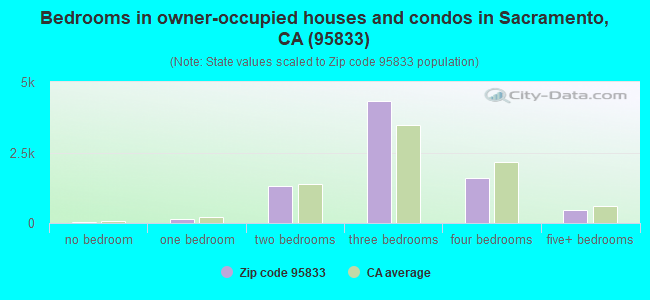
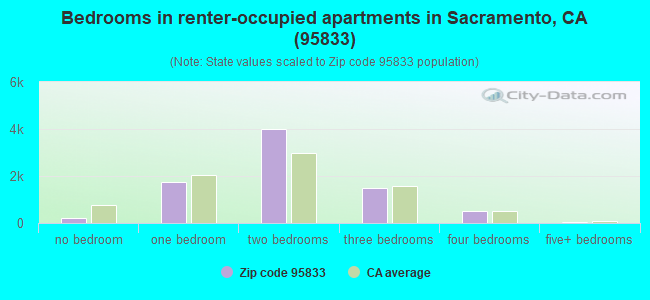
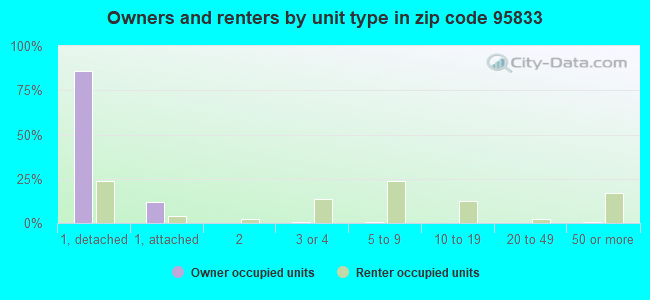
Houses and condos: 16,672 Renter-occupied apartments: 8,013
% of renters here:
50%
State:
44%
March 2022 cost of living index in zip code 95833: 101.2 (near average, U.S. average is 100)
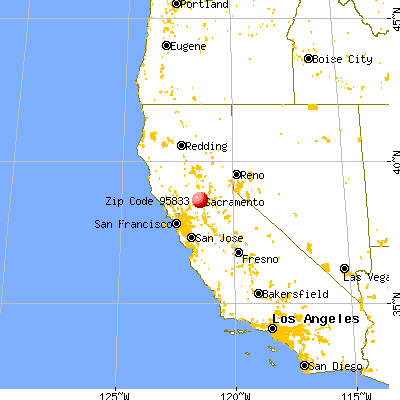
Land area: 7.8 sq. mi. Water area: 0.4 sq. mi.
Population density: 5,233 people per square mile
(average).
OSM Map
General Map
Google Map
MSN Map
OSM Map
General Map
Google Map
MSN Map
OSM Map
General Map
Google Map
MSN Map
OSM Map
General Map
Google Map
MSN Map
Please wait while loading the map...
Real estate property taxes paid for housing units in 2022:
This zip code:
0.8% ($3,633)
California:
0.7% ($4,831)
Median real estate property taxes paid for housing units with mortgages in 2022: $3,852 (0.9%) Median real estate property taxes paid for housing units with no mortgage in 2022: $3,123 (0.8%)
Averages for the 2020 tax year for zip code 95833, filed in 2021:
Average Adjusted Gross Income (AGI) in 2020: $56,749 (Individual Income Tax Returns)
Here:
$56,749
State:
$95,910
Salary/wage: $52,087 (reported on 85.7% of returns)
Here:
$52,087
State:
$77,331
(% of AGI for various income ranges: 1246.2% for AGIs below $25k, 4052.7% for AGIs $25k-50k, 7487.6% for AGIs $50k-75k, 10643.2% for AGIs $75k-100k, 19185.3% for AGIs $100k-200k, 61727.7% for AGIs over 200k)
Taxable interest for individuals: $486 (reported on 28.5% of returns)
This zip code:
$486
California:
$2,294
(% of AGI for various income ranges: 4.4% for AGIs below $25k, 5.4% for AGIs $25k-50k, 12.8% for AGIs $50k-75k, 20.1% for AGIs $75k-100k, 66.3% for AGIs $100k-200k, 686.9% for AGIs over 200k)
Ordinary dividends: $2,752 (reported on 9.6% of returns)
Here:
$2,752
State:
$10,949
(% of AGI for various income ranges: 5.9% for AGIs below $25k, 7.7% for AGIs $25k-50k, 20.5% for AGIs $50k-75k, 49.3% for AGIs $75k-100k, 128.5% for AGIs $100k-200k, 1416.2% for AGIs over 200k)
Net capital gain/loss in AGI: +$8,556 (reported on 10.1% of returns)
Here:
+$8,556
State:
+$49,306
(% of AGI for various income ranges: 0.4% for AGIs below $25k, 10.7% for AGIs $25k-50k, 32.5% for AGIs $50k-75k, 95.9% for AGIs $75k-100k, 314.1% for AGIs $100k-200k, 8162.3% for AGIs over 200k)
Profit/loss from business: +$9,420 (reported on 15.1% of returns)
Here:
+$9,420
State:
+$15,671
(% of AGI for various income ranges: 95.4% for AGIs below $25k, 152.2% for AGIs $25k-50k, 164.6% for AGIs $50k-75k, 194.2% for AGIs $75k-100k, 495.6% for AGIs $100k-200k, 3650.0% for AGIs over 200k)
Taxable individual retirement arrangement distribution: $14,384 (reported on 3.7% of returns)
95833:
$14,384
California:
$23,505
(% of AGI for various income ranges: 18.9% for AGIs below $25k, 37.8% for AGIs $25k-50k, 55.8% for AGIs $50k-75k, 109.3% for AGIs $75k-100k, 274.2% for AGIs $100k-200k, 1416.2% for AGIs over 200k)
Self-employed (Keogh) retirement plans: $16,200 (reported on 0.1% of returns)
95833:
$16,200
California:
$30,163
(% of AGI for various income ranges: 37.1% for AGIs $100k-200k)
Total itemized deductions: $25,515 (reported on 9.7% of returns)
Here:
$25,515
State:
$39,517
(% of AGI for various income ranges: 28.2% for AGIs below $25k, 105.6% for AGIs $25k-50k, 390.2% for AGIs $50k-75k, 707.3% for AGIs $75k-100k, 1271.4% for AGIs $100k-200k, 5586.2% for AGIs over 200k)
Charity contributions: $5,723 (reported on 7.3% of returns)
Here:
$5,723
State:
$12,598
(% of AGI for various income ranges: 1.2% for AGIs below $25k, 15.5% for AGIs $25k-50k, 44.4% for AGIs $50k-75k, 100.6% for AGIs $75k-100k, 220.4% for AGIs $100k-200k, 1701.5% for AGIs over 200k)
Taxes paid: $7,879 (reported on 9.6% of returns)
95833:
$7,879
State:
$8,807
(% of AGI for various income ranges: 5.9% for AGIs below $25k, 26.2% for AGIs $25k-50k, 122.4% for AGIs $50k-75k, 245.6% for AGIs $75k-100k, 423.6% for AGIs $100k-200k, 1320.8% for AGIs over 200k)
Earned income credit: $2,103 (reported on 16.2% of returns)
Here:
$2,103
State:
$2,074
(% of AGI for various income ranges: 95.7% for AGIs below $25k, 65.9% for AGIs $25k-50k, 1.0% for AGIs $50k-75k)
Percentage of individuals using paid preparers for their 2020 taxes: 91.5%
Here:
92%
State:
92%
(% for various income ranges: 91.2% for AGIs below $25k, 92.3% for AGIs $25k-50k, 91.8% for AGIs $50k-75k, 91.1% for AGIs $75k-100k, 90.4% for AGIs $100k-200k, 92.7% for AGIs over 200k)
Averages for the 2012 tax year for zip code 95833, filed in 2013:
Average Adjusted Gross Income (AGI) in 2012: $45,270 (Individual Income Tax Returns)
Here:
$45,270
State:
$72,726
Salary/wage: $42,073 (reported on 87.5% of returns)
Here:
$42,073
State:
$59,079
(% of AGI for various income ranges: 77.8% for AGIs below $25k, 86.8% for AGIs $25k-50k, 83.0% for AGIs $50k-75k, 81.0% for AGIs $75k-100k, 80.4% for AGIs $100k-200k, 62.6% for AGIs over 200k)
Taxable interest for individuals: $475 (reported on 29.0% of returns)
This zip code:
$475
California:
$2,146
(% of AGI for various income ranges: 0.3% for AGIs below $25k, 0.2% for AGIs $25k-50k, 0.2% for AGIs $50k-75k, 0.3% for AGIs $75k-100k, 0.4% for AGIs $100k-200k, 1.1% for AGIs over 200k)
Ordinary dividends: $2,147 (reported on 9.6% of returns)
Here:
$2,147
State:
$9,308
(% of AGI for various income ranges: 0.4% for AGIs below $25k, 0.2% for AGIs $25k-50k, 0.3% for AGIs $50k-75k, 0.4% for AGIs $75k-100k, 0.5% for AGIs $100k-200k, 1.7% for AGIs over 200k)
Net capital gain/loss in AGI: +$1,620 (reported on 7.2% of returns)
Here:
+$1,620
State:
+$30,460
(% of AGI for various income ranges: 0.3% for AGIs $75k-100k, 0.4% for AGIs $100k-200k, 2.1% for AGIs over 200k)
Profit/loss from business: +$9,952 (reported on 13.3% of returns)
Here:
+$9,952
State:
+$17,064
(% of AGI for various income ranges: 9.0% for AGIs below $25k, 2.3% for AGIs $25k-50k, 1.4% for AGIs $50k-75k, 1.8% for AGIs $75k-100k, 2.4% for AGIs $100k-200k, 4.7% for AGIs over 200k)
Taxable individual retirement arrangement distribution: $14,711 (reported on 4.4% of returns)
95833:
$14,711
California:
$19,557
(% of AGI for various income ranges: 1.1% for AGIs below $25k, 0.9% for AGIs $25k-50k, 1.5% for AGIs $50k-75k, 1.4% for AGIs $75k-100k, 1.6% for AGIs $100k-200k, 2.9% for AGIs over 200k)
Self-employment retirement plans: $14,900 (reported on 0.2% of returns)
95833:
$14,900
California:
$24,530
Total itemized deductions: $19,307 (24% of AGI, reported on 28.9% of returns)
Here:
$19,307
State:
$34,004
Here:
24.2% of AGI
State:
22.7% of AGI
(% of AGI for various income ranges: 5.6% for AGIs below $25k, 8.6% for AGIs $25k-50k, 13.2% for AGIs $50k-75k, 15.0% for AGIs $75k-100k, 15.9% for AGIs $100k-200k, 16.7% for AGIs over 200k)
Charity contributions: $2,480 (reported on 23.5% of returns)
Here:
$2,480
State:
$4,659
(% of AGI for various income ranges: 0.3% for AGIs below $25k, 0.8% for AGIs $25k-50k, 1.4% for AGIs $50k-75k, 1.5% for AGIs $75k-100k, 1.7% for AGIs $100k-200k, 2.5% for AGIs over 200k)
Taxes paid: $6,675 (reported on 28.6% of returns)
95833:
$6,675
State:
$14,448
(% of AGI for various income ranges: 1.1% for AGIs below $25k, 2.4% for AGIs $25k-50k, 3.8% for AGIs $50k-75k, 5.2% for AGIs $75k-100k, 6.5% for AGIs $100k-200k, 8.4% for AGIs over 200k)
Earned income credit: $2,375 (reported on 22.3% of returns)
Here:
$2,375
State:
$2,286
(% of AGI for various income ranges: 8.0% for AGIs below $25k, 1.2% for AGIs $25k-50k)
Percentage of individuals using paid preparers for their 2012 taxes: 49.8%
Here:
50%
State:
64%
(% for various income ranges: 49.3% for AGIs below $25k, 48.2% for AGIs $25k-50k, 50.2% for AGIs $50k-75k, 54.1% for AGIs $75k-100k, 51.6% for AGIs $100k-200k, 71.4% for AGIs over 200k)
Averages for the 2004 tax year for zip code 95833, filed in 2005:
Average Adjusted Gross Income (AGI) in 2004: $42,479 (Individual Income Tax Returns)
Here:
$42,479
State:
$58,600
Salary/wage: $39,818 (reported on 90.8% of returns)
Here:
$39,818
State:
$49,455
(% of AGI for various income ranges: 144.1% for AGIs below $10k, 85.2% for AGIs $10k-25k, 90.0% for AGIs $25k-50k, 88.9% for AGIs $50k-75k, 88.4% for AGIs $75k-100k, 71.0% for AGIs over 100k)
Taxable interest for individuals: $758 (reported on 39.4% of returns)
This zip code:
$758
California:
$2,365
(% of AGI for various income ranges: 4.0% for AGIs below $10k, 0.6% for AGIs $10k-25k, 0.5% for AGIs $25k-50k, 0.5% for AGIs $50k-75k, 0.6% for AGIs $75k-100k, 1.1% for AGIs over 100k)
Taxable dividends: $1,504 (reported on 13.4% of returns)
Here:
$1,504
State:
$4,746
(% of AGI for various income ranges: 2.3% for AGIs below $10k, 0.4% for AGIs $10k-25k, 0.3% for AGIs $25k-50k, 0.3% for AGIs $50k-75k, 0.3% for AGIs $75k-100k, 0.9% for AGIs over 100k)
Net capital gain/loss: +$11,885 (reported on 11.5% of returns)
Here:
+$11,885
State:
+$23,418
(% of AGI for various income ranges: -1.2% for AGIs below $10k, -0.1% for AGIs $10k-25k, 0.2% for AGIs $25k-50k, 0.3% for AGIs $50k-75k, 0.8% for AGIs $75k-100k, 12.4% for AGIs over 100k)
Profit/loss from business: +$9,752 (reported on 12.6% of returns)
Here:
+$9,752
State:
+$16,826
(% of AGI for various income ranges: 10.6% for AGIs below $10k, 4.9% for AGIs $10k-25k, 2.2% for AGIs $25k-50k, 1.5% for AGIs $50k-75k, 1.8% for AGIs $75k-100k, 4.6% for AGIs over 100k)
IRA payment deduction: $2,539 (reported on 1.8% of returns)
95833:
$2,539
California:
$3,192
(% of AGI for various income ranges: 0.2% for AGIs $10k-25k, 0.1% for AGIs $25k-50k, 0.1% for AGIs $50k-75k, 0.1% for AGIs $75k-100k, 0.1% for AGIs over 100k)
Self-employed pension: $15,356 (reported on 0.6% of returns)
Here:
$15,356
California:
$17,688
(% of AGI for various income ranges: 0.1% for AGIs $25k-50k, 0.1% for AGIs $50k-75k, 0.1% for AGIs $75k-100k, 0.6% for AGIs over 100k)
Total itemized deductions: $19,226 (27% of AGI, reported on 37.1% of returns)
Here:
$19,226
State:
$28,113
Here:
27.3% of AGI
State:
25.3% of AGI
(% of AGI for various income ranges: 19.5% for AGIs below $10k, 9.1% for AGIs $10k-25k, 14.2% for AGIs $25k-50k, 19.2% for AGIs $50k-75k, 21.3% for AGIs $75k-100k, 17.8% for AGIs over 100k)
Charity contributions deductions: $2,176 (3% of AGI, reported on 32.2% of returns)
Here:
$2,176
State:
$3,923
Here:
3.0% of AGI
State:
3.3% of AGI
(% of AGI for various income ranges: 1.0% for AGIs below $10k, 0.7% for AGIs $10k-25k, 1.2% for AGIs $25k-50k, 1.8% for AGIs $50k-75k, 2.1% for AGIs $75k-100k, 2.1% for AGIs over 100k)
Total tax: $5,453 (reported on 75.9% of returns)
95833:
$5,453
State:
$10,761
(% of AGI for various income ranges: 4.2% for AGIs below $10k, 4.1% for AGIs $10k-25k, 6.7% for AGIs $25k-50k, 9.3% for AGIs $50k-75k, 10.4% for AGIs $75k-100k, 15.8% for AGIs over 100k)
Earned income credit: $1,658 (reported on 16.5% of returns)
Here:
$1,658
State:
$1,763
Percentage of individuals using paid preparers for their 2004 taxes: 55.8%
Here:
56%
State:
66%
(% for various income ranges: 51.2% for AGIs below $10k, 57.7% for AGIs $10k-25k, 55.4% for AGIs $25k-50k, 55.3% for AGIs $50k-75k, 55.8% for AGIs $75k-100k, 62.1% for AGIs over 100k)
Likely homosexual households (counted as self-reported same-sex unmarried-partner households)
Lesbian couples: 0.6% of all households
Gay men: 0.5% of all households
Household received Food Stamps/SNAP in the past 12 months: 2,232 Household did not receive Food Stamps/SNAP in the past 12 months: 13,714
Women who had a birth in the past 12 months: 636 (484 now married, 151 unmarried) Women who did not have a birth in the past 12 months: 10,239 (4,301 now married, 5,928 unmarried)
Housing units in zip code 95833 with a mortgage: 5,819 (626 second mortgage, 449 both second mortgage and home equity loan) Houses without a mortgage: 21
Median monthly owner costs for units with a mortgage: $2,145 Median monthly owner costs for units without a mortgage: $695
Residents with income below the poverty level in 2022:
This zip code:
10.1%
Whole state:
12.2%
Residents with income below 50% of the poverty level in 2022:
This zip code:
3.7%
Whole state:
6.2%
Median number of rooms in houses and condos:
Here:
5.9
State:
6.0
Median number of rooms in apartments:
Here:
4.1
State:
3.9
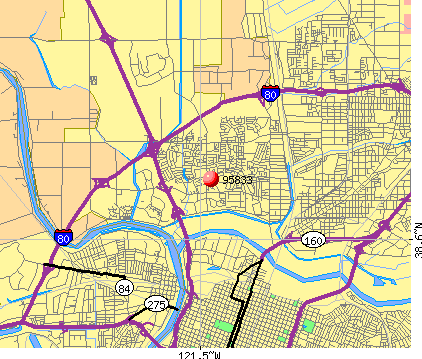
Notable locations in this zip code not listed on our city pages
Notable locations in zip code 95833: Swallows Nest Country Club (A), South Natomas Library (B), Sacramento City Fire Department Station 15 (C). Display/hide their locations on the map
Shopping Centers: Northgate Shopping Center (1), Discovery Plaza Shopping Center (2), Stone Creek Center Shopping Center (3). Display/hide their locations on the map
Churches in zip code 95833 include: General Baptist Church (A), Iglesia Bautista Northgate (B), Natomas Baptist Church (C), Northgate Church of God in Christ (D). Display/hide their locations on the map
Parks in zip code 95833 include: Gardenland Park (1), Northgate Park (2), Rio Tierra Park (3), Tiscornia Park (4), Bannon Creek Parkway (5), Jefferson School Park (6), Natomas Oaks Park (7), South Natomas Park (8), American Lakes School Park (9). Display/hide their locations on the map
5,077 married couples with children.
3,128 single-parent households (873 men, 2,255 women).
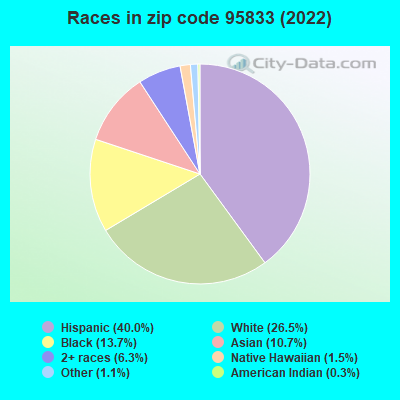
62.4% of residents of 95833 zip code speak English at home.
24.3% of residents speak Spanish at home (68% very well, 18% well, 11% not well, 3% not at all).
6.3% of residents speak other Indo-European language at home (61% very well, 24% well, 13% not well, 2% not at all).
5.5% of residents speak Asian or Pacific Island language at home (62% very well, 25% well, 10% not well, 3% not at all).
1.0% of residents speak other language at home (37% very well, 61% well, 1% not well).
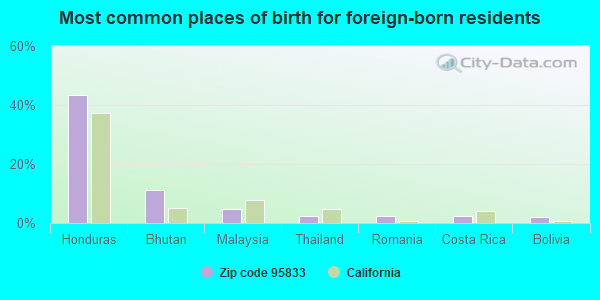
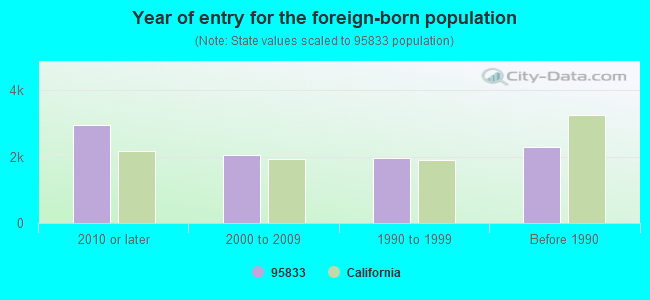
Foreign born population: 8,409 (20.7%) (48.7% of them are naturalized citizens)
Facilities with environmental interests located in this zip code:
EMPIRE EQUIPMENT CO LP (2850 EL CENTRO RD in SACRAMENTO, CA)
STATE MASTER (California - Hazardous Waste Tracking) - HAZARDOU WASTE PROGRAM Small Quantity Generators, between 100 kg and 1000 kg of hazardous waste/month (Resource Conservation and Recovery Act (tracking hazardous waste)) - notification
AMERICAN LAKES ELEMENTARY SCHOOL (2800 STONECREEK DRIVE in SACRAMENTO, CA)
(Geographic Names Information System) (National Center for Education Statistics) - STATE ID-6100432 Organizations: NATOMAS UNIFIED (SCHOOL DISTRICT)
GREENE (LEROY F.) MIDDLE (2400 UNITY WAY in SACRAMENTO, CA)
(National Center for Education Statistics) - STATE ID-6033328 Organizations: NATOMAS UNIFIED (SCHOOL DISTRICT)
JEFFERSON ELEMENTARY (2001 PEBBLEWOOD in SACRAMENTO, CA)
(National Center for Education Statistics) - STATE ID-6104731 Organizations: NATOMAS UNIFIED (SCHOOL DISTRICT)
BANNON CREEK ELEMENTARY (2775 MILLCREEK DR. in SACRAMENTO, CA)
(National Center for Education Statistics) - STATE ID-6107981 Organizations: NATOMAS UNIFIED (SCHOOL DISTRICT)
HOME DEPOT USA INC HD 6649 (3611 TRUXEL RD in SACRAMENTO, CA)
Small Quantity Generators, between 100 kg and 1000 kg of hazardous waste/month (Resource Conservation and Recovery Act (tracking hazardous waste))
NELLA OIL #74 EXXON (2650 GATEWAY OAKS in SACRAMENTO, CA)
Conditionally Exempt Small Quantity Generators, less than 100 kg/month of hazardous waste (Resource Conservation and Recovery Act (tracking hazardous waste)) Organizations: NELLA OIL COMPANY (CONTACT/OPERATOR)
LONGS DRUG STORE NO 485 (1587 W EL CAMINO AVE in SACRAMENTO, CA)
Small Quantity Generators, between 100 kg and 1000 kg of hazardous waste/month (Resource Conservation and Recovery Act (tracking hazardous waste)) - notification Organizations: LONGS DRUG STORES CAL (CONTACT/OWNER)
B J ONNEN TRUCKING (2 AZOREAN CT in SACRAMENTO, CA)
TRANSPORTER (Resource Conservation and Recovery Act (tracking hazardous waste))
Housing units lacking complete plumbing facilities: 0.1% Housing units lacking complete kitchen facilities: 0.3%
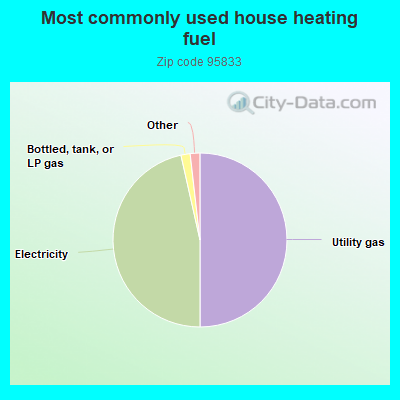
50.0%Utility gas
46.5%Electricity
1.7%Bottled, tank, or LP gas
0.9%No fuel used
0.7%Solar energy
Population in 1990: 29,150. Population change in the 1990s: +2,264 (+7.8%).
Place of birth for U.S.-born residents:
This state: 26,183
Northeast: 1,083
Midwest: 1,399
South: 1,410
West: 1,417
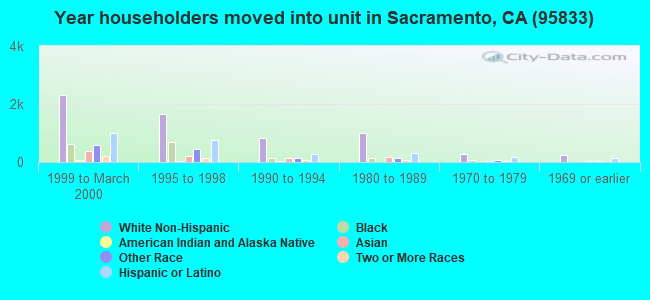
41% of the 95833 zip code residents lived in the same house 5 years ago. Out of people who lived in different houses, 62% lived in this county. Out of people who lived in different counties, 50% lived in California.
85% of the 95833 zip code residents lived in the same house 1 year ago. Out of people who lived in different houses, 46% moved from this county. Out of people who lived in different houses, 34% moved from different county within same state. Out of people who lived in different houses, 11% moved from different state. Out of people who lived in different houses, 9% moved from abroad.
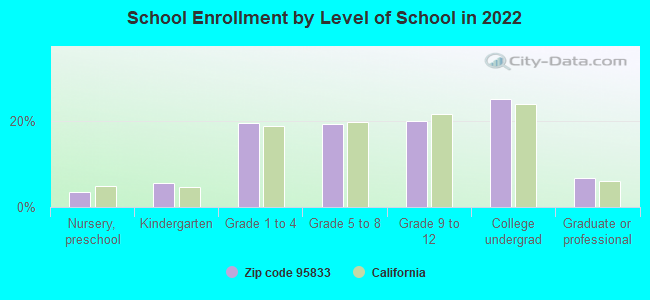
Private vs. public school enrollment:
Students in private schools in grades 1 to 8 (elementary and middle school): 279
Here:
7.1%
California:
10.5%
Students in private schools in grades 9 to 12 (high school): 124
Here:
6.1%
California:
8.5%
Students in private undergraduate colleges: 249
Here:
9.8%
California:
15.9%
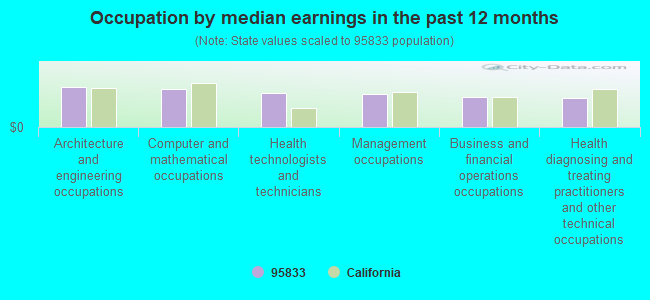
Occupation by median earnings in the past 12 months ($)
97,866Architecture and engineering occupations
92,201Computer and mathematical occupations
84,337Health technologists and technicians
81,146Management occupations
73,882Business and financial operations occupations
72,043Health diagnosing and treating practitioners and other technical occupations
Companies with biggest federal contracts located in this zip code (SACRAMENTO, CA):
CH2M HILL, INC (2485 NATOMAS PARK DRIVE, S) : $16,477,322 in 192 contractsfrom 1999 to 2006
Contracts for Architect - Engineer Services (including landscaping, interior layout, and designing), Development of Environmental Impact Statements and Assessments, Other Professional Services, Other Special Studies and Analyses, and moreby Army, Bureau of Reclamation, U.S. Army Corps of Engineers - civil program financing only Signed by year:2000: $1,543,427; 2001: $5,035,033; 2002: $2,716,954; 2003: $1,055,265; 2004: $2,206,294; 2005: $1,541,662; 2006: $2,326,969.
Biggest contracts:
$698,432 with Army for Architect - Engineer Services (including landscaping, interior layout, and designing). Signed on 2001-07-12. Completion date: 2001-09-30.
$645,128 with Bureau of Reclamation for Development of Environmental Impact Statements and Assessments. Signed on 2006-09-19. Completion date: 2007-12-30.
$618,555 with Bureau of Reclamation for Other Professional Services. Signed on 2005-07-20. Effective on 2005-07-06. Completion date: 2006-06-15.
$592,756 with Bureau of Reclamation for Other Special Studies and Analyses. Signed on 2006-06-28. Completion date: 2007-05-31.
URS GROUP, INC (2870 GATEWAY OAKS DRIVE SU) : $15,020,126 in 139 contractsfrom 2001 to 2006
Contracts for Construction of Structures and Facilities -- Other Airfield Structures, Other Environmental Services, Studies, and Analytical Support, Development of Environmental Impact Statements and Assessments, Hazardous Substance Removal, Cleanup, and Disposal Services and Operational Support, and moreby Army, U.S. Army Corps of Engineers - civil program financing only Signed by year:2000: $0; 2001: $36,775; 2002: $5,487,939; 2003: $2,387,522; 2004: $2,737,613; 2005: $3,345,428; 2006: $1,024,849.
Biggest contracts:
$3,337,456 with Army for Construction of Structures and Facilities -- Other Airfield Structures. Taking place in UT. Signed on 2002-03-12. Completion date: 2003-10-14.
$728,000, same as above.Signed on 2003-01-09. Completion date: 2003-10-14.
$463,400 with U.S. Army Corps of Engineers - civil program financing only for Other Environmental Services, Studies, and Analytical Support. Taking place in AZ. Signed on 2003-07-16. Completion date: 2003-12-31.
$350,000 with Army for Construction of Structures and Facilities -- Other Airfield Structures. Taking place in UT. Signed on 2003-08-11. Completion date: 2003-10-14.
CH2M HILL/URS TEAM (2485 NATOMAS PARK DR) : $10,008,322 in 27 contractsfrom 2004 to 2006
Contracts for Architect - Engineer Services (including landscaping, interior layout, and designing) by Army, U.S. Army Corps of Engineers - civil program financing only Signed by year:2000: $0; 2001: $0; 2002: $0; 2003: $0; 2004: $343,928; 2005: $7,523,815; 2006: $2,140,579.
Biggest contracts:
$2,029,113 with Army for Architect - Engineer Services (including landscaping, interior layout, and designing). Signed on 2006-02-28. Completion date: 2006-06-08.
$1,260,183, same as above.Signed on 2005-12-07. Completion date: 2006-02-20.
$728,283, same as above.Signed on 2005-09-21. Completion date: 2006-03-20.
$728,283 with U.S. Army Corps of Engineers - civil program financing only for Architect - Engineer Services (including landscaping, interior layout, and designing). Signed on 2005-09-21. Completion date: 2006-03-20.
URSGI - BMDC, A JOINT VENTURE (2870 GATEWAY OAKS DRIVE) : $4,116,219 in 22 contractsfrom 2003 to 2006
Contracts for Architect - Engineer Services (including landscaping, interior layout, and designing), Other Architect and Engineering Services by Army Signed by year:2000: $0; 2001: $0; 2002: $0; 2003: $75,782; 2004: $1,184,922; 2005: $1,694,414; 2006: $1,161,101.
Biggest contracts:
$827,274 with Army for Architect - Engineer Services (including landscaping, interior layout, and designing). Taking place in NV. Signed on 2006-04-04. Completion date: 2006-03-06.
$780,680, same as above.Signed on 2005-02-23. Completion date: 2005-08-23.
$585,800, same as above.Signed on 2004-04-27. Completion date: 2004-12-15.
$282,916, same as above.Signed on 2005-02-07. Completion date: 2005-07-07.
EMPIRE EQUIPMENT CO LP (2850 EL CENTRO RD) : $167,943 in 7 contractsfrom 2001 to 2005
Contracts for Earth Moving and Excavating Equipment, Miscellaneous Construction Equipment, Road Clearing, Cleaning and Marking Equipment, Maintenance, Repair and Rebuilding of Equipment -- Pumps and Compressors by U.S. Fish and Wildlife Service, Forest Service (disused code: now 12C2), Forest Service, Army, and others Signed by year:2000: $0; 2001: $54,000; 2002: $0; 2003: $9,159; 2004: $104,282; 2005: $502; 2006: $0.
Biggest contracts:
$68,970 with U.S. Fish and Wildlife Service for Earth Moving and Excavating Equipment. Signed on 2004-06-22. Completion date: 2004-07-16.
$54,000 with Forest Service (disused code: now 12C2) for Miscellaneous Construction Equipment. Signed on 2001-12-15. Completion date: 2002-04-15.
$21,500 with Forest Service for Miscellaneous Construction Equipment. Signed on 2004-07-22. Completion date: 2004-08-22.
$13,812 with Army for Road Clearing, Cleaning and Marking Equipment. Taking place in NV. Signed on 2004-12-15. Completion date: 2005-01-03.
THE SPINK CORPORATION (2590 VENTURE OAKS WAY) : $130,852 in 4 contractsin 2001
$49,491 with U.S. Army Corps of Engineers - civil program financing only for Architect - Engineer Services (including landscaping, interior layout, and designing). Signed on 2001-03-30. Completion date: 2001-08-30.
$30,409 with Army for Architect - Engineer Services (including landscaping, interior layout, and designing). Signed on 2001-02-09. Completion date: 2002-02-08.
$25,656 with U.S. Army Corps of Engineers - civil program financing only for Architect - Engineer Services (including landscaping, interior layout, and designing). Signed on 2001-07-28. Completion date: 2001-09-26.
$25,296 with Army for Architect - Engineer Services (including landscaping, interior layout, and designing). Signed on 2001-11-20. Completion date: 2002-02-08.
A-1 AIR & MARINE SUPPLY (725 SOTANO DR; small business) : $92,796 in 2 contractsfrom 2001 to 2002
$50,160 with Defense Logistics Agency for Valves, Nonpowered. Signed on 2001-12-10. Completion date: 2002-01-09.
$42,636 with Defense Logistics Agency for Aircraft Hydraulic, Vacuum, and De-icing System Components. Signed on 2002-07-03. Completion date: 2002-08-02.
ROBERT E BACHMAN, S E (2222 GATEWAY OAKS DRIVE, A; small business) : $86,026 in 5 contractsfrom 2000 to 2003
Contracts for Geophysical Studies, Hazardous Substance Removal, Cleanup, and Disposal Services and Operational Support, Engineering and Technical Services by Army Signed by year:2000: $64,368; 2001: $28,509; 2002: -$16,731; 2003: $9,880; 2004: $0; 2005: $0; 2006: $0.
Biggest contracts:
$64,368 with Army for Geophysical Studies. Signed on 2000-09-20. Completion date: 2001-02-01.
$28,509 with Army for Hazardous Substance Removal, Cleanup, and Disposal Services and Operational Support. Signed on 2001-05-18. Completion date: 2001-02-01.
$5,320 with Army for Engineering and Technical Services. Signed on 2003-07-15. Completion date: 2003-12-31.
$4,560, same as above.Signed on 2003-03-07. Completion date: 2003-09-30.
COLE YEE SCHUBERT & ASSOCIATES (2500 VENTURE OAKS WAY 100)
$22,477 with Army for Architect - Engineer Services (including landscaping, interior layout, and designing). Signed on 2002-05-20. Completion date: 2003-03-17.
YUKI, JOYCE M (1390 NIGHTHAWK WAY; small business) : $20,306 in 5 contractsin 2005
Contracts for Personal Services Contracts by Army, U.S. Army Corps of Engineers - civil program financing only Signed by year:2000: $0; 2001: $0; 2002: $0; 2003: $0; 2004: $0; 2005: $20,306; 2006: $0.
Biggest contracts:
$7,100 with Army for Personal Services Contracts. Signed on 2005-07-12. Completion date: 2005-09-30.
$4,260 with U.S. Army Corps of Engineers - civil program financing only for Personal Services Contracts. Signed on 2005-08-31. Completion date: 2005-09-30.
$4,260 with Army for Personal Services Contracts. Signed on 2005-08-31. Completion date: 2005-09-30.
$2,343 with U.S. Army Corps of Engineers - civil program financing only for Personal Services Contracts. Signed on 2005-09-19. Completion date: 2005-09-30.
Top industries in this zip code by the number of employees in 2005:
2006 - 2018 National Fire Incident Reporting System (NFIRS) incidents
Based on the data from the years 2006 - 2018 the average number of fire incidents per year is 129. The highest number of fires - 217 took place in 2018, and the least - 79 in 2012. The data has a growing trend.
When looking into fire subcategories, the most reports belonged to: Outside Fires (68.8%), and Structure Fires (14.9%).
Fire incident types reported to NFIRS in Zip Code 95833


 Nearest zip codes: 95834, 95605, 95814, 95835, 95811, 95818.


 Based on the data from the years 2006 - 2018 the average number of fire incidents per year is 129. The highest number of fires - 217 took place in 2018, and the least - 79 in 2012. The data has a growing trend.
 When looking into fire subcategories, the most reports belonged to: Outside Fires (68.8%), and Structure Fires (14.9%).