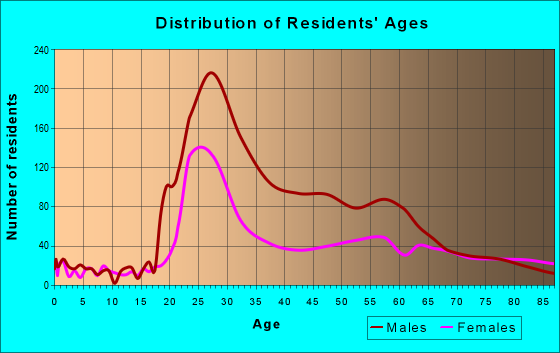
Estimated zip code population in 2022: 12,146 Zip code population in 2010: 9,922 Zip code population in 2000: 16,598
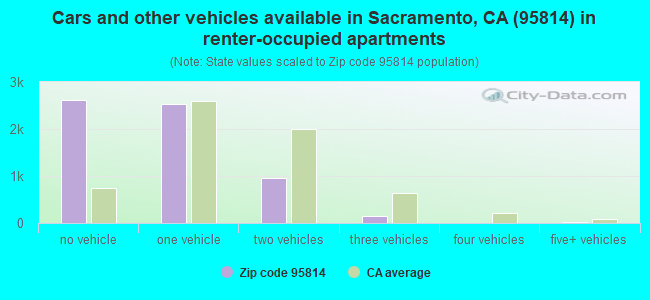
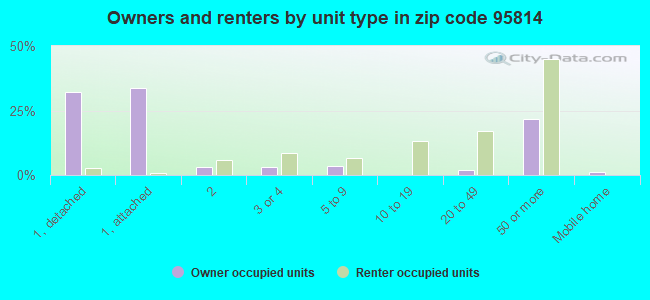
Houses and condos: 7,712 Renter-occupied apartments: 6,299
% of renters here:
90%
State:
44%
March 2022 cost of living index in zip code 95814: 110.5 (more than average, U.S. average is 100)
Land area: 1.4 sq. mi. Water area: 0.0 sq. mi.
Population density: 8,698 people per square mile
(high).
OSM Map
General Map
Google Map
MSN Map
OSM Map
General Map
Google Map
MSN Map
OSM Map
General Map
Google Map
MSN Map
OSM Map
General Map
Google Map
MSN Map
Please wait while loading the map...
Real estate property taxes paid for housing units in 2022:
This zip code:
0.9% ($5,876)
California:
0.7% ($4,831)
Median real estate property taxes paid for housing units with mortgages in 2022: $6,232 (0.9%) Median real estate property taxes paid for housing units with no mortgage in 2022: $3,020 (0.6%)
Averages for the 2020 tax year for zip code 95814, filed in 2021:
Average Adjusted Gross Income (AGI) in 2020: $72,662 (Individual Income Tax Returns)
Here:
$72,662
State:
$95,910
Salary/wage: $61,876 (reported on 85.8% of returns)
Here:
$61,876
State:
$77,331
(% of AGI for various income ranges: 1206.3% for AGIs below $25k, 4001.6% for AGIs $25k-50k, 7453.3% for AGIs $50k-75k, 11010.8% for AGIs $75k-100k, 20741.0% for AGIs $100k-200k, 81272.9% for AGIs over 200k)
Taxable interest for individuals: $1,047 (reported on 25.3% of returns)
This zip code:
$1,047
California:
$2,294
(% of AGI for various income ranges: 7.2% for AGIs below $25k, 7.4% for AGIs $25k-50k, 18.4% for AGIs $50k-75k, 33.8% for AGIs $75k-100k, 96.8% for AGIs $100k-200k, 831.4% for AGIs over 200k)
Ordinary dividends: $6,019 (reported on 17.0% of returns)
Here:
$6,019
State:
$10,949
(% of AGI for various income ranges: 21.0% for AGIs below $25k, 19.6% for AGIs $25k-50k, 63.4% for AGIs $50k-75k, 81.2% for AGIs $75k-100k, 297.1% for AGIs $100k-200k, 4010.0% for AGIs over 200k)
Net capital gain/loss in AGI: +$20,978 (reported on 17.2% of returns)
Here:
+$20,978
State:
+$49,306
(% of AGI for various income ranges: 12.1% for AGIs below $25k, 26.1% for AGIs $25k-50k, 59.5% for AGIs $50k-75k, 168.8% for AGIs $75k-100k, 729.7% for AGIs $100k-200k, 18794.3% for AGIs over 200k)
Profit/loss from business: +$21,744 (reported on 15.3% of returns)
Here:
+$21,744
State:
+$15,671
(% of AGI for various income ranges: 80.0% for AGIs below $25k, 171.7% for AGIs $25k-50k, 167.2% for AGIs $50k-75k, 307.3% for AGIs $75k-100k, 1128.7% for AGIs $100k-200k, 10822.9% for AGIs over 200k)
Taxable individual retirement arrangement distribution: $18,073 (reported on 3.3% of returns)
95814:
$18,073
California:
$23,505
(% of AGI for various income ranges: 16.0% for AGIs below $25k, 30.7% for AGIs $25k-50k, 33.9% for AGIs $50k-75k, 112.7% for AGIs $75k-100k, 283.5% for AGIs $100k-200k, 1287.1% for AGIs over 200k)
Self-employed (Keogh) retirement plans: $30,700 (reported on 0.9% of returns)
95814:
$30,700
California:
$30,163
(% of AGI for various income ranges: 396.1% for AGIs $100k-200k)
Total itemized deductions: $30,364 (reported on 9.2% of returns)
Here:
$30,364
State:
$39,517
(% of AGI for various income ranges: 112.9% for AGIs $25k-50k, 178.7% for AGIs $50k-75k, 548.8% for AGIs $75k-100k, 1239.0% for AGIs $100k-200k, 7602.9% for AGIs over 200k)
Charity contributions: $7,948 (reported on 6.8% of returns)
Here:
$7,948
State:
$12,598
(% of AGI for various income ranges: 12.1% for AGIs below $25k, 27.7% for AGIs $50k-75k, 54.6% for AGIs $75k-100k, 153.9% for AGIs $100k-200k, 2244.3% for AGIs over 200k)
Taxes paid: $8,676 (reported on 9.2% of returns)
95814:
$8,676
State:
$8,807
(% of AGI for various income ranges: 20.3% for AGIs $25k-50k, 51.5% for AGIs $50k-75k, 191.5% for AGIs $75k-100k, 463.5% for AGIs $100k-200k, 1717.1% for AGIs over 200k)
Earned income credit: $1,357 (reported on 11.1% of returns)
Here:
$1,357
State:
$2,074
(% of AGI for various income ranges: 50.9% for AGIs below $25k, 26.2% for AGIs $25k-50k)
Percentage of individuals using paid preparers for their 2020 taxes: 93.5%
Here:
93%
State:
92%
(% for various income ranges: 91.1% for AGIs below $25k, 94.6% for AGIs $25k-50k, 92.9% for AGIs $50k-75k, 94.9% for AGIs $75k-100k, 94.8% for AGIs $100k-200k, 95.8% for AGIs over 200k)
Averages for the 2012 tax year for zip code 95814, filed in 2013:
Average Adjusted Gross Income (AGI) in 2012: $51,533 (Individual Income Tax Returns)
Here:
$51,533
State:
$72,726
Salary/wage: $44,986 (reported on 85.6% of returns)
Here:
$44,986
State:
$59,079
(% of AGI for various income ranges: 80.9% for AGIs below $25k, 87.2% for AGIs $25k-50k, 82.3% for AGIs $50k-75k, 83.0% for AGIs $75k-100k, 76.3% for AGIs $100k-200k, 48.9% for AGIs over 200k)
Taxable interest for individuals: $969 (reported on 25.7% of returns)
This zip code:
$969
California:
$2,146
(% of AGI for various income ranges: 0.6% for AGIs below $25k, 0.3% for AGIs $25k-50k, 0.4% for AGIs $50k-75k, 0.4% for AGIs $75k-100k, 0.4% for AGIs $100k-200k, 0.7% for AGIs over 200k)
Ordinary dividends: $4,025 (reported on 13.9% of returns)
Here:
$4,025
State:
$9,308
(% of AGI for various income ranges: 0.9% for AGIs below $25k, 0.4% for AGIs $25k-50k, 1.2% for AGIs $50k-75k, 0.9% for AGIs $75k-100k, 1.8% for AGIs $100k-200k, 1.2% for AGIs over 200k)
Net capital gain/loss in AGI: +$7,680 (reported on 11.8% of returns)
Here:
+$7,680
State:
+$30,460
(% of AGI for various income ranges: 0.4% for AGIs $75k-100k, 1.9% for AGIs $100k-200k, 6.4% for AGIs over 200k)
Profit/loss from business: +$19,536 (reported on 14.4% of returns)
Here:
+$19,536
State:
+$17,064
(% of AGI for various income ranges: 8.9% for AGIs below $25k, 3.6% for AGIs $25k-50k, 5.9% for AGIs $50k-75k, 0.5% for AGIs $75k-100k, 6.5% for AGIs $100k-200k, 6.8% for AGIs over 200k)
Taxable individual retirement arrangement distribution: $13,994 (reported on 4.5% of returns)
95814:
$13,994
California:
$19,557
(% of AGI for various income ranges: 1.0% for AGIs below $25k, 0.8% for AGIs $25k-50k, 1.7% for AGIs $50k-75k, 3.4% for AGIs $100k-200k)
Self-employment retirement plans: $48,800 (reported on 1.0% of returns)
95814:
$48,800
California:
$24,530
Total itemized deductions: $26,186 (21% of AGI, reported on 22.0% of returns)
Here:
$26,186
State:
$34,004
Here:
21.4% of AGI
State:
22.7% of AGI
(% of AGI for various income ranges: 4.9% for AGIs below $25k, 5.3% for AGIs $25k-50k, 9.2% for AGIs $50k-75k, 11.8% for AGIs $75k-100k, 14.3% for AGIs $100k-200k, 18.0% for AGIs over 200k)
Charity contributions: $3,666 (reported on 16.2% of returns)
Here:
$3,666
State:
$4,659
(% of AGI for various income ranges: 0.2% for AGIs below $25k, 0.5% for AGIs $25k-50k, 0.9% for AGIs $50k-75k, 1.4% for AGIs $75k-100k, 1.7% for AGIs $100k-200k, 1.9% for AGIs over 200k)
Taxes paid: $11,194 (reported on 22.0% of returns)
95814:
$11,194
State:
$14,448
(% of AGI for various income ranges: 0.6% for AGIs below $25k, 1.0% for AGIs $25k-50k, 2.8% for AGIs $50k-75k, 4.4% for AGIs $75k-100k, 6.5% for AGIs $100k-200k, 10.4% for AGIs over 200k)
Earned income credit: $1,536 (reported on 14.4% of returns)
Here:
$1,536
State:
$2,286
(% of AGI for various income ranges: 3.5% for AGIs below $25k, 0.3% for AGIs $25k-50k)
Percentage of individuals using paid preparers for their 2012 taxes: 41.1%
Here:
41%
State:
64%
(% for various income ranges: 40.1% for AGIs below $25k, 34.2% for AGIs $25k-50k, 38.9% for AGIs $50k-75k, 46.2% for AGIs $75k-100k, 58.6% for AGIs $100k-200k, 80.0% for AGIs over 200k)
Averages for the 2004 tax year for zip code 95814, filed in 2005:
Average Adjusted Gross Income (AGI) in 2004: $37,501 (Individual Income Tax Returns)
Here:
$37,501
State:
$58,600
Salary/wage: $32,612 (reported on 86.6% of returns)
Here:
$32,612
State:
$49,455
(% of AGI for various income ranges: 129.0% for AGIs below $10k, 86.5% for AGIs $10k-25k, 89.3% for AGIs $25k-50k, 83.5% for AGIs $50k-75k, 79.4% for AGIs $75k-100k, 46.9% for AGIs over 100k)
Taxable interest for individuals: $1,600 (reported on 31.8% of returns)
This zip code:
$1,600
California:
$2,365
(% of AGI for various income ranges: 2.3% for AGIs below $10k, 1.1% for AGIs $10k-25k, 0.7% for AGIs $25k-50k, 1.0% for AGIs $50k-75k, 1.0% for AGIs $75k-100k, 2.4% for AGIs over 100k)
Taxable dividends: $3,213 (reported on 14.2% of returns)
Here:
$3,213
State:
$4,746
(% of AGI for various income ranges: 2.5% for AGIs below $10k, 0.7% for AGIs $10k-25k, 0.8% for AGIs $25k-50k, 0.8% for AGIs $50k-75k, 0.9% for AGIs $75k-100k, 2.2% for AGIs over 100k)
Net capital gain/loss: +$11,988 (reported on 12.5% of returns)
Here:
+$11,988
State:
+$23,418
(% of AGI for various income ranges: -0.6% for AGIs below $10k, -0.1% for AGIs $10k-25k, 0.1% for AGIs $25k-50k, 0.6% for AGIs $50k-75k, 1.0% for AGIs $75k-100k, 12.9% for AGIs over 100k)
Profit/loss from business: +$20,157 (reported on 11.2% of returns)
Here:
+$20,157
State:
+$16,826
(% of AGI for various income ranges: -13.4% for AGIs below $10k, 3.9% for AGIs $10k-25k, 2.2% for AGIs $25k-50k, 3.5% for AGIs $50k-75k, 6.9% for AGIs $75k-100k, 13.3% for AGIs over 100k)
IRA payment deduction: $2,551 (reported on 2.0% of returns)
95814:
$2,551
California:
$3,192
(% of AGI for various income ranges: 0.1% for AGIs $10k-25k, 0.2% for AGIs $25k-50k, 0.2% for AGIs $50k-75k, 0.1% for AGIs over 100k)
Self-employed pension: $21,121 (reported on 1.1% of returns)
Here:
$21,121
California:
$17,688
(% of AGI for various income ranges: 1.5% for AGIs below $10k, 0.6% for AGIs $50k-75k, 1.7% for AGIs over 100k)
Total itemized deductions: $22,619 (24% of AGI, reported on 18.3% of returns)
Here:
$22,619
State:
$28,113
Here:
23.7% of AGI
State:
25.3% of AGI
(% of AGI for various income ranges: 7.3% for AGIs below $10k, 4.1% for AGIs $10k-25k, 6.2% for AGIs $25k-50k, 11.1% for AGIs $50k-75k, 16.4% for AGIs $75k-100k, 18.1% for AGIs over 100k)
Charity contributions deductions: $3,234 (3% of AGI, reported on 15.0% of returns)
Here:
$3,234
State:
$3,923
Here:
3.1% of AGI
State:
3.3% of AGI
(% of AGI for various income ranges: 0.5% for AGIs below $10k, 0.2% for AGIs $10k-25k, 0.5% for AGIs $25k-50k, 1.1% for AGIs $50k-75k, 1.4% for AGIs $75k-100k, 2.7% for AGIs over 100k)
Total tax: $6,149 (reported on 79.1% of returns)
95814:
$6,149
State:
$10,761
(% of AGI for various income ranges: 3.2% for AGIs below $10k, 5.0% for AGIs $10k-25k, 9.5% for AGIs $25k-50k, 13.3% for AGIs $50k-75k, 14.2% for AGIs $75k-100k, 20.5% for AGIs over 100k)
Earned income credit: $1,300 (reported on 14.8% of returns)
Here:
$1,300
State:
$1,763
Percentage of individuals using paid preparers for their 2004 taxes: 43.7%
Here:
44%
State:
66%
(% for various income ranges: 41.8% for AGIs below $10k, 44.4% for AGIs $10k-25k, 37.4% for AGIs $25k-50k, 44.4% for AGIs $50k-75k, 53.2% for AGIs $75k-100k, 79.2% for AGIs over 100k)
Likely homosexual households (counted as self-reported same-sex unmarried-partner households)
Lesbian couples: 0.3% of all households
Gay men: 1.0% of all households
Household received Food Stamps/SNAP in the past 12 months: 1,837 Household did not receive Food Stamps/SNAP in the past 12 months: 5,352
Women who had a birth in the past 12 months: 32 (18 now married, 14 unmarried) Women who did not have a birth in the past 12 months: 3,117 (498 now married, 2,649 unmarried)
Housing units in zip code 95814 with a mortgage: 517 (6 second mortgage, 6 both second mortgage and home equity loan) Median monthly owner costs for units with a mortgage: $3,470 Median monthly owner costs for units without a mortgage: $865
Residents with income below the poverty level in 2022:
This zip code:
27.7%
Whole state:
12.2%
Residents with income below 50% of the poverty level in 2022:
This zip code:
18.4%
Whole state:
6.2%
Median number of rooms in houses and condos:
Here:
4.7
State:
6.0
Median number of rooms in apartments:
Here:
2.6
State:
3.9
Notable locations in this zip code not listed on our city pages
Notable locations in zip code 95814: Sacramento Amtrak Station (A), Peoples Market (B), Westfield Shoppingtown Downtown Plaza (C), California State Capitol (D), Pony Express Terminal (E), Memorial Auditorium (F), Sutter Club (G), Sacramento County Courthouse (H), Sacramento County Administration Building (I), Sacramento Convention and Visitors Bureau (J), Sacramento Convention Center (K), Sacramento City Hall (L), Governor's Mansion (M), Hall of Justice - Sacramento City and County Jail (N), Central Library (O), California State Office Building Number 2 (P), California State Library (Q), California Water Resources Control Board Law Library (R), California Taxpayers Association Library (S), California State Resources Agency Library (T). Display/hide their locations on the map
Churches in zip code 95814 include: Iglesia del Dios Vivo (A), Neighborhood Outreach Fellowship Church (B), Saint Pauls Episcopal Church (C), Cathedral of the Blessed Sacrament (D), Rhema Vista International Church (E), Westminster Presbyterian Church (F). Display/hide their locations on the map
Parks in zip code 95814 include: Alkali Playground (1), California Vietnam Veterans Memorial (2), Muir Playground (3), Wells Fargo Pavilion (4), Roosevelt Park (5), Old Sacramento State Historic Park (6), Crocker Park (7), Old Sacramento Historic District (8), Pony Express Monument (9). Display/hide their locations on the map
Tourist attraction (not listed on the city page) : California Public Interest Research Group (Cultural Attractions- Events- & Facilities; 1107 9th Street).
181 married couples with children.
210 single-parent households (39 men, 171 women).
77.9% of residents of 95814 zip code speak English at home.
11.3% of residents speak Spanish at home (82% very well, 11% well, 4% not well, 2% not at all).
3.8% of residents speak other Indo-European language at home (71% very well, 16% well, 12% not well, 1% not at all).
6.5% of residents speak Asian or Pacific Island language at home (35% very well, 8% well, 27% not well, 29% not at all).
0.1% of residents speak other language at home (100% very well).
Foreign born population: 1,494 (12.3%) (69.4% of them are naturalized citizens)
Major facilities with environmental interests located in this zip code:
ALTA PLATING INCORPORATED (1733 S ST. in SACRAMENTO, CA)
STATE MASTER (California - Hazardous Waste Tracking) - HAZARDOU WASTE PROGRAM (Integrated Compliance Information System) - ICIS-09-1997-0097, FORMAL ENFORCEMENT ACTION CRITERIA AND HAZARDOUS AIR POLLUTANT INVENTORY (Inventory of air pollution sources) National Pollutant Discharge Elimination System NON-MAJOR (Tracking pollutant discharge elimination systems) - permit HAZARDOUS WASTE BIENNIAL REPORTER (Resource Conservation and Recovery Act (tracking hazardous waste)) Large Quantity Generators, more that 1000 kg of hazardous waste/month (Resource Conservation and Recovery Act (tracking hazardous waste)) (Resource Conservation and Recovery Act (tracking hazardous waste)) Large Quantity Generators, more that 1000 kg of hazardous waste/month (Resource Conservation and Recovery Act (tracking hazardous waste)) TRI REPORTER (Tracking of toxic chemicals releasing facilities) Business SIC and NAICS classification: ELECTROPLATING, PLATING, POLISHING, ANODIZING, AND COLORING Organizations: ALTA PLATING AND CHEMICAL CORP. (CONTACT/OPERATOR)
Alternative names: ALTA PLATING & CHEM CORP
CALIFORNIA ALMOND GROWERS EXCHANGE (1802 C STREET in SACRAMENTO, CA)
STATE MASTER (California - Hazardous Waste Tracking) - HAZARDOU WASTE PROGRAM (Integrated Compliance Information System) - ICIS-09-2002-0036, FORMAL ENFORCEMENT ACTION (Integrated Compliance Information System) - ICIS-09-1991-0027, FORMAL ENFORCEMENT ACTION CRITERIA AND HAZARDOUS AIR POLLUTANT INVENTORY (Inventory of air pollution sources) HAZARDOUS WASTE BIENNIAL REPORTER (Resource Conservation and Recovery Act (tracking hazardous waste)) Small Quantity Generators, between 100 kg and 1000 kg of hazardous waste/month (Resource Conservation and Recovery Act (tracking hazardous waste)) TRI REPORTER (Tracking of toxic chemicals releasing facilities) Business SIC classification: DRIED AND DEHYDRATED FRUITS, VEGETABLES, AND SOUP MIXES; FOOD PREPARATIONS Business NAICS classification: ROASTED NUTS AND PEANUT BUTTER MANUFACTURING. Organizations: BLUE DIAMOND GROWERS (CONTACT/OPERATOR)
Alternative names: BLUE DIAMOND GROWERS
CALIFORNIA DEPT OF FOOD & AGRICULTURE (1220 N ST RM 43 in SACRAMENTO, CA)
STATE MASTER (California - Hazardous Waste Tracking) - HAZARDOU WASTE PROGRAM (Resource Conservation and Recovery Act (tracking hazardous waste)) Small Quantity Generators, between 100 kg and 1000 kg of hazardous waste/month (Resource Conservation and Recovery Act (tracking hazardous waste)) - notification Organizations: STATE OF CALIFORNIA (CONTACT/OWNER)
Alternative names: AGRICULTURE 006, DGS/AGRICULTURE BUILDING 006
16TH ST AUTO BODY (614 SIXTEEN ST in SACRAMENTO, CA)
STATE MASTER (California - Hazardous Waste Tracking) - HAZARDOU WASTE PROGRAM Small Quantity Generators, between 100 kg and 1000 kg of hazardous waste/month (Resource Conservation and Recovery Act (tracking hazardous waste)) - notification Organizations: CLARK MAGEE (CONTACT/OWNER)
Alternative names: 16TH ST AUTOBODY
JESSE M UNRUH BLDG 002 (915 CAPITOL MALL in SACRAMENTO, CA)
STATE MASTER (California - Hazardous Waste Tracking) - HAZARDOU WASTE PROGRAM Small Quantity Generators, between 100 kg and 1000 kg of hazardous waste/month (Resource Conservation and Recovery Act (tracking hazardous waste)) - notification Organizations: STATE OF CALIFORNIA (CONTACT/OWNER)
JIBBOOM JUNKYARD SUPERFUND SITE (240 JIBBOOM ST in SACRAMENTO, CA)
SUPERFUND NPL (Superfund database) (Integrated Compliance Information System) - ICIS-09-1992-0094, FORMAL ENFORCEMENT ACTION Small Quantity Generators, between 100 kg and 1000 kg of hazardous waste/month (Resource Conservation and Recovery Act (tracking hazardous waste)) Alternative names: ASSOCIATED METALS, CITY OF SACRAMENTO DUMP, PG&E POWER PLANT
MARTIN SPROCKET & GEAR INC (1199 VINE ST in SACRAMENTO, CA)
STATE MASTER (California - Hazardous Waste Tracking) - HAZARDOU WASTE PROGRAM Small Quantity Generators, between 100 kg and 1000 kg of hazardous waste/month (Resource Conservation and Recovery Act (tracking hazardous waste)) - notification Business NAICS classification: MECHANICAL POWER TRANSMISSION EQUIPMENT MANUFACTURING. Organizations: MARTIN SPROCKETT & GEAR (CONTACT/OWNER)
MANUAL TRANSMISSION WAREHOUSE (1220 C STREET in SACRAMENTO, CA)
STATE MASTER (California - Hazardous Waste Tracking) - HAZARDOU WASTE PROGRAM Small Quantity Generators, between 100 kg and 1000 kg of hazardous waste/month (Resource Conservation and Recovery Act (tracking hazardous waste)) - notification Organizations: RICHARD TINUCCI (CONTACT/OWNER)
LIBRARY & COURTS 003 (914 CAPITOL MALL in SACRAMENTO, CA)
STATE MASTER (California - Hazardous Waste Tracking) - HAZARDOU WASTE PROGRAM Small Quantity Generators, between 100 kg and 1000 kg of hazardous waste/month (Resource Conservation and Recovery Act (tracking hazardous waste)) - notification Organizations: STATE OF CALIFORNIA (CONTACT/OWNER)
Alternative names: DGS/LIBRARY AND COURTS BUILDING
GAMBOA'S BODY & FRAME INC (1101 D ST in SACRAMENTO, CA)
STATE MASTER (California - Hazardous Waste Tracking) - HAZARDOU WASTE PROGRAM Small Quantity Generators, between 100 kg and 1000 kg of hazardous waste/month (Resource Conservation and Recovery Act (tracking hazardous waste)) - notification Business NAICS classification: AUTOMOTIVE BODY, PAINT, AND INTERIOR REPAIR AND MAINTENANCE. Organizations: ROBERT J GAMBOA (CONTACT/OWNER)
HYATT REGENCY SACRAMENTO (1209 L ST in SACRAMENTO, CA)
STATE MASTER (California - Hazardous Waste Tracking) - HAZARDOU WASTE PROGRAM Small Quantity Generators, between 100 kg and 1000 kg of hazardous waste/month (Resource Conservation and Recovery Act (tracking hazardous waste)) - notification Organizations: JB AND LE REGENCY VENTURE (CONTACT/OWNER)
CHEVRON STATION NO 96764 (201 RICHARDS BLVD in SACRAMENTO, CA)
STATE MASTER (California - Hazardous Waste Tracking) - HAZARDOU WASTE PROGRAM Small Quantity Generators, between 100 kg and 1000 kg of hazardous waste/month (Resource Conservation and Recovery Act (tracking hazardous waste)) - notification Organizations: CHEVRON PRODUCTS CO (CONTACT/OWNER)
ANCHOR GROUP (601 N 10TH ST UNIT F in SACRAMENTO, CA)
STATE MASTER (California - Hazardous Waste Tracking) - HAZARDOU WASTE PROGRAM Small Quantity Generators, between 100 kg and 1000 kg of hazardous waste/month (Resource Conservation and Recovery Act (tracking hazardous waste)) - notification Organizations: STEVEN AMES (CONTACT/OWNER)
Housing units lacking complete plumbing facilities: 1.4% Housing units lacking complete kitchen facilities: 9.2%
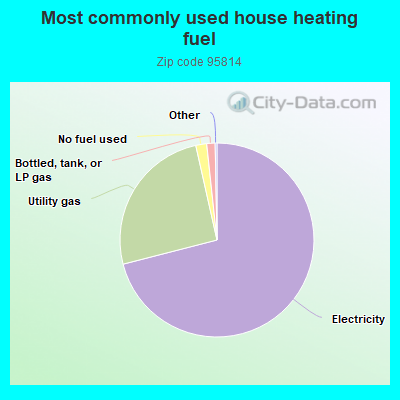
71.0%Electricity
25.5%Utility gas
1.8%No fuel used
1.4%Bottled, tank, or LP gas
Population in 1990: 16,414. Population change in the 1990s: +184 (+1.1%).
Place of birth for U.S.-born residents:
This state: 7,502
Northeast: 487
Midwest: 1,020
South: 784
West: 571
35% of the 95814 zip code residents lived in the same house 5 years ago. Out of people who lived in different houses, 61% lived in this county. Out of people who lived in different counties, 50% lived in California.
74% of the 95814 zip code residents lived in the same house 1 year ago. Out of people who lived in different houses, 49% moved from this county. Out of people who lived in different houses, 40% moved from different county within same state. Out of people who lived in different houses, 7% moved from different state.
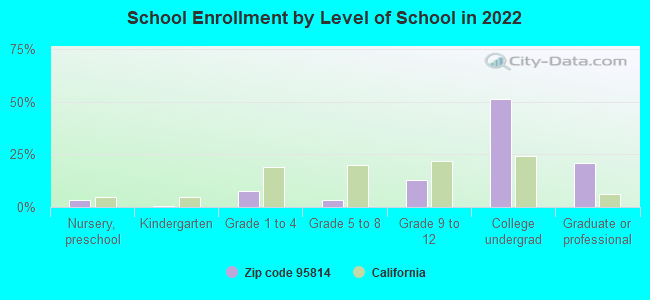
Private vs. public school enrollment:
Students in private schools in grades 1 to 8 (elementary and middle school): 36
Here:
17.2%
California:
10.5%
Students in private schools in grades 9 to 12 (high school): 30
Here:
12.8%
California:
8.5%
Students in private undergraduate colleges: 115
Here:
12.1%
California:
15.9%
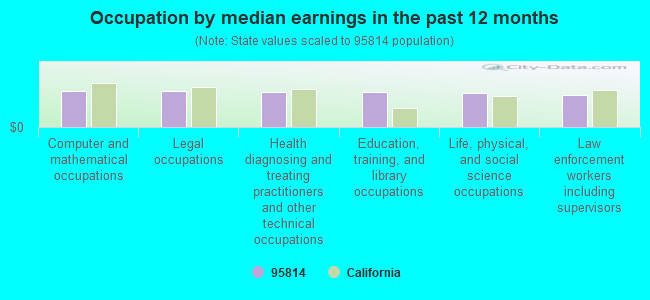
Occupation by median earnings in the past 12 months ($)
83,241Computer and mathematical occupations
81,292Legal occupations
80,353Health diagnosing and treating practitioners and other technical occupations
78,950Education, training, and library occupations
78,231Life, physical, and social science occupations
74,156Law enforcement workers including supervisors
Companies with biggest federal contracts located in this zip code (SACRAMENTO, CA):
ROHRER BROS INC (200 N 16TH ST; small business) : $16,751,146 in 685 contractsfrom 1999 to 2006
Contracts for Fruits and Vegetables, Non-Food Items For Resale, Food Services by Defense Logistics Agency, Defense Commissary Agency Signed by year:2000: $103,851; 2001: $426,190; 2002: $1,189,968; 2003: $401,062; 2004: $3,538,758; 2005: $7,332,891; 2006: $3,676,074.
Biggest contracts:
$112,622 with Defense Logistics Agency for Fruits and Vegetables. Signed on 2004-05-09. Completion date: 2004-05-09.
$100,763, same as above.Signed on 2004-11-04. Completion date: 2004-11-04.
$82,909 with Defense Commissary Agency for Non-Food Items For Resale. Signed on 2004-10-01. Completion date: 2005-09-30.
$79,381 with Defense Logistics Agency for Fruits and Vegetables. Signed on 2005-10-23. Completion date: 2005-10-23.
CRYSTAL CREAM& BUTTER CO (1013 D ST) : $2,494,120 in 7 contractsfrom 2004 to 2006
Contracts for Food Items For Resale by Defense Commissary Agency Signed by year:2000: $0; 2001: $0; 2002: $0; 2003: $0; 2004: $482,390; 2005: $1,509,927; 2006: $501,803.
Biggest contracts:
$552,271 with Defense Commissary Agency for Food Items For Resale. Signed on 2005-04-01. Completion date: 2005-08-31.
$501,803, same as above.Signed on 2006-01-01. Completion date: 2006-03-31.
$482,390, same as above.Signed on 2004-10-01. Completion date: 2005-02-28.
$359,367, same as above.Signed on 2005-10-01. Completion date: 2005-12-31.
KPMG PEAT MARWICK LLP (400 CAPITOL MALL 800) : $1,565,464 in 6 contractsfrom 1999 to 2000
Contracts for Modification of Equipment -- Automatic Data Processing Equipment (Including Firmware), Software, Supplies and Support Equipment, Maintenance, Repair and Rebuilding of Equipment -- Service and Trade Equipment by Air Force Signed by year:2000: $1,015,464; 2001: $0; 2002: $0; 2003: $0; 2004: $0; 2005: $0; 2006: $0.
Biggest contracts:
$433,157 with Air Force for Modification of Equipment -- Automatic Data Processing Equipment (Including Firmware), Software, Supplies and Support Equipment. Signed on 2000-01-03. Completion date: 2000-03-31.
$400,000, same as above.Signed on 1999-10-29. Completion date: 2000-06-30.
$326,715, same as above.Signed on 2000-03-14. Completion date: 2000-06-30.
$324,384, same as above.Signed on 2000-05-11. Completion date: 2000-09-30.
DAVID FORD CONSULTING ENGR (2015 J ST SUITE 200; small business) : $1,169,802 in 59 contractsfrom 2000 to 2006
Contracts for Other Environmental Services, Studies, and Analytical Support, Other Architect and Engineering Services, Other Professional Services, Programming Services, and moreby U.S. Army Corps of Engineers - civil program financing only, Army, Bureau of Reclamation, Geological Survey, and others Signed by year:2000: $264,074; 2001: $116,318; 2002: $171,014; 2003: $14,871; 2004: $92,478; 2005: $295,897; 2006: $215,150.
Biggest contracts:
$129,548 with U.S. Army Corps of Engineers - civil program financing only for Other Environmental Services, Studies, and Analytical Support. Taking place in NV. Signed on 2000-05-26. Completion date: 2000-12-18.
$95,800 with U.S. Army Corps of Engineers - civil program financing only for Other Architect and Engineering Services. Signed on 2000-09-12. Completion date: 2001-02-28.
$88,986 with Army for Other Professional Services. Signed on 2006-02-03. Completion date: 2006-04-30.
$74,358 with Army for Other Architect and Engineering Services. Signed on 2006-06-02. Completion date: 2006-11-29.
LIONAKIS-BEAUMONT DESIGN GROUP (1919 19TH ST)
$1,009,466 with Air Force for Nuclear Reactors. Signed on 2000-07-12. Completion date: 2000-11-19.
THE HLA GROUP, LANDSCAPE ARCHI (1990 THIRD STREET; small business) : $953,982 in 17 contractsfrom 2001 to 2006
Contracts for Other Architect and Engineering Services by U.S. Army Corps of Engineers - civil program financing only, Army Signed by year:2000: $0; 2001: $173,869; 2002: $0; 2003: $32,100; 2004: $622,598; 2005: $114,335; 2006: $11,080.
Biggest contracts:
$307,097 with U.S. Army Corps of Engineers - civil program financing only for Other Architect and Engineering Services. Signed on 2004-03-24. Completion date: 2005-04-28.
$307,097 with Army for Other Architect and Engineering Services. Signed on 2004-03-24. Completion date: 2005-04-28.
$140,387 with U.S. Army Corps of Engineers - civil program financing only for Other Architect and Engineering Services. Signed on 2001-07-26. Completion date: 2004-07-23.
$44,181 with Army for Other Architect and Engineering Services. Signed on 2005-12-20. Completion date: 2007-08-12.
FORTRESS GSA PROPS SACRAMENTO (1325 J STREET, SUITE 100) : $790,708 in 28 contractsfrom 2000 to 2005
Contracts for Maintenance, Repair and Rebuilding of Equipment -- Refrigeration, Air Conditioning, and Air Circulating Equipment, Maintenance, Repair and Rebuilding of Equipment -- Materials Handling Equipment, Custodial Janitorial Services, Maintenance, Repair and Rebuilding of Equipment -- Maintenance and Repair Shop Equipment, and moreby Public Buildings Service, Army, U.S. Army Corps of Engineers - civil program financing only Signed by year:2000: $30,000; 2001: $103,000; 2002: $238,349; 2003: $400,129; 2004: $13,430; 2005: $5,800; 2006: $0.
Biggest contracts:
$150,563 with Public Buildings Service for Maintenance, Repair and Rebuilding of Equipment -- Refrigeration, Air Conditioning, and Air Circulating Equipment. Taking place in PA. Signed on 2003-08-15. Completion date: 2003-09-15.
$53,000 with Public Buildings Service for Maintenance, Repair and Rebuilding of Equipment -- Materials Handling Equipment. Taking place in NJ. Signed on 2002-02-15. Completion date: 2002-02-15.
$52,681, same as above.Signed on 2003-05-15. Completion date: 2003-05-15.
$50,259, same as above.Signed on 2003-04-15. Completion date: 2003-04-15.
SECRETARY OF STATE (PRE-PAY ACCOUNT MANAGEMENT) : $523,355 in 12 contractsfrom 2003 to 2006
Contracts for Information Retrieval, Data Collection Services by Internal Revenue Service Signed by year:2000: $0; 2001: $0; 2002: $0; 2003: $36,667; 2004: $298,333; 2005: $178,355; 2006: $10,000.
Biggest contracts:
$150,000 with Internal Revenue Service for Information Retrieval. Signed on 2005-12-13. Effective on 2005-10-01. Completion date: 2006-09-30.
$129,000, same as above.Signed on 2004-12-20. Effective on 2004-11-21. Completion date: 2005-09-30.
$108,333, same as above.Signed on 2004-02-10. Effective on 2004-02-01. Completion date: 2004-09-30.
$25,000 with Internal Revenue Service for Data Collection Services. Signed on 2005-12-15. Effective on 2005-11-18. Completion date: 2006-09-30.
PAR ENVIRONMENTAL SERVICES, IN (1906 21ST ST; small business) : $416,928 in 7 contractsfrom 2002 to 2005
Contracts for Historical Studies, Other Professional Services, Cameras, Motion Picture, Archeological/Paleontological Studies, and moreby Army, Department of Veterans Affairs, Forest Service (disused code: now 12C2), Forest Service, and others Signed by year:2000: $0; 2001: $0; 2002: $30,000; 2003: $89,109; 2004: $104,076; 2005: $193,743; 2006: $0.
Biggest contracts:
$153,143 with Army for Historical Studies. Signed on 2005-09-19. Completion date: 2006-09-29.
$89,109 with Department of Veterans Affairs for Other Professional Services. Signed on 2003-05-15. Completion date: 2003-11-15.
$86,615 with Army for Other Professional Services. Signed on 2004-08-16. Completion date: 2005-08-18.
$39,000 with Army for Cameras, Motion Picture. Signed on 2005-09-26. Completion date: 2006-01-31.
CALIFORNIA SECRETARY OF STATE (1500 11TH STREET) : $295,160 in 5 contractsfrom 1999 to 2005
Contracts for Information Retrieval, Educational Services by Internal Revenue Service, Bureau of Prisoners/Federal Prison System Signed by year:2000: $0; 2001: $65,000; 2002: $150,000; 2003: $0; 2004: $0; 2005: $160; 2006: $0.
Biggest contracts:
$110,000 with Internal Revenue Service for Information Retrieval. Signed on 2002-10-15. Completion date: 2003-09-15.
$80,000, same as above.Signed on 1999-12-15. Completion date: 2000-09-15.
$65,000, same as above.Signed on 2001-10-15. Completion date: 2002-09-15.
$40,000, same as above.Signed on 2002-06-15. Completion date: 2002-09-15.
Top industries in this zip code by the number of employees in 2005:
2006 - 2018 National Fire Incident Reporting System (NFIRS) incidents
According to the data from the years 2006 - 2018 the average number of fire incidents per year is 169. The highest number of fires - 253 took place in 2018, and the least - 99 in 2010. The data has an increasing trend.
When looking into fire subcategories, the most incidents belonged to: Outside Fires (64.9%), and Structure Fires (22.0%).
Fire incident types reported to NFIRS in Zip Code 95814


 Nearest zip codes: 95811, 95818, 95816, 95833, 95605, 95817.


 According to the data from the years 2006 - 2018 the average number of fire incidents per year is 169. The highest number of fires - 253 took place in 2018, and the least - 99 in 2010. The data has an increasing trend.
 When looking into fire subcategories, the most incidents belonged to: Outside Fires (64.9%), and Structure Fires (22.0%).