Estimated zip code population in 2022: 14,392
Zip code population in 2010: 13,534
Zip code population in 2000: 14,963
Houses and condos: 6,968
Renter-occupied apartments: 4,032
% of renters here:
60%State:
44%
March 2022 cost of living index in zip code 95817: 103.5
(near average, U.S. average is 100)
Land area: 2.3
sq. mi.
Water area: 0.0
sq. mi.
Population density: 6,282 people per square mile (high).
OSM Map
General Map
Google Map
MSN Map
OSM Map
General Map
Google Map
MSN Map
OSM Map
General Map
Google Map
MSN Map
OSM Map
General Map
Google Map
MSN Map
Please wait while loading the map...
Real estate property taxes paid for housing units in 2022:
This zip code:
0.6% ($2,869)California:
0.7% ($4,831)
Median real estate property taxes paid for housing units with mortgages in 2022: $3,012 (0.6%)
Median real estate property taxes paid for housing units with no mortgage in 2022: $2,642 (0.5%)
Profiles of local businesses
Business Search - 14 Million verified businesses
Males: 6,669 Females: 7,723
For population 25 years and over in 95817:
High school or higher: 91.1%Bachelor's degree or higher: 48.9%Graduate or professional degree: 19.6%Unemployed: 7.0%Mean travel time to work (commute): 20.4 minutes
For population 15 years and over in 95817:
Never married: 50.3%Now married: 32.3%Separated: 2.7%Widowed: 4.4%Divorced: 10.3%
Zip code 95817 compared to state average:
Median household income below state average. Black race population percentage above state average. Foreign-born population percentage significantly below state average. House age above state average. 6,104 42.4% White 3,727 25.9% Hispanic or Latino 1,713 11.9% Black 1,454 10.1% Asian 1,012 7.0% Two or more races 154 1.1% Some other race 138 1.0% American Indian 85 0.6% Native Hawaiian and Other
Data:
Median household income ($)
Median household income (% change since 2000)
Household income diversity
Ratio of average income to average house value (%)
Ratio of average income to average rent
Median household income ($) - White
Median household income ($) - Black or African American
Median household income ($) - Asian
Median household income ($) - Hispanic or Latino
Median household income ($) - American Indian and Alaska Native
Median household income ($) - Multirace
Median household income ($) - Other Race
Median household income for houses/condos with a mortgage ($)
Median household income for apartments without a mortgage ($)
Races - White alone (%)
Races - White alone (% change since 2000)
Races - Black alone (%)
Races - Black alone (% change since 2000)
Races - American Indian alone (%)
Races - American Indian alone (% change since 2000)
Races - Asian alone (%)
Races - Asian alone (% change since 2000)
Races - Hispanic (%)
Races - Hispanic (% change since 2000)
Races - Native Hawaiian and Other Pacific Islander alone (%)
Races - Native Hawaiian and Other Pacific Islander alone (% change since 2000)
Races - Two or more races (%)
Races - Two or more races (% change since 2000)
Races - Other race alone (%)
Races - Other race alone (% change since 2000)
Racial diversity
Unemployment (%)
Unemployment (% change since 2000)
Unemployment (%) - White
Unemployment (%) - Black or African American
Unemployment (%) - Asian
Unemployment (%) - Hispanic or Latino
Unemployment (%) - American Indian and Alaska Native
Unemployment (%) - Multirace
Unemployment (%) - Other Race
Population density (people per square mile)
Population - Males (%)
Population - Females (%)
Population - Males (%) - White
Population - Males (%) - Black or African American
Population - Males (%) - Asian
Population - Males (%) - Hispanic or Latino
Population - Males (%) - American Indian and Alaska Native
Population - Males (%) - Multirace
Population - Males (%) - Other Race
Population - Females (%) - White
Population - Females (%) - Black or African American
Population - Females (%) - Asian
Population - Females (%) - Hispanic or Latino
Population - Females (%) - American Indian and Alaska Native
Population - Females (%) - Multirace
Population - Females (%) - Other Race
Coronavirus confirmed cases (Apr 27, 2024)
Deaths caused by coronavirus (Apr 27, 2024)
Coronavirus confirmed cases (per 100k population) (Apr 27, 2024)
Deaths caused by coronavirus (per 100k population) (Apr 27, 2024)
Daily increase in number of cases (Apr 27, 2024)
Weekly increase in number of cases (Apr 27, 2024)
Cases doubled (in days) (Apr 27, 2024)
Hospitalized patients (Apr 18, 2022)
Negative test results (Apr 18, 2022)
Total test results (Apr 18, 2022)
COVID Vaccine doses distributed (per 100k population) (Sep 19, 2023)
COVID Vaccine doses administered (per 100k population) (Sep 19, 2023)
COVID Vaccine doses distributed (Sep 19, 2023)
COVID Vaccine doses administered (Sep 19, 2023)
Likely homosexual households (%)
Likely homosexual households (% change since 2000)
Likely homosexual households - Lesbian couples (%)
Likely homosexual households - Lesbian couples (% change since 2000)
Likely homosexual households - Gay men (%)
Likely homosexual households - Gay men (% change since 2000)
Cost of living index
Median gross rent ($)
Median contract rent ($)
Median monthly housing costs ($)
Median house or condo value ($)
Median house or condo value ($ change since 2000)
Mean house or condo value by units in structure - 1, detached ($)
Mean house or condo value by units in structure - 1, attached ($)
Mean house or condo value by units in structure - 2 ($)
Mean house or condo value by units in structure by units in structure - 3 or 4 ($)
Mean house or condo value by units in structure - 5 or more ($)
Mean house or condo value by units in structure - Boat, RV, van, etc. ($)
Mean house or condo value by units in structure - Mobile home ($)
Median house or condo value ($) - White
Median house or condo value ($) - Black or African American
Median house or condo value ($) - Asian
Median house or condo value ($) - Hispanic or Latino
Median house or condo value ($) - American Indian and Alaska Native
Median house or condo value ($) - Multirace
Median house or condo value ($) - Other Race
Median resident age
Resident age diversity
Median resident age - Males
Median resident age - Females
Median resident age - White
Median resident age - Black or African American
Median resident age - Asian
Median resident age - Hispanic or Latino
Median resident age - American Indian and Alaska Native
Median resident age - Multirace
Median resident age - Other Race
Median resident age - Males - White
Median resident age - Males - Black or African American
Median resident age - Males - Asian
Median resident age - Males - Hispanic or Latino
Median resident age - Males - American Indian and Alaska Native
Median resident age - Males - Multirace
Median resident age - Males - Other Race
Median resident age - Females - White
Median resident age - Females - Black or African American
Median resident age - Females - Asian
Median resident age - Females - Hispanic or Latino
Median resident age - Females - American Indian and Alaska Native
Median resident age - Females - Multirace
Median resident age - Females - Other Race
Commute - mean travel time to work (minutes)
Travel time to work - Less than 5 minutes (%)
Travel time to work - Less than 5 minutes (% change since 2000)
Travel time to work - 5 to 9 minutes (%)
Travel time to work - 5 to 9 minutes (% change since 2000)
Travel time to work - 10 to 19 minutes (%)
Travel time to work - 10 to 19 minutes (% change since 2000)
Travel time to work - 20 to 29 minutes (%)
Travel time to work - 20 to 29 minutes (% change since 2000)
Travel time to work - 30 to 39 minutes (%)
Travel time to work - 30 to 39 minutes (% change since 2000)
Travel time to work - 40 to 59 minutes (%)
Travel time to work - 40 to 59 minutes (% change since 2000)
Travel time to work - 60 to 89 minutes (%)
Travel time to work - 60 to 89 minutes (% change since 2000)
Travel time to work - 90 or more minutes (%)
Travel time to work - 90 or more minutes (% change since 2000)
Marital status - Never married (%)
Marital status - Now married (%)
Marital status - Separated (%)
Marital status - Widowed (%)
Marital status - Divorced (%)
Median family income ($)
Median family income (% change since 2000)
Median non-family income ($)
Median non-family income (% change since 2000)
Median per capita income ($)
Median per capita income (% change since 2000)
Median family income ($) - White
Median family income ($) - Black or African American
Median family income ($) - Asian
Median family income ($) - Hispanic or Latino
Median family income ($) - American Indian and Alaska Native
Median family income ($) - Multirace
Median family income ($) - Other Race
Median year house/condo built
Median year apartment built
Year house built - Built 2005 or later (%)
Year house built - Built 2000 to 2004 (%)
Year house built - Built 1990 to 1999 (%)
Year house built - Built 1980 to 1989 (%)
Year house built - Built 1970 to 1979 (%)
Year house built - Built 1960 to 1969 (%)
Year house built - Built 1950 to 1959 (%)
Year house built - Built 1940 to 1949 (%)
Year house built - Built 1939 or earlier (%)
Average household size
Household density (households per square mile)
Average household size - White
Average household size - Black or African American
Average household size - Asian
Average household size - Hispanic or Latino
Average household size - American Indian and Alaska Native
Average household size - Multirace
Average household size - Other Race
Occupied housing units (%)
Vacant housing units (%)
Owner occupied housing units (%)
Renter occupied housing units (%)
Vacancy status - For rent (%)
Vacancy status - For sale only (%)
Vacancy status - Rented or sold, not occupied (%)
Vacancy status - For seasonal, recreational, or occasional use (%)
Vacancy status - For migrant workers (%)
Vacancy status - Other vacant (%)
Residents with income below the poverty level (%)
Residents with income below 50% of the poverty level (%)
Children below poverty level (%)
Poor families by family type - Married-couple family (%)
Poor families by family type - Male, no wife present (%)
Poor families by family type - Female, no husband present (%)
Poverty status for native-born residents (%)
Poverty status for foreign-born residents (%)
Poverty among high school graduates not in families (%)
Poverty among people who did not graduate high school not in families (%)
Residents with income below the poverty level (%) - White
Residents with income below the poverty level (%) - Black or African American
Residents with income below the poverty level (%) - Asian
Residents with income below the poverty level (%) - Hispanic or Latino
Residents with income below the poverty level (%) - American Indian and Alaska Native
Residents with income below the poverty level (%) - Multirace
Residents with income below the poverty level (%) - Other Race
Air pollution - Air Quality Index (AQI)
Air pollution - CO
Air pollution - NO2
Air pollution - SO2
Air pollution - Ozone
Air pollution - PM10
Air pollution - PM25
Air pollution - Pb
Crime - Murders per 100,000 population
Crime - Rapes per 100,000 population
Crime - Robberies per 100,000 population
Crime - Assaults per 100,000 population
Crime - Burglaries per 100,000 population
Crime - Thefts per 100,000 population
Crime - Auto thefts per 100,000 population
Crime - Arson per 100,000 population
Crime - City-data.com crime index
Crime - Violent crime index
Crime - Property crime index
Crime - Murders per 100,000 population (5 year average)
Crime - Rapes per 100,000 population (5 year average)
Crime - Robberies per 100,000 population (5 year average)
Crime - Assaults per 100,000 population (5 year average)
Crime - Burglaries per 100,000 population (5 year average)
Crime - Thefts per 100,000 population (5 year average)
Crime - Auto thefts per 100,000 population (5 year average)
Crime - Arson per 100,000 population (5 year average)
Crime - City-data.com crime index (5 year average)
Crime - Violent crime index (5 year average)
Crime - Property crime index (5 year average)
1996 Presidential Elections Results (%) - Democratic Party (Clinton)
1996 Presidential Elections Results (%) - Republican Party (Dole)
1996 Presidential Elections Results (%) - Other
2000 Presidential Elections Results (%) - Democratic Party (Gore)
2000 Presidential Elections Results (%) - Republican Party (Bush)
2000 Presidential Elections Results (%) - Other
2004 Presidential Elections Results (%) - Democratic Party (Kerry)
2004 Presidential Elections Results (%) - Republican Party (Bush)
2004 Presidential Elections Results (%) - Other
2008 Presidential Elections Results (%) - Democratic Party (Obama)
2008 Presidential Elections Results (%) - Republican Party (McCain)
2008 Presidential Elections Results (%) - Other
2012 Presidential Elections Results (%) - Democratic Party (Obama)
2012 Presidential Elections Results (%) - Republican Party (Romney)
2012 Presidential Elections Results (%) - Other
2016 Presidential Elections Results (%) - Democratic Party (Clinton)
2016 Presidential Elections Results (%) - Republican Party (Trump)
2016 Presidential Elections Results (%) - Other
2020 Presidential Elections Results (%) - Democratic Party (Biden)
2020 Presidential Elections Results (%) - Republican Party (Trump)
2020 Presidential Elections Results (%) - Other
Ancestries Reported - Arab (%)
Ancestries Reported - Czech (%)
Ancestries Reported - Danish (%)
Ancestries Reported - Dutch (%)
Ancestries Reported - English (%)
Ancestries Reported - French (%)
Ancestries Reported - French Canadian (%)
Ancestries Reported - German (%)
Ancestries Reported - Greek (%)
Ancestries Reported - Hungarian (%)
Ancestries Reported - Irish (%)
Ancestries Reported - Italian (%)
Ancestries Reported - Lithuanian (%)
Ancestries Reported - Norwegian (%)
Ancestries Reported - Polish (%)
Ancestries Reported - Portuguese (%)
Ancestries Reported - Russian (%)
Ancestries Reported - Scotch-Irish (%)
Ancestries Reported - Scottish (%)
Ancestries Reported - Slovak (%)
Ancestries Reported - Subsaharan African (%)
Ancestries Reported - Swedish (%)
Ancestries Reported - Swiss (%)
Ancestries Reported - Ukrainian (%)
Ancestries Reported - United States (%)
Ancestries Reported - Welsh (%)
Ancestries Reported - West Indian (%)
Ancestries Reported - Other (%)
Educational Attainment - No schooling completed (%)
Educational Attainment - Less than high school (%)
Educational Attainment - High school or equivalent (%)
Educational Attainment - Less than 1 year of college (%)
Educational Attainment - 1 or more years of college (%)
Educational Attainment - Associate degree (%)
Educational Attainment - Bachelor's degree (%)
Educational Attainment - Master's degree (%)
Educational Attainment - Professional school degree (%)
Educational Attainment - Doctorate degree (%)
School Enrollment - Nursery, preschool (%)
School Enrollment - Kindergarten (%)
School Enrollment - Grade 1 to 4 (%)
School Enrollment - Grade 5 to 8 (%)
School Enrollment - Grade 9 to 12 (%)
School Enrollment - College undergrad (%)
School Enrollment - Graduate or professional (%)
School Enrollment - Not enrolled in school (%)
School enrollment - Public schools (%)
School enrollment - Private schools (%)
School enrollment - Not enrolled (%)
Median number of rooms in houses and condos
Median number of rooms in apartments
Housing units lacking complete plumbing facilities (%)
Housing units lacking complete kitchen facilities (%)
Density of houses
Urban houses (%)
Rural houses (%)
Households with people 60 years and over (%)
Households with people 65 years and over (%)
Households with people 75 years and over (%)
Households with one or more nonrelatives (%)
Households with no nonrelatives (%)
Population in households (%)
Family households (%)
Nonfamily households (%)
Population in families (%)
Family households with own children (%)
Median number of bedrooms in owner occupied houses
Mean number of bedrooms in owner occupied houses
Median number of bedrooms in renter occupied houses
Mean number of bedrooms in renter occupied houses
Median number of vehichles in owner occupied houses
Mean number of vehichles in owner occupied houses
Median number of vehichles in renter occupied houses
Mean number of vehichles in renter occupied houses
Mortgage status - with mortgage (%)
Mortgage status - with second mortgage (%)
Mortgage status - with home equity loan (%)
Mortgage status - with both second mortgage and home equity loan (%)
Mortgage status - without a mortgage (%)
Average family size
Average family size - White
Average family size - Black or African American
Average family size - Asian
Average family size - Hispanic or Latino
Average family size - American Indian and Alaska Native
Average family size - Multirace
Average family size - Other Race
Geographical mobility - Same house 1 year ago (%)
Geographical mobility - Moved within same county (%)
Geographical mobility - Moved from different county within same state (%)
Geographical mobility - Moved from different state (%)
Geographical mobility - Moved from abroad (%)
Place of birth - Born in state of residence (%)
Place of birth - Born in other state (%)
Place of birth - Native, outside of US (%)
Place of birth - Foreign born (%)
Housing units in structures - 1, detached (%)
Housing units in structures - 1, attached (%)
Housing units in structures - 2 (%)
Housing units in structures - 3 or 4 (%)
Housing units in structures - 5 to 9 (%)
Housing units in structures - 10 to 19 (%)
Housing units in structures - 20 to 49 (%)
Housing units in structures - 50 or more (%)
Housing units in structures - Mobile home (%)
Housing units in structures - Boat, RV, van, etc. (%)
House/condo owner moved in on average (years ago)
Renter moved in on average (years ago)
Year householder moved into unit - Moved in 1999 to March 2000 (%)
Year householder moved into unit - Moved in 1995 to 1998 (%)
Year householder moved into unit - Moved in 1990 to 1994 (%)
Year householder moved into unit - Moved in 1980 to 1989 (%)
Year householder moved into unit - Moved in 1970 to 1979 (%)
Year householder moved into unit - Moved in 1969 or earlier (%)
Means of transportation to work - Drove car alone (%)
Means of transportation to work - Carpooled (%)
Means of transportation to work - Public transportation (%)
Means of transportation to work - Bus or trolley bus (%)
Means of transportation to work - Streetcar or trolley car (%)
Means of transportation to work - Subway or elevated (%)
Means of transportation to work - Railroad (%)
Means of transportation to work - Ferryboat (%)
Means of transportation to work - Taxicab (%)
Means of transportation to work - Motorcycle (%)
Means of transportation to work - Bicycle (%)
Means of transportation to work - Walked (%)
Means of transportation to work - Other means (%)
Working at home (%)
Industry diversity
Most Common Industries - Agriculture, forestry, fishing and hunting, and mining (%)
Most Common Industries - Agriculture, forestry, fishing and hunting (%)
Most Common Industries - Mining, quarrying, and oil and gas extraction (%)
Most Common Industries - Construction (%)
Most Common Industries - Manufacturing (%)
Most Common Industries - Wholesale trade (%)
Most Common Industries - Retail trade (%)
Most Common Industries - Transportation and warehousing, and utilities (%)
Most Common Industries - Transportation and warehousing (%)
Most Common Industries - Utilities (%)
Most Common Industries - Information (%)
Most Common Industries - Finance and insurance, and real estate and rental and leasing (%)
Most Common Industries - Finance and insurance (%)
Most Common Industries - Real estate and rental and leasing (%)
Most Common Industries - Professional, scientific, and management, and administrative and waste management services (%)
Most Common Industries - Professional, scientific, and technical services (%)
Most Common Industries - Management of companies and enterprises (%)
Most Common Industries - Administrative and support and waste management services (%)
Most Common Industries - Educational services, and health care and social assistance (%)
Most Common Industries - Educational services (%)
Most Common Industries - Health care and social assistance (%)
Most Common Industries - Arts, entertainment, and recreation, and accommodation and food services (%)
Most Common Industries - Arts, entertainment, and recreation (%)
Most Common Industries - Accommodation and food services (%)
Most Common Industries - Other services, except public administration (%)
Most Common Industries - Public administration (%)
Occupation diversity
Most Common Occupations - Management, business, science, and arts occupations (%)
Most Common Occupations - Management, business, and financial occupations (%)
Most Common Occupations - Management occupations (%)
Most Common Occupations - Business and financial operations occupations (%)
Most Common Occupations - Computer, engineering, and science occupations (%)
Most Common Occupations - Computer and mathematical occupations (%)
Most Common Occupations - Architecture and engineering occupations (%)
Most Common Occupations - Life, physical, and social science occupations (%)
Most Common Occupations - Education, legal, community service, arts, and media occupations (%)
Most Common Occupations - Community and social service occupations (%)
Most Common Occupations - Legal occupations (%)
Most Common Occupations - Education, training, and library occupations (%)
Most Common Occupations - Arts, design, entertainment, sports, and media occupations (%)
Most Common Occupations - Healthcare practitioners and technical occupations (%)
Most Common Occupations - Health diagnosing and treating practitioners and other technical occupations (%)
Most Common Occupations - Health technologists and technicians (%)
Most Common Occupations - Service occupations (%)
Most Common Occupations - Healthcare support occupations (%)
Most Common Occupations - Protective service occupations (%)
Most Common Occupations - Fire fighting and prevention, and other protective service workers including supervisors (%)
Most Common Occupations - Law enforcement workers including supervisors (%)
Most Common Occupations - Food preparation and serving related occupations (%)
Most Common Occupations - Building and grounds cleaning and maintenance occupations (%)
Most Common Occupations - Personal care and service occupations (%)
Most Common Occupations - Sales and office occupations (%)
Most Common Occupations - Sales and related occupations (%)
Most Common Occupations - Office and administrative support occupations (%)
Most Common Occupations - Natural resources, construction, and maintenance occupations (%)
Most Common Occupations - Farming, fishing, and forestry occupations (%)
Most Common Occupations - Construction and extraction occupations (%)
Most Common Occupations - Installation, maintenance, and repair occupations (%)
Most Common Occupations - Production, transportation, and material moving occupations (%)
Most Common Occupations - Production occupations (%)
Most Common Occupations - Transportation occupations (%)
Most Common Occupations - Material moving occupations (%)
People in Group quarters - Institutionalized population (%)
People in Group quarters - Correctional institutions (%)
People in Group quarters - Federal prisons and detention centers (%)
People in Group quarters - Halfway houses (%)
People in Group quarters - Local jails and other confinement facilities (including police lockups) (%)
People in Group quarters - Military disciplinary barracks (%)
People in Group quarters - State prisons (%)
People in Group quarters - Other types of correctional institutions (%)
People in Group quarters - Nursing homes (%)
People in Group quarters - Hospitals/wards, hospices, and schools for the handicapped (%)
People in Group quarters - Hospitals/wards and hospices for chronically ill (%)
People in Group quarters - Hospices or homes for chronically ill (%)
People in Group quarters - Military hospitals or wards for chronically ill (%)
People in Group quarters - Other hospitals or wards for chronically ill (%)
People in Group quarters - Hospitals or wards for drug/alcohol abuse (%)
People in Group quarters - Mental (Psychiatric) hospitals or wards (%)
People in Group quarters - Schools, hospitals, or wards for the mentally retarded (%)
People in Group quarters - Schools, hospitals, or wards for the physically handicapped (%)
People in Group quarters - Institutions for the deaf (%)
People in Group quarters - Institutions for the blind (%)
People in Group quarters - Orthopedic wards and institutions for the physically handicapped (%)
People in Group quarters - Wards in general hospitals for patients who have no usual home elsewhere (%)
People in Group quarters - Wards in military hospitals for patients who have no usual home elsewhere (%)
People in Group quarters - Juvenile institutions (%)
People in Group quarters - Long-term care (%)
People in Group quarters - Homes for abused, dependent, and neglected children (%)
People in Group quarters - Residential treatment centers for emotionally disturbed children (%)
People in Group quarters - Training schools for juvenile delinquents (%)
People in Group quarters - Short-term care, detention or diagnostic centers for delinquent children (%)
People in Group quarters - Type of juvenile institution unknown (%)
People in Group quarters - Noninstitutionalized population (%)
People in Group quarters - College dormitories (includes college quarters off campus) (%)
People in Group quarters - Military quarters (%)
People in Group quarters - On base (%)
People in Group quarters - Barracks, unaccompanied personnel housing (UPH), (Enlisted/Officer), ;and similar group living quarters for military personnel (%)
People in Group quarters - Transient quarters for temporary residents (%)
People in Group quarters - Military ships (%)
People in Group quarters - Group homes (%)
People in Group quarters - Homes or halfway houses for drug/alcohol abuse (%)
People in Group quarters - Homes for the mentally ill (%)
People in Group quarters - Homes for the mentally retarded (%)
People in Group quarters - Homes for the physically handicapped (%)
People in Group quarters - Other group homes (%)
People in Group quarters - Religious group quarters (%)
People in Group quarters - Dormitories (%)
People in Group quarters - Agriculture workers' dormitories on farms (%)
People in Group quarters - Job Corps and vocational training facilities (%)
People in Group quarters - Other workers' dormitories (%)
People in Group quarters - Crews of maritime vessels (%)
People in Group quarters - Other nonhousehold living situations (%)
People in Group quarters - Other noninstitutional group quarters (%)
Residents speaking English at home (%)
Residents speaking English at home - Born in the United States (%)
Residents speaking English at home - Native, born elsewhere (%)
Residents speaking English at home - Foreign born (%)
Residents speaking Spanish at home (%)
Residents speaking Spanish at home - Born in the United States (%)
Residents speaking Spanish at home - Native, born elsewhere (%)
Residents speaking Spanish at home - Foreign born (%)
Residents speaking other language at home (%)
Residents speaking other language at home - Born in the United States (%)
Residents speaking other language at home - Native, born elsewhere (%)
Residents speaking other language at home - Foreign born (%)
Class of Workers - Employee of private company (%)
Class of Workers - Self-employed in own incorporated business (%)
Class of Workers - Private not-for-profit wage and salary workers (%)
Class of Workers - Local government workers (%)
Class of Workers - State government workers (%)
Class of Workers - Federal government workers (%)
Class of Workers - Self-employed workers in own not incorporated business and Unpaid family workers (%)
House heating fuel used in houses and condos - Utility gas (%)
House heating fuel used in houses and condos - Bottled, tank, or LP gas (%)
House heating fuel used in houses and condos - Electricity (%)
House heating fuel used in houses and condos - Fuel oil, kerosene, etc. (%)
House heating fuel used in houses and condos - Coal or coke (%)
House heating fuel used in houses and condos - Wood (%)
House heating fuel used in houses and condos - Solar energy (%)
House heating fuel used in houses and condos - Other fuel (%)
House heating fuel used in houses and condos - No fuel used (%)
House heating fuel used in apartments - Utility gas (%)
House heating fuel used in apartments - Bottled, tank, or LP gas (%)
House heating fuel used in apartments - Electricity (%)
House heating fuel used in apartments - Fuel oil, kerosene, etc. (%)
House heating fuel used in apartments - Coal or coke (%)
House heating fuel used in apartments - Wood (%)
House heating fuel used in apartments - Solar energy (%)
House heating fuel used in apartments - Other fuel (%)
House heating fuel used in apartments - No fuel used (%)
Armed forces status - In Armed Forces (%)
Armed forces status - Civilian (%)
Armed forces status - Civilian - Veteran (%)
Armed forces status - Civilian - Nonveteran (%)
Fatal accidents locations in years 2005-2021
Fatal accidents locations in 2005
Fatal accidents locations in 2006
Fatal accidents locations in 2007
Fatal accidents locations in 2008
Fatal accidents locations in 2009
Fatal accidents locations in 2010
Fatal accidents locations in 2011
Fatal accidents locations in 2012
Fatal accidents locations in 2013
Fatal accidents locations in 2014
Fatal accidents locations in 2015
Fatal accidents locations in 2016
Fatal accidents locations in 2017
Fatal accidents locations in 2018
Fatal accidents locations in 2019
Fatal accidents locations in 2020
Fatal accidents locations in 2021
Alcohol use - People drinking some alcohol every month (%)
Alcohol use - People not drinking at all (%)
Alcohol use - Average days/month drinking alcohol
Alcohol use - Average drinks/week
Alcohol use - Average days/year people drink much
Audiometry - Average condition of hearing (%)
Audiometry - People that can hear a whisper from across a quiet room (%)
Audiometry - People that can hear normal voice from across a quiet room (%)
Audiometry - Ears ringing, roaring, buzzing (%)
Audiometry - Had a job exposure to loud noise (%)
Audiometry - Had off-work exposure to loud noise (%)
Blood Pressure & Cholesterol - Has high blood pressure (%)
Blood Pressure & Cholesterol - Checking blood pressure at home (%)
Blood Pressure & Cholesterol - Frequently checking blood cholesterol (%)
Blood Pressure & Cholesterol - Has high cholesterol level (%)
Consumer Behavior - Money monthly spent on food at supermarket/grocery store
Consumer Behavior - Money monthly spent on food at other stores
Consumer Behavior - Money monthly spent on eating out
Consumer Behavior - Money monthly spent on carryout/delivered foods
Consumer Behavior - Income spent on food at supermarket/grocery store (%)
Consumer Behavior - Income spent on food at other stores (%)
Consumer Behavior - Income spent on eating out (%)
Consumer Behavior - Income spent on carryout/delivered foods (%)
Current Health Status - General health condition (%)
Current Health Status - Blood donors (%)
Current Health Status - Has blood ever tested for HIV virus (%)
Current Health Status - Left-handed people (%)
Dermatology - People using sunscreen (%)
Diabetes - Diabetics (%)
Diabetes - Had a blood test for high blood sugar (%)
Diabetes - People taking insulin (%)
Diet Behavior & Nutrition - Diet health (%)
Diet Behavior & Nutrition - Milk product consumption (# of products/month)
Diet Behavior & Nutrition - Meals not home prepared (#/week)
Diet Behavior & Nutrition - Meals from fast food or pizza place (#/week)
Diet Behavior & Nutrition - Ready-to-eat foods (#/month)
Diet Behavior & Nutrition - Frozen meals/pizza (#/month)
Drug Use - People that ever used marijuana or hashish (%)
Drug Use - Ever used hard drugs (%)
Drug Use - Ever used any form of cocaine (%)
Drug Use - Ever used heroin (%)
Drug Use - Ever used methamphetamine (%)
Health Insurance - People covered by health insurance (%)
Kidney Conditions-Urology - Avg. # of times urinating at night
Medical Conditions - People with asthma (%)
Medical Conditions - People with anemia (%)
Medical Conditions - People with psoriasis (%)
Medical Conditions - People with overweight (%)
Medical Conditions - Elderly people having difficulties in thinking or remembering (%)
Medical Conditions - People who ever received blood transfusion (%)
Medical Conditions - People having trouble seeing even with glass/contacts (%)
Medical Conditions - People with arthritis (%)
Medical Conditions - People with gout (%)
Medical Conditions - People with congestive heart failure (%)
Medical Conditions - People with coronary heart disease (%)
Medical Conditions - People with angina pectoris (%)
Medical Conditions - People who ever had heart attack (%)
Medical Conditions - People who ever had stroke (%)
Medical Conditions - People with emphysema (%)
Medical Conditions - People with thyroid problem (%)
Medical Conditions - People with chronic bronchitis (%)
Medical Conditions - People with any liver condition (%)
Medical Conditions - People who ever had cancer or malignancy (%)
Mental Health - People who have little interest in doing things (%)
Mental Health - People feeling down, depressed, or hopeless (%)
Mental Health - People who have trouble sleeping or sleeping too much (%)
Mental Health - People feeling tired or having little energy (%)
Mental Health - People with poor appetite or overeating (%)
Mental Health - People feeling bad about themself (%)
Mental Health - People who have trouble concentrating on things (%)
Mental Health - People moving or speaking slowly or too fast (%)
Mental Health - People having thoughts they would be better off dead (%)
Oral Health - Average years since last visit a dentist
Oral Health - People embarrassed because of mouth (%)
Oral Health - People with gum disease (%)
Oral Health - General health of teeth and gums (%)
Oral Health - Average days a week using dental floss/device
Oral Health - Average days a week using mouthwash for dental problem
Oral Health - Average number of teeth
Pesticide Use - Households using pesticides to control insects (%)
Pesticide Use - Households using pesticides to kill weeds (%)
Physical Activity - People doing vigorous-intensity work activities (%)
Physical Activity - People doing moderate-intensity work activities (%)
Physical Activity - People walking or bicycling (%)
Physical Activity - People doing vigorous-intensity recreational activities (%)
Physical Activity - People doing moderate-intensity recreational activities (%)
Physical Activity - Average hours a day doing sedentary activities
Physical Activity - Average hours a day watching TV or videos
Physical Activity - Average hours a day using computer
Physical Functioning - People having limitations keeping them from working (%)
Physical Functioning - People limited in amount of work they can do (%)
Physical Functioning - People that need special equipment to walk (%)
Physical Functioning - People experiencing confusion/memory problems (%)
Physical Functioning - People requiring special healthcare equipment (%)
Prescription Medications - Average number of prescription medicines taking
Preventive Aspirin Use - Adults 40+ taking low-dose aspirin (%)
Reproductive Health - Vaginal deliveries (%)
Reproductive Health - Cesarean deliveries (%)
Reproductive Health - Deliveries resulted in a live birth (%)
Reproductive Health - Pregnancies resulted in a delivery (%)
Reproductive Health - Women breastfeeding newborns (%)
Reproductive Health - Women that had a hysterectomy (%)
Reproductive Health - Women that had both ovaries removed (%)
Reproductive Health - Women that have ever taken birth control pills (%)
Reproductive Health - Women taking birth control pills (%)
Reproductive Health - Women that have ever used Depo-Provera or injectables (%)
Reproductive Health - Women that have ever used female hormones (%)
Sexual Behavior - People 18+ that ever had sex (vaginal, anal, or oral) (%)
Sexual Behavior - Males 18+ that ever had vaginal sex with a woman (%)
Sexual Behavior - Males 18+ that ever performed oral sex on a woman (%)
Sexual Behavior - Males 18+ that ever had anal sex with a woman (%)
Sexual Behavior - Males 18+ that ever had any sex with a man (%)
Sexual Behavior - Females 18+ that ever had vaginal sex with a man (%)
Sexual Behavior - Females 18+ that ever performed oral sex on a man (%)
Sexual Behavior - Females 18+ that ever had anal sex with a man (%)
Sexual Behavior - Females 18+ that ever had any kind of sex with a woman (%)
Sexual Behavior - Average age people first had sex
Sexual Behavior - Average number of female sex partners in lifetime (males 18+)
Sexual Behavior - Average number of female vaginal sex partners in lifetime (males 18+)
Sexual Behavior - Average age people first performed oral sex on a woman (18+)
Sexual Behavior - Average number of woman performed oral sex on in lifetime (18+)
Sexual Behavior - Average number of male sex partners in lifetime (males 18+)
Sexual Behavior - Average number of male anal sex partners in lifetime (males 18+)
Sexual Behavior - Average age people first performed oral sex on a man (18+)
Sexual Behavior - Average number of male oral sex partners in lifetime (18+)
Sexual Behavior - People using protection when performing oral sex (%)
Sexual Behavior - Average number of times people have vaginal or anal sex a year
Sexual Behavior - People having sex without condom (%)
Sexual Behavior - Average number of male sex partners in lifetime (females 18+)
Sexual Behavior - Average number of male vaginal sex partners in lifetime (females 18+)
Sexual Behavior - Average number of female sex partners in lifetime (females 18+)
Sexual Behavior - Circumcised males 18+ (%)
Sleep Disorders - Average hours sleeping at night
Sleep Disorders - People that has trouble sleeping (%)
Smoking-Cigarette Use - People smoking cigarettes (%)
Taste & Smell - People 40+ having problems with smell (%)
Taste & Smell - People 40+ having problems with taste (%)
Taste & Smell - People 40+ that ever had wisdom teeth removed (%)
Taste & Smell - People 40+ that ever had tonsils teeth removed (%)
Taste & Smell - People 40+ that ever had a loss of consciousness because of a head injury (%)
Taste & Smell - People 40+ that ever had a broken nose or other serious injury to face or skull (%)
Taste & Smell - People 40+ that ever had two or more sinus infections (%)
Weight - Average height (inches)
Weight - Average weight (pounds)
Weight - Average BMI
Weight - People that are obese (%)
Weight - People that ever were obese (%)
Weight - People trying to lose weight (%)
100%
urban population.
Estimated median house/condo value in 2022: $494,387
95817:
$494,387California:
$715,900
Median resident age: This zip code:
34.3 yearsCalifornia median age:
37.9 years
Average household size: This zip code:
2.1 peopleCalifornia:
2.8 people
Averages for the 2020 tax year for zip code 95817, filed in 2021:
Average Adjusted Gross Income (AGI) in 2020: $62,437 (Individual Income Tax Returns) Here:
$62,437State:
$95,910
Salary/wage: $58,803 (reported on 84.8% of returns )Here:
$58,803State:
$77,331
(% of AGI for various income ranges: 1210.2% for AGIs below $25k , 4077.0% for AGIs $25k-50k , 7491.0% for AGIs $50k-75k , 10742.1% for AGIs $75k-100k , 20145.3% for AGIs $100k-200k , 73408.6% for AGIs over 200k ) Taxable interest for individuals: $495 (reported on 32.2% of returns )This zip code:
$495California:
$2,294
(% of AGI for various income ranges: 5.6% for AGIs below $25k , 8.2% for AGIs $25k-50k , 19.4% for AGIs $50k-75k , 34.5% for AGIs $75k-100k , 65.6% for AGIs $100k-200k , 332.9% for AGIs over 200k ) Ordinary dividends: $2,481 (reported on 14.0% of returns )(% of AGI for various income ranges: 4.7% for AGIs below $25k , 18.4% for AGIs $25k-50k , 49.1% for AGIs $50k-75k , 76.4% for AGIs $75k-100k , 139.5% for AGIs $100k-200k , 797.1% for AGIs over 200k ) Net capital gain/loss in AGI: +$7,218 (reported on 14.0% of returns )Here:
+$7,218State:
+$49,306
(% of AGI for various income ranges: 0.1% for AGIs below $25k , 23.0% for AGIs $25k-50k , 48.4% for AGIs $50k-75k , 110.6% for AGIs $75k-100k , 332.9% for AGIs $100k-200k , 5557.1% for AGIs over 200k ) Profit/loss from business: +$8,450 (reported on 15.3% of returns )Here:
+$8,450State:
+$15,671
(% of AGI for various income ranges: 130.2% for AGIs below $25k , 109.6% for AGIs $25k-50k , 143.8% for AGIs $50k-75k , 165.3% for AGIs $75k-100k , 452.4% for AGIs $100k-200k , 1775.7% for AGIs over 200k ) Taxable individual retirement arrangement distribution: $11,875 (reported on 4.1% of returns )95817:
$11,875California:
$23,505
(% of AGI for various income ranges: 18.8% for AGIs below $25k , 27.5% for AGIs $25k-50k , 78.3% for AGIs $50k-75k , 98.1% for AGIs $75k-100k , 242.2% for AGIs $100k-200k , 410.0% for AGIs over 200k ) Self-employed (Keogh) retirement plans: $16,567 (reported on 0.4% of returns )95817:
$16,567California:
$30,163
(% of AGI for various income ranges: 90.4% for AGIs $100k-200k ) Total itemized deductions: $25,619 (reported on 12.2% of returns )Here:
$25,619State:
$39,517
(% of AGI for various income ranges: 72.2% for AGIs below $25k , 148.0% for AGIs $25k-50k , 421.0% for AGIs $50k-75k , 897.2% for AGIs $75k-100k , 1481.6% for AGIs $100k-200k , 4075.7% for AGIs over 200k ) Charity contributions: $3,857 (reported on 8.2% of returns )(% of AGI for various income ranges: 7.3% for AGIs $25k-50k , 29.6% for AGIs $50k-75k , 72.6% for AGIs $75k-100k , 188.0% for AGIs $100k-200k , 645.7% for AGIs over 200k ) Taxes paid: $7,930 (reported on 12.2% of returns )(% of AGI for various income ranges: 6.6% for AGIs below $25k , 21.8% for AGIs $25k-50k , 119.6% for AGIs $50k-75k , 329.4% for AGIs $75k-100k , 538.7% for AGIs $100k-200k , 1158.6% for AGIs over 200k ) Earned income credit: $1,833 (reported on 14.6% of returns )(% of AGI for various income ranges: 87.5% for AGIs below $25k , 48.9% for AGIs $25k-50k ) Percentage of individuals using paid preparers for their 2020 taxes: 91.7%(% for various income ranges: 89.8% for AGIs below $25k , 91.7% for AGIs $25k-50k , 93.2% for AGIs $50k-75k , 91.7% for AGIs $75k-100k , 92.8% for AGIs $100k-200k , 95.5% for AGIs over 200k )
Averages for the 2012 tax year for zip code 95817, filed in 2013:
Average Adjusted Gross Income (AGI) in 2012: $39,764 (Individual Income Tax Returns) Here:
$39,764State:
$72,726
Salary/wage: $37,556 (reported on 85.0% of returns )Here:
$37,556State:
$59,079
(% of AGI for various income ranges: 73.2% for AGIs below $25k , 85.3% for AGIs $25k-50k , 79.9% for AGIs $50k-75k , 83.1% for AGIs $75k-100k , 79.8% for AGIs $100k-200k , 69.5% for AGIs over 200k ) Taxable interest for individuals: $456 (reported on 27.5% of returns )This zip code:
$456California:
$2,146
(% of AGI for various income ranges: 0.4% for AGIs below $25k , 0.3% for AGIs $25k-50k , 0.3% for AGIs $50k-75k , 0.3% for AGIs $75k-100k , 0.3% for AGIs $100k-200k , 0.1% for AGIs over 200k ) Ordinary dividends: $2,264 (reported on 10.6% of returns )(% of AGI for various income ranges: 0.7% for AGIs below $25k , 0.5% for AGIs $25k-50k , 0.6% for AGIs $50k-75k , 0.5% for AGIs $75k-100k , 0.9% for AGIs $100k-200k ) Net capital gain/loss in AGI: +$1,598 (reported on 8.1% of returns )Here:
+$1,598State:
+$30,460
(% of AGI for various income ranges: 0.2% for AGIs $25k-50k , 0.2% for AGIs $50k-75k , 1.1% for AGIs $100k-200k ) Profit/loss from business: +$9,112 (reported on 14.3% of returns )Here:
+$9,112State:
+$17,064
(% of AGI for various income ranges: 10.2% for AGIs below $25k , 2.6% for AGIs $25k-50k , 1.1% for AGIs $50k-75k , 2.6% for AGIs $75k-100k , 2.9% for AGIs $100k-200k ) Taxable individual retirement arrangement distribution: $11,175 (reported on 4.3% of returns )95817:
$11,175California:
$19,557
(% of AGI for various income ranges: 1.0% for AGIs below $25k , 0.9% for AGIs $25k-50k , 1.5% for AGIs $50k-75k , 1.6% for AGIs $75k-100k , 1.5% for AGIs $100k-200k ) Self-employment retirement plans: $13,600 (reported on 0.4% of returns )95817:
$13,600California:
$24,530
(% of AGI for various income ranges: 0.5% for AGIs $25k-50k ) Total itemized deductions: $18,686 (25% of AGI, reported on 25.4% of returns )Here:
$18,686State:
$34,004
Here:
24.8% of AGIState:
22.7% of AGI
(% of AGI for various income ranges: 8.1% for AGIs below $25k , 8.0% for AGIs $25k-50k , 13.3% for AGIs $50k-75k , 15.0% for AGIs $75k-100k , 15.7% for AGIs $100k-200k , 13.8% for AGIs over 200k ) Charity contributions: $2,181 (reported on 19.9% of returns )(% of AGI for various income ranges: 0.5% for AGIs below $25k , 0.8% for AGIs $25k-50k , 1.3% for AGIs $50k-75k , 1.4% for AGIs $75k-100k , 1.4% for AGIs $100k-200k , 1.1% for AGIs over 200k ) Taxes paid: $5,996 (reported on 25.0% of returns )95817:
$5,996State:
$14,448
(% of AGI for various income ranges: 1.3% for AGIs below $25k , 1.7% for AGIs $25k-50k , 3.7% for AGIs $50k-75k , 5.0% for AGIs $75k-100k , 6.3% for AGIs $100k-200k , 8.1% for AGIs over 200k ) Earned income credit: $2,188 (reported on 24.7% of returns )(% of AGI for various income ranges: 7.8% for AGIs below $25k , 0.9% for AGIs $25k-50k ) Percentage of individuals using paid preparers for their 2012 taxes: 43.6%(% for various income ranges: 41.6% for AGIs below $25k , 42.3% for AGIs $25k-50k , 46.2% for AGIs $50k-75k , 47.2% for AGIs $75k-100k , 51.4% for AGIs $100k-200k , 75.0% for AGIs over 200k )
Averages for the 2004 tax year for zip code 95817, filed in 2005:
Average Adjusted Gross Income (AGI) in 2004: $32,289 (Individual Income Tax Returns) Here:
$32,289State:
$58,600
Salary/wage: $31,280 (reported on 87.6% of returns )Here:
$31,280State:
$49,455
(% of AGI for various income ranges: 98.9% for AGIs below $10k , 83.1% for AGIs $10k-25k , 88.2% for AGIs $25k-50k , 87.2% for AGIs $50k-75k , 83.6% for AGIs $75k-100k , 73.5% for AGIs over 100k ) Taxable interest for individuals: $713 (reported on 34.7% of returns )This zip code:
$713California:
$2,365
(% of AGI for various income ranges: 1.9% for AGIs below $10k , 1.0% for AGIs $10k-25k , 0.5% for AGIs $25k-50k , 0.9% for AGIs $50k-75k , 0.3% for AGIs $75k-100k , 1.0% for AGIs over 100k ) Taxable dividends: $1,269 (reported on 12.3% of returns )(% of AGI for various income ranges: 1.6% for AGIs below $10k , 0.7% for AGIs $10k-25k , 0.3% for AGIs $25k-50k , 0.4% for AGIs $50k-75k , 0.4% for AGIs $75k-100k , 0.6% for AGIs over 100k ) Net capital gain/loss: +$5,550 (reported on 9.6% of returns )Here:
+$5,550State:
+$23,418
(% of AGI for various income ranges: -0.9% for AGIs below $10k , -0.1% for AGIs $10k-25k , 0.0% for AGIs $25k-50k , 0.8% for AGIs $50k-75k , 0.8% for AGIs $75k-100k , 10.5% for AGIs over 100k ) Profit/loss from business: +$9,991 (reported on 11.9% of returns )Here:
+$9,991State:
+$16,826
(% of AGI for various income ranges: 9.3% for AGIs below $10k , 4.3% for AGIs $10k-25k , 2.3% for AGIs $25k-50k , 2.3% for AGIs $50k-75k , 4.2% for AGIs $75k-100k , 7.0% for AGIs over 100k ) IRA payment deduction: $2,362 (reported on 1.5% of returns )95817:
$2,362California:
$3,192
(% of AGI for various income ranges: 0.2% for AGIs $10k-25k , 0.1% for AGIs $25k-50k , 0.1% for AGIs $50k-75k , 0.2% for AGIs $75k-100k ) Self-employed pension: $7,394 (reported on 0.6% of returns )Here:
$7,394California:
$17,688
Total itemized deductions: $16,299 (28% of AGI, reported on 26.9% of returns )Here:
$16,299State:
$28,113
Here:
27.9% of AGIState:
25.3% of AGI
(% of AGI for various income ranges: 14.1% for AGIs below $10k , 8.0% for AGIs $10k-25k , 11.7% for AGIs $25k-50k , 16.6% for AGIs $50k-75k , 18.4% for AGIs $75k-100k , 15.5% for AGIs over 100k ) Charity contributions deductions: $1,868 (3% of AGI, reported on 22.0% of returns )Here:
3.0% of AGIState:
3.3% of AGI
(% of AGI for various income ranges: 0.4% for AGIs below $10k , 0.6% for AGIs $10k-25k , 1.0% for AGIs $25k-50k , 1.6% for AGIs $50k-75k , 2.0% for AGIs $75k-100k , 1.7% for AGIs over 100k ) Total tax: $4,309 (reported on 68.8% of returns )95817:
$4,309State:
$10,761
(% of AGI for various income ranges: 2.7% for AGIs below $10k , 3.6% for AGIs $10k-25k , 7.3% for AGIs $25k-50k , 10.6% for AGIs $50k-75k , 12.0% for AGIs $75k-100k , 16.6% for AGIs over 100k ) Earned income credit: $1,752 (reported on 23.6% of returns )Percentage of individuals using paid preparers for their 2004 taxes: 55.9%(% for various income ranges: 56.4% for AGIs below $10k , 60.0% for AGIs $10k-25k , 52.1% for AGIs $25k-50k , 50.2% for AGIs $50k-75k , 59.8% for AGIs $75k-100k , 67.7% for AGIs over 100k )
Estimated median household income in 2022: This zip code:
$60,129California:
$91,551
Nearest zip codes: 95820 ,
95816 ,
95819 ,
95824 ,
95811 ,
95818 .
Sacramento Zip Code Map
Percentage of family households: This zip code:
32.1%California:
46.8%
Percentage of households with unmarried partners: This zip code:
10.6%California:
48.1%
Likely homosexual households (counted as self-reported same-sex unmarried-partner households)
Lesbian couples: 0.8% of all households Gay men: 0.4% of all households
Household received Food Stamps/SNAP in the past 12 months: 1,241Household did not receive Food Stamps/SNAP in the past 12 months: 5,593
Women who had a birth in the past 12 months: 236 (92 now married , 146 unmarried) Women who did not have a birth in the past 12 months: 4,267 (1,055 now married , 3,239 unmarried)
Housing units in zip code 95817 with a mortgage: 1,771 (134
second mortgage , 87
both second mortgage and home equity loan )
Houses without a mortgage: 54
Median monthly owner costs for units with a mortgage: $2,078
Median monthly owner costs for units without a mortgage: $640
Residents with income below the poverty level in 2022:
This zip code:
22.0%Whole state:
12.2%
Residents with income below 50% of the poverty level in 2022:
This zip code:
10.5%Whole state:
6.2%
Median number of rooms in houses and condos: Median number of rooms in apartments: Notable locations in this zip code not listed on our city pages
Click to draw/clear zip code borders Notable locations in zip code 95817: (A) , Gordon D Schaber Law Library (B) , Sacramento City Fire Department Station 6 (C) , Oak Park Community Center (D) . Display/hide their locations on the map
Churches in zip code 95817 include: (A) , Faith Bible Church (B) , Saint Pauls Lutheran Church (C) , Sacramento Revival Center (D) , Salvation Army Chapel (E) , Kingdom Hall of Jehovahs Witnesses (F) , Russian Evangelical Baptist Mission of Sacramento (G) , Trinity Missionary Baptist Church (H) , Bethel Church of God in Christ (I) . Display/hide their locations on the map
Parks in zip code 95817 include: (1) , Greenfair Park (2) , Oak Park (3) , Sacramento School Park (4) , McClatchy Park (5) . Display/hide their locations on the map
Year house built (houses)
0 2020 or later549 2010 to 2019421 2000 to 2009291 1990 to 1999646 1980 to 1989689 1970 to 1979502 1960 to 1969788 1950 to 19591,097 1940 to 19491,973 1939 or earlier
Zip code 95817 household income distribution in 2022 493 Less than $10,000776 $10,000 to $14,999246 $15,000 to $19,999336 $20,000 to $24,999208 $25,000 to $29,999471 $30,000 to $34,99996 $35,000 to $39,999223 $40,000 to $44,999239 $45,000 to $49,999271 $50,000 to $59,999670 $60,000 to $74,999773 $75,000 to $99,999561 $100,000 to $124,999322 $125,000 to $149,999565 $150,000 to $199,999518 $200,000 or moreEstimate of home value of owner-occupied houses/condos in 2022 in zip code 95817 3 $150,000 to $174,99936 $200,000 to $249,999100 $250,000 to $299,999601 $300,000 to $399,999669 $400,000 to $499,999920 $500,000 to $749,99973 $750,000 to $999,99924 $1,000,000 to $1,499,999Rent paid by renters in 2022 in zip code 95817 53 Less than $10033 $100 to $149163 $200 to $24928 $250 to $299191 $300 to $34919 $350 to $39951 $400 to $44920 $450 to $49911 $550 to $599152 $600 to $64955 $700 to $74918 $750 to $799251 $800 to $899210 $900 to $999800 $1,000 to $1,249507 $1,250 to $1,4991,097 $1,500 to $1,999148 $2,000 to $2,49979 $2,500 to $2,99915 $3,000 to $3,49999 $3,500 or more17 No cash rent
Median gross rent in 2022: $1,412.
Median price asked for vacant for-sale houses and condos in 2022: $1,302,257.
Estimated median house (or condo) value in 2022 for: White Non-Hispanic householders: $549,470Black or African American householders: $357,360American Indian or Alaska Native householders: $512,141Asian householders: $406,526Native Hawaiian and other Pacific Islander householders: $581,792Some other race householders: $345,979Two or more races householders: $361,913Hispanic or Latino householders: $370,107Estimated median house or condo value in 2022: $494,387
95817:
$494,387California:
$715,900
Lower value quartile - upper value quartile: $405,117 - $643,427
Mean price in 2022: Detached houses: $551,228Here:
$551,228State:
$988,808
Townhouses or other attached units: $454,997Here:
$454,997State:
$838,546
In 2-unit structures: $1,011,605Here:
$1,011,605State:
$1,138,100
In 3-to-4-unit structures: $509,147Here:
$509,147State:
$824,253
In 5-or-more-unit structures: $399,568Here:
$399,568State:
$730,996
Mobile homes: $108,663Here:
$108,663State:
$184,506
Occupied boats, RVs, vans, etc.: $193,890Here:
$193,890State:
$204,957
Housing units in structures:
One, detached: 3,769One, attached: 697Two: 3123 or 4: 2995 to 9: 56810 to 19: 48920 to 49: 28950 or more: 506Mobile homes: 18Unemployment : 7.0%
Means of transportation to work in zip code 95817 51.6% 3,638 Drove a car alone11.4% 801 Carpooled2.8% 197 Bus or trolley bus1.7% 119 Railroad0.1% 7 Motorcycle6.4% 448 Bicycle5.7% 401 Walked0.5% 33 Other means20.9% 1,470 Worked at homeTravel time to work (commute) in zip code 95817 132 Less than 5 minutes601 5 to 9 minutes1,262 10 to 14 minutes1,044 15 to 19 minutes951 20 to 24 minutes408 25 to 29 minutes589 30 to 34 minutes66 35 to 39 minutes164 40 to 44 minutes159 45 to 59 minutes216 60 to 89 minutes41 90 or more minutes
Neighborhoods in zip code 95817: Percentage of zip code residents living and working in this county: 90.3%
Household type by relationship:
Households: 14,392
Male householders: 2,937 (1,254 living alone ), Female householders: 3,827 (1,533 living alone )1,759 spouses (1,662 opposite-sex spouses ), 948 unmarried partners , (802 opposite-sex unmarried partners ), 2,464 children (2,286 natural , 24 adopted , 151 stepchildren ), 300 grandchildren , 139 brothers or sisters , 161 parents , 9 foster children , 318 other relatives , 1,272 non-relatives In group quarters: 372 (-1 institutionalized population )
Size of family households: 1,510 2-persons , 569 3-persons , 412 4-persons , 240 5-persons , 21 6-persons , 33 7-or-more-persons
Size of nonfamily households: 2,787 1-person , 906 2-persons , 209 3-persons , 92 4-persons , 53 5-persons
1,044 married couples with children. single-parent households (323 men , 405 women ).
75.4% of residents of 95817 zip code speak English at home. of residents speak Spanish at home (73% very well, 9% well, 15% not well, 3% not at all ).of residents speak other Indo-European language at home (52% very well, 16% well, 8% not well, 23% not at all ).of residents speak Asian or Pacific Island language at home (64% very well, 11% well, 13% not well, 12% not at all ).of residents speak other language at home (83% very well, 9% well, 9% not well ).
Foreign born population: 1,566 (10.9%)
(63.5%
of them are naturalized citizens )
This zip code:
10.9%Whole state:
26.7%
18% Honduras 14% Serbia 6% Dominica 5% Hong Kong 5% Indonesia 4% Costa Rica 4% Liberia 6% English 5% Irish 4% European 3% Italian 3% Ukrainian 3% German 3% American
Year of entry for the foreign-born population
436 2010 or later 287 2000 to 2009 322 1990 to 1999 671 Before 1990
There are
254 Internal Medicine Specialists 113 Psychiatry & Neurology Specialists 106 Pediatrics 86 Anesthesiologists 86 Nurse Practitioners 80 Counselors 73 Radiologists 71 Social Workers 931 Other Medical Specialists in Zip Code 95817.
Facilities with environmental interests located in this zip code:
EARTHGRAINS COMPANY (3211 6TH AVENUE in SACRAMENTO, CA)
AIR MINOR (AIRS/AFS) (Integrated Compliance Information System) - ICIS-09-2001-0034, FORMAL ENFORCEMENT ACTION CRITERIA AND HAZARDOUS AIR POLLUTANT INVENTORY (Inventory of air pollution sources) Business SIC classification: BREAD AND OTHER BAKERY PRODUCTS, EXCEPT COOKIES AND CRACKERS; GROCERIES AND RELATED PRODUCTSAlternative names: EARTH GRAINS CO, RAINBO BAKING COMPANY
CHEVRON STATION NO 90812 (1940 65TH ST in SACRAMENTO, CA)
STATE MASTER (California - Hazardous Waste Tracking) - HAZARDOU WASTE PROGRAM Small Quantity Generators, between 100 kg and 1000 kg of hazardous waste/month (Resource Conservation and Recovery Act (tracking hazardous waste)) - notification Organizations: CHEVRON PRODUCTS CO (CONTACT/OWNER)
AMERICAN LEGION HIGH (CONT.) (3801 BROADWAY in SACRAMENTO, CA)
(National Center for Education Statistics) - STATE ID-3430154 Organizations: SACRAMENTO CITY UNIFIED (SCHOOL DISTRICT)
ANDERSON (MARIAN) ELEMENTARY (2850 49TH ST. in SACRAMENTO, CA)
(National Center for Education Statistics) - STATE ID-6096648 Organizations: SACRAMENTO CITY UNIFIED (SCHOOL DISTRICT)
KEITH B. KENNY ELEMENTARY (3525 MARTIN LUTHER KING JR. BL in SACRAMENTO, CA)
(National Center for Education Statistics) - STATE ID-6110662 Organizations: SACRAMENTO CITY UNIFIED (SCHOOL DISTRICT)
EARTHGRAINS BAKING GARAGE (3290 6TH AVE in SACRAMENTO, CA)
Small Quantity Generators, between 100 kg and 1000 kg of hazardous waste/month (Resource Conservation and Recovery Act (tracking hazardous waste)) Business NAICS classification: COMMERCIAL BAKERIES.Organizations: EARTHGRAINS CO (CONTACT/OPERATOR)
KRAMER CARTON COMPANY (1800 61ST ST in SACRAMENTO, CA)
CRITERIA AND HAZARDOUS AIR POLLUTANT INVENTORY (Inventory of air pollution sources) Business SIC classification: COMMERCIAL PRINTING, LITHOGRAPHIC
Housing units lacking complete kitchen facilities: 0.8%
55.5% Utility gas 43.5% Electricity 0.5% Bottled, tank, or LP gas
Population in 1990: 15,767.
Place of birth for U.S.-born residents:
This state: 9,383Northeast: 601Midwest: 1,051South: 873West: 708
45% of the 95817 zip code residents lived in the same house 5 years ago.
Out of people who lived in different houses, 75% lived in this county.
Out of people who lived in different counties, 50% lived in California.
85% of the 95817 zip code residents lived in the same house 1 year ago.
Out of people who lived in different houses, 53% moved from this county.
Out of people who lived in different houses, 31% moved from different county within same state.
Out of people who lived in different houses, 7% moved from different state.
Out of people who lived in different houses, 7% moved from abroad.
Private vs. public school enrollment:
Students in private schools in grades 1 to 8 (elementary and middle school): 74
Here:
7.5%California:
10.5%
Students in private schools in grades 9 to 12 (high school):
Students in private undergraduate colleges:
Here:
0.1%California:
15.9%
Occupation by median earnings in the past 12 months ($)
100,115 Legal occupations 84,364 Health diagnosing and treating practitioners and other technical occupations 81,856 Management occupations 78,994 Computer and mathematical occupations 69,629 Business and financial operations occupations 65,322 Life, physical, and social science occupations
Companies with federal contracts located in this zip code:
EARTHGRAINS BAKING COMPANIES, (3211 6TH AVE in SACRAMENTO, CA) in 20 contracts from 2001 to 2006
Contracts for Food Items For Resale, Non-Food Items For Resale, Bakery and Cereal Products by Defense Commissary Agency, ArmySigned by year: 2000: $0; 2001: $812; 2002: $32,774; 2003: $0; 2004: $209,282; 2005: $587,352; 2006: $338,169.
Biggest contracts: with Defense Commissary Agency for Food Items For Resale. Signed on 2005-04-01. Completion date: 2005-08-31.
, same as above. Signed on 2006-01-01. Completion date: 2006-03-31.
, same as above. Signed on 2004-10-01. Completion date: 2005-02-28.
, same as above. Signed on 2005-10-01. Completion date: 2005-12-31.
HANDS-ON EXECUTIVE SERVICE (3555 3RD AVENUE in SACRAMENTO, CA; small business) in 5 contracts from 2003 to 2004
Contracts for Custodial Janitorial Services by Army, U.S. Army Corps of Engineers - civil program financing onlySigned by year: 2000: $0; 2001: $0; 2002: $0; 2003: $9,960; 2004: $9,068; 2005: $0; 2006: $0.
Biggest contracts: with Army for Custodial Janitorial Services. Signed on 2004-10-27. Completion date: 2005-09-30.
, same as above. Signed on 2003-11-18. Completion date: 2004-09-30.
with U.S. Army Corps of Engineers - civil program financing only for Custodial Janitorial Services. Signed on 2003-11-18. Completion date: 2004-09-30.
with Army for Custodial Janitorial Services. Signed on 2003-11-18. Completion date: 2004-09-30.
MCDONALD PLUMBING, HEATING & A (2920 36TH STREET in SACRAMENTO, CA; small business)
$2,819 with Navy for Maintenance, Repair or Alteration of Real Property -- Other Administrative Facilities and Service Buildings. Signed on 2000-05-11. Completion date: 2000-06-26.
Top industries in this zip code by the number of employees in 2005:
Health Care and Social Assistance: General Medical and Surgical Hospitals (over 1000 employees: 1 establishment, 250-499 employees: 1 establishment)Finance and Insurance: Credit Unions (500-999: 1, 5-9: 1, 1-4: 1)Educational Services: Colleges, Universities, and Professional Schools (500-999: 1)Educational Services: Elementary and Secondary Schools (100-249: 1, 5-9: 1)Health Care and Social Assistance: Nursing Care Facilities (50-99: 2)Health Care and Social Assistance: Other Individual and Family Services (50-99: 1, 20-49: 1, 1-4: 1)
People in group quarters in 2010:
124 people in mental (psychiatric) hospitals and psychiatric units in other hospitals
60 people in nursing facilities/skilled-nursing facilities
40 people in hospitals with patients who have no usual home elsewhere
17 people in group homes intended for adults
13 people in residential treatment centers for adults
11 people in residential treatment centers for juveniles (non-correctional)
11 people in other noninstitutional facilities
People in group quarters in 2000:
167 people in nursing homes
83 people in other noninstitutional group quarters
73 people in mental (psychiatric) hospitals or wards
14 people in homes or halfway houses for drug/alcohol abuse
9 people in homes for the mentally retarded
2 people in religious group quarters
Fatal accident statistics in 2014:
Fatal accident count: 2Vehicles involved in fatal accidents: 7Fatal accidents caused by drunken drivers: 1Fatalities: 2Persons involved in fatal accidents: 11Pedestrians involved in fatal accidents: 0
Fatal accident statistics in 2013:
Fatal accident count: 1Vehicles involved in fatal accidents: 1Fatal accidents caused by drunken drivers: 0Fatalities: 1Persons involved in fatal accidents: 1Pedestrians involved in fatal accidents: 0
Home Mortgage Disclosure Act Aggregated Statistics For Year 2009(Based on 2 full and 8 partial tracts) A) FHA, FSA/RHS & VA B) Conventional C) Refinancings D) Home Improvement Loans E) Loans on Dwellings For 5+ Families F) Non-occupant Loans on Number Average Value Number Average Value Number Average Value Number Average Value Number Average Value Number Average Value
LOANS ORIGINATED 144 $172,042 125 $170,129 313 $214,671 18 $131,522 0 $0 99 $133,633 APPLICATIONS APPROVED, NOT ACCEPTED 14 $191,940 24 $149,422 45 $234,615 1 $20,110 0 $0 8 $143,212 APPLICATIONS DENIED 20 $153,520 51 $125,988 169 $205,788 18 $90,486 2 $556,950 48 $121,634 APPLICATIONS WITHDRAWN 14 $166,099 33 $130,563 138 $197,914 7 $72,149 0 $0 38 $113,885 FILES CLOSED FOR INCOMPLETENESS 3 $123,587 11 $151,646 19 $138,495 0 $0 0 $0 4 $207,008
Aggregated Statistics For Year 2008(Based on 2 full and 8 partial tracts) A) FHA, FSA/RHS & VA B) Conventional C) Refinancings D) Home Improvement Loans E) Loans on Dwellings For 5+ Families F) Non-occupant Loans on G) Loans On Manufactured Number Average Value Number Average Value Number Average Value Number Average Value Number Average Value Number Average Value Number Average Value
LOANS ORIGINATED 97 $211,853 241 $150,122 240 $203,542 31 $101,569 4 $305,250 159 $133,178 1 $36,200 APPLICATIONS APPROVED, NOT ACCEPTED 9 $116,982 56 $144,015 49 $211,491 20 $78,850 0 $0 40 $160,920 5 $89,160 APPLICATIONS DENIED 15 $228,670 70 $157,274 351 $199,886 38 $80,022 4 $778,685 90 $190,944 0 $0 APPLICATIONS WITHDRAWN 30 $177,967 77 $129,351 100 $213,436 16 $81,744 0 $0 56 $145,563 0 $0 FILES CLOSED FOR INCOMPLETENESS 2 $112,680 16 $173,028 12 $200,382 2 $213,770 0 $0 15 $164,338 0 $0
Aggregated Statistics For Year 2007(Based on 2 full and 8 partial tracts) A) FHA, FSA/RHS & VA B) Conventional C) Refinancings D) Home Improvement Loans E) Loans on Dwellings For 5+ Families F) Non-occupant Loans on G) Loans On Manufactured Number Average Value Number Average Value Number Average Value Number Average Value Number Average Value Number Average Value Number Average Value
LOANS ORIGINATED 8 $161,446 352 $217,843 600 $209,468 92 $98,986 8 $513,249 263 $209,687 0 $0 APPLICATIONS APPROVED, NOT ACCEPTED 1 $238,270 99 $212,554 156 $218,146 27 $140,091 0 $0 65 $242,286 2 $24,735 APPLICATIONS DENIED 3 $193,737 198 $217,087 609 $226,549 104 $110,611 0 $0 175 $226,791 2 $32,980 APPLICATIONS WITHDRAWN 2 $284,905 87 $199,976 187 $233,494 19 $149,999 2 $272,080 62 $220,040 0 $0 FILES CLOSED FOR INCOMPLETENESS 0 $0 24 $243,939 71 $229,871 6 $61,425 0 $0 21 $226,930 0 $0
Aggregated Statistics For Year 2006(Based on 2 full and 8 partial tracts) A) FHA, FSA/RHS & VA B) Conventional C) Refinancings D) Home Improvement Loans E) Loans on Dwellings For 5+ Families F) Non-occupant Loans on G) Loans On Manufactured Number Average Value Number Average Value Number Average Value Number Average Value Number Average Value Number Average Value Number Average Value
LOANS ORIGINATED 0 $0 755 $189,188 1,062 $206,798 204 $133,816 6 $466,855 485 $210,984 2 $34,810 APPLICATIONS APPROVED, NOT ACCEPTED 1 $98,390 202 $199,961 275 $221,742 43 $103,990 0 $0 130 $210,334 1 $105,920 APPLICATIONS DENIED 0 $0 361 $190,124 710 $223,898 163 $134,097 4 $366,440 242 $222,365 4 $255,428 APPLICATIONS WITHDRAWN 1 $396,880 189 $186,541 429 $211,653 46 $193,897 0 $0 138 $206,885 2 $120,000 FILES CLOSED FOR INCOMPLETENESS 0 $0 25 $208,276 117 $232,663 8 $167,408 0 $0 34 $174,159 0 $0
Aggregated Statistics For Year 2005(Based on 2 full and 8 partial tracts) A) FHA, FSA/RHS & VA B) Conventional C) Refinancings D) Home Improvement Loans E) Loans on Dwellings For 5+ Families F) Non-occupant Loans on G) Loans On Manufactured Number Average Value Number Average Value Number Average Value Number Average Value Number Average Value Number Average Value Number Average Value
LOANS ORIGINATED 2 $269,085 946 $190,390 1,334 $204,648 199 $117,915 10 $460,554 570 $207,628 1 $127,380 APPLICATIONS APPROVED, NOT ACCEPTED 0 $0 229 $176,690 267 $205,196 29 $119,378 0 $0 140 $188,894 2 $32,350 APPLICATIONS DENIED 2 $305,060 357 $177,095 702 $200,679 125 $108,430 6 $451,667 204 $205,010 2 $31,495 APPLICATIONS WITHDRAWN 6 $183,805 240 $181,612 478 $202,968 47 $165,500 0 $0 157 $207,030 4 $134,855 FILES CLOSED FOR INCOMPLETENESS 1 $275,010 50 $196,413 129 $190,684 14 $118,946 2 $721,885 43 $193,545 0 $0
Aggregated Statistics For Year 2004(Based on 2 full and 8 partial tracts) A) FHA, FSA/RHS & VA B) Conventional C) Refinancings D) Home Improvement Loans E) Loans on Dwellings For 5+ Families F) Non-occupant Loans on G) Loans On Manufactured Number Average Value Number Average Value Number Average Value Number Average Value Number Average Value Number Average Value Number Average Value
LOANS ORIGINATED 19 $190,957 998 $163,469 1,337 $163,130 207 $116,819 17 $597,184 722 $162,177 1 $3,560 APPLICATIONS APPROVED, NOT ACCEPTED 1 $265,530 183 $158,853 252 $161,868 29 $79,817 2 $162,150 112 $168,158 0 $0 APPLICATIONS DENIED 3 $195,637 256 $152,148 554 $154,459 121 $85,048 0 $0 204 $155,418 0 $0 APPLICATIONS WITHDRAWN 7 $214,104 131 $168,074 393 $154,592 51 $95,886 2 $240,440 94 $152,369 0 $0 FILES CLOSED FOR INCOMPLETENESS 2 $376,000 42 $143,753 178 $144,245 5 $68,646 0 $0 55 $141,679 0 $0
Aggregated Statistics For Year 2003(Based on 2 full and 8 partial tracts) A) FHA, FSA/RHS & VA B) Conventional C) Refinancings D) Home Improvement Loans E) Loans on Dwellings For 5+ Families F) Non-occupant Loans on Number Average Value Number Average Value Number Average Value Number Average Value Number Average Value Number Average Value
LOANS ORIGINATED 56 $163,752 616 $137,512 1,822 $134,896 104 $36,156 14 $1,056,776 635 $123,925 APPLICATIONS APPROVED, NOT ACCEPTED 9 $141,847 112 $129,239 287 $125,969 39 $28,613 0 $0 115 $111,441 APPLICATIONS DENIED 10 $148,231 229 $126,917 607 $120,411 93 $47,264 4 $225,360 182 $120,795 APPLICATIONS WITHDRAWN 22 $158,502 102 $128,752 455 $129,553 13 $66,943 6 $300,675 109 $120,364 FILES CLOSED FOR INCOMPLETENESS 0 $0 19 $165,622 80 $139,692 0 $0 2 $162,150 22 $137,516
Aggregated Statistics For Year 2002(Based on 2 full and 8 partial tracts) A) FHA, FSA/RHS & VA B) Conventional C) Refinancings D) Home Improvement Loans E) Loans on Dwellings For 5+ Families F) Non-occupant Loans on Number Average Value Number Average Value Number Average Value Number Average Value Number Average Value Number Average Value
LOANS ORIGINATED 121 $134,410 642 $121,205 1,175 $121,629 111 $31,484 22 $381,842 475 $105,489 APPLICATIONS APPROVED, NOT ACCEPTED 9 $134,973 91 $105,371 160 $115,092 14 $17,999 0 $0 56 $103,646 APPLICATIONS DENIED 15 $119,285 138 $100,841 460 $101,123 65 $39,478 0 $0 129 $93,383 APPLICATIONS WITHDRAWN 8 $89,992 88 $113,530 248 $112,633 25 $34,567 0 $0 54 $98,704 FILES CLOSED FOR INCOMPLETENESS 7 $120,443 18 $156,037 82 $114,718 4 $77,868 0 $0 12 $147,160
Aggregated Statistics For Year 2001(Based on 2 full and 8 partial tracts) A) FHA, FSA/RHS & VA B) Conventional C) Refinancings D) Home Improvement Loans E) Loans on Dwellings For 5+ Families F) Non-occupant Loans on Number Average Value Number Average Value Number Average Value Number Average Value Number Average Value Number Average Value
LOANS ORIGINATED 182 $108,022 416 $100,174 843 $108,964 44 $39,823 15 $259,635 273 $76,680 APPLICATIONS APPROVED, NOT ACCEPTED 17 $115,846 57 $83,729 105 $96,086 4 $18,320 0 $0 38 $68,463 APPLICATIONS DENIED 20 $104,058 121 $75,913 432 $92,537 59 $26,614 4 $130,085 103 $71,465 APPLICATIONS WITHDRAWN 9 $128,758 64 $85,181 223 $104,299 14 $26,673 0 $0 34 $89,294 FILES CLOSED FOR INCOMPLETENESS 2 $40,000 12 $86,723 72 $108,760 2 $9,160 0 $0 8 $90,190
Aggregated Statistics For Year 2000(Based on 2 full and 8 partial tracts) A) FHA, FSA/RHS & VA B) Conventional C) Refinancings D) Home Improvement Loans E) Loans on Dwellings For 5+ Families F) Non-occupant Loans on Number Average Value Number Average Value Number Average Value Number Average Value Number Average Value Number Average Value
LOANS ORIGINATED 192 $94,371 371 $84,733 277 $75,278 48 $29,294 19 $174,707 191 $63,900 APPLICATIONS APPROVED, NOT ACCEPTED 11 $112,643 36 $79,849 80 $67,298 16 $26,555 0 $0 30 $62,310 APPLICATIONS DENIED 12 $91,585 118 $66,861 280 $67,010 59 $22,162 6 $100,850 95 $57,131 APPLICATIONS WITHDRAWN 16 $102,212 64 $79,736 112 $87,504 4 $53,830 1 $133,100 30 $60,868 FILES CLOSED FOR INCOMPLETENESS 9 $115,896 10 $69,201 48 $93,772 1 $71,120 0 $0 5 $55,670
Aggregated Statistics For Year 1999(Based on 1 full and 5 partial tracts) A) FHA, FSA/RHS & VA B) Conventional C) Refinancings D) Home Improvement Loans E) Loans on Dwellings For 5+ Families F) Non-occupant Loans on Number Average Value Number Average Value Number Average Value Number Average Value Number Average Value Number Average Value
LOANS ORIGINATED 81 $95,603 109 $82,806 211 $79,852 24 $21,548 4 $253,375 91 $60,022 APPLICATIONS APPROVED, NOT ACCEPTED 5 $81,270 20 $76,243 61 $65,040 13 $27,589 1 $66,090 18 $61,563 APPLICATIONS DENIED 11 $72,196 50 $73,460 149 $74,626 39 $20,180 1 $91,200 42 $73,317 APPLICATIONS WITHDRAWN 9 $92,874 31 $71,412 82 $86,294 2 $22,920 1 $115,810 21 $76,748 FILES CLOSED FOR INCOMPLETENESS 2 $70,015 5 $45,436 27 $73,103 0 $0 0 $0 4 $41,550
Private Mortgage Insurance Companies Aggregated Statistics For Year 2009(Based on 2 full and 6 partial tracts) A) Conventional B) Refinancings C) Non-occupant Loans on Number Average Value Number Average Value Number Average Value
LOANS ORIGINATED 20 $215,452 6 $253,932 0 $0 APPLICATIONS APPROVED, NOT ACCEPTED 7 $126,930 4 $301,458 0 $0 APPLICATIONS DENIED 2 $198,795 5 $459,358 0 $0 APPLICATIONS WITHDRAWN 0 $0 0 $0 0 $0 FILES CLOSED FOR INCOMPLETENESS 5 $189,092 0 $0 2 $91,000
Aggregated Statistics For Year 2008(Based on 2 full and 8 partial tracts) A) Conventional B) Refinancings C) Non-occupant Loans on Number Average Value Number Average Value Number Average Value
LOANS ORIGINATED 74 $184,830 23 $264,623 21 $133,047 APPLICATIONS APPROVED, NOT ACCEPTED 39 $180,597 17 $289,306 6 $161,578 APPLICATIONS DENIED 16 $130,321 8 $271,225 14 $183,031 APPLICATIONS WITHDRAWN 5 $208,304 6 $218,380 0 $0 FILES CLOSED FOR INCOMPLETENESS 1 $270,270 2 $101,685 2 $101,685
Aggregated Statistics For Year 2007(Based on 2 full and 8 partial tracts) A) Conventional B) Refinancings C) Non-occupant Loans on Number Average Value Number Average Value Number Average Value
LOANS ORIGINATED 83 $266,138 33 $279,436 13 $278,988 APPLICATIONS APPROVED, NOT ACCEPTED 18 $262,518 6 $323,225 4 $290,862 APPLICATIONS DENIED 9 $280,264 1 $330,730 2 $321,550 APPLICATIONS WITHDRAWN 6 $205,392 0 $0 2 $168,560 FILES CLOSED FOR INCOMPLETENESS 0 $0 0 $0 0 $0
Aggregated Statistics For Year 2006(Based on 2 full and 6 partial tracts) A) Conventional B) Refinancings C) Non-occupant Loans on Number Average Value Number Average Value Number Average Value
LOANS ORIGINATED 32 $272,727 23 $306,696 5 $254,886 APPLICATIONS APPROVED, NOT ACCEPTED 5 $276,622 5 $280,304 0 $0 APPLICATIONS DENIED 0 $0 0 $0 0 $0 APPLICATIONS WITHDRAWN 2 $305,060 3 $293,637 0 $0 FILES CLOSED FOR INCOMPLETENESS 2 $186,885 0 $0 2 $186,885
Aggregated Statistics For Year 2005(Based on 2 full and 8 partial tracts) A) Conventional B) Refinancings C) Non-occupant Loans on Number Average Value Number Average Value Number Average Value
LOANS ORIGINATED 19 $241,036 14 $254,540 9 $221,719 APPLICATIONS APPROVED, NOT ACCEPTED 5 $251,878 8 $283,618 2 $208,040 APPLICATIONS DENIED 0 $0 0 $0 0 $0 APPLICATIONS WITHDRAWN 2 $174,060 1 $422,350 0 $0 FILES CLOSED FOR INCOMPLETENESS 4 $157,570 0 $0 0 $0
Aggregated Statistics For Year 2004(Based on 2 full and 8 partial tracts) A) Conventional B) Refinancings C) Non-occupant Loans on Number Average Value Number Average Value Number Average Value
LOANS ORIGINATED 78 $185,073 24 $192,285 33 $141,870 APPLICATIONS APPROVED, NOT ACCEPTED 23 $198,579 11 $135,441 5 $184,254 APPLICATIONS DENIED 2 $297,735 0 $0 0 $0 APPLICATIONS WITHDRAWN 1 $241,820 3 $182,697 1 $241,820 FILES CLOSED FOR INCOMPLETENESS 0 $0 0 $0 0 $0
Aggregated Statistics For Year 2003(Based on 2 full and 8 partial tracts) A) Conventional B) Refinancings C) Non-occupant Loans on Number Average Value Number Average Value Number Average Value
LOANS ORIGINATED 115 $143,358 33 $165,209 35 $121,567 APPLICATIONS APPROVED, NOT ACCEPTED 54 $179,214 13 $176,751 9 $159,328 APPLICATIONS DENIED 9 $183,986 0 $0 7 $177,369 APPLICATIONS WITHDRAWN 6 $200,880 2 $111,765 0 $0 FILES CLOSED FOR INCOMPLETENESS 2 $188,090 0 $0 0 $0
Aggregated Statistics For Year 2002(Based on 2 full and 8 partial tracts) A) Conventional B) Refinancings C) Non-occupant Loans on Number Average Value Number Average Value Number Average Value
LOANS ORIGINATED 164 $133,019 38 $162,103 62 $88,724 APPLICATIONS APPROVED, NOT ACCEPTED 113 $179,074 11 $130,704 6 $160,232 APPLICATIONS DENIED 12 $164,761 0 $0 1 $239,450 APPLICATIONS WITHDRAWN 18 $189,469 3 $120,813 7 $119,123 FILES CLOSED FOR INCOMPLETENESS 12 $191,287 0 $0 1 $254,750
Aggregated Statistics For Year 2001(Based on 2 full and 8 partial tracts) A) Conventional B) Refinancings C) Non-occupant Loans on Number Average Value Number Average Value Number Average Value
LOANS ORIGINATED 140 $111,730 50 $136,938 35 $73,148 APPLICATIONS APPROVED, NOT ACCEPTED 98 $159,204 21 $142,445 15 $91,389 APPLICATIONS DENIED 16 $161,100 2 $142,910 2 $65,960 APPLICATIONS WITHDRAWN 11 $151,551 0 $0 5 $121,674 FILES CLOSED FOR INCOMPLETENESS 16 $201,707 1 $178,330 3 $149,277
Aggregated Statistics For Year 2000(Based on 2 full and 8 partial tracts) A) Conventional B) Refinancings C) Non-occupant Loans on Number Average Value Number Average Value Number Average Value
LOANS ORIGINATED 95 $107,978 31 $87,487 30 $59,989 APPLICATIONS APPROVED, NOT ACCEPTED 15 $82,387 8 $97,485 7 $71,100 APPLICATIONS DENIED 5 $95,186 2 $68,000 2 $61,380 APPLICATIONS WITHDRAWN 1 $155,530 0 $0 0 $0 FILES CLOSED FOR INCOMPLETENESS 2 $42,140 0 $0 0 $0
Aggregated Statistics For Year 1999(Based on 1 full and 5 partial tracts) A) Conventional B) Refinancings C) Non-occupant Loans on Number Average Value Number Average Value Number Average Value
LOANS ORIGINATED 45 $108,029 26 $105,416 6 $59,803 APPLICATIONS APPROVED, NOT ACCEPTED 13 $206,214 3 $147,653 0 $0 APPLICATIONS DENIED 12 $142,205 2 $128,385 1 $155,580 APPLICATIONS WITHDRAWN 6 $168,202 2 $80,960 0 $0 FILES CLOSED FOR INCOMPLETENESS 40 $161,187 0 $0 1 $79,690
2006 - 2018 National Fire Incident Reporting System (NFIRS) incidents See full 2006 National Fire Incident Reporting System statistics for zip code 95817, California
Most common first names in zip code 95817 among deceased individuals Name Count Lived (average)
John 159 73.2 years Mary 140 76.2 years William 139 72.9 years James 127 71.3 years Robert 111 67.4 years George 100 76.4 years Charles 79 72.0 years Joseph 73 73.3 years Frank 72 76.6 years Edward 63 75.0 years
Most common last names in zip code 95817 among deceased individuals Last name Count Lived (average)
Johnson 77 70.6 years Smith 68 70.2 years Brown 57 69.2 years Williams 56 70.0 years Jones 55 71.3 years Davis 42 65.6 years Miller 37 79.7 years Thomas 36 76.4 years Taylor 33 65.4 years Jackson 32 72.1 years
Businesses in zip code 95817
Name Count Name Count
Best Western 1 Target 1 FedEx 2 U-Haul 2 Marriott 1 Walgreens 1 Starbucks 2
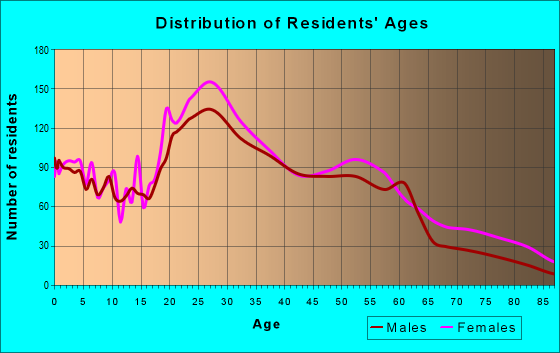
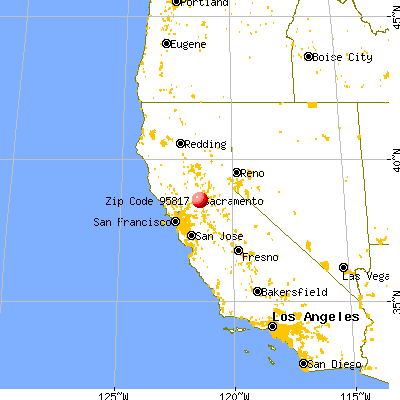


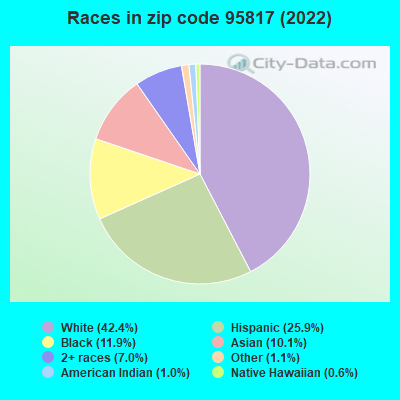


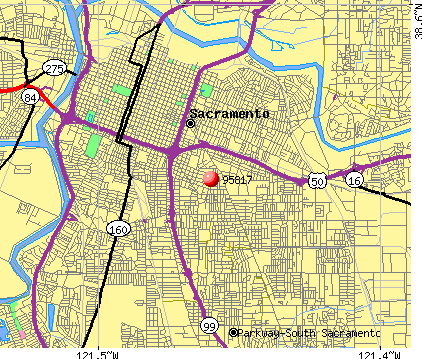 Nearest zip codes: 95820, 95816, 95819, 95824, 95811, 95818.
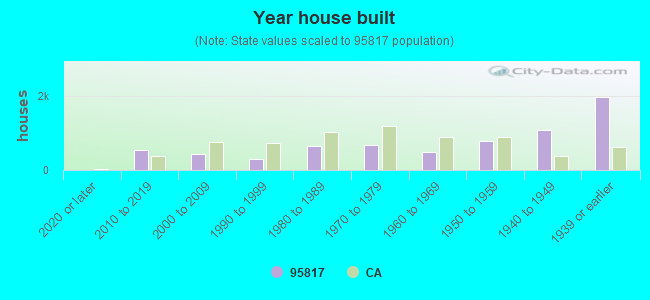
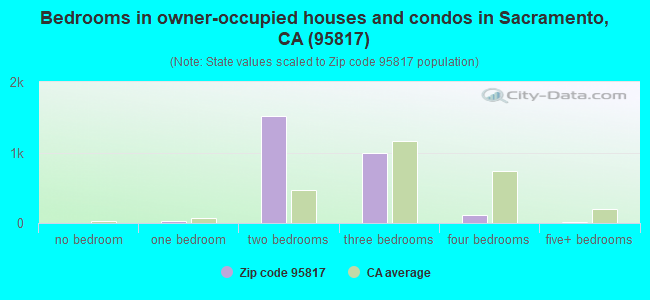
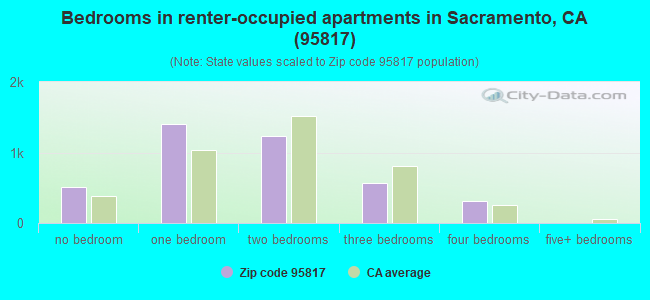
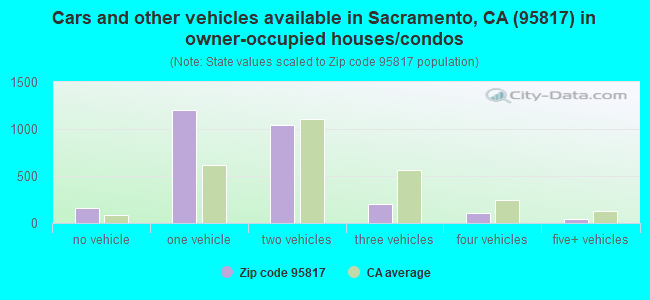
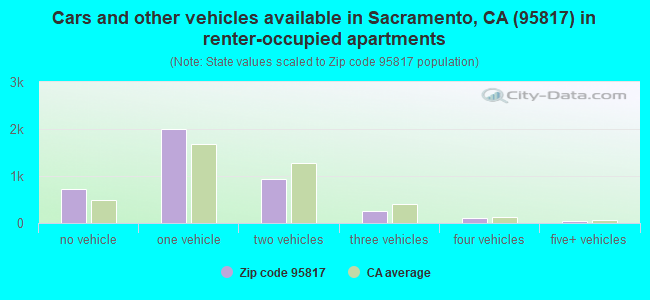


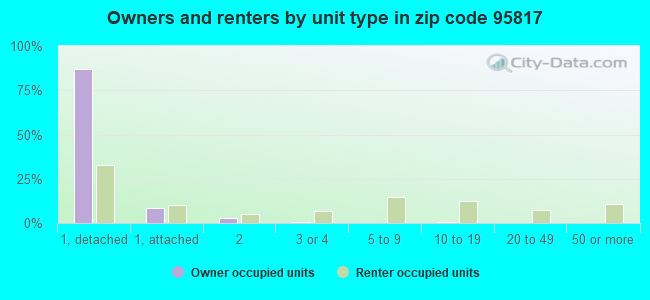
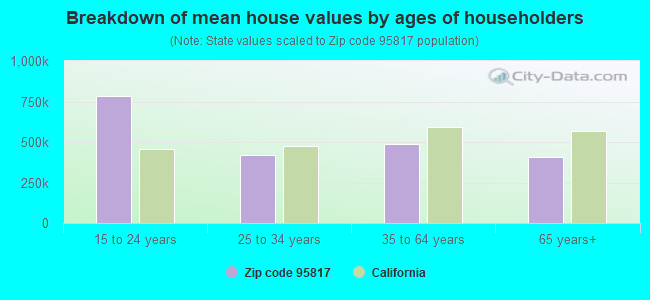


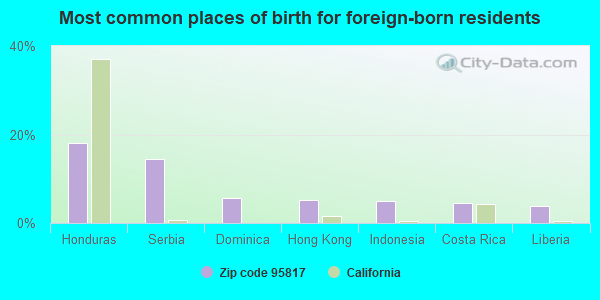
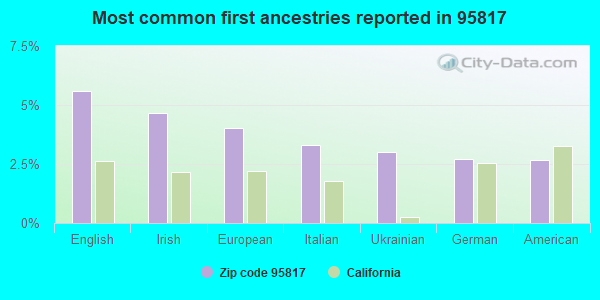
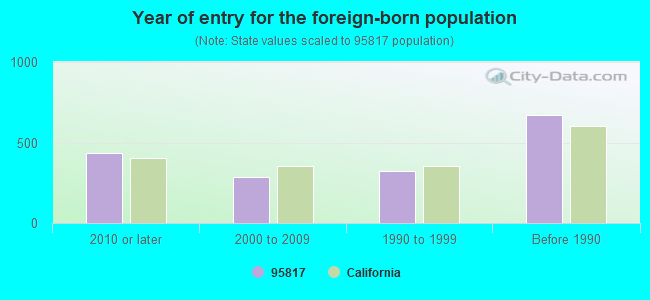


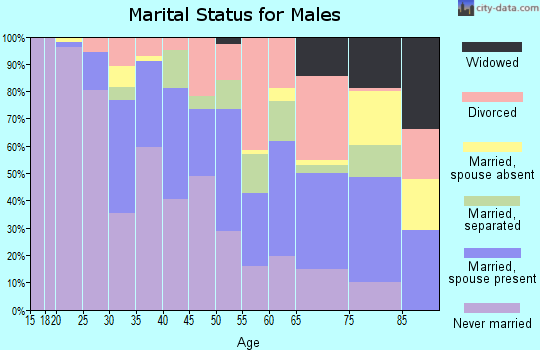
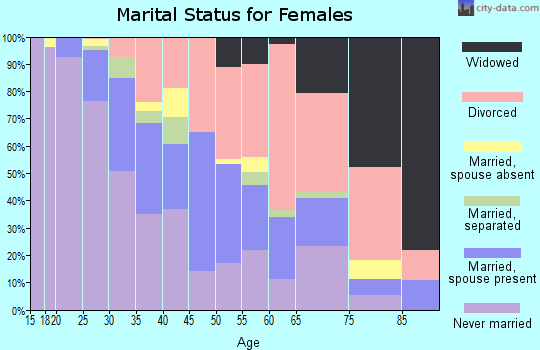
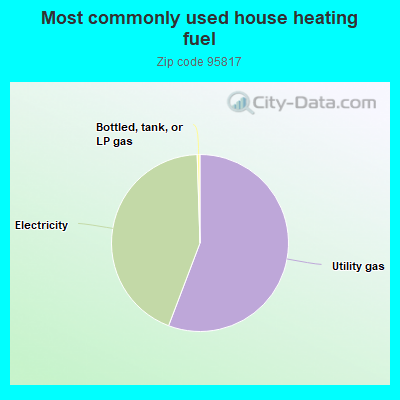
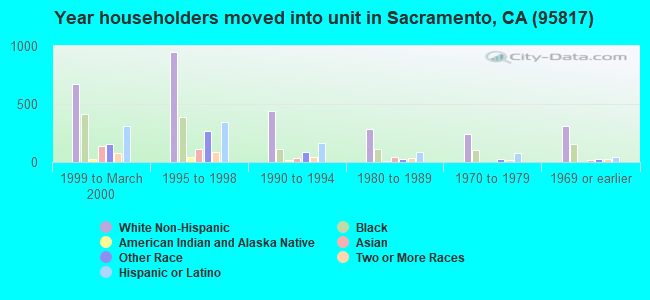
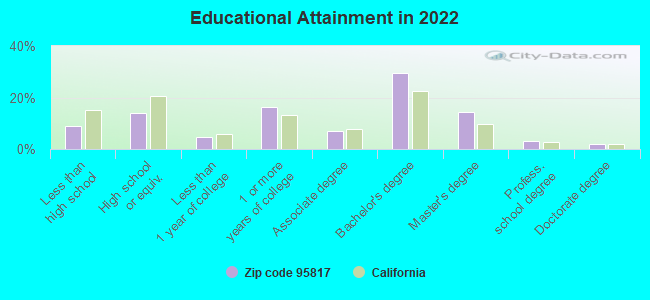
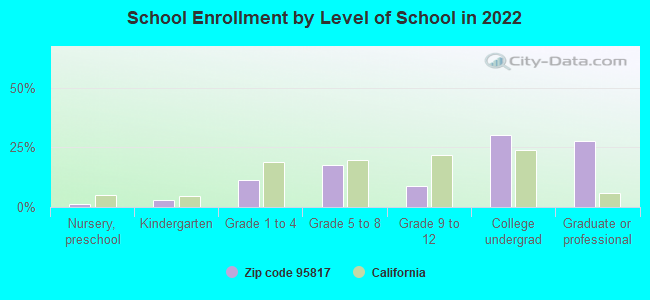
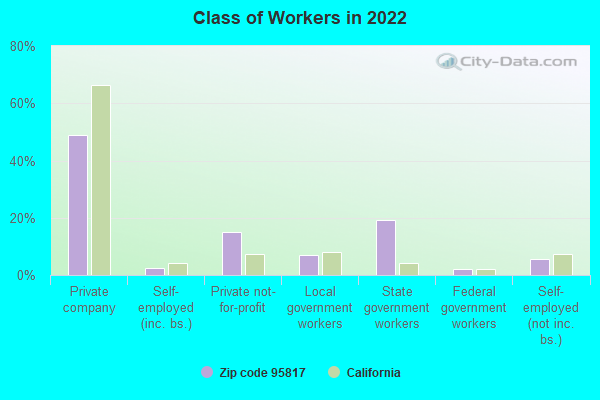
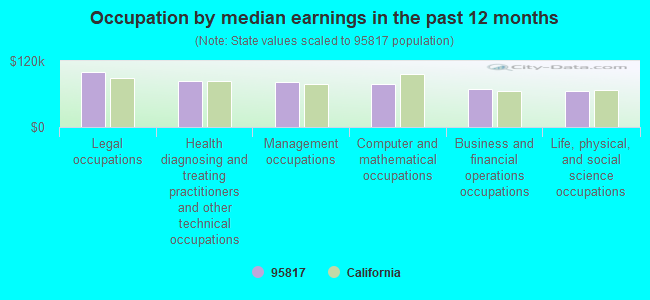
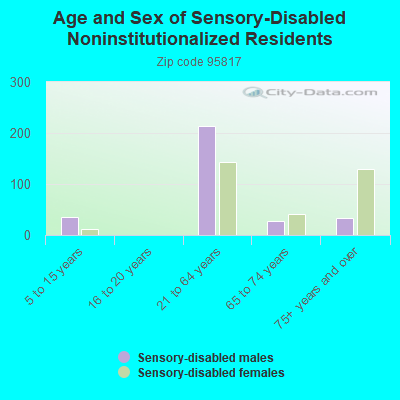
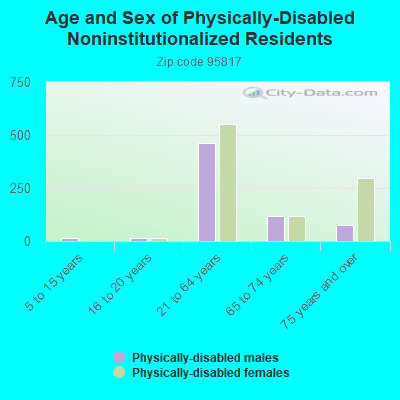
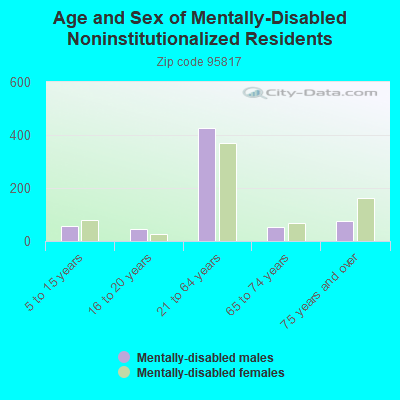
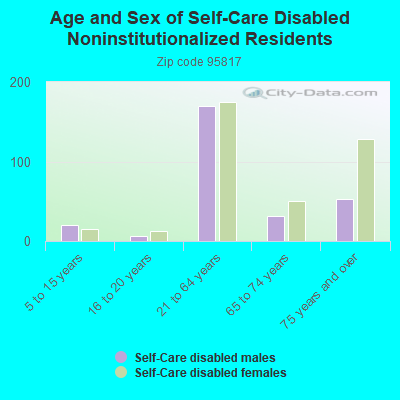
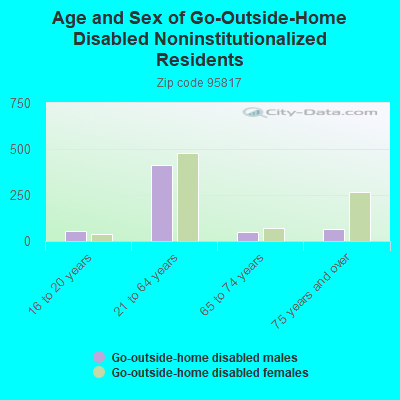
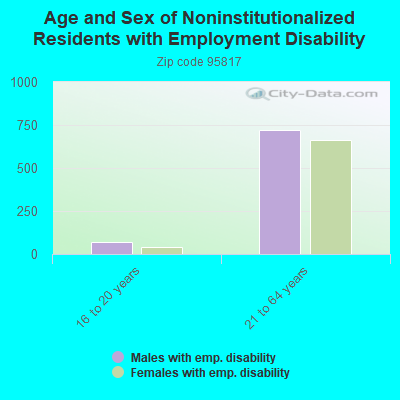
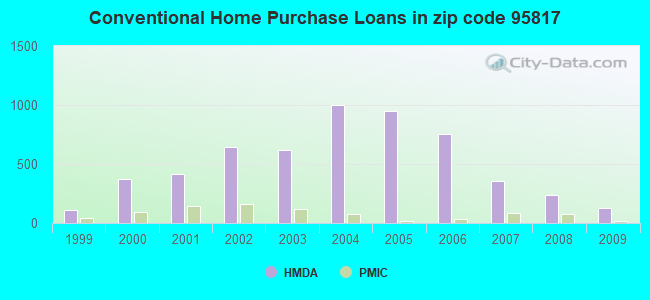
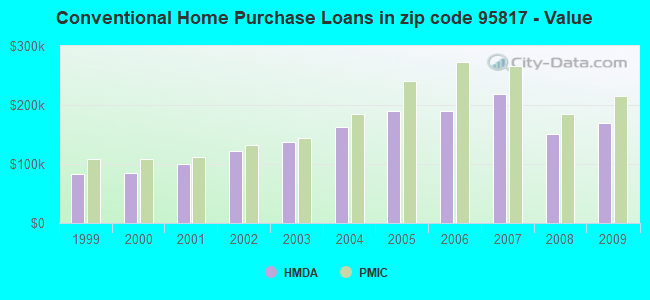
 According to the data from the years 2006 - 2018 the average number of fire incidents per year is 57. The highest number of fires - 104 took place in 2018, and the least - 34 in 2010. The data has an increasing trend.
 When looking into fire subcategories, the most incidents belonged to: Outside Fires (54.2%), and Structure Fires (24.4%).