Estimated zip code population in 2022: 18,181 Zip code population in 2010: 15,579 Zip code population in 2000: 16,157
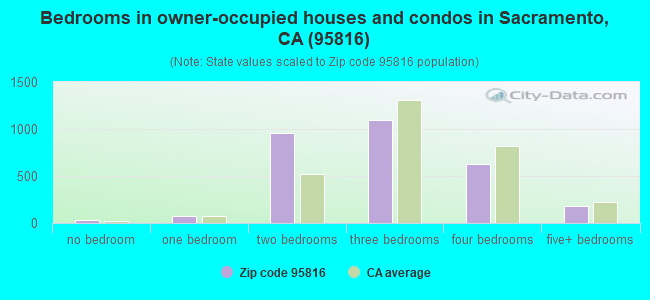
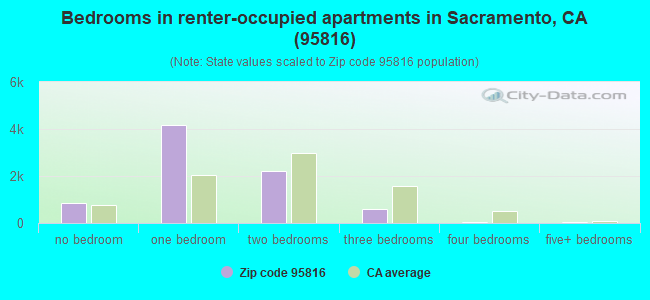
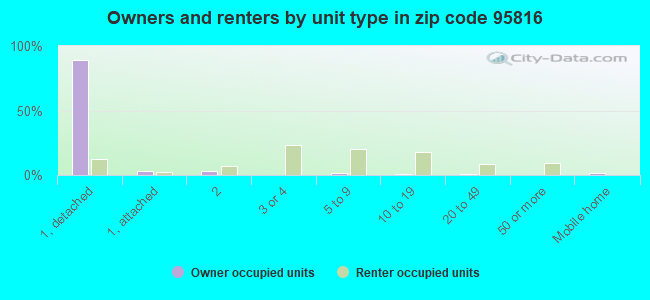
Houses and condos: 11,278 Renter-occupied apartments: 7,930
% of renters here:
73%
State:
44%
March 2022 cost of living index in zip code 95816: 105.4 (more than average, U.S. average is 100)
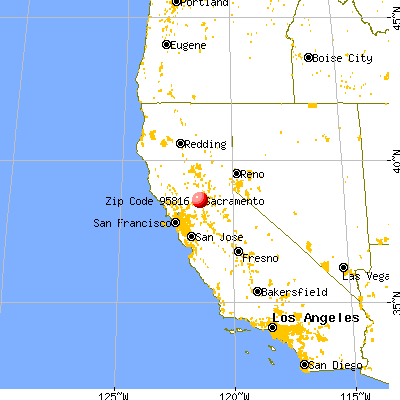
Land area: 2.0 sq. mi. Water area: 0.0 sq. mi.
Population density: 8,882 people per square mile
(high).
OSM Map
General Map
Google Map
MSN Map
OSM Map
General Map
Google Map
MSN Map
OSM Map
General Map
Google Map
MSN Map
OSM Map
General Map
Google Map
MSN Map
Please wait while loading the map...
Real estate property taxes paid for housing units in 2022:
This zip code:
0.7% ($5,387)
California:
0.7% ($4,831)
Median real estate property taxes paid for housing units with mortgages in 2022: $6,678 (0.8%) Median real estate property taxes paid for housing units with no mortgage in 2022: $2,577 (0.4%)
Averages for the 2020 tax year for zip code 95816, filed in 2021:
Average Adjusted Gross Income (AGI) in 2020: $92,300 (Individual Income Tax Returns)
Here:
$92,300
State:
$95,910
Salary/wage: $79,502 (reported on 83.0% of returns)
Here:
$79,502
State:
$77,331
(% of AGI for various income ranges: 1227.6% for AGIs below $25k, 4211.7% for AGIs $25k-50k, 7127.3% for AGIs $50k-75k, 11086.9% for AGIs $75k-100k, 20268.1% for AGIs $100k-200k, 83148.4% for AGIs over 200k)
Taxable interest for individuals: $1,340 (reported on 37.4% of returns)
This zip code:
$1,340
California:
$2,294
(% of AGI for various income ranges: 11.4% for AGIs below $25k, 19.6% for AGIs $25k-50k, 31.9% for AGIs $50k-75k, 49.5% for AGIs $75k-100k, 133.4% for AGIs $100k-200k, 943.9% for AGIs over 200k)
Ordinary dividends: $5,421 (reported on 24.6% of returns)
Here:
$5,421
State:
$10,949
(% of AGI for various income ranges: 29.3% for AGIs below $25k, 41.2% for AGIs $25k-50k, 80.0% for AGIs $50k-75k, 168.4% for AGIs $75k-100k, 392.0% for AGIs $100k-200k, 2411.6% for AGIs over 200k)
Net capital gain/loss in AGI: +$17,917 (reported on 23.1% of returns)
Here:
+$17,917
State:
+$49,306
(% of AGI for various income ranges: 19.1% for AGIs below $25k, 32.5% for AGIs $25k-50k, 65.7% for AGIs $50k-75k, 256.2% for AGIs $75k-100k, 596.9% for AGIs $100k-200k, 11677.7% for AGIs over 200k)
Profit/loss from business: +$22,003 (reported on 15.8% of returns)
Here:
+$22,003
State:
+$15,671
(% of AGI for various income ranges: 167.6% for AGIs below $25k, 181.6% for AGIs $25k-50k, 171.9% for AGIs $50k-75k, 330.8% for AGIs $75k-100k, 721.7% for AGIs $100k-200k, 6692.9% for AGIs over 200k)
Taxable individual retirement arrangement distribution: $16,657 (reported on 6.6% of returns)
95816:
$16,657
California:
$23,505
(% of AGI for various income ranges: 48.6% for AGIs below $25k, 58.1% for AGIs $25k-50k, 99.6% for AGIs $50k-75k, 182.3% for AGIs $75k-100k, 426.9% for AGIs $100k-200k, 1137.1% for AGIs over 200k)
Self-employed (Keogh) retirement plans: $25,850 (reported on 1.1% of returns)
95816:
$25,850
California:
$30,163
(% of AGI for various income ranges: 13.2% for AGIs $25k-50k, 104.1% for AGIs $100k-200k, 622.6% for AGIs over 200k)
Total itemized deductions: $31,637 (reported on 15.5% of returns)
Here:
$31,637
State:
$39,517
(% of AGI for various income ranges: 99.1% for AGIs below $25k, 171.9% for AGIs $25k-50k, 271.7% for AGIs $50k-75k, 795.8% for AGIs $75k-100k, 1731.1% for AGIs $100k-200k, 7627.4% for AGIs over 200k)
Charity contributions: $7,001 (reported on 12.1% of returns)
Here:
$7,001
State:
$12,598
(% of AGI for various income ranges: 3.6% for AGIs below $25k, 13.9% for AGIs $25k-50k, 29.6% for AGIs $50k-75k, 98.4% for AGIs $75k-100k, 261.0% for AGIs $100k-200k, 1769.4% for AGIs over 200k)
Taxes paid: $8,514 (reported on 15.3% of returns)
95816:
$8,514
State:
$8,807
(% of AGI for various income ranges: 10.6% for AGIs below $25k, 24.0% for AGIs $25k-50k, 64.0% for AGIs $50k-75k, 227.4% for AGIs $75k-100k, 587.6% for AGIs $100k-200k, 1863.9% for AGIs over 200k)
Earned income credit: $1,032 (reported on 6.8% of returns)
Here:
$1,032
State:
$2,074
(% of AGI for various income ranges: 35.9% for AGIs below $25k, 12.8% for AGIs $25k-50k)
Percentage of individuals using paid preparers for their 2020 taxes: 93.2%
Here:
93%
State:
92%
(% for various income ranges: 90.6% for AGIs below $25k, 93.4% for AGIs $25k-50k, 93.3% for AGIs $50k-75k, 93.4% for AGIs $75k-100k, 94.9% for AGIs $100k-200k, 95.0% for AGIs over 200k)
Averages for the 2012 tax year for zip code 95816, filed in 2013:
Average Adjusted Gross Income (AGI) in 2012: $63,150 (Individual Income Tax Returns)
Here:
$63,150
State:
$72,726
Salary/wage: $54,417 (reported on 84.4% of returns)
Here:
$54,417
State:
$59,079
(% of AGI for various income ranges: 76.7% for AGIs below $25k, 85.4% for AGIs $25k-50k, 83.8% for AGIs $50k-75k, 79.4% for AGIs $75k-100k, 76.0% for AGIs $100k-200k, 50.7% for AGIs over 200k)
Taxable interest for individuals: $1,412 (reported on 34.1% of returns)
This zip code:
$1,412
California:
$2,146
(% of AGI for various income ranges: 0.8% for AGIs below $25k, 0.5% for AGIs $25k-50k, 0.6% for AGIs $50k-75k, 0.5% for AGIs $75k-100k, 0.7% for AGIs $100k-200k, 1.2% for AGIs over 200k)
Ordinary dividends: $4,175 (reported on 19.3% of returns)
Here:
$4,175
State:
$9,308
(% of AGI for various income ranges: 1.6% for AGIs below $25k, 0.8% for AGIs $25k-50k, 0.9% for AGIs $50k-75k, 1.3% for AGIs $75k-100k, 1.5% for AGIs $100k-200k, 1.5% for AGIs over 200k)
Net capital gain/loss in AGI: +$5,952 (reported on 16.2% of returns)
Here:
+$5,952
State:
+$30,460
(% of AGI for various income ranges: 0.3% for AGIs $25k-50k, 0.4% for AGIs $50k-75k, 0.6% for AGIs $75k-100k, 1.7% for AGIs $100k-200k, 3.7% for AGIs over 200k)
Profit/loss from business: +$22,843 (reported on 14.7% of returns)
Here:
+$22,843
State:
+$17,064
(% of AGI for various income ranges: 7.2% for AGIs below $25k, 3.4% for AGIs $25k-50k, 3.1% for AGIs $50k-75k, 3.5% for AGIs $75k-100k, 3.7% for AGIs $100k-200k, 9.7% for AGIs over 200k)
Taxable individual retirement arrangement distribution: $15,489 (reported on 6.1% of returns)
95816:
$15,489
California:
$19,557
(% of AGI for various income ranges: 2.0% for AGIs below $25k, 1.0% for AGIs $25k-50k, 1.5% for AGIs $50k-75k, 1.5% for AGIs $75k-100k, 1.8% for AGIs $100k-200k, 1.5% for AGIs over 200k)
Self-employment retirement plans: $21,482 (reported on 1.1% of returns)
95816:
$21,482
California:
$24,530
(% of AGI for various income ranges: 0.3% for AGIs $50k-75k, 0.4% for AGIs $100k-200k, 0.9% for AGIs over 200k)
Total itemized deductions: $27,151 (21% of AGI, reported on 29.8% of returns)
Here:
$27,151
State:
$34,004
Here:
21.0% of AGI
State:
22.7% of AGI
(% of AGI for various income ranges: 10.9% for AGIs below $25k, 6.8% for AGIs $25k-50k, 9.2% for AGIs $50k-75k, 14.0% for AGIs $75k-100k, 16.6% for AGIs $100k-200k, 15.6% for AGIs over 200k)
Charity contributions: $3,198 (reported on 23.9% of returns)
Here:
$3,198
State:
$4,659
(% of AGI for various income ranges: 0.3% for AGIs below $25k, 0.5% for AGIs $25k-50k, 0.8% for AGIs $50k-75k, 1.3% for AGIs $75k-100k, 1.7% for AGIs $100k-200k, 1.6% for AGIs over 200k)
Taxes paid: $11,844 (reported on 29.7% of returns)
95816:
$11,844
State:
$14,448
(% of AGI for various income ranges: 1.4% for AGIs below $25k, 1.3% for AGIs $25k-50k, 2.7% for AGIs $50k-75k, 5.3% for AGIs $75k-100k, 7.4% for AGIs $100k-200k, 9.8% for AGIs over 200k)
Earned income credit: $1,080 (reported on 10.5% of returns)
Here:
$1,080
State:
$2,286
(% of AGI for various income ranges: 2.2% for AGIs below $25k, 0.2% for AGIs $25k-50k)
Percentage of individuals using paid preparers for their 2012 taxes: 41.4%
Here:
41%
State:
64%
(% for various income ranges: 36.0% for AGIs below $25k, 34.6% for AGIs $25k-50k, 39.9% for AGIs $50k-75k, 50.6% for AGIs $75k-100k, 58.1% for AGIs $100k-200k, 76.3% for AGIs over 200k)
Averages for the 2004 tax year for zip code 95816, filed in 2005:
Average Adjusted Gross Income (AGI) in 2004: $48,059 (Individual Income Tax Returns)
Here:
$48,059
State:
$58,600
Salary/wage: $42,092 (reported on 84.5% of returns)
Here:
$42,092
State:
$49,455
(% of AGI for various income ranges: 198.8% for AGIs below $10k, 81.1% for AGIs $10k-25k, 88.5% for AGIs $25k-50k, 83.2% for AGIs $50k-75k, 79.5% for AGIs $75k-100k, 55.0% for AGIs over 100k)
Taxable interest for individuals: $1,551 (reported on 42.2% of returns)
This zip code:
$1,551
California:
$2,365
(% of AGI for various income ranges: 11.1% for AGIs below $10k, 1.7% for AGIs $10k-25k, 0.9% for AGIs $25k-50k, 1.2% for AGIs $50k-75k, 1.0% for AGIs $75k-100k, 1.6% for AGIs over 100k)
Taxable dividends: $2,758 (reported on 21.6% of returns)
Here:
$2,758
State:
$4,746
(% of AGI for various income ranges: 11.4% for AGIs below $10k, 1.3% for AGIs $10k-25k, 0.6% for AGIs $25k-50k, 1.2% for AGIs $50k-75k, 1.5% for AGIs $75k-100k, 1.4% for AGIs over 100k)
Net capital gain/loss: +$12,522 (reported on 18.5% of returns)
Here:
+$12,522
State:
+$23,418
(% of AGI for various income ranges: -2.4% for AGIs below $10k, 0.3% for AGIs $10k-25k, 0.5% for AGIs $25k-50k, 0.7% for AGIs $50k-75k, 2.9% for AGIs $75k-100k, 11.3% for AGIs over 100k)
Profit/loss from business: +$21,226 (reported on 14.2% of returns)
Here:
+$21,226
State:
+$16,826
(% of AGI for various income ranges: 19.4% for AGIs below $10k, 5.2% for AGIs $10k-25k, 3.8% for AGIs $25k-50k, 2.9% for AGIs $50k-75k, 4.9% for AGIs $75k-100k, 9.9% for AGIs over 100k)
IRA payment deduction: $2,631 (reported on 2.2% of returns)
95816:
$2,631
California:
$3,192
(% of AGI for various income ranges: 1.0% for AGIs below $10k, 0.2% for AGIs $10k-25k, 0.2% for AGIs $25k-50k, 0.1% for AGIs $50k-75k, 0.1% for AGIs $75k-100k, 0.1% for AGIs over 100k)
Self-employed pension: $17,650 (reported on 1.7% of returns)
Here:
$17,650
California:
$17,688
(% of AGI for various income ranges: 0.2% for AGIs $10k-25k, 0.2% for AGIs $25k-50k, 0.2% for AGIs $50k-75k, 0.3% for AGIs $75k-100k, 1.3% for AGIs over 100k)
Total itemized deductions: $23,427 (24% of AGI, reported on 29.5% of returns)
Here:
$23,427
State:
$28,113
Here:
23.7% of AGI
State:
25.3% of AGI
(% of AGI for various income ranges: 59.8% for AGIs below $10k, 10.4% for AGIs $10k-25k, 8.7% for AGIs $25k-50k, 15.3% for AGIs $50k-75k, 19.1% for AGIs $75k-100k, 16.4% for AGIs over 100k)
Charity contributions deductions: $2,897 (3% of AGI, reported on 24.5% of returns)
Here:
$2,897
State:
$3,923
Here:
2.7% of AGI
State:
3.3% of AGI
(% of AGI for various income ranges: 1.1% for AGIs below $10k, 0.5% for AGIs $10k-25k, 0.7% for AGIs $25k-50k, 1.5% for AGIs $50k-75k, 2.0% for AGIs $75k-100k, 2.0% for AGIs over 100k)
Total tax: $8,122 (reported on 83.7% of returns)
95816:
$8,122
State:
$10,761
(% of AGI for various income ranges: 8.6% for AGIs below $10k, 5.7% for AGIs $10k-25k, 9.7% for AGIs $25k-50k, 12.3% for AGIs $50k-75k, 12.6% for AGIs $75k-100k, 20.4% for AGIs over 100k)
Earned income credit: $942 (reported on 9.2% of returns)
Here:
$942
State:
$1,763
Percentage of individuals using paid preparers for their 2004 taxes: 45.0%
Here:
45%
State:
66%
(% for various income ranges: 45.2% for AGIs below $10k, 40.7% for AGIs $10k-25k, 37.2% for AGIs $25k-50k, 49.2% for AGIs $50k-75k, 56.0% for AGIs $75k-100k, 72.3% for AGIs over 100k)
Likely homosexual households (counted as self-reported same-sex unmarried-partner households)
Lesbian couples: 0.3% of all households
Gay men: 0.3% of all households
Household received Food Stamps/SNAP in the past 12 months: 869 Household did not receive Food Stamps/SNAP in the past 12 months: 9,955
Women who had a birth in the past 12 months: 126 (125 now married, 0 unmarried) Women who did not have a birth in the past 12 months: 5,903 (1,519 now married, 4,418 unmarried)
Housing units in zip code 95816 with a mortgage: 1,901 (311 second mortgage, 253 both second mortgage and home equity loan) Houses without a mortgage: 31
Median monthly owner costs for units with a mortgage: $3,312 Median monthly owner costs for units without a mortgage: $663
Residents with income below the poverty level in 2022:
This zip code:
10.0%
Whole state:
12.2%
Residents with income below 50% of the poverty level in 2022:
This zip code:
4.6%
Whole state:
6.2%
Median number of rooms in houses and condos:
Here:
6.0
State:
6.0
Median number of rooms in apartments:
Here:
3.4
State:
3.9
Notable locations in this zip code not listed on our city pages
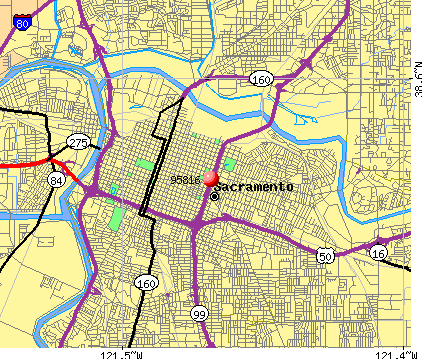
Notable locations in zip code 95816: Sacramento Area Council of Governments Library (A), Visionarium (B), Shepard Garden Art Center (C), McKinley Neighborhood Library (D), California State Indian Museum (E), Sacramento City Fire Department Station 4 (F). Display/hide their locations on the map
Churches in zip code 95816 include: Pioneer Memorial Congregational Church (A), Chinese Christian Center (B), Faith United Methodist Church (C), First Christian Church (D), Greek Orthodox Church of the Annunciation (E), Sacred Heart Roman Catholic Church (F), Saint James Armenian Church (G), First Church of the Nazarene (H), Trinity Lutheran Church (I). Display/hide their locations on the map
Parks in zip code 95816 include: McKinley Park (1), Stanford Playground (2), Sutter's Fort State Historic Park (3), Winn Park (4), Grant Playground (5), Lubin School Park (6), Marshall Park (7). Display/hide their locations on the map
1,009 married couples with children.
197 single-parent households (76 men, 121 women).
84.7% of residents of 95816 zip code speak English at home.
9.3% of residents speak Spanish at home (79% very well, 13% well, 5% not well, 4% not at all).
2.0% of residents speak other Indo-European language at home (89% very well, 8% well, 3% not well).
2.8% of residents speak Asian or Pacific Island language at home (73% very well, 26% well, 2% not well).
0.4% of residents speak other language at home (94% very well, 3% well, 4% not at all).
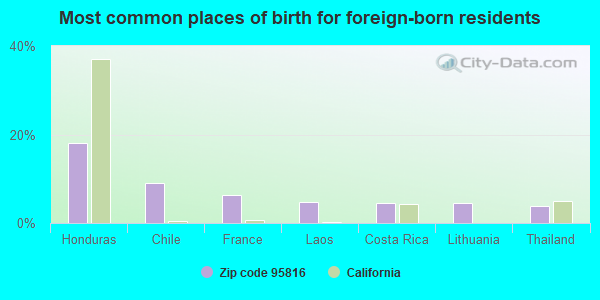
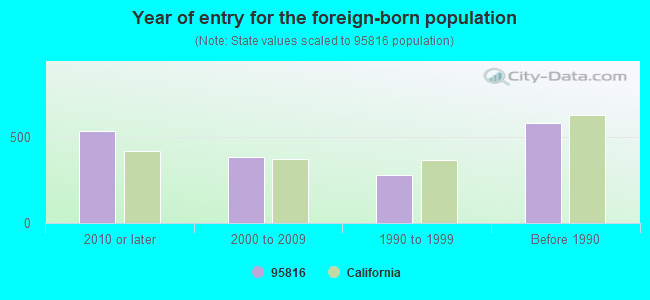
Foreign born population: 1,398 (7.7%) (51.5% of them are naturalized citizens)
Major facilities with environmental interests located in this zip code:
ALHAMBRA DRY CLEANERS (1000 ALHAMBRA BLVD in SACRAMENTO, CA)
STATE MASTER (California - Hazardous Waste Tracking) - HAZARDOU WASTE PROGRAM CRITERIA AND HAZARDOUS AIR POLLUTANT INVENTORY (Inventory of air pollution sources) Small Quantity Generators, between 100 kg and 1000 kg of hazardous waste/month (Resource Conservation and Recovery Act (tracking hazardous waste)) Business SIC classification: DRYCLEANING PLANTS, EXCEPT RUG CLEANING Alternative names: ONE HOUR MARTINIZING
GLEN COX CHEVRON (430 29TH STREET in SACRAMENTO, CA)
STATE MASTER (California - Hazardous Waste Tracking) - HAZARDOU WASTE PROGRAM Small Quantity Generators, between 100 kg and 1000 kg of hazardous waste/month (Resource Conservation and Recovery Act (tracking hazardous waste)) - notification Organizations: COX GLEN (CONTACT/OWNER)
JAY STREET AUTOMOTIVE (2321 JAY ST in SACRAMENTO, CA)
STATE MASTER (California - Hazardous Waste Tracking) - HAZARDOU WASTE PROGRAM Small Quantity Generators, between 100 kg and 1000 kg of hazardous waste/month (Resource Conservation and Recovery Act (tracking hazardous waste)) - notification Business NAICS classification: GENERAL AUTOMOTIVE REPAIR. Organizations: HOWARD DANIEL J (CONTACT/OWNER)
JIFFY LUBE #1463 (3000 CAPITOL AVE in SACRAMENTO, CA)
(Resource Conservation and Recovery Act (tracking hazardous waste)) STATE MASTER (California - Used Oil Recycling System ) - USED OIL RECYCLING Alternative names: UNOCAL SERVICE STATION #5036
CHROME CRAFT (1819 23RD STREET in SACRAMENTO, CA)
STATE MASTER (California - Hazardous Waste Tracking) - HAZARDOU WASTE PROGRAM CRITERIA AND HAZARDOUS AIR POLLUTANT INVENTORY (Inventory of air pollution sources) Small Quantity Generators, between 100 kg and 1000 kg of hazardous waste/month (Resource Conservation and Recovery Act (tracking hazardous waste)) - notification Business SIC classification: ELECTROPLATING, PLATING, POLISHING, ANODIZING, AND COLORING Organizations: MENCARINI AND JARWIN INC (CONTACT/OWNER)
EQUILON ENTERPRISES LLC (730 29TH ST in SACRAMENTO, CA) . Federal Facility
STATE MASTER (California - Hazardous Waste Tracking) - HAZARDOU WASTE PROGRAM Small Quantity Generators, between 100 kg and 1000 kg of hazardous waste/month (Resource Conservation and Recovery Act (tracking hazardous waste)) - notification Organizations: EQUILON ENTERPRISES, LLC (CONTACT/OWNER)
Alternative names: SHELL OIL CO
MERCY MEDICAL FOUNDATION OF SACRAMENTO (3160 FOLSOM BLVD in SACRAMENTO, CA)
STATE MASTER (California - Hazardous Waste Tracking) - HAZARDOU WASTE PROGRAM Small Quantity Generators, between 100 kg and 1000 kg of hazardous waste/month (Resource Conservation and Recovery Act (tracking hazardous waste)) - notification Organizations: JOHN GORMAN (CONTACT/OWNER)
Alternative names: CHW MEDICAL FOUNDATION DBA/MED CLINIC
LUBIN (DAVID) ELEMENTARY (3535 M ST. in SACRAMENTO, CA)
(National Center for Education Statistics) - STATE ID-6033880 Organizations: SACRAMENTO CITY UNIFIED (SCHOOL DISTRICT)
AMERICAN PLATING WORKS (2822 SOUTH STREET in SACRAMENTO, CA)
CRITERIA AND HAZARDOUS AIR POLLUTANT INVENTORY (Inventory of air pollution sources) Small Quantity Generators, between 100 kg and 1000 kg of hazardous waste/month (Resource Conservation and Recovery Act (tracking hazardous waste)) - notification Business SIC classification: ELECTROPLATING, PLATING, POLISHING, ANODIZING, AND COLORING Organizations: LARRY AND DELTA CARLTON (CONTACT/OWNER)
IMAAGING CENTERS OF SACRAMENTO (2801 K ST STE 115 in SACRAMENTO, CA)
Small Quantity Generators, between 100 kg and 1000 kg of hazardous waste/month (Resource Conservation and Recovery Act (tracking hazardous waste)) - notification Small Quantity Generators, between 100 kg and 1000 kg of hazardous waste/month (Resource Conservation and Recovery Act (tracking hazardous waste)) - notification Organizations: FORT SUTTER GOVERNING CORP (CONTACT/OWNER)
Alternative names: IMAGING CENTERS OF SACRAMENTO
CAPITAL TANK AND CONSTRUCTION (2518 B ST in SACRAMENTO, CA)
Small Quantity Generators, between 100 kg and 1000 kg of hazardous waste/month (Resource Conservation and Recovery Act (tracking hazardous waste)) - notification TRANSPORTER (Resource Conservation and Recovery Act (tracking hazardous waste)) - notification Organizations: MIKE HURLEY (CONTACT/OWNER)
, WANDA HAZEN (CONTACT/OWNER)
HEINRICH PROPERTY MANAGEMENT (2614 I STREET in SACRAMENTO, CA)
COMPLIANCE ACTIVITY (Tracking inspections of insecticide, fungicide, and rodenticide, and toxic substances)
IMAGING CENTERS OF SACRAMENTO (2801 CAPITOL AVE STE 150 in SACRAMENTO, CA)
Small Quantity Generators, between 100 kg and 1000 kg of hazardous waste/month (Resource Conservation and Recovery Act (tracking hazardous waste)) - notification Organizations: FORT SUTTER GOVERNING CORP (CONTACT/OWNER)
Housing units lacking complete plumbing facilities: 0.8% Housing units lacking complete kitchen facilities: 1.9%
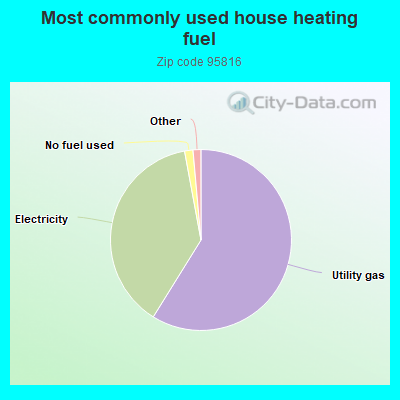
58.8%Utility gas
38.2%Electricity
1.5%No fuel used
0.9%Bottled, tank, or LP gas
0.6%Solar energy
Population in 1990: 16,211.
Place of birth for U.S.-born residents:
This state: 11,928
Northeast: 863
Midwest: 1,398
South: 1,114
West: 1,028
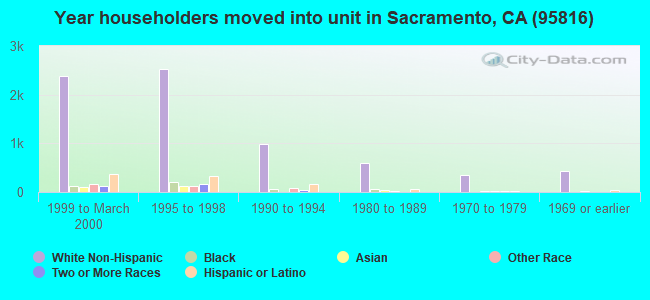
36% of the 95816 zip code residents lived in the same house 5 years ago. Out of people who lived in different houses, 58% lived in this county. Out of people who lived in different counties, 50% lived in California.
76% of the 95816 zip code residents lived in the same house 1 year ago. Out of people who lived in different houses, 48% moved from this county. Out of people who lived in different houses, 39% moved from different county within same state. Out of people who lived in different houses, 8% moved from different state. Out of people who lived in different houses, 2% moved from abroad.
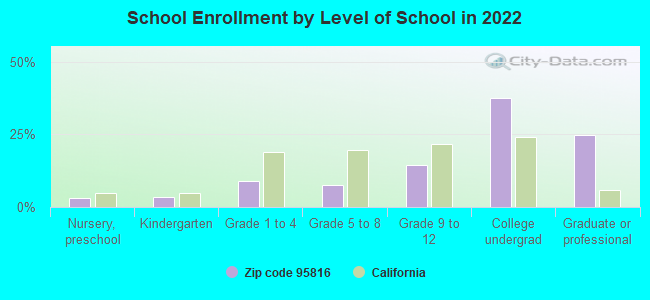
Private vs. public school enrollment:
Students in private schools in grades 1 to 8 (elementary and middle school): 136
Here:
30.6%
California:
10.5%
Students in private schools in grades 9 to 12 (high school): 167
Here:
44.0%
California:
8.5%
Students in private undergraduate colleges: 69
Here:
7.0%
California:
15.9%
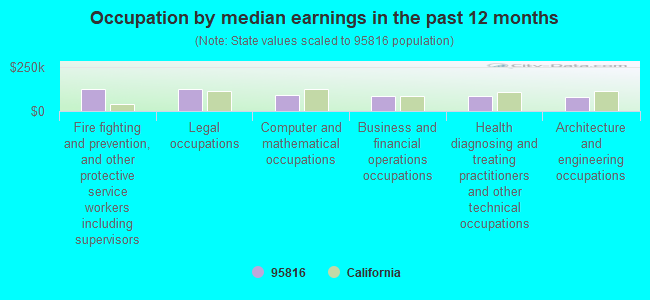
Occupation by median earnings in the past 12 months ($)
125,660Fire fighting and prevention, and other protective service workers including supervisors
123,980Legal occupations
89,944Computer and mathematical occupations
85,308Business and financial operations occupations
85,056Health diagnosing and treating practitioners and other technical occupations
81,565Architecture and engineering occupations
Companies with federal contracts located in this zip code (SACRAMENTO, CA):
DEAN F UNGER AIA INCORPORATED (700 ALHAMBRA BLVD) : $974,153 in 9 contractsfrom 2002 to 2004
Contracts for Architect - Engineer Services (including landscaping, interior layout, and designing), Engineering Drafting Services, Airfield, Communication and Missile Facilities by Army Signed by year:2000: $0; 2001: $0; 2002: $768,841; 2003: $53,212; 2004: $152,100; 2005: $0; 2006: $0.
Biggest contracts:
$669,325 with Army for Architect - Engineer Services (including landscaping, interior layout, and designing). Signed on 2002-05-16. Completion date: 2003-03-31.
$132,410, same as above.Signed on 2004-02-27. Completion date: 2004-02-02.
$53,212, same as above.Signed on 2003-04-06. Completion date: 2003-08-05.
$39,483 with Army for Engineering Drafting Services. Signed on 2002-07-12. Completion date: 2002-10-10.
SACRAMENTO MEDICAL FOUNDATION (1625 STOCKTON BLVD) : $774,209 in 7 contractsfrom 2001 to 2005
Contracts for Drugs and Biologicals, Medical and Surgical Instruments, Equipment, and Supplies, Blood Derivatives by Department of Veterans Affairs, Navy Signed by year:2000: $0; 2001: $362,659; 2002: $0; 2003: $111,550; 2004: $200,000; 2005: $100,000; 2006: $0.
Biggest contracts:
$252,659 with Department of Veterans Affairs for Drugs and Biologicals. Signed on 2001-05-03. Effective on 2001-05-15. Completion date: 2005-05-14.
$111,550, same as above.Signed on 2003-05-15. Completion date: 2004-05-15.
$110,000 with Department of Veterans Affairs for Medical and Surgical Instruments, Equipment, and Supplies. Signed on 2001-05-15. Completion date: 2002-04-15.
$100,000 with Navy for Blood Derivatives. Signed on 2005-10-17. Completion date: 2006-09-30.
TRANSPORTATION, CALIFORNIA DEP (1820 ALHAMBRA BLVD) : $230,460 in 6 contractsfrom 2004 to 2006
Contracts for Other Administrative Support Services, Technical Assistance, Lease or Rental of Equipment -- Construction, Mining, Excavating, and Highway Maintenance Equipment, Other Transportation Travel and Relocation Services by Bureau of Land Management, Smithsonian Institution, except units administered under separate Board of Trustees, Army Signed by year:2000: $0; 2001: $0; 2002: $0; 2003: $0; 2004: $124,000; 2005: $90,460; 2006: $16,000.
Biggest contracts:
$99,000 with Bureau of Land Management for Other Administrative Support Services. Signed on 2004-06-07. Completion date: 2005-09-30.
$90,460 with Smithsonian Institution, except units administered under separate Board of Trustees for Technical Assistance. Taking place in DC. Signed on 2005-02-24. Effective on 2004-12-01. Completion date: 2005-09-30.
$20,000, same as above.Signed on 2004-10-12. Effective on 2004-10-01. Completion date: 2005-09-30.
$16,000 with Army for Lease or Rental of Equipment -- Construction, Mining, Excavating, and Highway Maintenance Equipment. Signed on 2006-05-19. Completion date: 2006-09-30.
WORKSMART AUTOMATION (3112 O ST STE 11; small business) : $80,926 in 2 contractsfrom 2005 to 2006
$69,750 with Navy for Maintenance, Repair and Rebuilding of Equipment -- Water Purification and Sewage Treatment Equipment. Signed on 2005-12-15. Completion date: 2006-01-17.
$11,176, same as above.Signed on 2006-05-08. Completion date: 2006-06-08.
CAPTAIN CALCULATOR INC (2828 Q ST; small business) : $13,350 in 4 contractsfrom 2002 to 2004
$8,820 with Department of Defense for Miscellaneous Items. Signed on 2002-05-29. Completion date: 2003-05-31.
$3,510 with Army for ADP Support Equipment. Signed on 2004-04-30. Completion date: 2004-05-21.
$510, same as above.Signed on 2003-12-11. Completion date: 2003-12-23.
$510 with U.S. Army Corps of Engineers - civil program financing only for ADP Support Equipment. Signed on 2003-12-11. Completion date: 2003-12-23.
Top industries in this zip code by the number of employees in 2005:
Health Care and Social Assistance: Offices of Physicians (except Mental Health Specialists) (250-499 employees: 3 establishments, 100-249 employees: 1 establishment, 50-99 employees: 5 establishments, 20-49 employees: 7 establishments, 10-19 employees: 8 establishments, 5-9 employees: 13 establishments, 1-4 employees: 25 establishments)
2006 - 2018 National Fire Incident Reporting System (NFIRS) incidents
According to the data from the years 2006 - 2018 the average number of fire incidents per year is 82. The highest number of fires - 138 took place in 2017, and the least - 62 in 2009. The data has an increasing trend.
When looking into fire subcategories, the most incidents belonged to: Outside Fires (60.2%), and Structure Fires (19.9%).
Fire incident types reported to NFIRS in Zip Code 95816


 Nearest zip codes: 95811, 95817, 95819, 95814, 95818, 95815.


 According to the data from the years 2006 - 2018 the average number of fire incidents per year is 82. The highest number of fires - 138 took place in 2017, and the least - 62 in 2009. The data has an increasing trend.
 When looking into fire subcategories, the most incidents belonged to: Outside Fires (60.2%), and Structure Fires (19.9%).