Estimated zip code population in 2022: 46,027 Zip code population in 2010: 42,347 Zip code population in 2000: 44,678
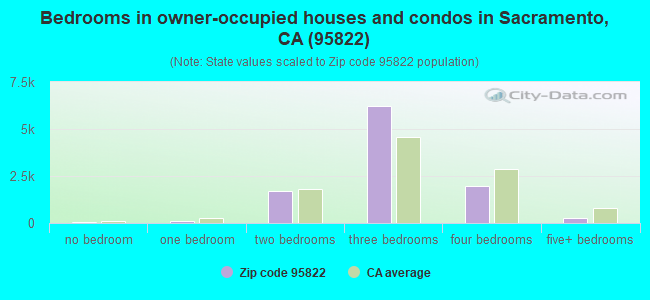
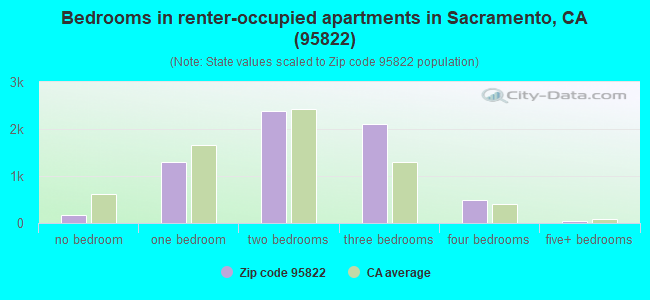
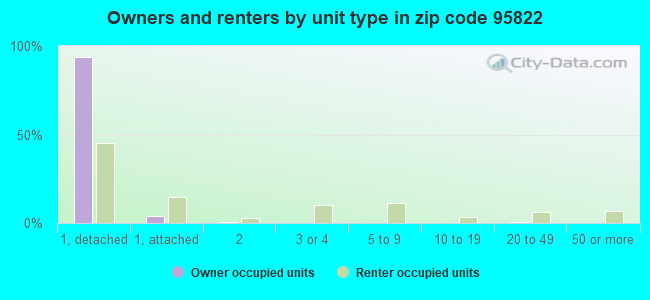
Houses and condos: 17,557 Renter-occupied apartments: 6,529
% of renters here:
39%
State:
44%
March 2022 cost of living index in zip code 95822: 101.0 (near average, U.S. average is 100)
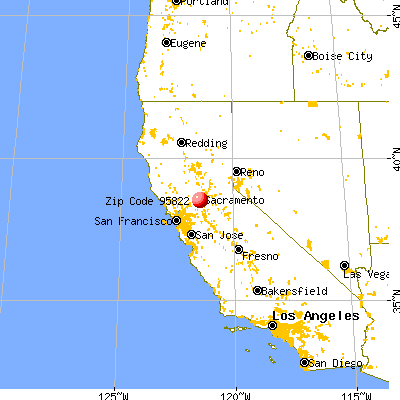
Land area: 8.4 sq. mi. Water area: 0.1 sq. mi.
Population density: 5,449 people per square mile
(average).
OSM Map
General Map
Google Map
MSN Map
OSM Map
General Map
Google Map
MSN Map
OSM Map
General Map
Google Map
MSN Map
OSM Map
General Map
Google Map
MSN Map
Please wait while loading the map...
Real estate property taxes paid for housing units in 2022:
This zip code:
0.6% ($2,744)
California:
0.7% ($4,831)
Median real estate property taxes paid for housing units with mortgages in 2022: $3,311 (0.7%) Median real estate property taxes paid for housing units with no mortgage in 2022: $1,880 (0.4%)
Averages for the 2020 tax year for zip code 95822, filed in 2021:
Average Adjusted Gross Income (AGI) in 2020: $60,693 (Individual Income Tax Returns)
Here:
$60,693
State:
$95,910
Salary/wage: $51,838 (reported on 79.1% of returns)
Here:
$51,838
State:
$77,331
(% of AGI for various income ranges: 1171.5% for AGIs below $25k, 3929.0% for AGIs $25k-50k, 7314.8% for AGIs $50k-75k, 9979.8% for AGIs $75k-100k, 17891.7% for AGIs $100k-200k, 64510.0% for AGIs over 200k)
Taxable interest for individuals: $1,023 (reported on 34.8% of returns)
This zip code:
$1,023
California:
$2,294
(% of AGI for various income ranges: 10.2% for AGIs below $25k, 14.7% for AGIs $25k-50k, 38.2% for AGIs $50k-75k, 82.9% for AGIs $75k-100k, 204.2% for AGIs $100k-200k, 934.5% for AGIs over 200k)
Ordinary dividends: $5,296 (reported on 14.5% of returns)
Here:
$5,296
State:
$10,949
(% of AGI for various income ranges: 13.6% for AGIs below $25k, 21.6% for AGIs $25k-50k, 79.8% for AGIs $50k-75k, 158.1% for AGIs $75k-100k, 427.5% for AGIs $100k-200k, 2610.0% for AGIs over 200k)
Net capital gain/loss in AGI: +$14,774 (reported on 14.1% of returns)
Here:
+$14,774
State:
+$49,306
(% of AGI for various income ranges: 5.7% for AGIs below $25k, 15.5% for AGIs $25k-50k, 66.3% for AGIs $50k-75k, 168.4% for AGIs $75k-100k, 665.1% for AGIs $100k-200k, 14805.0% for AGIs over 200k)
Profit/loss from business: +$12,566 (reported on 14.4% of returns)
Here:
+$12,566
State:
+$15,671
(% of AGI for various income ranges: 114.1% for AGIs below $25k, 112.6% for AGIs $25k-50k, 154.7% for AGIs $50k-75k, 273.4% for AGIs $75k-100k, 652.4% for AGIs $100k-200k, 6243.2% for AGIs over 200k)
Taxable individual retirement arrangement distribution: $17,170 (reported on 6.0% of returns)
95822:
$17,170
California:
$23,505
(% of AGI for various income ranges: 27.3% for AGIs below $25k, 45.7% for AGIs $25k-50k, 92.0% for AGIs $50k-75k, 220.4% for AGIs $75k-100k, 622.4% for AGIs $100k-200k, 2777.7% for AGIs over 200k)
Self-employed (Keogh) retirement plans: $22,725 (reported on 0.5% of returns)
95822:
$22,725
California:
$30,163
(% of AGI for various income ranges: 3.9% for AGIs $25k-50k, 50.9% for AGIs $100k-200k, 848.6% for AGIs over 200k)
Total itemized deductions: $27,587 (reported on 10.4% of returns)
Here:
$27,587
State:
$39,517
(% of AGI for various income ranges: 39.1% for AGIs below $25k, 130.0% for AGIs $25k-50k, 414.7% for AGIs $50k-75k, 869.0% for AGIs $75k-100k, 1545.9% for AGIs $100k-200k, 6725.0% for AGIs over 200k)
Charity contributions: $5,727 (reported on 8.2% of returns)
Here:
$5,727
State:
$12,598
(% of AGI for various income ranges: 2.7% for AGIs below $25k, 15.5% for AGIs $25k-50k, 46.3% for AGIs $50k-75k, 99.3% for AGIs $75k-100k, 263.3% for AGIs $100k-200k, 1665.0% for AGIs over 200k)
Taxes paid: $7,721 (reported on 10.4% of returns)
95822:
$7,721
State:
$8,807
(% of AGI for various income ranges: 6.5% for AGIs below $25k, 27.9% for AGIs $25k-50k, 112.7% for AGIs $50k-75k, 276.8% for AGIs $75k-100k, 507.1% for AGIs $100k-200k, 1545.0% for AGIs over 200k)
Earned income credit: $2,261 (reported on 18.4% of returns)
Here:
$2,261
State:
$2,074
(% of AGI for various income ranges: 114.6% for AGIs below $25k, 80.6% for AGIs $25k-50k, 1.2% for AGIs $50k-75k)
Percentage of individuals using paid preparers for their 2020 taxes: 90.1%
Here:
90%
State:
92%
(% for various income ranges: 89.6% for AGIs below $25k, 90.3% for AGIs $25k-50k, 88.9% for AGIs $50k-75k, 90.1% for AGIs $75k-100k, 91.4% for AGIs $100k-200k, 93.5% for AGIs over 200k)
Averages for the 2012 tax year for zip code 95822, filed in 2013:
Average Adjusted Gross Income (AGI) in 2012: $47,590 (Individual Income Tax Returns)
Here:
$47,590
State:
$72,726
Salary/wage: $40,255 (reported on 77.3% of returns)
Here:
$40,255
State:
$59,079
(% of AGI for various income ranges: 69.3% for AGIs below $25k, 77.9% for AGIs $25k-50k, 69.7% for AGIs $50k-75k, 63.1% for AGIs $75k-100k, 63.1% for AGIs $100k-200k, 44.2% for AGIs over 200k)
Taxable interest for individuals: $1,096 (reported on 35.6% of returns)
This zip code:
$1,096
California:
$2,146
(% of AGI for various income ranges: 0.8% for AGIs below $25k, 0.5% for AGIs $25k-50k, 0.7% for AGIs $50k-75k, 0.9% for AGIs $75k-100k, 1.0% for AGIs $100k-200k, 1.3% for AGIs over 200k)
Ordinary dividends: $4,836 (reported on 16.2% of returns)
Here:
$4,836
State:
$9,308
(% of AGI for various income ranges: 1.3% for AGIs below $25k, 0.8% for AGIs $25k-50k, 1.4% for AGIs $50k-75k, 1.6% for AGIs $75k-100k, 2.0% for AGIs $100k-200k, 2.9% for AGIs over 200k)
Net capital gain/loss in AGI: +$4,198 (reported on 12.6% of returns)
Here:
+$4,198
State:
+$30,460
(% of AGI for various income ranges: 0.2% for AGIs $50k-75k, 0.5% for AGIs $75k-100k, 1.2% for AGIs $100k-200k, 5.4% for AGIs over 200k)
Profit/loss from business: +$11,997 (reported on 14.4% of returns)
Here:
+$11,997
State:
+$17,064
(% of AGI for various income ranges: 10.3% for AGIs below $25k, 2.5% for AGIs $25k-50k, 1.7% for AGIs $50k-75k, 2.4% for AGIs $75k-100k, 3.3% for AGIs $100k-200k, 4.4% for AGIs over 200k)
Taxable individual retirement arrangement distribution: $12,430 (reported on 8.8% of returns)
95822:
$12,430
California:
$19,557
(% of AGI for various income ranges: 2.1% for AGIs below $25k, 1.3% for AGIs $25k-50k, 2.1% for AGIs $50k-75k, 3.0% for AGIs $75k-100k, 3.3% for AGIs $100k-200k, 1.9% for AGIs over 200k)
Self-employment retirement plans: $16,873 (reported on 0.6% of returns)
95822:
$16,873
California:
$24,530
(% of AGI for various income ranges: 0.3% for AGIs $50k-75k, 0.2% for AGIs $100k-200k, 0.7% for AGIs over 200k)
Total itemized deductions: $21,343 (23% of AGI, reported on 27.6% of returns)
Here:
$21,343
State:
$34,004
Here:
22.7% of AGI
State:
22.7% of AGI
(% of AGI for various income ranges: 7.4% for AGIs below $25k, 9.4% for AGIs $25k-50k, 12.2% for AGIs $50k-75k, 14.2% for AGIs $75k-100k, 16.2% for AGIs $100k-200k, 13.2% for AGIs over 200k)
Charity contributions: $2,797 (reported on 22.8% of returns)
Here:
$2,797
State:
$4,659
(% of AGI for various income ranges: 0.5% for AGIs below $25k, 0.9% for AGIs $25k-50k, 1.2% for AGIs $50k-75k, 1.6% for AGIs $75k-100k, 1.9% for AGIs $100k-200k, 1.6% for AGIs over 200k)
Taxes paid: $7,439 (reported on 27.4% of returns)
95822:
$7,439
State:
$14,448
(% of AGI for various income ranges: 1.2% for AGIs below $25k, 1.8% for AGIs $25k-50k, 3.3% for AGIs $50k-75k, 4.7% for AGIs $75k-100k, 6.5% for AGIs $100k-200k, 7.7% for AGIs over 200k)
Earned income credit: $2,477 (reported on 25.1% of returns)
Here:
$2,477
State:
$2,286
(% of AGI for various income ranges: 9.3% for AGIs below $25k, 1.4% for AGIs $25k-50k)
Percentage of individuals using paid preparers for their 2012 taxes: 54.5%
Here:
55%
State:
64%
(% for various income ranges: 53.1% for AGIs below $25k, 53.0% for AGIs $25k-50k, 54.0% for AGIs $50k-75k, 60.3% for AGIs $75k-100k, 59.7% for AGIs $100k-200k, 69.0% for AGIs over 200k)
Averages for the 2004 tax year for zip code 95822, filed in 2005:
Average Adjusted Gross Income (AGI) in 2004: $40,024 (Individual Income Tax Returns)
Here:
$40,024
State:
$58,600
Salary/wage: $34,705 (reported on 79.5% of returns)
Here:
$34,705
State:
$49,455
(% of AGI for various income ranges: 94.1% for AGIs below $10k, 74.1% for AGIs $10k-25k, 79.1% for AGIs $25k-50k, 71.6% for AGIs $50k-75k, 66.5% for AGIs $75k-100k, 53.1% for AGIs over 100k)
Taxable interest for individuals: $1,405 (reported on 46.9% of returns)
This zip code:
$1,405
California:
$2,365
(% of AGI for various income ranges: 3.9% for AGIs below $10k, 1.9% for AGIs $10k-25k, 1.3% for AGIs $25k-50k, 1.6% for AGIs $50k-75k, 1.6% for AGIs $75k-100k, 1.8% for AGIs over 100k)
Taxable dividends: $3,123 (reported on 20.0% of returns)
Here:
$3,123
State:
$4,746
(% of AGI for various income ranges: 3.2% for AGIs below $10k, 1.2% for AGIs $10k-25k, 0.8% for AGIs $25k-50k, 1.5% for AGIs $50k-75k, 1.7% for AGIs $75k-100k, 2.4% for AGIs over 100k)
Net capital gain/loss: +$10,983 (reported on 15.8% of returns)
Here:
+$10,983
State:
+$23,418
(% of AGI for various income ranges: -1.0% for AGIs below $10k, 0.0% for AGIs $10k-25k, 0.2% for AGIs $25k-50k, 0.8% for AGIs $50k-75k, 2.1% for AGIs $75k-100k, 15.3% for AGIs over 100k)
Profit/loss from business: +$11,948 (reported on 12.0% of returns)
Here:
+$11,948
State:
+$16,826
(% of AGI for various income ranges: 10.5% for AGIs below $10k, 4.1% for AGIs $10k-25k, 1.8% for AGIs $25k-50k, 2.2% for AGIs $50k-75k, 3.4% for AGIs $75k-100k, 6.0% for AGIs over 100k)
IRA payment deduction: $2,842 (reported on 1.8% of returns)
95822:
$2,842
California:
$3,192
(% of AGI for various income ranges: 0.1% for AGIs below $10k, 0.2% for AGIs $10k-25k, 0.2% for AGIs $25k-50k, 0.1% for AGIs $50k-75k, 0.1% for AGIs $75k-100k, 0.1% for AGIs over 100k)
Self-employed pension: $15,013 (reported on 0.8% of returns)
Here:
$15,013
California:
$17,688
(% of AGI for various income ranges: 0.1% for AGIs $25k-50k, 0.1% for AGIs $50k-75k, 0.2% for AGIs $75k-100k, 0.9% for AGIs over 100k)
Total itemized deductions: $18,287 (26% of AGI, reported on 31.9% of returns)
Here:
$18,287
State:
$28,113
Here:
26.2% of AGI
State:
25.3% of AGI
(% of AGI for various income ranges: 14.5% for AGIs below $10k, 10.4% for AGIs $10k-25k, 13.2% for AGIs $25k-50k, 16.1% for AGIs $50k-75k, 17.7% for AGIs $75k-100k, 14.9% for AGIs over 100k)
Charity contributions deductions: $2,583 (4% of AGI, reported on 27.8% of returns)
Here:
$2,583
State:
$3,923
Here:
3.6% of AGI
State:
3.3% of AGI
(% of AGI for various income ranges: 0.8% for AGIs below $10k, 0.8% for AGIs $10k-25k, 1.4% for AGIs $25k-50k, 2.0% for AGIs $50k-75k, 2.5% for AGIs $75k-100k, 2.2% for AGIs over 100k)
Total tax: $5,526 (reported on 71.5% of returns)
95822:
$5,526
State:
$10,761
(% of AGI for various income ranges: 2.9% for AGIs below $10k, 3.5% for AGIs $10k-25k, 6.4% for AGIs $25k-50k, 9.5% for AGIs $50k-75k, 10.9% for AGIs $75k-100k, 16.7% for AGIs over 100k)
Earned income credit: $1,826 (reported on 19.7% of returns)
Here:
$1,826
State:
$1,763
Percentage of individuals using paid preparers for their 2004 taxes: 59.5%
Here:
59%
State:
66%
(% for various income ranges: 53.2% for AGIs below $10k, 62.5% for AGIs $10k-25k, 59.0% for AGIs $25k-50k, 59.7% for AGIs $50k-75k, 61.9% for AGIs $75k-100k, 63.7% for AGIs over 100k)
Likely homosexual households (counted as self-reported same-sex unmarried-partner households)
Lesbian couples: 0.5% of all households
Gay men: 0.2% of all households
Household received Food Stamps/SNAP in the past 12 months: 3,176 Household did not receive Food Stamps/SNAP in the past 12 months: 13,935
Women who had a birth in the past 12 months: 636 (501 now married, 134 unmarried) Women who did not have a birth in the past 12 months: 10,024 (3,519 now married, 6,523 unmarried)
Housing units in zip code 95822 with a mortgage: 6,613 (487 second mortgage, 14 home equity loan, 395 both second mortgage and home equity loan) Houses without a mortgage: 129
Median monthly owner costs for units with a mortgage: $1,868 Median monthly owner costs for units without a mortgage: $631
Residents with income below the poverty level in 2022:
This zip code:
12.6%
Whole state:
12.2%
Residents with income below 50% of the poverty level in 2022:
This zip code:
5.5%
Whole state:
6.2%
Median number of rooms in houses and condos:
Here:
5.8
State:
6.0
Median number of rooms in apartments:
Here:
4.4
State:
3.9
Notable locations in this zip code not listed on our city pages
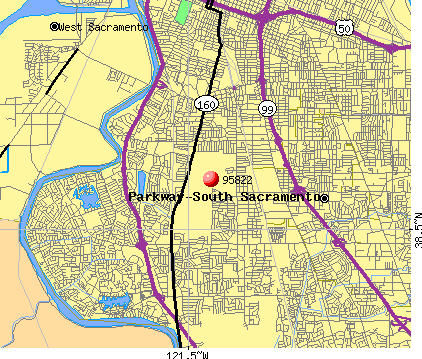
Notable locations in zip code 95822: Bing Maloney Golf Course (A), Sacramento Wastewater Treatment Plant (B), William Land Municipal Golf Course (C), Sacramento Zoo (D), Fairytale Town (E), Reach Air Medical Services Reach 50 Base (F), TLC Transportation (G), Martin Luther King Junior Regional Library (H), Belle Cooledge Community Library (I), Sacramento City Fire Department Station 16 (J), Sacramento City Fire Department Station 12 (K), Sacramento Fire Department (L), City of Sacramento Police Department Headquarters (M). Display/hide their locations on the map
Shopping Centers: South Hills Shopping Center (1), Hollywood Plaza Shopping Center (2), Freeport Plaza Shopping Center (3), Courtyard Shopping Center (4), Cort-Yard Shopping Center (5), Lanai Shops Shopping Center (6), Sutterville Shopping Center (7), Freeport Square Shopping Center (8), Florin Square Shopping Center (9). Display/hide their locations on the map
Churches in zip code 95822 include: Chinese Community Church (A), Holy Spirit Roman Catholic Church (B), Parkside Community Church (C), Saint Francis Roman Catholic Church (D), Abundant Life Assemblies Church (E), All Saints Memorial Episcopal Church (F), Bethany Presbyterian Church (G), Centennial United Methodist Church (H), Covenant Reformed Church (I). Display/hide their locations on the map
Parks in zip code 95822 include: Bahnfieth Park (1), Silva Field (2), William Land Park (3), Cabrillo Park (4), Chorley Park (5), Kemble Park (6), Hopkins Park (7), Argonaut Park (8), Belle Cooledge Park (9). Display/hide their locations on the map
4,829 married couples with children.
3,307 single-parent households (1,084 men, 2,223 women).
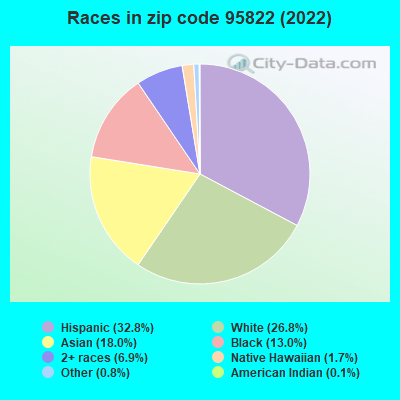
62.6% of residents of 95822 zip code speak English at home.
19.6% of residents speak Spanish at home (66% very well, 17% well, 15% not well, 2% not at all).
4.2% of residents speak other Indo-European language at home (70% very well, 16% well, 15% not well).
12.8% of residents speak Asian or Pacific Island language at home (45% very well, 28% well, 20% not well, 7% not at all).
0.5% of residents speak other language at home (54% very well, 42% well, 5% not well).
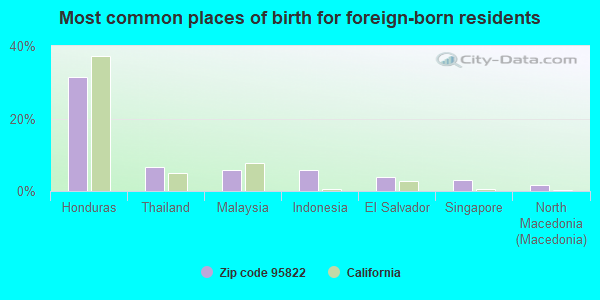
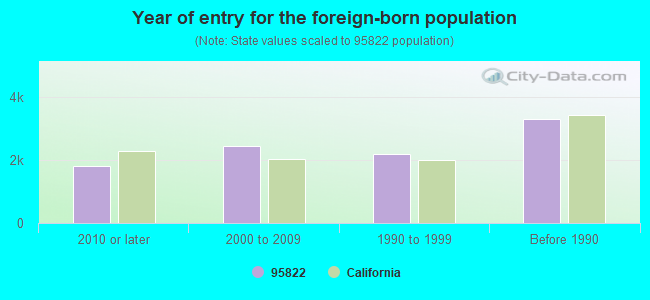
Foreign born population: 9,139 (19.9%) (62.2% of them are naturalized citizens)
Major facilities with environmental interests located in this zip code:
JIFFY LUBE #429 (2900 FLORIN RD in SACRAMENTO, CA)
STATE MASTER (California - Hazardous Waste Tracking) - HAZARDOU WASTE PROGRAM Small Quantity Generators, between 100 kg and 1000 kg of hazardous waste/month (Resource Conservation and Recovery Act (tracking hazardous waste)) - notification USED OIL PROGRAM (Resource Conservation and Recovery Act (tracking hazardous waste)) STATE MASTER (California - Used Oil Recycling System ) - USED OIL RECYCLING, USED OIL PROGRAM Organizations: PENNZOIL CO (CONTACT/OWNER)
Alternative names: JIFFY LUBE INTERNATIONAL 429
MRM MARINE (CONSTRUCTION SITE) (1317 VINCI AVENUE in SACRAMENTO, CA)
(Integrated Compliance Information System) - ICIS-09-2005-0017, FORMAL ENFORCEMENT ACTION, ICIS-09-2005-0119, ENFORCEMENT/COMPLIANCE ACTIVITY, ICIS-09-2005-0198, (Integrated Compliance Information System) - ICIS-09-2005-0017, FORMAL ENFORCEMENT ACTION, ICIS-09-2005-0119, ENFORCEMENT/COMPLIANCE ACTIVITY, ICIS-09-2005-0198, Business SIC classification: GENERAL CONTRACTORS-NONRESIDENTIAL BUILDINGS, OTHER THAN INDUSTRIAL BUILDINGS AND WAREHOUSES
CHEVRON STATION NO 91561 (4800 FREEPORT BLVD in SACRAMENTO, CA)
STATE MASTER (California - Hazardous Waste Tracking) - HAZARDOU WASTE PROGRAM Large Quantity Generators, more that 1000 kg of hazardous waste/month (Resource Conservation and Recovery Act (tracking hazardous waste)) Organizations: CHEVRON PRODUCTS CO. (CONTACT/OPERATOR)
HANSEN PAINTING AND DECORATING (129 OTTO CIRCLE in SACRAMENTO, CA)
STATE MASTER (California - Hazardous Waste Tracking) - HAZARDOU WASTE PROGRAM Small Quantity Generators, between 100 kg and 1000 kg of hazardous waste/month (Resource Conservation and Recovery Act (tracking hazardous waste)) - notification Organizations: PHILLIP SANDLER (CONTACT/OPERATOR)
, TORBEN HANSEN (CONTACT/OWNER)
EQUILON ENTERPRISES (4000 S LAND PARK DR in SACRAMENTO, CA) . Federal Facility
STATE MASTER (California - Hazardous Waste Tracking) - HAZARDOU WASTE PROGRAM Small Quantity Generators, between 100 kg and 1000 kg of hazardous waste/month (Resource Conservation and Recovery Act (tracking hazardous waste)) - notification Organizations: EQUILON ENTERPRISES, LLC (CONTACT/OWNER)
Alternative names: SHELL OIL CO
CHEVRON 1001559 (6151 FREEPORT BLVD in SACRAMENTO, CA)
STATE MASTER (California - Hazardous Waste Tracking) - HAZARDOU WASTE PROGRAM Small Quantity Generators, between 100 kg and 1000 kg of hazardous waste/month (Resource Conservation and Recovery Act (tracking hazardous waste)) Alternative names: CHEVRON USA INC SACRAMENTO EXEC ARPT
CAPITAL NURSERY CO (4700 FREEPORT BLVD in SACRAMENTO, CA)
STATE MASTER (California - Hazardous Waste Tracking) - HAZARDOU WASTE PROGRAM Small Quantity Generators, between 100 kg and 1000 kg of hazardous waste/month (Resource Conservation and Recovery Act (tracking hazardous waste))
GOETHE (CHARLES M.) MIDDLE (2250 68TH AVE. in SACRAMENTO, CA)
(National Center for Education Statistics) - STATE ID-6059299 Organizations: SACRAMENTO CITY UNIFIED (SCHOOL DISTRICT)
HARKNESS (H.W.) ELEMENTARY (2147 54TH AVE. in SACRAMENTO, CA)
(National Center for Education Statistics) - STATE ID-6033997 Organizations: SACRAMENTO CITY UNIFIED (SCHOOL DISTRICT)
HOLLYWOOD PARK ELEMENTARY (4915 HARTE WAY in SACRAMENTO, CA)
(National Center for Education Statistics) - STATE ID-6034003 Organizations: SACRAMENTO CITY UNIFIED (SCHOOL DISTRICT)
HOPKINS (MARK) ELEMENTARY (2221 MATSON DR. in SACRAMENTO, CA)
(National Center for Education Statistics) - STATE ID-6034128 Organizations: SACRAMENTO CITY UNIFIED (SCHOOL DISTRICT)
HUNTINGTON (COLLIS P.) ELEMENTARY (5921 26TH ST. in SACRAMENTO, CA)
(National Center for Education Statistics) - STATE ID-6033856 Organizations: SACRAMENTO CITY UNIFIED (SCHOOL DISTRICT)
KEMBLE (EDWARD) ELEMENTARY (7495 29TH ST. in SACRAMENTO, CA)
(National Center for Education Statistics) - STATE ID-6033914 Organizations: SACRAMENTO CITY UNIFIED (SCHOOL DISTRICT)
Housing units lacking complete plumbing facilities: 0.7% Housing units lacking complete kitchen facilities: 0.9%
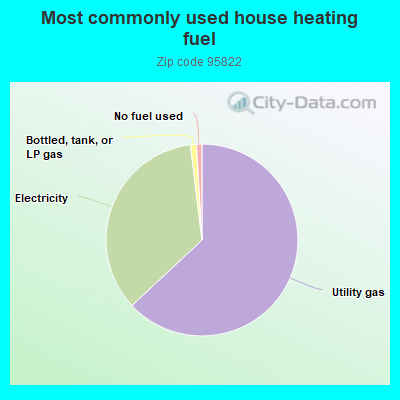
62.4%Utility gas
34.7%Electricity
1.0%Bottled, tank, or LP gas
0.9%No fuel used
Population in 1990: 43,943. Population change in the 1990s: +735 (+1.7%).
Place of birth for U.S.-born residents:
This state: 29,674
Northeast: 755
Midwest: 1,690
South: 2,232
West: 1,829
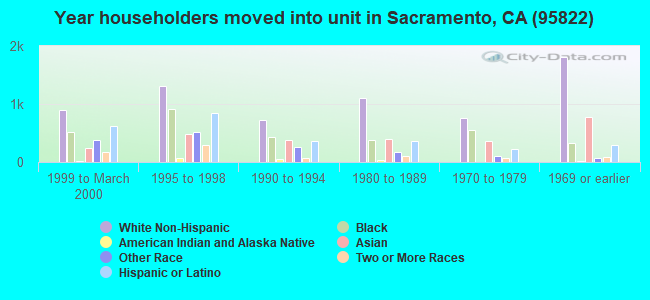
61% of the 95822 zip code residents lived in the same house 5 years ago. Out of people who lived in different houses, 73% lived in this county. Out of people who lived in different counties, 50% lived in California.
91% of the 95822 zip code residents lived in the same house 1 year ago. Out of people who lived in different houses, 66% moved from this county. Out of people who lived in different houses, 21% moved from different county within same state. Out of people who lived in different houses, 8% moved from different state. Out of people who lived in different houses, 4% moved from abroad.
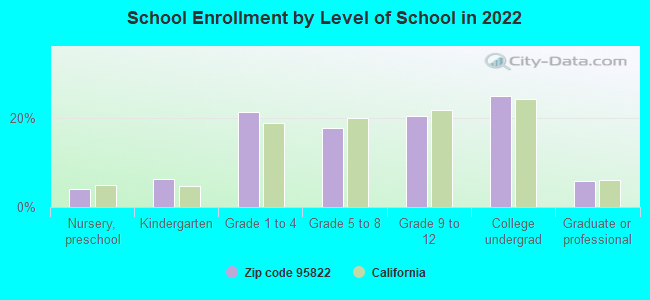
Private vs. public school enrollment:
Students in private schools in grades 1 to 8 (elementary and middle school): 269
Here:
6.3%
California:
10.5%
Students in private schools in grades 9 to 12 (high school): 189
Here:
8.4%
California:
8.5%
Students in private undergraduate colleges: 334
Here:
12.2%
California:
15.9%
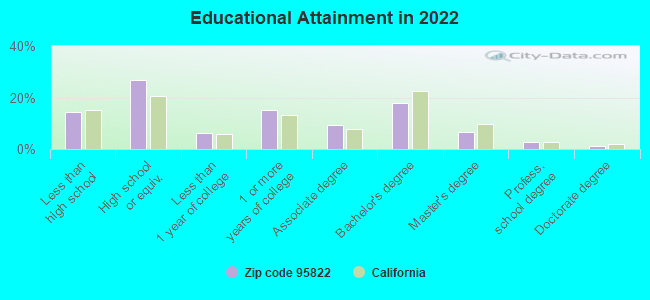
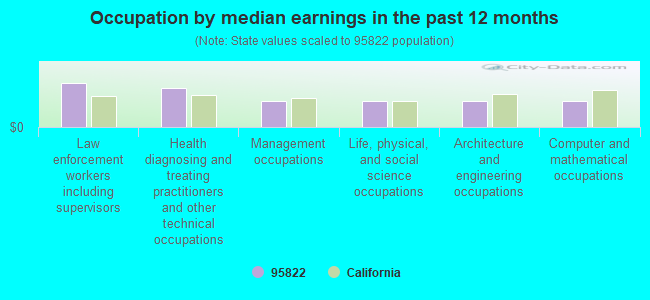
Occupation by median earnings in the past 12 months ($)
131,084Law enforcement workers including supervisors
114,792Health diagnosing and treating practitioners and other technical occupations
78,551Management occupations
78,464Life, physical, and social science occupations
77,212Architecture and engineering occupations
76,977Computer and mathematical occupations
Companies with federal contracts located in this zip code (SACRAMENTO, CA):
SUSIE LOPEZ (6073 14TH ST; small business) : $61,155 in 17 contractsfrom 2003 to 2006
Contracts for Landscaping/Groundskeeping Services, Custodial Janitorial Services by U.S. Army Corps of Engineers - civil program financing only, Army Signed by year:2000: $0; 2001: $0; 2002: $0; 2003: $4,075; 2004: $27,720; 2005: $25,260; 2006: $4,100.
Biggest contracts:
$7,200 with U.S. Army Corps of Engineers - civil program financing only for Landscaping/Groundskeeping Services. Signed on 2005-07-25. Completion date: 2006-01-31.
$7,200 with Army for Landscaping/Groundskeeping Services. Signed on 2005-07-25. Completion date: 2006-01-31.
$6,960, same as above.Signed on 2004-01-13. Completion date: 2005-01-31.
$6,960 with U.S. Army Corps of Engineers - civil program financing only for Landscaping/Groundskeeping Services. Signed on 2004-01-13. Completion date: 2005-01-31.
AMERICAN AERIAL MAPPING INC (6151 FREPORT BLVD STE 169; small business) 3 employees, $400000 revenue.
$57,000 with Bureau of Reclamation for Aerial Photographic Services. Signed on 2002-08-15. Completion date: 2002-10-15.
PACIFIC FORESTRY & JANITORIAL (7505 24TH ST; small business) : $51,209 in 7 contractsfrom 2005 to 2006
Contracts for Custodial Janitorial Services by Army Signed by year:2000: $0; 2001: $0; 2002: $0; 2003: $0; 2004: $0; 2005: $47,834; 2006: $3,375.
Biggest contracts:
$18,936 with Army for Custodial Janitorial Services. Signed on 2005-10-24. Completion date: 2006-09-29.
$17,243, same as above.Signed on 2005-10-24. Completion date: 2005-10-01.
$11,655, same as above.Signed on 2005-11-01. Completion date: 2006-09-29.
$3,375, same as above.Signed on 2006-05-03. Completion date: 2006-09-30.
CITY OF SACRAMENTO (1395 35TH AVENUE)
$39,978 with U.S. Army Corps of Engineers - civil program financing only for Maintenance, Repair or Alteration of Real Property -- Other Utilities. Signed on 2001-02-21. Completion date: 2001-04-02.
QUALITY SERVICE UNLIMITED (5963 FREEPORT BLVD #103; small business) : $22,012 in 7 contractsfrom 2001 to 2005
Contracts for Custodial Janitorial Services by Navy, Army, U.S. Army Corps of Engineers - civil program financing only Signed by year:2000: $0; 2001: $12,627; 2002: $0; 2003: $0; 2004: $0; 2005: $9,385; 2006: $0.
Biggest contracts:
$15,373 with Navy for Custodial Janitorial Services. Signed on 2001-10-01. Completion date: 2001-09-30.
$5,135 with Army for Custodial Janitorial Services. Signed on 2005-11-21. Completion date: 2005-09-30.
$2,125 with U.S. Army Corps of Engineers - civil program financing only for Custodial Janitorial Services. Signed on 2005-06-06. Completion date: 2005-09-30.
$2,125 with Army for Custodial Janitorial Services. Signed on 2005-06-06. Completion date: 2005-09-30.
LAPOUBELLE CLEANING SRVCS (TAMOSHANTER WAY; small business) : $3,718 in 6 contractsfrom 2003 to 2004
Contracts for Custodial Janitorial Services by Army, U.S. Army Corps of Engineers - civil program financing only Signed by year:2000: $0; 2001: $0; 2002: $0; 2003: $8,000; 2004: -$4,282; 2005: $0; 2006: $0.
Biggest contracts:
$4,000 with Army for Custodial Janitorial Services. Signed on 2003-10-31. Completion date: 2003-10-31.
$4,000 with U.S. Army Corps of Engineers - civil program financing only for Custodial Janitorial Services. Signed on 2003-10-31. Completion date: 2003-10-31.
$0 with Army for Custodial Janitorial Services. Signed on 2004-01-09. Completion date: 2003-12-15.
$0 with U.S. Army Corps of Engineers - civil program financing only for Custodial Janitorial Services. Signed on 2004-01-09. Completion date: 2003-12-15.
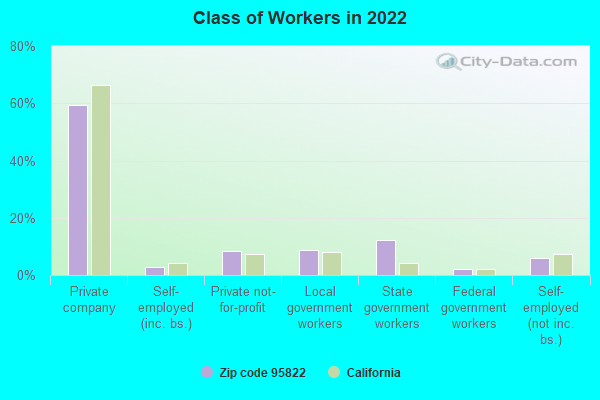
Top industries in this zip code by the number of employees in 2005:
Health Care and Social Assistance: Nursing Care Facilities (100-249 employees: 2 establishments, 50-99 employees: 1 establishment, 5-9 employees: 1 establishment)
2005 - 2018 National Fire Incident Reporting System (NFIRS) incidents
According to the data from the years 2005 - 2018 the average number of fire incidents per year is 120. The highest number of fires - 176 took place in 2017, and the least - 7 in 2005. The data has an increasing trend.
When looking into fire subcategories, the most incidents belonged to: Outside Fires (54.3%), and Structure Fires (23.4%).
Fire incident types reported to NFIRS in Zip Code 95822


 Nearest zip codes: 95831, 95818, 95817, 95824, 95820, 95823.


 According to the data from the years 2005 - 2018 the average number of fire incidents per year is 120. The highest number of fires - 176 took place in 2017, and the least - 7 in 2005. The data has an increasing trend.
 When looking into fire subcategories, the most incidents belonged to: Outside Fires (54.3%), and Structure Fires (23.4%).