Estimated zip code population in 2022: 82,294 Zip code population in 2010: 73,985 Zip code population in 2000: 72,194
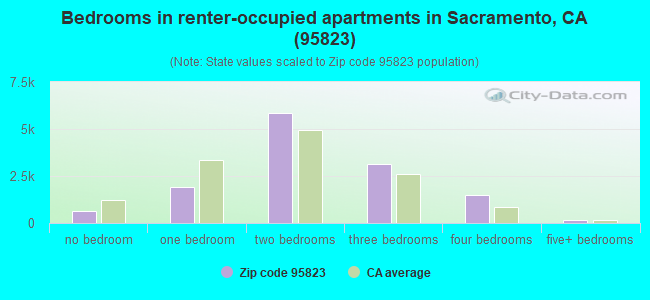
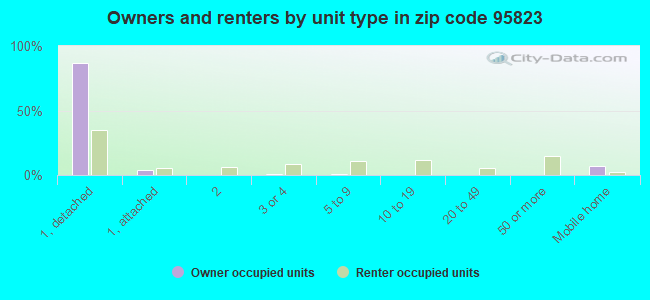
Houses and condos: 25,807 Renter-occupied apartments: 13,198
% of renters here:
53%
State:
44%
March 2022 cost of living index in zip code 95823: 101.4 (near average, U.S. average is 100)
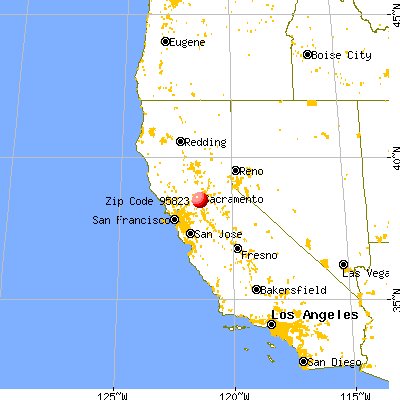
Land area: 11.8 sq. mi. Water area: 0.0 sq. mi.
Population density: 6,972 people per square mile
(high).
OSM Map
General Map
Google Map
MSN Map
OSM Map
General Map
Google Map
MSN Map
OSM Map
General Map
Google Map
MSN Map
OSM Map
General Map
Google Map
MSN Map
Please wait while loading the map...
Real estate property taxes paid for housing units in 2022:
This zip code:
0.6% ($2,320)
California:
0.7% ($4,831)
Median real estate property taxes paid for housing units with mortgages in 2022: $2,533 (0.7%) Median real estate property taxes paid for housing units with no mortgage in 2022: $1,872 (0.5%)
Averages for the 2020 tax year for zip code 95823, filed in 2021:
Average Adjusted Gross Income (AGI) in 2020: $41,944 (Individual Income Tax Returns)
Here:
$41,944
State:
$95,910
Salary/wage: $38,653 (reported on 85.4% of returns)
Here:
$38,653
State:
$77,331
(% of AGI for various income ranges: 1273.2% for AGIs below $25k, 3926.8% for AGIs $25k-50k, 7407.1% for AGIs $50k-75k, 10951.8% for AGIs $75k-100k, 18216.1% for AGIs $100k-200k, 57744.0% for AGIs over 200k)
Taxable interest for individuals: $332 (reported on 21.7% of returns)
This zip code:
$332
California:
$2,294
(% of AGI for various income ranges: 4.4% for AGIs below $25k, 4.7% for AGIs $25k-50k, 11.9% for AGIs $50k-75k, 28.9% for AGIs $75k-100k, 61.8% for AGIs $100k-200k, 150.0% for AGIs over 200k)
Ordinary dividends: $1,587 (reported on 5.0% of returns)
Here:
$1,587
State:
$10,949
(% of AGI for various income ranges: 2.7% for AGIs below $25k, 4.2% for AGIs $25k-50k, 10.8% for AGIs $50k-75k, 24.4% for AGIs $75k-100k, 90.8% for AGIs $100k-200k, 674.0% for AGIs over 200k)
Net capital gain/loss in AGI: +$4,458 (reported on 6.6% of returns)
Here:
+$4,458
State:
+$49,306
(% of AGI for various income ranges: 0.4% for AGIs below $25k, 3.3% for AGIs $25k-50k, 22.4% for AGIs $50k-75k, 74.4% for AGIs $75k-100k, 392.3% for AGIs $100k-200k, 7304.0% for AGIs over 200k)
Profit/loss from business: +$7,188 (reported on 14.6% of returns)
Here:
+$7,188
State:
+$15,671
(% of AGI for various income ranges: 121.4% for AGIs below $25k, 112.9% for AGIs $25k-50k, 110.3% for AGIs $50k-75k, 167.9% for AGIs $75k-100k, 363.3% for AGIs $100k-200k, 8960.0% for AGIs over 200k)
Taxable individual retirement arrangement distribution: $12,755 (reported on 2.5% of returns)
95823:
$12,755
California:
$23,505
(% of AGI for various income ranges: 14.4% for AGIs below $25k, 24.4% for AGIs $25k-50k, 60.8% for AGIs $50k-75k, 108.1% for AGIs $75k-100k, 338.9% for AGIs $100k-200k)
Total itemized deductions: $27,492 (reported on 5.6% of returns)
Here:
$27,492
State:
$39,517
(% of AGI for various income ranges: 26.3% for AGIs below $25k, 87.1% for AGIs $25k-50k, 331.1% for AGIs $50k-75k, 668.5% for AGIs $75k-100k, 1191.1% for AGIs $100k-200k, 13510.0% for AGIs over 200k)
Charity contributions: $7,785 (reported on 4.2% of returns)
Here:
$7,785
State:
$12,598
(% of AGI for various income ranges: 1.6% for AGIs below $25k, 13.5% for AGIs $25k-50k, 45.4% for AGIs $50k-75k, 120.2% for AGIs $75k-100k, 257.1% for AGIs $100k-200k, 7254.0% for AGIs over 200k)
Taxes paid: $6,738 (reported on 5.5% of returns)
95823:
$6,738
State:
$8,807
(% of AGI for various income ranges: 4.9% for AGIs below $25k, 19.8% for AGIs $25k-50k, 91.7% for AGIs $50k-75k, 192.1% for AGIs $75k-100k, 336.5% for AGIs $100k-200k, 818.0% for AGIs over 200k)
Earned income credit: $2,372 (reported on 25.2% of returns)
Here:
$2,372
State:
$2,074
(% of AGI for various income ranges: 130.8% for AGIs below $25k, 97.0% for AGIs $25k-50k, 1.8% for AGIs $50k-75k)
Percentage of individuals using paid preparers for their 2020 taxes: 90.6%
Here:
91%
State:
92%
(% for various income ranges: 90.2% for AGIs below $25k, 91.2% for AGIs $25k-50k, 90.8% for AGIs $50k-75k, 90.1% for AGIs $75k-100k, 90.7% for AGIs $100k-200k, 87.5% for AGIs over 200k)
Averages for the 2012 tax year for zip code 95823, filed in 2013:
Average Adjusted Gross Income (AGI) in 2012: $32,034 (Individual Income Tax Returns)
Here:
$32,034
State:
$72,726
Salary/wage: $29,740 (reported on 85.1% of returns)
Here:
$29,740
State:
$59,079
(% of AGI for various income ranges: 76.2% for AGIs below $25k, 85.6% for AGIs $25k-50k, 80.1% for AGIs $50k-75k, 75.2% for AGIs $75k-100k, 73.1% for AGIs $100k-200k, 44.0% for AGIs over 200k)
Taxable interest for individuals: $350 (reported on 21.2% of returns)
This zip code:
$350
California:
$2,146
(% of AGI for various income ranges: 0.2% for AGIs below $25k, 0.2% for AGIs $25k-50k, 0.3% for AGIs $50k-75k, 0.2% for AGIs $75k-100k, 0.3% for AGIs $100k-200k, 0.3% for AGIs over 200k)
Ordinary dividends: $1,965 (reported on 5.1% of returns)
Here:
$1,965
State:
$9,308
(% of AGI for various income ranges: 0.3% for AGIs below $25k, 0.2% for AGIs $25k-50k, 0.3% for AGIs $50k-75k, 0.5% for AGIs $75k-100k, 0.6% for AGIs $100k-200k)
Net capital gain/loss in AGI: +$1,074 (reported on 3.8% of returns)
Here:
+$1,074
State:
+$30,460
(% of AGI for various income ranges: 0.2% for AGIs $75k-100k, 0.9% for AGIs $100k-200k)
Profit/loss from business: +$8,118 (reported on 14.6% of returns)
Here:
+$8,118
State:
+$17,064
(% of AGI for various income ranges: 12.0% for AGIs below $25k, 1.9% for AGIs $25k-50k, 1.0% for AGIs $50k-75k, 1.2% for AGIs $75k-100k, 1.8% for AGIs $100k-200k)
Taxable individual retirement arrangement distribution: $11,036 (reported on 3.4% of returns)
95823:
$11,036
California:
$19,557
(% of AGI for various income ranges: 0.8% for AGIs below $25k, 0.9% for AGIs $25k-50k, 1.4% for AGIs $50k-75k, 1.2% for AGIs $75k-100k, 2.5% for AGIs $100k-200k)
Total itemized deductions: $17,584 (28% of AGI, reported on 18.5% of returns)
Here:
$17,584
State:
$34,004
Here:
28.2% of AGI
State:
22.7% of AGI
(% of AGI for various income ranges: 4.3% for AGIs below $25k, 8.6% for AGIs $25k-50k, 12.8% for AGIs $50k-75k, 13.8% for AGIs $75k-100k, 15.3% for AGIs $100k-200k, 16.9% for AGIs over 200k)
Charity contributions: $2,673 (reported on 14.7% of returns)
Here:
$2,673
State:
$4,659
(% of AGI for various income ranges: 0.4% for AGIs below $25k, 1.0% for AGIs $25k-50k, 1.5% for AGIs $50k-75k, 1.8% for AGIs $75k-100k, 2.4% for AGIs $100k-200k, 1.0% for AGIs over 200k)
Taxes paid: $4,820 (reported on 18.4% of returns)
95823:
$4,820
State:
$14,448
(% of AGI for various income ranges: 0.8% for AGIs below $25k, 2.2% for AGIs $25k-50k, 3.2% for AGIs $50k-75k, 3.9% for AGIs $75k-100k, 5.3% for AGIs $100k-200k, 7.6% for AGIs over 200k)
Earned income credit: $2,649 (reported on 36.1% of returns)
Here:
$2,649
State:
$2,286
(% of AGI for various income ranges: 11.3% for AGIs below $25k, 1.8% for AGIs $25k-50k)
Percentage of individuals using paid preparers for their 2012 taxes: 57.2%
Here:
57%
State:
64%
(% for various income ranges: 56.0% for AGIs below $25k, 58.4% for AGIs $25k-50k, 58.6% for AGIs $50k-75k, 58.1% for AGIs $75k-100k, 59.8% for AGIs $100k-200k, 60.0% for AGIs over 200k)
Averages for the 2004 tax year for zip code 95823, filed in 2005:
Average Adjusted Gross Income (AGI) in 2004: $32,224 (Individual Income Tax Returns)
Here:
$32,224
State:
$58,600
Salary/wage: $30,481 (reported on 88.7% of returns)
Here:
$30,481
State:
$49,455
(% of AGI for various income ranges: 95.8% for AGIs below $10k, 83.1% for AGIs $10k-25k, 87.9% for AGIs $25k-50k, 85.7% for AGIs $50k-75k, 84.6% for AGIs $75k-100k, 63.5% for AGIs over 100k)
Taxable interest for individuals: $607 (reported on 33.0% of returns)
This zip code:
$607
California:
$2,365
(% of AGI for various income ranges: 1.4% for AGIs below $10k, 0.7% for AGIs $10k-25k, 0.5% for AGIs $25k-50k, 0.6% for AGIs $50k-75k, 0.5% for AGIs $75k-100k, 1.0% for AGIs over 100k)
Taxable dividends: $1,280 (reported on 8.2% of returns)
Here:
$1,280
State:
$4,746
(% of AGI for various income ranges: 0.8% for AGIs below $10k, 0.3% for AGIs $10k-25k, 0.3% for AGIs $25k-50k, 0.3% for AGIs $50k-75k, 0.3% for AGIs $75k-100k, 0.4% for AGIs over 100k)
Net capital gain/loss: +$6,307 (reported on 6.1% of returns)
Here:
+$6,307
State:
+$23,418
(% of AGI for various income ranges: -0.2% for AGIs below $10k, -0.1% for AGIs $10k-25k, 0.2% for AGIs $25k-50k, 0.5% for AGIs $50k-75k, 1.5% for AGIs $75k-100k, 8.3% for AGIs over 100k)
Profit/loss from business: +$6,528 (reported on 11.9% of returns)
Here:
+$6,528
State:
+$16,826
(% of AGI for various income ranges: 7.1% for AGIs below $10k, 4.8% for AGIs $10k-25k, 1.9% for AGIs $25k-50k, 1.5% for AGIs $50k-75k, 1.0% for AGIs $75k-100k, 2.8% for AGIs over 100k)
IRA payment deduction: $2,244 (reported on 1.3% of returns)
95823:
$2,244
California:
$3,192
(% of AGI for various income ranges: 0.1% for AGIs below $10k, 0.1% for AGIs $10k-25k, 0.1% for AGIs $25k-50k, 0.1% for AGIs $50k-75k, 0.1% for AGIs $75k-100k, 0.1% for AGIs over 100k)
Self-employed pension: $9,021 (reported on 0.2% of returns)
Here:
$9,021
California:
$17,688
(% of AGI for various income ranges: 0.0% for AGIs $10k-25k, 0.1% for AGIs $50k-75k, 0.2% for AGIs over 100k)
Total itemized deductions: $18,469 (33% of AGI, reported on 30.5% of returns)
Here:
$18,469
State:
$28,113
Here:
33.5% of AGI
State:
25.3% of AGI
(% of AGI for various income ranges: 9.3% for AGIs below $10k, 9.4% for AGIs $10k-25k, 16.4% for AGIs $25k-50k, 20.7% for AGIs $50k-75k, 20.7% for AGIs $75k-100k, 24.7% for AGIs over 100k)
Charity contributions deductions: $2,189 (4% of AGI, reported on 26.0% of returns)
Here:
$2,189
State:
$3,923
Here:
3.8% of AGI
State:
3.3% of AGI
(% of AGI for various income ranges: 0.5% for AGIs below $10k, 0.7% for AGIs $10k-25k, 1.5% for AGIs $25k-50k, 2.3% for AGIs $50k-75k, 2.7% for AGIs $75k-100k, 2.2% for AGIs over 100k)
Total tax: $3,313 (reported on 64.0% of returns)
95823:
$3,313
State:
$10,761
(% of AGI for various income ranges: 2.6% for AGIs below $10k, 3.2% for AGIs $10k-25k, 5.1% for AGIs $25k-50k, 7.3% for AGIs $50k-75k, 9.3% for AGIs $75k-100k, 13.2% for AGIs over 100k)
Earned income credit: $1,939 (reported on 26.4% of returns)
Here:
$1,939
State:
$1,763
Percentage of individuals using paid preparers for their 2004 taxes: 63.5%
Here:
64%
State:
66%
(% for various income ranges: 56.4% for AGIs below $10k, 66.0% for AGIs $10k-25k, 64.6% for AGIs $25k-50k, 65.1% for AGIs $50k-75k, 61.8% for AGIs $75k-100k, 66.8% for AGIs over 100k)
Likely homosexual households (counted as self-reported same-sex unmarried-partner households)
Lesbian couples: 0.1% of all households
Gay men: 0.2% of all households
Household received Food Stamps/SNAP in the past 12 months: 7,504 Household did not receive Food Stamps/SNAP in the past 12 months: 18,245
Women who had a birth in the past 12 months: 1,280 (869 now married, 411 unmarried) Women who did not have a birth in the past 12 months: 19,890 (7,308 now married, 12,605 unmarried)
Housing units in zip code 95823 with a mortgage: 7,710 (502 second mortgage, 46 home equity loan, 265 both second mortgage and home equity loan) Houses without a mortgage: 32
Median monthly owner costs for units with a mortgage: $1,754 Median monthly owner costs for units without a mortgage: $577
Residents with income below the poverty level in 2022:
This zip code:
19.8%
Whole state:
12.2%
Residents with income below 50% of the poverty level in 2022:
This zip code:
10.8%
Whole state:
6.2%
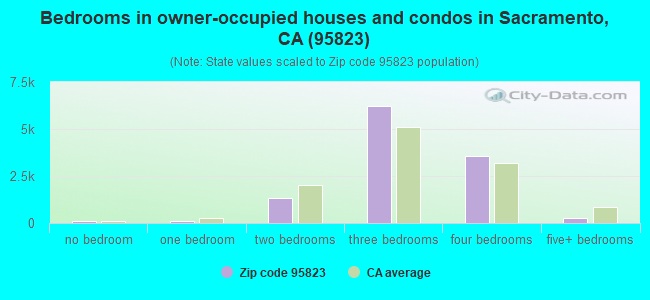
Median number of rooms in houses and condos:
Here:
5.8
State:
6.0
Median number of rooms in apartments:
Here:
4.3
State:
3.9
Notable locations in this zip code not listed on our city pages
Notable locations in zip code 95823: Southgate Community Library (A), Valley Hi - North Laguna Library (B), Sacramento City Fire Department Station 7 (C), Sacramento City Fire Department Station 57 (D), Sacramento City Fire Department Station 56 (E), Sacramento County Sheriff - Florin Station (F), Department of Motor Vehicles - Florin Office (G), California Highway Patrol - South Sacramento Office (H). Display/hide their locations on the map
Shopping Centers: Southgate Plaza Shopping Center (1), Franklin and Florin Shopping Center (2), Valley Hi Village Shopping Center (3), Southpointe Shopping Center (4), Valley Mack Plaza Shopping Center (5), Florin Mall (6). Display/hide their locations on the map
Churches in zip code 95823 include: Allegheny Wesleyan Methodist Church (A), Christian Worship Center (B), United Apostolic Church (C), Abundant Life Tabernacle of Praise (D), Grace Evangelical Free Church (E), Japanese Seventh Day Adventist Church of Sacramento (F), New Harvest Christian Fellowship Church (G), Sacramento Japanese United Methodist Church (H), Shepherd of Life Missionary Baptist Church (I). Display/hide their locations on the map
Parks in zip code 95823 include: Nicholas Park (1), Crowfoot Park (2), Dayor Sports Field (3), Florin Creek Park (4), Nielsen Park (5), Royal Park (6), Southgate Park (7), Valley High Park (8), Woods Park (9). Display/hide their locations on the map
10,943 married couples with children.
8,505 single-parent households (1,673 men, 6,832 women).
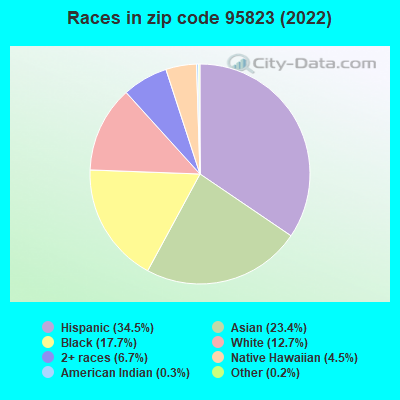
47.3% of residents of 95823 zip code speak English at home.
25.1% of residents speak Spanish at home (57% very well, 19% well, 16% not well, 8% not at all).
9.9% of residents speak other Indo-European language at home (58% very well, 26% well, 9% not well, 7% not at all).
16.8% of residents speak Asian or Pacific Island language at home (49% very well, 24% well, 19% not well, 8% not at all).
0.9% of residents speak other language at home (78% very well, 17% well, 3% not well, 3% not at all).
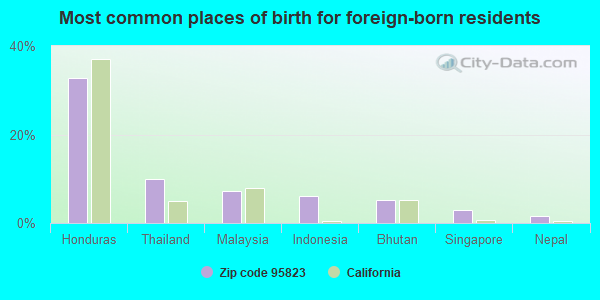
Foreign born population: 24,549 (29.8%) (53.1% of them are naturalized citizens)
Major facilities with environmental interests located in this zip code:
ELK GROVE USD (6300 ENHRHARDT in SACRAMENTO, CA)
STATE MASTER (California - Hazardous Waste Tracking) - HAZARDOU WASTE PROGRAM (National Center for Education Statistics) - STATE ID-3430170 Small Quantity Generators, between 100 kg and 1000 kg of hazardous waste/month (Resource Conservation and Recovery Act (tracking hazardous waste)) - notification Organizations: ELK GROVE UNIFIED (SCHOOL DISTRICT)
Alternative names: EGUSD VALLEY HIGH SCHOOL
METHODIST HOSPITAL - SACRAMENTO (7500 TIMBERLAKE WAY in SACRAMENTO, CA)
STATE MASTER (California - Hazardous Waste Tracking) - HAZARDOU WASTE PROGRAM CRITERIA AND HAZARDOUS AIR POLLUTANT INVENTORY (Inventory of air pollution sources) Small Quantity Generators, between 100 kg and 1000 kg of hazardous waste/month (Resource Conservation and Recovery Act (tracking hazardous waste)) - notification Business SIC and NAICS classification: GENERAL MEDICAL AND SURGICAL HOSPITALS Organizations: VALLEY HEALTHCARE CORP (CONTACT/OWNER)
FRANKLIN AUTO BODY (6448 FRANKLIN BLVD in SACRAMENTO, CA)
STATE MASTER (California - Hazardous Waste Tracking) - HAZARDOU WASTE PROGRAM Small Quantity Generators, between 100 kg and 1000 kg of hazardous waste/month (Resource Conservation and Recovery Act (tracking hazardous waste)) - notification Business NAICS classification: AUTOMOTIVE BODY, PAINT, AND INTERIOR REPAIR AND MAINTENANCE. Organizations: MIKE BUCK (CONTACT/OWNER)
CAPITOL CITY CHEVROLET MITSUBISHI (3815 FLORIN ROAD in SACRAMENTO, CA)
STATE MASTER (California - Hazardous Waste Tracking) - HAZARDOU WASTE PROGRAM CRITERIA AND HAZARDOUS AIR POLLUTANT INVENTORY (Inventory of air pollution sources) Small Quantity Generators, between 100 kg and 1000 kg of hazardous waste/month (Resource Conservation and Recovery Act (tracking hazardous waste)) - notification Business SIC classification: MOTOR VEHICLE DEALERS (NEW AND USED) Organizations: LEONARD HARRINGTON I I I (CONTACT/OWNER)
Alternative names: WORTHINGTON CHEV & MITSUBISHI
EQUILON ENTERPRISES (7575 FRANKLIN BLVD in SACRAMENTO, CA) . Federal Facility
STATE MASTER (California - Hazardous Waste Tracking) - HAZARDOU WASTE PROGRAM Small Quantity Generators, between 100 kg and 1000 kg of hazardous waste/month (Resource Conservation and Recovery Act (tracking hazardous waste)) Alternative names: SHELL OIL CO
FLORIN ROAD NISSAN KIA (3810 FLORIN ROAD in SACRAMENTO, CA)
STATE MASTER (California - Hazardous Waste Tracking) - HAZARDOU WASTE PROGRAM Small Quantity Generators, between 100 kg and 1000 kg of hazardous waste/month (Resource Conservation and Recovery Act (tracking hazardous waste)) - notification Organizations: SACRAMENTO MOTOR CARS LLC (CONTACT/OWNER)
Alternative names: FLORIN RD NISSAN KIA, FLORIN ROAD KIA, SERRA NISSAN INC
HEROLD AND MIELENZ INC (3531 51ST AVE in SACRAMENTO, CA)
STATE MASTER (California - Hazardous Waste Tracking) - HAZARDOU WASTE PROGRAM Small Quantity Generators, between 100 kg and 1000 kg of hazardous waste/month (Resource Conservation and Recovery Act (tracking hazardous waste)) - notification Organizations: WILLIAM T MIELENZ (CONTACT/OWNER)
CHEVRON STATION 92154 (4700 FLORIN RD in SACRAMENTO, CA)
STATE MASTER (California - Hazardous Waste Tracking) - HAZARDOU WASTE PROGRAM Small Quantity Generators, between 100 kg and 1000 kg of hazardous waste/month (Resource Conservation and Recovery Act (tracking hazardous waste)) - notification Organizations: CHEVRON PRODUCTS CO (CONTACT/OWNER)
LEIMBACH (HERMAN) ELEMENTARY (8101 GRANDSTAFF DR. in SACRAMENTO, CA)
(National Center for Education Statistics) - STATE ID-6077291 Organizations: ELK GROVE UNIFIED (SCHOOL DISTRICT)
LAS FLORES HIGH (ALTER.) (5900 BAMFORD DR. in SACRAMENTO, CA)
(National Center for Education Statistics) - STATE ID-3430352 Organizations: ELK GROVE UNIFIED (SCHOOL DISTRICT)
JACKMAN (SAMUEL) MIDDLE (7925 KENTWALL DR. in SACRAMENTO, CA)
(National Center for Education Statistics) - STATE ID-6109821 Organizations: ELK GROVE UNIFIED (SCHOOL DISTRICT)
MACK (CHARLES E.) ELEMENTARY (4701 BROOKFIELD DR. in SACRAMENTO, CA)
(National Center for Education Statistics) - STATE ID-6033005 Organizations: ELK GROVE UNIFIED (SCHOOL DISTRICT)
LAS FLORES COMMUNITY DAY (5900 BAMFORD DR. in SACRAMENTO, CA)
(National Center for Education Statistics) - STATE ID-6117089 Organizations: ELK GROVE UNIFIED (SCHOOL DISTRICT)
Housing units lacking complete plumbing facilities: 0.1% Housing units lacking complete kitchen facilities: 0.5%
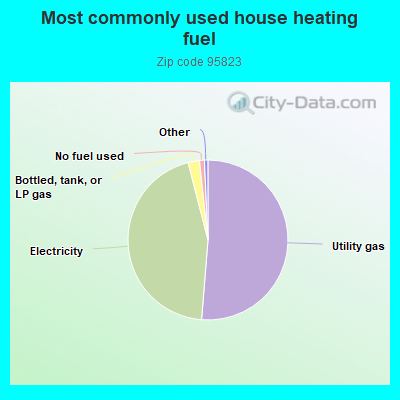
51.3%Utility gas
44.7%Electricity
2.3%Bottled, tank, or LP gas
1.0%No fuel used
Population in 1990: 55,103. Population change in the 1990s: +17,091 (+31.0%).
Place of birth for U.S.-born residents:
This state: 47,699
Northeast: 1,380
Midwest: 1,864
South: 3,447
West: 1,640
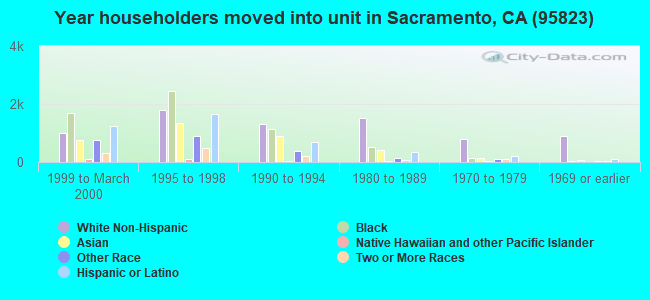
50% of the 95823 zip code residents lived in the same house 5 years ago. Out of people who lived in different houses, 70% lived in this county. Out of people who lived in different counties, 50% lived in California.
90% of the 95823 zip code residents lived in the same house 1 year ago. Out of people who lived in different houses, 63% moved from this county. Out of people who lived in different houses, 25% moved from different county within same state. Out of people who lived in different houses, 8% moved from different state. Out of people who lived in different houses, 4% moved from abroad.
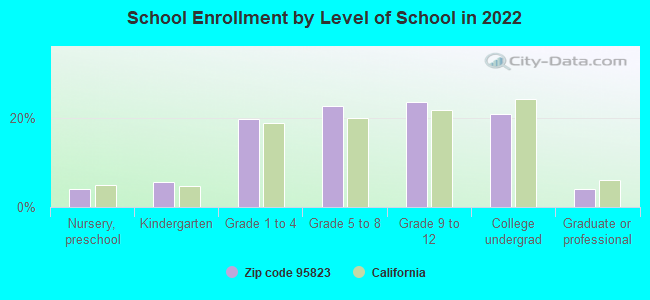
Private vs. public school enrollment:
Students in private schools in grades 1 to 8 (elementary and middle school): 256
Here:
2.5%
California:
10.5%
Students in private schools in grades 9 to 12 (high school): 229
Here:
4.0%
California:
8.5%
Students in private undergraduate colleges: 434
Here:
8.6%
California:
15.9%
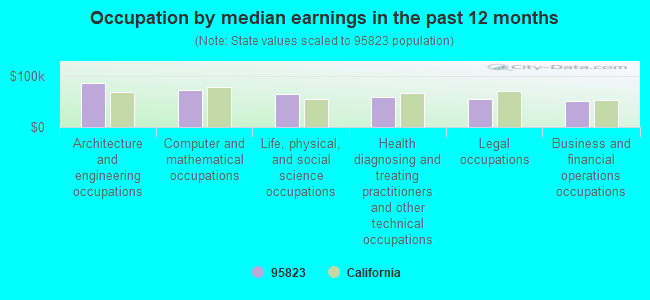
Occupation by median earnings in the past 12 months ($)
85,724Architecture and engineering occupations
72,878Computer and mathematical occupations
64,514Life, physical, and social science occupations
59,256Health diagnosing and treating practitioners and other technical occupations
54,738Legal occupations
50,742Business and financial operations occupations
Companies with federal contracts located in this zip code (SACRAMENTO, CA):
VELLUTINI CORPORATION (3131 52ND AVE) : $4,832,059 in 10 contractsfrom 2004 to 2006
Contracts for Construction of Structures and Facilities -- Other Industrial Buildings by Navy Signed by year:2000: $0; 2001: $0; 2002: $0; 2003: $0; 2004: $4,768,000; 2005: $57,047; 2006: $7,012.
Biggest contracts:
$4,768,000 with Navy for Construction of Structures and Facilities -- Other Industrial Buildings. Signed on 2004-09-21. Completion date: 2005-07-18.
$25,810, same as above.Signed on 2005-10-14. Completion date: 2005-10-05.
$12,150, same as above.Signed on 2005-08-23. Completion date: 2005-07-24.
$8,170, same as above.Signed on 2005-11-22. Completion date: 2005-10-12.
GEOFON, INCORPORATED (65 QUINTA COURT SUITE D; small business) : $1,554,977 in 25 contractsfrom 2000 to 2005
Contracts for Other Natural Resources and Conservation Services, Environmental Studies and Assessments, Industrial Investigations, Surveys and Technical Support for Multiple Pollutants, Construction of Structures and Facilities -- Other Non-Building Facilities, and moreby U.S. Army Corps of Engineers - civil program financing only, Army Signed by year:2000: $1,430,216; 2001: $134,168; 2002: $65,000; 2003: -$44,140; 2004: $0; 2005: -$30,267; 2006: $0.
Biggest contracts:
$148,883 with U.S. Army Corps of Engineers - civil program financing only for Other Natural Resources and Conservation Services. Signed on 2000-09-27. Completion date: 2001-06-27.
$139,775 with U.S. Army Corps of Engineers - civil program financing only for Environmental Studies and Assessments. Taking place in UT. Signed on 2000-03-22. Completion date: 2000-06-15.
$133,671 with U.S. Army Corps of Engineers - civil program financing only for Other Natural Resources and Conservation Services. Signed on 2000-09-27. Completion date: 2001-03-28.
$104,000, same as above.Signed on 2000-05-04. Completion date: 2000-07-12.
FLIGHT LIGHT INC (3513 LA GRANDE BLVD; small business) : $411,553 in 11 contractsfrom 2000 to 2006
Contracts for Indoor and Outdoor Electric Lighting Fixtures, Electrical Control Equipment, Capacitors, Miscellaneous Electric Power and Distribution Equipment, and moreby Air Force, Defense Logistics Agency, Army, Navy, and others Signed by year:2000: $250,809; 2001: $83,674; 2002: $0; 2003: $0; 2004: $25,794; 2005: $16,105; 2006: $35,171.
Biggest contracts:
$250,809 with Air Force for Indoor and Outdoor Electric Lighting Fixtures. Signed on 2000-05-10. Completion date: 2000-08-01.
$83,674 with Defense Logistics Agency for Electrical Control Equipment. Signed on 2001-02-28. Completion date: 2001-05-19.
$35,171 with Army for Capacitors. Signed on 2006-01-20. Completion date: 2006-03-31.
$11,000 with Navy for Miscellaneous Electric Power and Distribution Equipment. Signed on 2004-12-01. Completion date: 2004-12-01.
K & M BUILDING MAINTENANCE (3915 LIMESTONE WAY) : $29,880 in 7 contractsfrom 2003 to 2004
Contracts for Custodial Janitorial Services by Army, U.S. Army Corps of Engineers - civil program financing only Signed by year:2000: $0; 2001: $0; 2002: $0; 2003: $10,920; 2004: $18,960; 2005: $0; 2006: $0.
Biggest contracts:
$8,340 with Army for Custodial Janitorial Services. Signed on 2003-11-26. Completion date: 2004-09-30.
$8,280 with Army for Custodial Janitorial Services. Taking place in NV. Signed on 2004-11-04. Completion date: 2005-09-30.
$5,340 with U.S. Army Corps of Engineers - civil program financing only for Custodial Janitorial Services. Signed on 2004-11-22. Completion date: 2005-09-30.
$5,340 with Army for Custodial Janitorial Services. Signed on 2004-11-22. Completion date: 2005-09-30.
SUAREZ COMPLETE LAWN SERVICE (8274 ESSEN WAY; small business)
$7,200 with Defense Microelectronics Activity for Other Housekeeping Services. Signed on 2006-02-07. Completion date: 2007-02-28.
OVERHEAD DOOR CO OF SACRAMENTO (6756 FRANKLIN BLVD; small business)
$2,679 with Air Force for Maintenance, Repair or Alteration of Real Property -- Open Storage Facilities. Signed on 2003-04-29. Completion date: 2003-06-04.
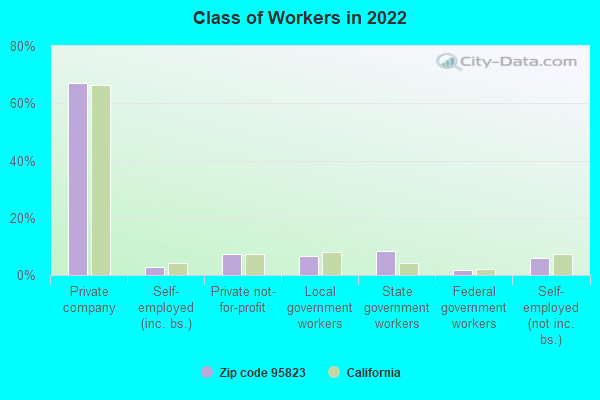
Top industries in this zip code by the number of employees in 2005:
Health Care and Social Assistance: General Medical and Surgical Hospitals (over 1000 employees: 1 establishment, 500-999 employees: 1 establishment)
Health Care and Social Assistance: Offices of Physicians (except Mental Health Specialists) (over 1000: 1, 50-99: 1, 20-49: 4, 10-19: 13, 5-9: 13, 1-4: 25)
2006 - 2018 National Fire Incident Reporting System (NFIRS) incidents
According to the data from the years 2006 - 2018 the average number of fire incidents per year is 263. The highest number of fires - 390 took place in 2018, and the least - 161 in 2009. The data has an increasing trend.
When looking into fire subcategories, the most incidents belonged to: Outside Fires (55.1%), and Structure Fires (26.2%).
Fire incident types reported to NFIRS in Zip Code 95823


 Nearest zip codes: 95824, 95758, 95828, 95832, 95820, 95822.
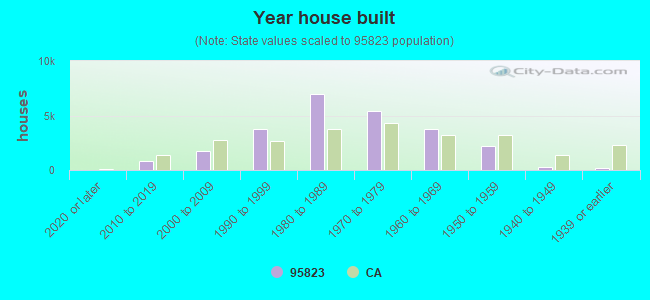


 According to the data from the years 2006 - 2018 the average number of fire incidents per year is 263. The highest number of fires - 390 took place in 2018, and the least - 161 in 2009. The data has an increasing trend.
 When looking into fire subcategories, the most incidents belonged to: Outside Fires (55.1%), and Structure Fires (26.2%).