Crime rate in Sacramento, California (CA): murders, rapes, robberies, assaults, burglaries, thefts, auto thefts, arson, law enforcement employees, police officers, crime map
Crime rate in Sacramento, CA
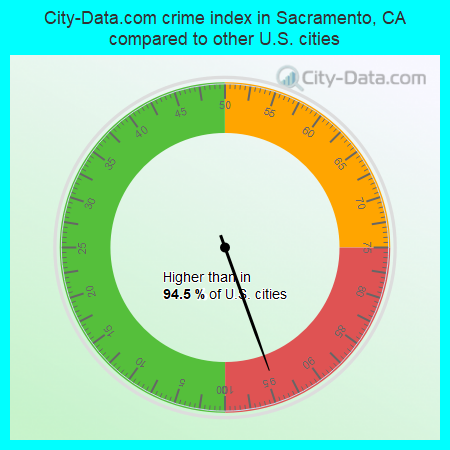
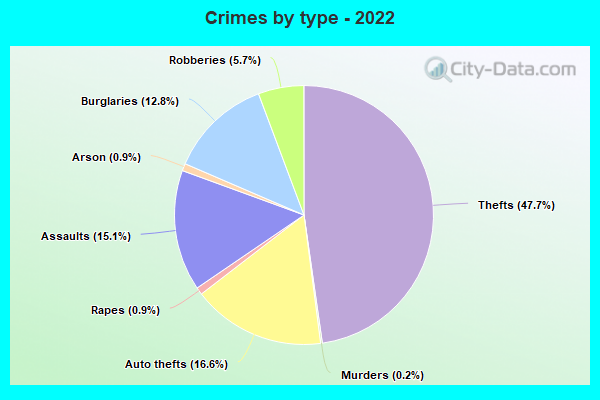
The 2022 crime rate in Sacramento, CA is 413 (City-Data.com crime index), which is 1.7 times higher than the U.S. average. It was higher than in 94.5% U.S. cities. The 2022 Sacramento crime rate rose by 26% compared to 2020. The number of homicides stood at 54 - an increase of 12 compared to 2020. In the last 5 years Sacramento has seen rise of violent crime and increasing property crime.See how dangerous Sacramento, CA is compared to the nearest cities:
(Note: Higher means more crime)
(Note: Higher means more crime)
| Sacramento: | 413.3 |
| West Sacramento: | 102.2 |
| Elk Grove: | 113.7 |
| Rancho Cordova: | 252.6 |
| Citrus Heights: | 224.6 |
| Davis: | 213.0 |
| Roseville: | 143.3 |
| Woodland: | 214.9 |
| Folsom: | 113.3 |
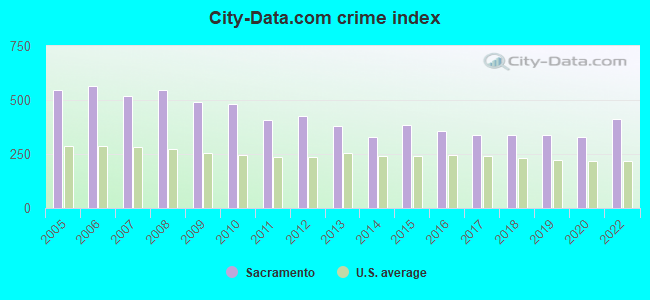
The City-Data.com crime index weighs serious crimes and violent crimes more heavily. Higher means more crime, U.S. average is 246.1. It adjusts for the number of visitors and daily workers commuting into cities.
- means the value is smaller than the state average.- means the value is about the same as the state average.
- means the value is bigger than the state average.
- means the value is much bigger than the state average.
According to our research of California and other state lists, there were 2,165 registered sex offenders living in Sacramento, California as of April 27, 2024.
The ratio of all residents to sex offenders in Sacramento is 229 to 1.
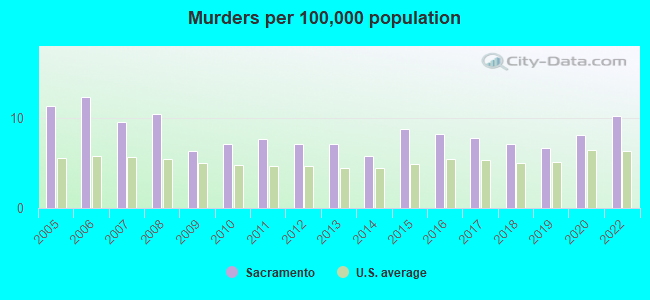
Violent crime rate in 2022
| Sacramento: | 483.9 |
| U.S. Average: | 219.8 |
Violent crime rate in 2020
| Sacramento: | 365.9 |
| U.S. Average: | 228.2 |
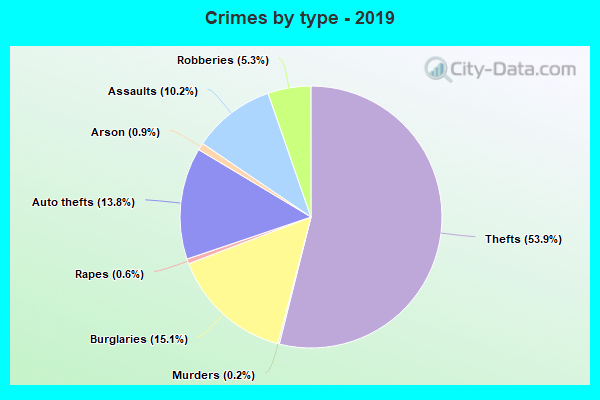
Violent crime rate in 2019
| Sacramento: | 335.8 |
| U.S. Average: | 219.9 |
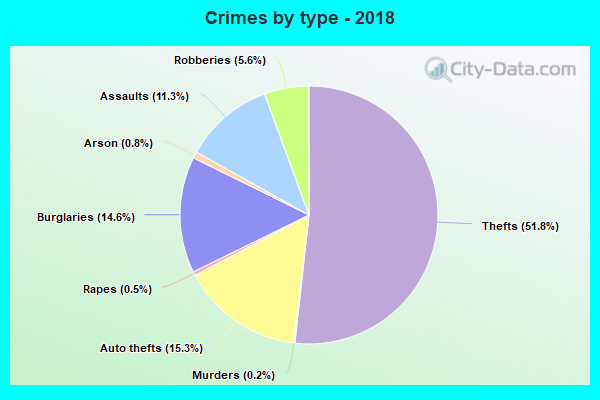
Violent crime rate in 2018
| Sacramento: | 349.0 |
| U.S. Average: | 221.2 |
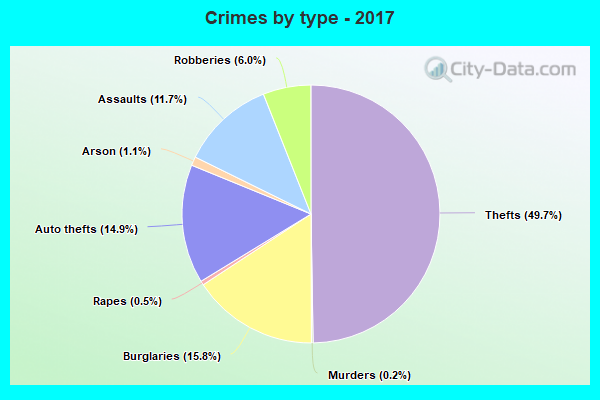
Violent crime rate in 2017
| Sacramento: | 359.4 |
| U.S. Average: | 226.2 |
Violent crime rate in 2016
| Sacramento: | 379.4 |
| U.S. Average: | 227.3 |
Violent crime rate in 2015
| Sacramento: | 392.6 |
| U.S. Average: | 219.3 |
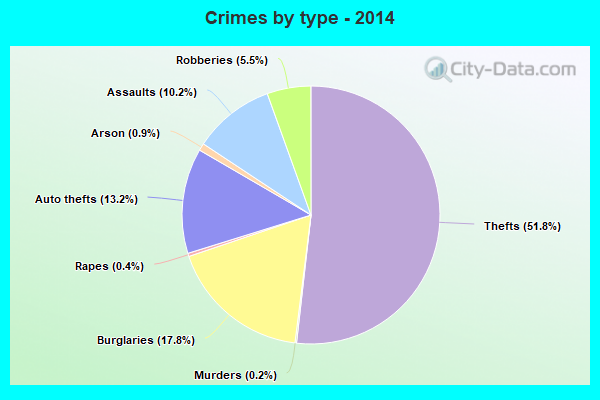
Violent crime rate in 2014
| Sacramento: | 324.2 |
| U.S. Average: | 211.1 |
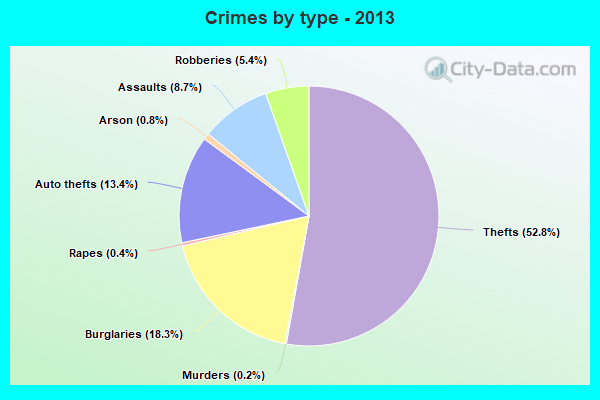
Violent crime rate in 2013
| Sacramento: | 348.6 |
| U.S. Average: | 214.2 |
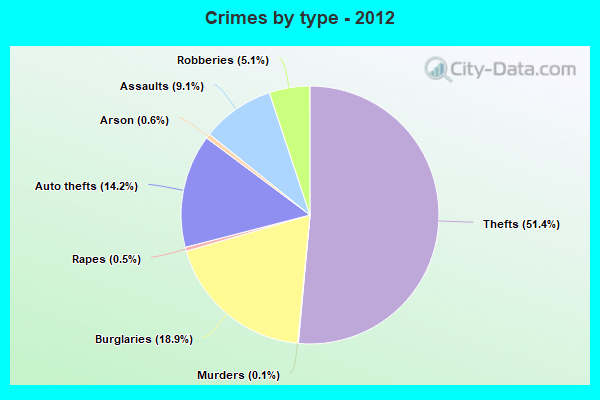
Violent crime rate in 2012
| Sacramento: | 393.1 |
| U.S. Average: | 187.4 |
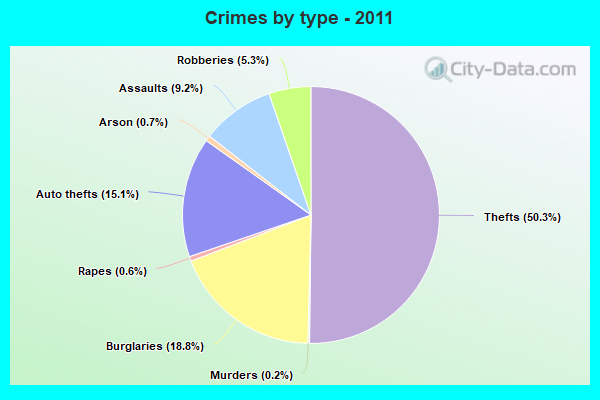
Violent crime rate in 2011
| Sacramento: | 381.0 |
| U.S. Average: | 187.1 |
Violent crime rate in 2010
| Sacramento: | 469.0 |
| U.S. Average: | 195.7 |
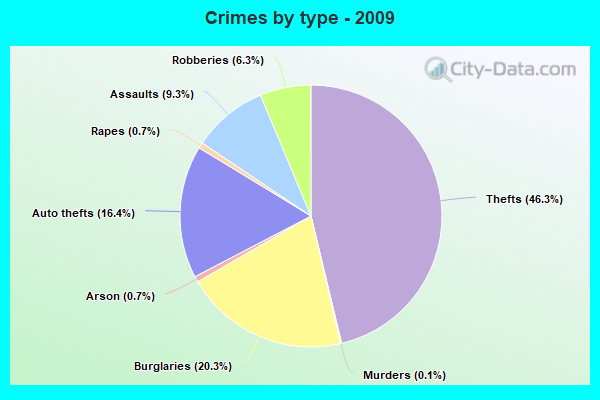
Violent crime rate in 2009
| Sacramento: | 471.4 |
| U.S. Average: | 208.9 |
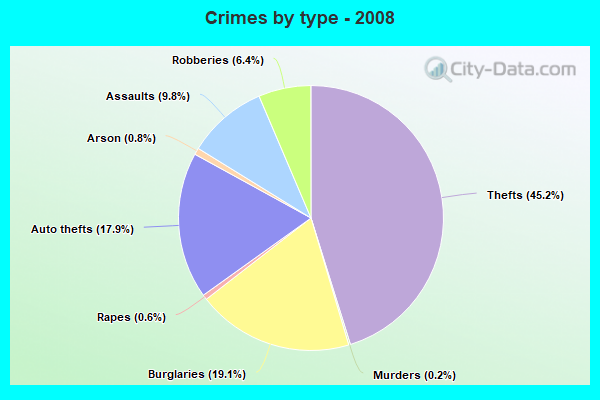
Violent crime rate in 2008
| Sacramento: | 532.6 |
| U.S. Average: | 222.5 |
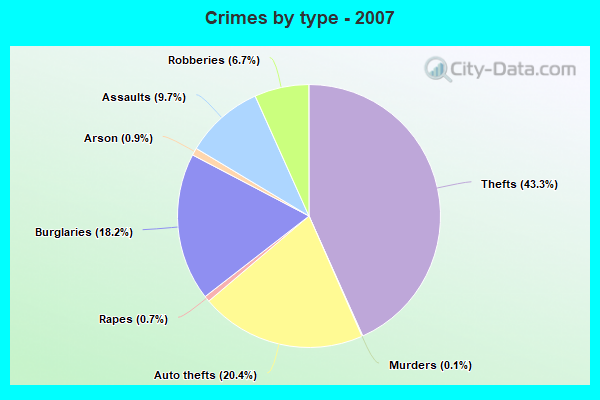
Violent crime rate in 2007
| Sacramento: | 504.1 |
| U.S. Average: | 229.1 |
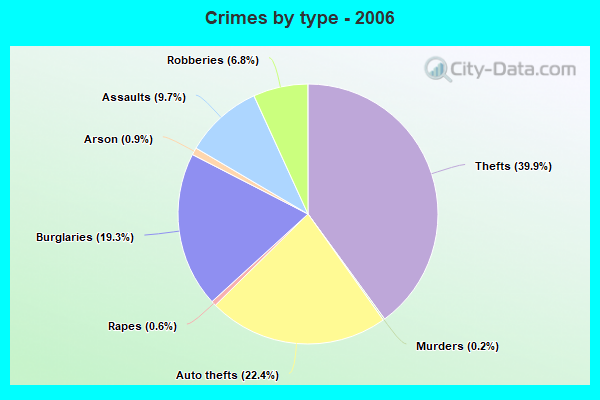
Violent crime rate in 2006
| Sacramento: | 547.4 |
| U.S. Average: | 232.6 |
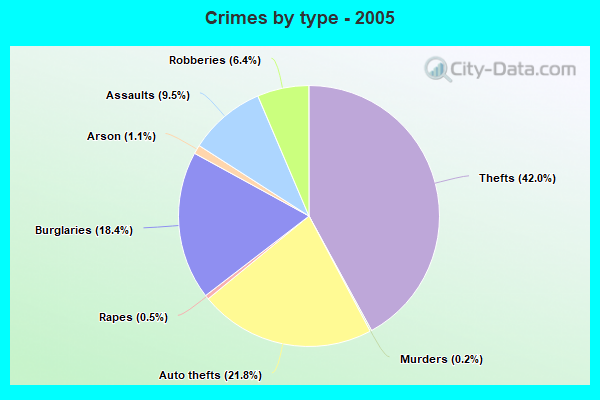
Violent crime rate in 2005
| Sacramento: | 520.3 |
| U.S. Average: | 227.0 |
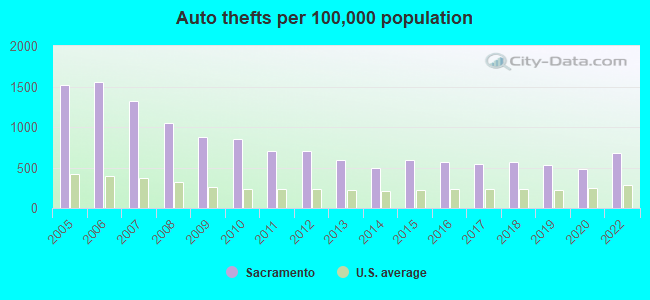
Property crime rate in 2022
| Sacramento: | 305.3 |
| U.S. Average: | 166.5 |
Property crime rate in 2020
| Sacramento: | 267.5 |
| U.S. Average: | 169.6 |
Property crime rate in 2019
| Sacramento: | 299.3 |
| U.S. Average: | 179.7 |
Property crime rate in 2018
| Sacramento: | 290.3 |
| U.S. Average: | 190.2 |
Property crime rate in 2017
| Sacramento: | 287.8 |
| U.S. Average: | 206.4 |
Property crime rate in 2016
| Sacramento: | 304.2 |
| U.S. Average: | 216.6 |
Property crime rate in 2015
| Sacramento: | 341.9 |
| U.S. Average: | 221.5 |
Property crime rate in 2014
| Sacramento: | 306.4 |
| U.S. Average: | 230.8 |
Property crime rate in 2013
| Sacramento: | 369.7 |
| U.S. Average: | 250.4 |
Property crime rate in 2012
| Sacramento: | 420.5 |
| U.S. Average: | 267.3 |
Property crime rate in 2011
| Sacramento: | 398.9 |
| U.S. Average: | 273.5 |
Property crime rate in 2010
| Sacramento: | 463.8 |
| U.S. Average: | 276.4 |
Property crime rate in 2009
| Sacramento: | 475.2 |
| U.S. Average: | 285.6 |
Property crime rate in 2008
| Sacramento: | 513.5 |
| U.S. Average: | 302.2 |
Property crime rate in 2007
| Sacramento: | 488.1 |
| U.S. Average: | 309.2 |
Property crime rate in 2006
| Sacramento: | 545.2 |
| U.S. Average: | 317.3 |
Property crime rate in 2005
| Sacramento: | 534.7 |
| U.S. Average: | 322.3 |
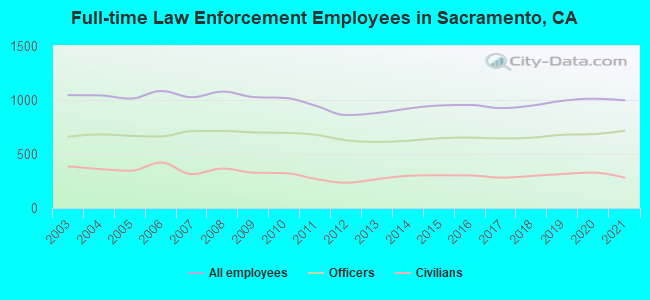
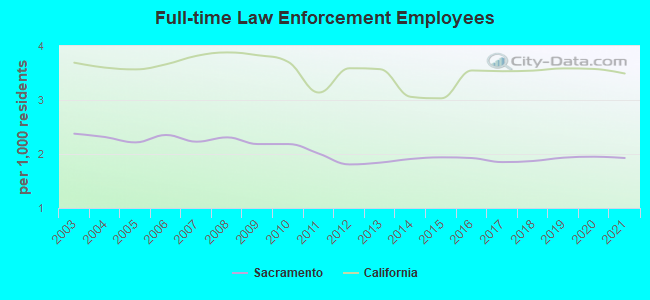
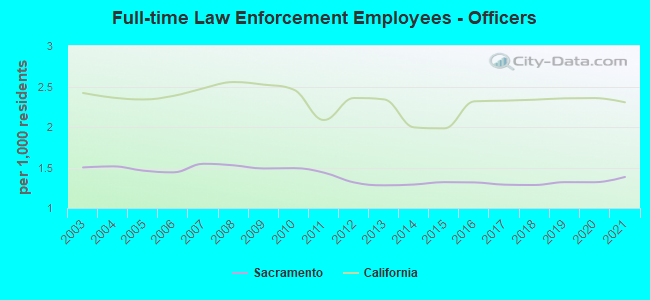
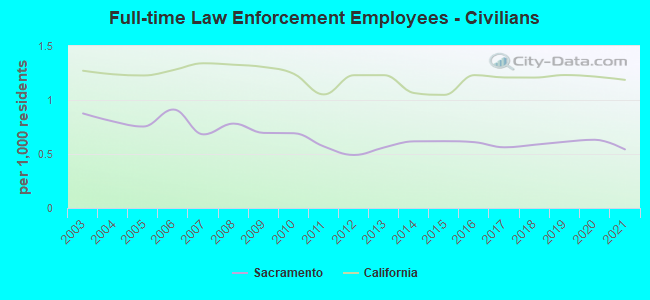
Full-time law enforcement employees in 2021, including police officers: 997 (716 officers - 596 male; 120 female).
| Officers per 1,000 residents here: | 1.38 |
| California average: | 2.30 |
Full-time law enforcement employees in 2020, including police officers: 1,012 (684 officers - 576 male; 108 female).
| Officers per 1,000 residents here: | 1.32 |
| California average: | 2.36 |
Full-time law enforcement employees in 2019, including police officers: 993 (678 officers - 569 male; 109 female).
| Officers per 1,000 residents here: | 1.32 |
| California average: | 2.35 |
Full-time law enforcement employees in 2018, including police officers: 948 (651 officers - 549 male; 102 female).
| Officers per 1,000 residents here: | 1.28 |
| California average: | 2.34 |
Full-time law enforcement employees in 2017, including police officers: 925 (644 officers - 543 male; 101 female).
| Officers per 1,000 residents here: | 1.29 |
| California average: | 2.32 |
Full-time law enforcement employees in 2016, including police officers: 954 (652 officers - 547 male; 105 female).
| Officers per 1,000 residents here: | 1.32 |
| California average: | 2.32 |
Full-time law enforcement employees in 2015, including police officers: 949 (646 officers - 539 male; 107 female).
| Officers per 1,000 residents here: | 1.32 |
| California average: | 1.98 |
Full-time law enforcement employees in 2014, including police officers: 921 (623 officers - 513 male; 110 female).
| Officers per 1,000 residents here: | 1.29 |
| California average: | 2.00 |
Full-time law enforcement employees in 2013, including police officers: 880 (612 officers - 501 male; 111 female).
| Officers per 1,000 residents here: | 1.28 |
| California average: | 2.34 |
Full-time law enforcement employees in 2012, including police officers: 861 (627 officers - 513 male; 114 female).
| Officers per 1,000 residents here: | 1.32 |
| California average: | 2.36 |
Full-time law enforcement employees in 2011, including police officers: 947 (678 officers - 553 male; 125 female).
| Officers per 1,000 residents here: | 1.44 |
| California average: | 2.09 |
Full-time law enforcement employees in 2010, including police officers: 1,019 (696 officers - 568 male; 128 female).
| Officers per 1,000 residents here: | 1.49 |
| California average: | 2.46 |
Full-time law enforcement employees in 2009, including police officers: 1,027 (700 officers - 573 male; 127 female).
| Officers per 1,000 residents here: | 1.49 |
| California average: | 2.52 |
Full-time law enforcement employees in 2008, including police officers: 1,078 (713 officers - 590 male; 123 female).
| Officers per 1,000 residents here: | 1.53 |
| California average: | 2.55 |
Full-time law enforcement employees in 2007, including police officers: 1,026 (712 officers - 588 male; 124 female).
| Officers per 1,000 residents here: | 1.55 |
| California average: | 2.48 |
Full-time law enforcement employees in 2006, including police officers: 1,083 (663 officers - 558 male; 105 female).
| Officers per 1,000 residents here: | 1.44 |
| California average: | 2.38 |
Full-time law enforcement employees in 2005, including police officers: 1,013 (668 officers - 572 male; 96 female).
| Officers per 1,000 residents here: | 1.46 |
| California average: | 2.34 |
Full-time law enforcement employees in 2004, including police officers: 1,043 (682 officers - 586 male; 96 female).
| Officers per 1,000 residents here: | 1.51 |
| California average: | 2.36 |
Full-time law enforcement employees in 2003, including police officers: 1,045 (660 officers - 575 male; 85 female).
| Officers per 1,000 residents here: | 1.50 |
| California average: | 2.42 |


Zip codes: 95811, 95814, 95815, 95816, 95817, 95818, 95819, 95822, 95833, 95834, 95835, 95837.