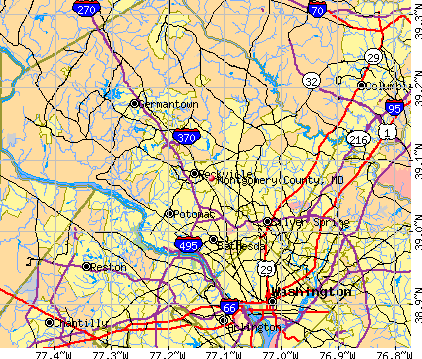
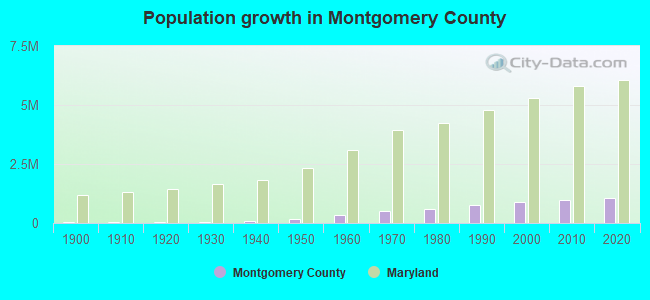
Montgomery County, Maryland (MD)
County owner-occupied free and clear houses and condos in 2010: 45,731
County owner-occupied houses and condos in 2000: 223,008
Renter-occupied apartments: 115,621 (it was 101,557 in 2000)
| % of renters here: | 31% |
| State: | 32% |
Land area: 496 sq. mi.
Water area: 11.6 sq. mi.
Population density: 2124 people per square mile (very high).
Industries providing employment: Professional, scientific, management, administrative, and waste management services (22.7%), Educational, health and social services (21.4%), Public administration (11.6%).
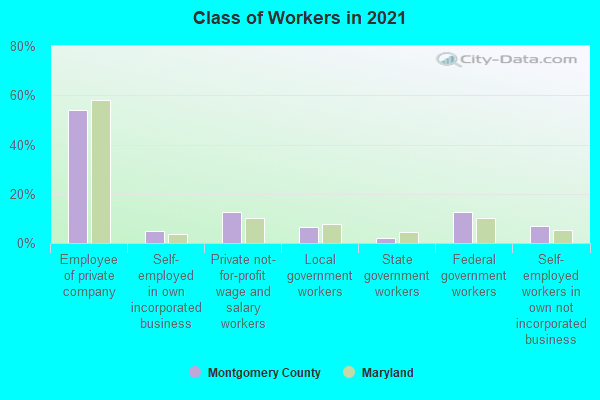
Type of workers:
- Private wage or salary: 71%
- Government: 22%
- Self-employed, not incorporated: 7%
- Unpaid family work: 0%
- OSM Map
- General Map
- Google Map
- MSN Map

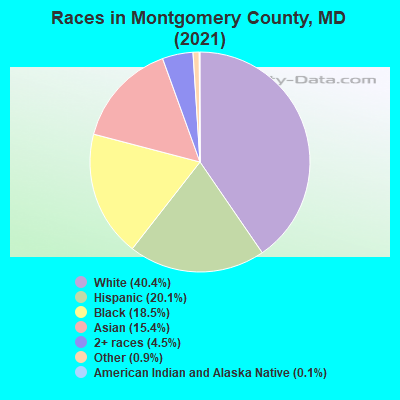
- 422,00940.1%White Non-Hispanic Alone
- 213,92620.3%Hispanic or Latino
- 191,07318.2%Black Non-Hispanic Alone
- 160,93015.3%Asian alone
- 51,6654.9%Two or more races
- 11,3181.1%Some other race alone
- 1,3400.1%American Indian and Alaska Native alone
- 2600.02%Native Hawaiian and Other
Pacific Islander alone
| Median resident age: | 40.3 years |
| Maryland median age: | 39.7 years |
| Males: 513,200 | |
| Females: 539,321 |


| Montgomery County: | 2.0 people |
| Maryland: | 3 people |
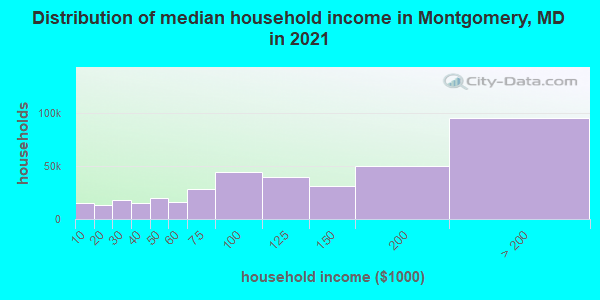
Estimated median household income in 2022: $118,323 ($71,551 in 1999)
| This county: | $118,323 |
| Maryland: | $94,991 |
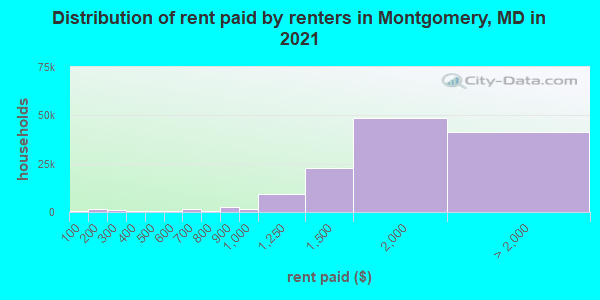
Median contract rent in 2022 for apartments: $1,744 (lower quartile is $1,404, upper quartile is $2,169)
| This county: | $1744 |
| State: | $1388 |
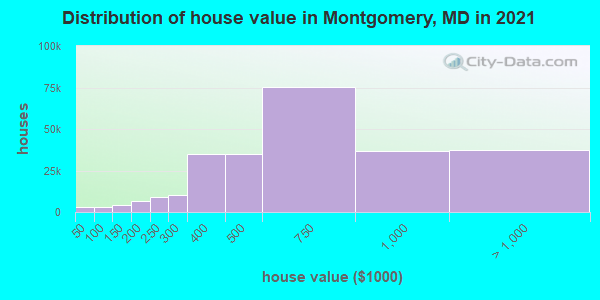
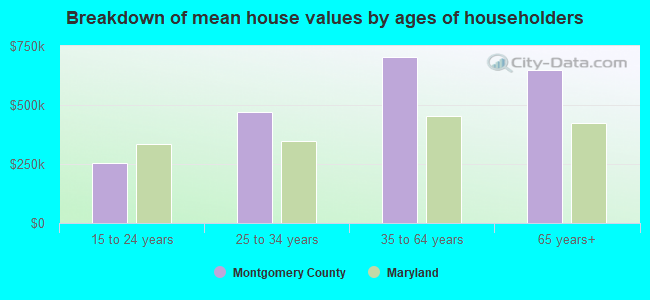
Estimated median house or condo value in 2022: $614,000 (it was $210,600 in 2000)
| Montgomery: | $614,000 |
| Maryland: | $398,100 |
Mean price in 2022:
Median monthly housing costs for homes and condos with a mortgage: $2,571Detached houses: $842,088
Here: $842,088 State: $526,819 Townhouses or other attached units: $452,464
Here: $452,464 State: $328,305 In 2-unit structures: $353,086
Here: $353,086 State: $346,599 In 3-to-4-unit structures: $392,420
Here: $392,420 State: $295,378 In 5-or-more-unit structures: $434,827
Here: $434,827 State: $350,378 Mobile homes: $167,508
Here: $167,508 State: $89,353
Median monthly housing costs for units without a mortgage: $923
Institutionalized population: 5,864
Crime in 2021 (reported by the sheriff's office or county police, not the county total):
- Murders: 30
- Rapes: 309
- Robberies: 432
- Assaults: 859
- Burglaries: 1076
- Thefts: 10737
- Auto thefts: 1338
Crime in 2020 (reported by the sheriff's office or county police, not the county total):
- Murders: 0
- Rapes: 0
- Robberies: 0
- Assaults: 2
- Burglaries: 0
- Thefts: 0
- Auto thefts: 0
Health of residents in Montgomery County based on CDC Behavioral Risk Factor Surveillance System Survey Questionnaires from 2003 to 2012:
General health status score of residents in this county from 1 (poor) to 5 (excellent) is 3.8. This is significantly better than average.82.6% of residents exercised in the past month. This is more than average.
36.1% of residents smoked 100+ cigarettes in their lives. This is less than average.
82.4% of adult residents drank alcohol in the past 30 days. This is more than average.
81.8% of residents visited a dentist within the past year. This is more than average.
Average weight of males is 187 pounds. This is less than average.
Average weight of females is 152 pounds. This is less than average.
11.6% of residents keep firearms around their homes. This is less than average.
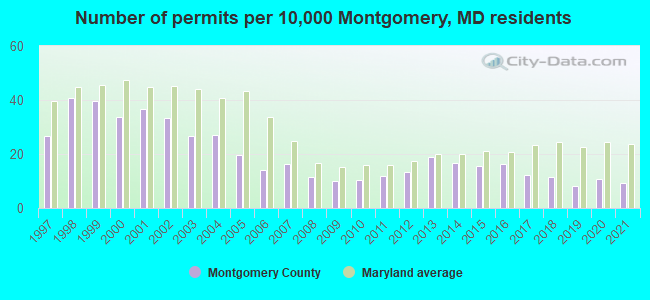
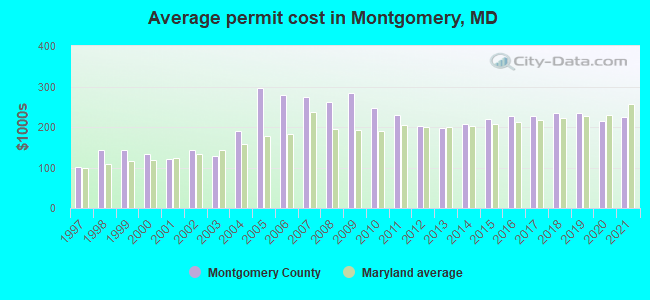
Single-family new house construction building permits:
- 2022: 590 buildings, average cost: $236,000
- 2021: 793 buildings, average cost: $224,100
- 2020: 932 buildings, average cost: $213,500
- 2019: 710 buildings, average cost: $235,300
- 2018: 989 buildings, average cost: $234,700
- 2017: 1054 buildings, average cost: $228,100
- 2016: 1414 buildings, average cost: $228,100
- 2015: 1367 buildings, average cost: $218,500
- 2014: 1440 buildings, average cost: $206,500
- 2013: 1652 buildings, average cost: $197,800
- 2012: 1174 buildings, average cost: $202,900
- 2011: 1031 buildings, average cost: $229,400
- 2010: 909 buildings, average cost: $247,600
- 2009: 862 buildings, average cost: $283,600
- 2008: 997 buildings, average cost: $260,600
- 2007: 1408 buildings, average cost: $275,300
- 2006: 1237 buildings, average cost: $277,600
- 2005: 1700 buildings, average cost: $297,300
- 2004: 2376 buildings, average cost: $191,200
- 2003: 2339 buildings, average cost: $128,100
- 2002: 2909 buildings, average cost: $141,700
- 2001: 3191 buildings, average cost: $120,900
- 2000: 2931 buildings, average cost: $132,800
- 1999: 3467 buildings, average cost: $142,800
- 1998: 3548 buildings, average cost: $141,700
- 1997: 2333 buildings, average cost: $101,000
Median real estate property taxes paid for housing units with mortgages in 2022: $4,849 (0.8%)
Median real estate property taxes paid for housing units with no mortgage in 2022: $5,527 (0.9%)
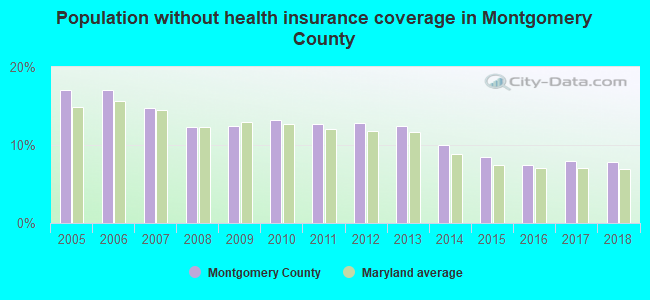
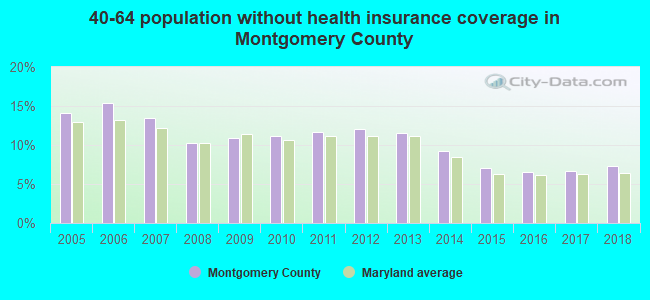
| Montgomery County: | 7.9% |
| Maryland: | 9.6% |
Median age of residents in 2022: 40.3 years old
(Males: 38.8 years old, Females: 41.9 years old)
(Median age for: White residents: 47.9 years old, Black residents: 37.7 years old, American Indian residents: 34.8 years old, Asian residents: 43.3 years old, Hispanic or Latino residents: 32.5 years old, Other race residents: 30.9 years old)
Area name: Washington-Arlington-Alexandria, DC-VA-MD HUD Metro FMR Area
Fair market rent in 2006 for a 1-bedroom apartment in Montgomery County is $1080 a month.
Fair market rent for a 2-bedroom apartment is $1225 a month.
Fair market rent for a 3-bedroom apartment is $1580 a month.
Cities in this county include: Silver Spring, Wheaton-Glenmont, Germantown, Bethesda, Gaithersburg, Aspen Hill, Wheaton, Rockville, Potomac, North Bethesda.
2023 air pollution in Montgomery County:
Ozone (1-hour): 0.035 ppm (standard limit: 0.12 ppm). Near U.S. average.
Particulate Matter (PM2.5) Annual: 7.3 µg/m3(standard limit: 15.0 µg/m3). Near U.S. average.
Neighboring counties: Audrain County, Missouri  , Mineral County, Nevada , Denver County, Colorado , Clay County, Missouri , Jefferson County, Colorado , Pike County, Ohio .
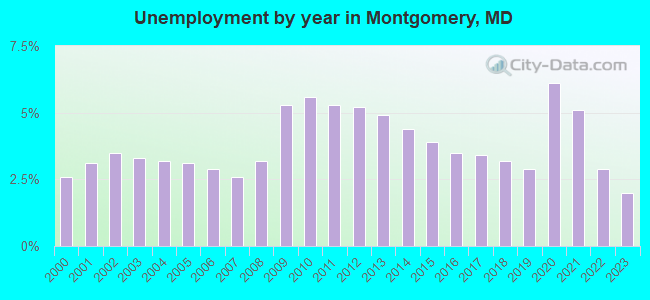
| Here: | 1.8% |
| Maryland: | 2.0% |
Current college students: 57,291
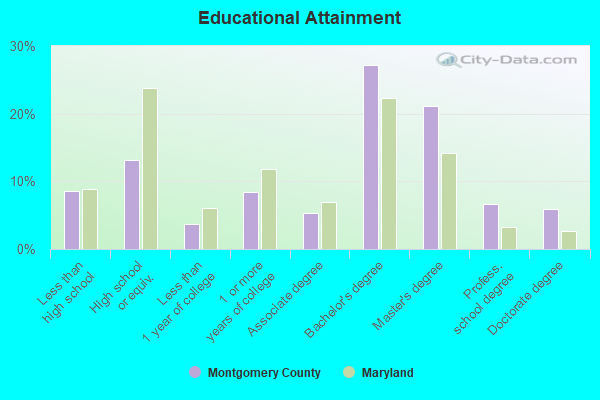
People 25 years of age or older with a high school degree or higher: 91.9%
People 25 years of age or older with a bachelor's degree or higher: 60.9%
Number of foreign born residents: 358,504 (55.1% naturalized citizens)
| Montgomery County: | 34.1% |
| Whole state: | 16.7% |
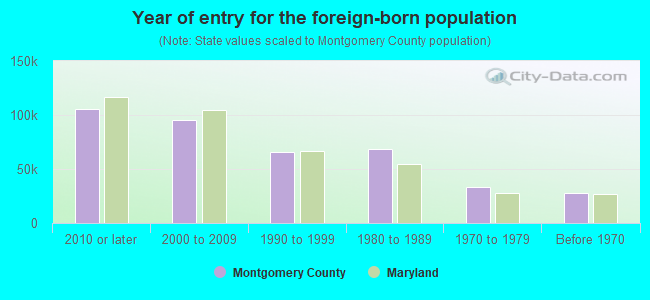
- Year of entry for the foreign-born population
- 123,4492010 or later
- 87,0182000 to 2009
- 62,7771990 to 1999
- 68,7271980 to 1989
- 32,8971970 to 1979
- 27,686Before 1970
Mean travel time to work (commute): minutes
Percentage of county residents living and working in this county: 82.2%
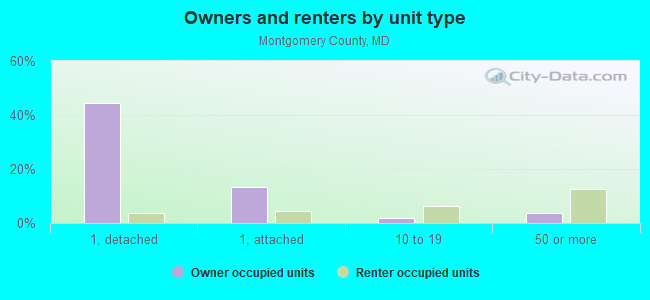
Housing units in structures:
- One, detached: 188,086
- One, attached: 73,403
- Two: 2,848
- 3 or 4: 5,998
- 5 to 9: 20,797
- 10 to 19: 34,993
- 20 to 49: 11,108
- 50 or more: 68,048
- Mobile homes: 1,525
- Boats, RVs, vans, etc.: 44
Housing units in Montgomery County with a mortgage: 181,440 (20,024 second mortgage, 476 home equity loan, 16,486 both second mortgage and home equity loan)
Houses without a mortgage: 3,596
| Here: | 98.4% with mortgage |
| State: | 97.5% with mortgage |
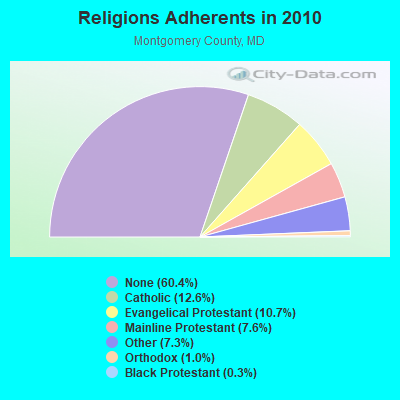
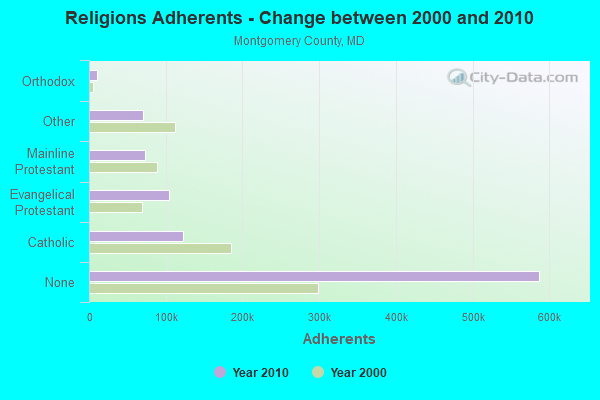
Religion statistics for Montgomery County
| Religion | Adherents | Congregations |
|---|---|---|
| Catholic | 122,569 | 39 |
| Evangelical Protestant | 104,377 | 319 |
| Mainline Protestant | 73,637 | 186 |
| Other | 70,946 | 153 |
| Orthodox | 9,889 | 14 |
| Black Protestant | 3,189 | 22 |
| None | 587,170 | - |
Source: Clifford Grammich, Kirk Hadaway, Richard Houseal, Dale E.Jones, Alexei Krindatch, Richie Stanley and Richard H.Taylor. 2012. 2010 U.S.Religion Census: Religious Congregations & Membership Study. Association of Statisticians of American Religious Bodies. Jones, Dale E., et al. 2002. Congregations and Membership in the United States 2000. Nashville, TN: Glenmary Research Center.
Food Environment Statistics:
| Montgomery County: | 2.16 / 10,000 pop. |
| State: | 1.96 / 10,000 pop. |
| Here: | 0.02 / 10,000 pop. |
| Maryland: | 0.07 / 10,000 pop. |
| This county: | 1.00 / 10,000 pop. |
| Maryland: | 1.22 / 10,000 pop. |
| Montgomery County: | 1.42 / 10,000 pop. |
| Maryland: | 2.05 / 10,000 pop. |
| This county: | 5.91 / 10,000 pop. |
| State: | 5.40 / 10,000 pop. |
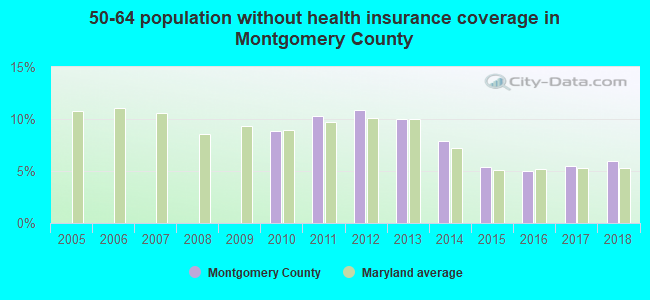
| Montgomery County: | 6.7% |
| Maryland: | 9.1% |
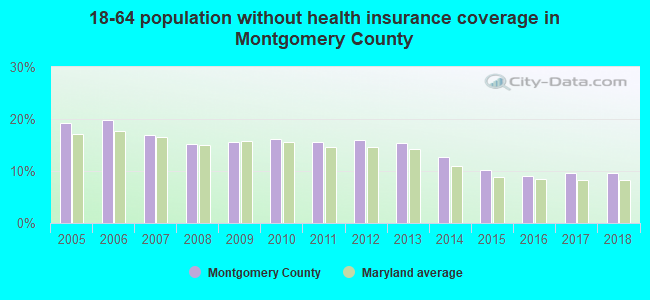
| Montgomery County: | 18.8% |
| State: | 26.7% |
| Here: | 19.9% |
| State: | 15.5% |
Agriculture in Montgomery County:
Average size of farms: 130 acresAverage value of agricultural products sold per farm: $72,156
Average value of crops sold per acre for harvested cropland: $820.62
The value of nursery, greenhouse, floriculture, and sod as a percentage of the total market value of agricultural products sold: 63.95%
The value of livestock, poultry, and their products as a percentage of the total market value of agricultural products sold: 12.96%
Average total farm production expenses per farm: $85,520
Harvested cropland as a percentage of land in farms: 58.82%
Irrigated harvested cropland as a percentage of land in farms: 3.20%
Average market value of all machinery and equipment per farm: $64,128
The percentage of farms operated by a family or individual: 86.14%
Average age of principal farm operators: 57 years
Average number of cattle and calves per 100 acres of all land in farms: 10.42
Milk cows as a percentage of all cattle and calves: 19.76%
Corn for grain: 11121 harvested acres
All wheat for grain: 4717 harvested acres
Soybeans for beans: 13794 harvested acres
Vegetables: 986 harvested acres
Land in orchards: 278 acres
Earthquake activity:
Montgomery County-area historical earthquake activity is significantly above Maryland state average. It is 57% smaller than the overall U.S. average.On 8/23/2011 at 17:51:04, a magnitude 5.8 (5.8 MW, Depth: 3.7 mi, Class: Moderate, Intensity: VI - VII) earthquake occurred 91.7 miles away from Montgomery County center
On 1/16/1994 at 01:49:16, a magnitude 4.6 (4.6 MB, 4.6 LG, Depth: 3.1 mi, Class: Light, Intensity: IV - V) earthquake occurred 104.5 miles away from the county center
On 8/25/2011 at 05:07:52, a magnitude 4.5 (4.5 ML, Depth: 4.2 mi) earthquake occurred 90.2 miles away from the county center
On 9/25/1998 at 19:52:52, a magnitude 5.2 (4.8 MB, 4.3 MS, 5.2 LG, 4.5 MW, Depth: 3.1 mi) earthquake occurred 240.3 miles away from the county center
On 12/9/2003 at 20:59:18, a magnitude 4.5 (4.5 ML, Depth: 6.2 mi) earthquake occurred 104.2 miles away from Montgomery County center
On 12/9/2003 at 20:59:14, a magnitude 4.5 (4.5 MB, 4.5 LG) earthquake occurred 111.1 miles away from the county center
Magnitude types: regional Lg-wave magnitude (LG), body-wave magnitude (MB), local magnitude (ML), surface-wave magnitude (MS), moment magnitude (MW)
Most recent natural disasters:
- Maryland Covid-19 Pandemic, Incident Period: January 20, 2020, Major Disaster (Presidential) Declared DR-4491-MD: March 26, 2020, FEMA Id: 4491, Natural disaster type: Other
- Maryland Severe Winter Storm and Snowstorm, Incident Period: January 22, 2016 to January 23, 2016, Major Disaster (Presidential) Declared DR-4261: March 04, 2016, FEMA Id: 4261, Natural disaster type: Snowstorm, Winter Storm
- Maryland Hurricane Sandy, Incident Period: October 26, 2012 to November 08, 2012, Emergency Declared EM-3349: October 28, 2012, FEMA Id: 3349, Natural disaster type: Hurricane
- Maryland Hurricane Sandy, Incident Period: October 26, 2012 to November 04, 2012, Major Disaster (Presidential) Declared DR-4091: November 20, 2012, FEMA Id: 4091, Natural disaster type: Hurricane
- Maryland Severe Storms and Straight-line Winds, Incident Period: June 29, 2012 to July 08, 2012, Major Disaster (Presidential) Declared DR-4075: August 02, 2012, FEMA Id: 4075, Natural disaster type: Storm, Wind
- Maryland Hurricane Irene, Incident Period: August 26, 2011 to September 05, 2011, Emergency Declared EM-3335: August 27, 2011, FEMA Id: 3335, Natural disaster type: Hurricane
- Maryland Severe Winter Storms and Snowstorms, Incident Period: February 05, 2010 to February 11, 2010, Major Disaster (Presidential) Declared DR-1910: May 06, 2010, FEMA Id: 1910, Natural disaster type: Snowstorm, Winter Storm
- Maryland Severe Winter Storm and Snowstorm, Incident Period: December 18, 2009 to December 20, 2009, Major Disaster (Presidential) Declared DR-1875: February 19, 2010, FEMA Id: 1875, Natural disaster type: Snowstorm, Winter Storm
- Maryland Severe Storms, Flooding, and Tornadoes, Incident Period: June 22, 2006 to July 12, 2006, Major Disaster (Presidential) Declared DR-1652: July 02, 2006, FEMA Id: 1652, Natural disaster type: Storm, Tornado, Flood
- Maryland Hurricane Katrina Evacuation, Incident Period: August 29, 2005 to October 01, 2005, Emergency Declared EM-3251: September 13, 2005, FEMA Id: 3251, Natural disaster type: Hurricane
- 9 other natural disasters have been reported since 1953.
The number of natural disasters in Montgomery County (19) is greater than the US average (15).
Major Disasters (Presidential) Declared: 14
Emergencies Declared: 5
Causes of natural disasters: Hurricanes: 5, Winter Storms: 5, Snowstorms: 4, Storms: 4, Floods: 3, Winds: 2, Blizzard: 1, Heavy Rain: 1, Snowfall: 1, Tornado: 1, Tropical Storm: 1, Other: 1 (Note: some incidents may be assigned to more than one category).
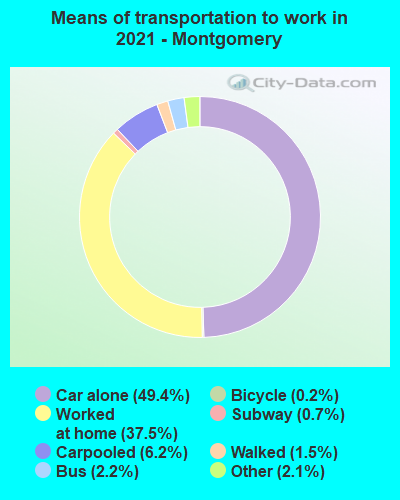
Means of transportation to work:
- Drove a car alone: 303,831 (55.8%)
- Carpooled: 43,119 (7.9%)
- Bus: 14,183 (2.6%)
- Subway or elevated rail: 8,775 (1.6%)
- Long-distance train or commuter rail: 480 (0.1%)
- Light rail, streetcar or trolley: 270 (0.0%)
- Taxicab, motorcycle, or other means: 8,161 (1.5%)
- Bicycle: 2,313 (0.4%)
- Walked: 7,905 (1.5%)
- Worked at home: 155,134 (28.5%)

- Health care and social assistance (16%)
- Professional, scientific, and technical services (14%)
- Educational services (13%)
- Public administration (11%)
- Other services, except public administration (8%)
- Retail trade (5%)
- Accommodation and food services (5%)
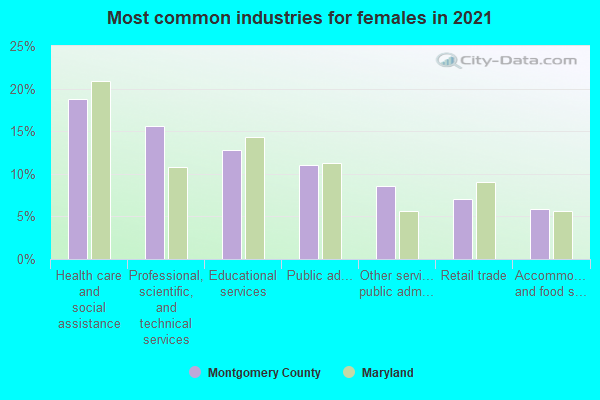
- Health care and social assistance (18%)
- Professional, scientific, and technical services (15%)
- Educational services (14%)
- Public administration (11%)
- Other services, except public administration (9%)
- Retail trade (6%)
- Accommodation and food services (5%)
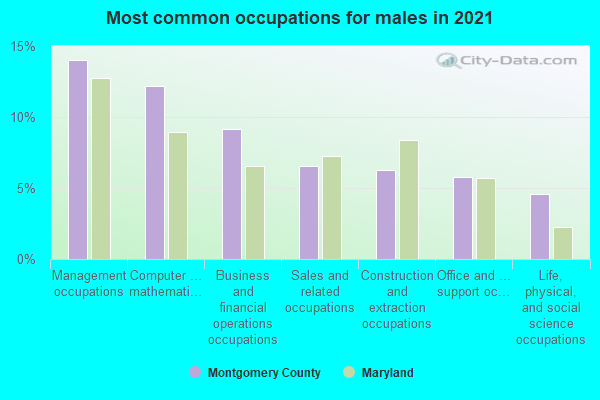
- Management occupations (15%)
- Computer and mathematical occupations (12%)
- Construction and extraction occupations (8%)
- Business and financial operations occupations (8%)
- Sales and related occupations (6%)
- Life, physical, and social science occupations (4%)
- Transportation occupations (4%)
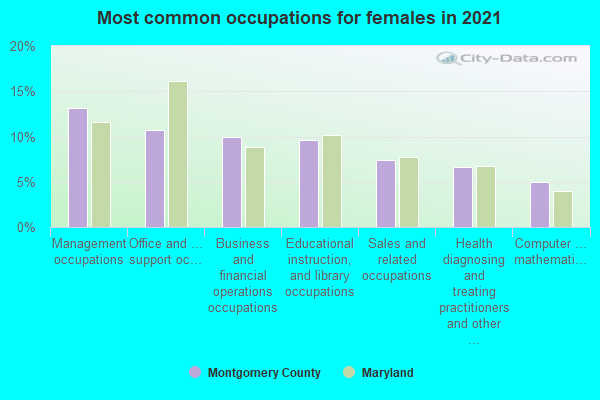
- Management occupations (13%)
- Educational instruction, and library occupations (11%)
- Business and financial operations occupations (10%)
- Office and administrative support occupations (10%)
- Sales and related occupations (7%)
- Health diagnosing and treating practitioners and other technical occupations (6%)
- Personal care and service occupations (5%)
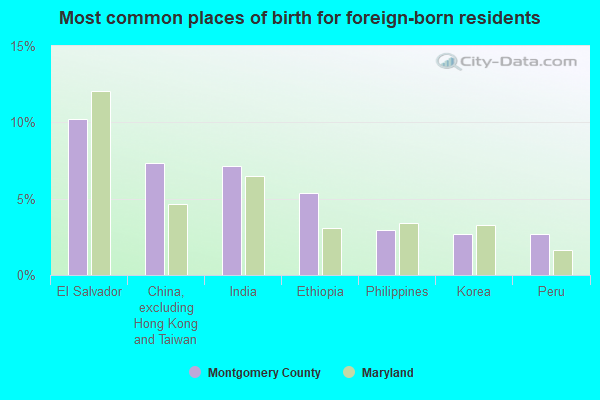
- El Salvador (11%)
- Ethiopia (8%)
- China, excluding Hong Kong and Taiwan (7%)
- India (7%)
- Honduras (4%)
- Korea (3%)
- Iran (3%)
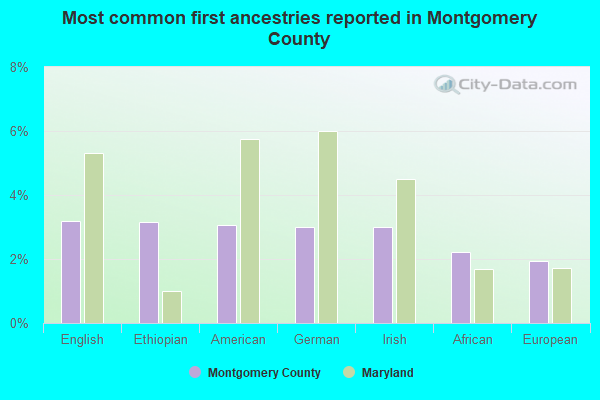
- Ethiopian (5%)
- Irish (3%)
- English (3%)
- German (3%)
- American (3%)
- European (2%)
- African (2%)
People in group quarters in Montgomery County, Maryland in 2010:
- 4,557 people in nursing facilities/skilled-nursing facilities
- 903 people in local jails and other municipal confinement facilities
- 643 people in emergency and transitional shelters (with sleeping facilities) for people experiencing homelessness
- 628 people in other noninstitutional facilities
- 617 people in group homes intended for adults
- 455 people in college/university student housing
- 269 people in workers' group living quarters and job corps centers
- 214 people in military barracks and dormitories (nondisciplinary)
- 210 people in residential treatment centers for adults
- 148 people in correctional residential facilities
- 61 people in group homes for juveniles (non-correctional)
- 55 people in correctional facilities intended for juveniles
- 51 people in military treatment facilities with assigned patients
- 40 people in residential schools for people with disabilities
- 34 people in residential treatment centers for juveniles (non-correctional)
- 15 people in in-patient hospice facilities
People in group quarters in Montgomery County, Maryland in 2000:
- 4,357 people in nursing homes
- 1,669 people in other noninstitutional group quarters
- 514 people in local jails and other confinement facilities (including police lockups)
- 473 people in other nonhousehold living situations
- 394 people in military barracks, etc.
- 360 people in college dormitories (includes college quarters off campus)
- 328 people in homes for the mentally retarded
- 265 people in other group homes
- 226 people in mental (psychiatric) hospitals or wards
- 168 people in religious group quarters
- 166 people in homes for the mentally ill
- 136 people in halfway houses
- 90 people in hospitals/wards and hospices for chronically ill
- 88 people in homes or halfway houses for drug/alcohol abuse
- 62 people in homes for the physically handicapped
- 59 people in short-term care, detention or diagnostic centers for delinquent children
- 57 people in hospices or homes for chronically ill
- 41 people in hospitals or wards for drug/alcohol abuse
- 33 people in other hospitals or wards for chronically ill
- 13 people in homes for abused, dependent, and neglected children
- 9 people in agriculture workers' dormitories on farms
- 8 people in job corps and vocational training facilities
- 5 people in other workers' dormitories
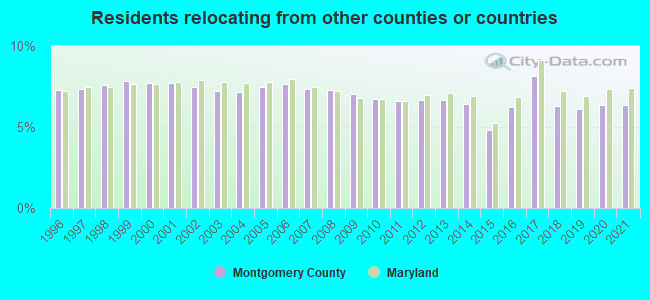
6.39% of this county's 2021 resident taxpayers lived in other counties in 2020 ($98,213 average adjusted gross income)
| Here: | 6.39% |
| Maryland average: | 7.42% |
0.04% of residents moved from foreign countries ($657 average AGI)
Montgomery County: 0.04% Maryland average: 0.05%
2.03% relocated from other counties in Maryland ($21,545 average AGI)
4.32% relocated from other states ($76,010 average AGI)
Montgomery County: 4.32% Maryland average: 3.41%
Top counties from which taxpayers relocated into this county between 2020 and 2021:
| from Prince George's County, MD | |
| from District of Columbia, DC | |
| from Fairfax County, VA | |
| from Frederick County, MD | |
| from Howard County, MD | |
| from Arlington County, VA | |
| from Anne Arundel County, MD |
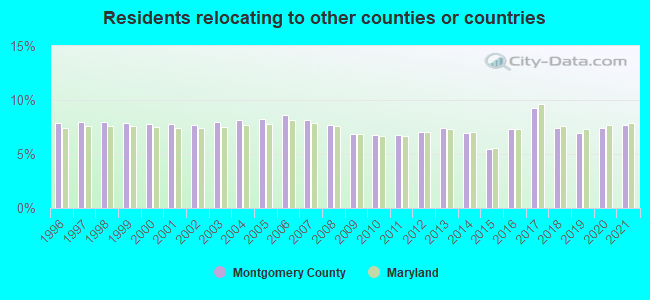
7.69% of this county's 2020 resident taxpayers moved to other counties in 2021 ($102,008 average adjusted gross income)
| Here: | 7.69% |
| Maryland average: | 7.91% |
0.05% of residents moved to foreign countries ($861 average AGI)
Montgomery County: 0.05% Maryland average: 0.04%
2.90% relocated to other counties in Maryland ($29,017 average AGI)
4.75% relocated to other states ($72,130 average AGI)
Montgomery County: 4.75% Maryland average: 3.93%
Top counties to which taxpayers relocated from this county between 2020 and 2021:
| to Prince George's County, MD | |
| to Frederick County, MD | |
| to District of Columbia, DC | |
| to Fairfax County, VA | |
| to Howard County, MD | |
| to Anne Arundel County, MD | |
| to Baltimore city, MD |
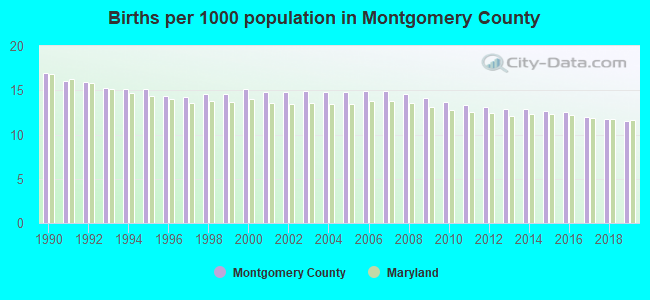
Births per 1000 population from 1990 to 1999: 15.2
Births per 1000 population from 2000 to 2009: 14.8
Births per 1000 population from 2010 to 2022: 10.6
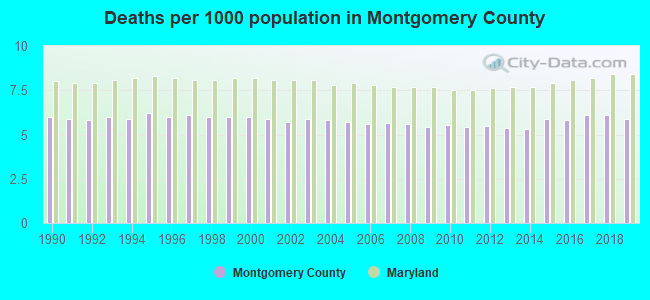
Deaths per 1000 population from 1990 to 1999: 6.0
Deaths per 1000 population from 2000 to 2009: 5.7
Deaths per 1000 population from 2010 to 2020: 5.8
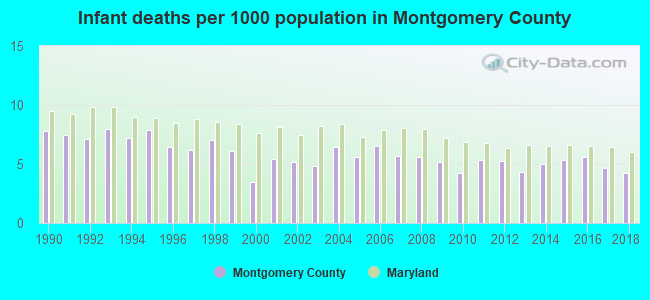
Infant deaths per 1000 live births from 1990 to 1999: 7.1
Infant deaths per 1000 live births from 2000 to 2009: 5.4
Infant deaths per 1000 live births from 2010 to 2021: 4.9
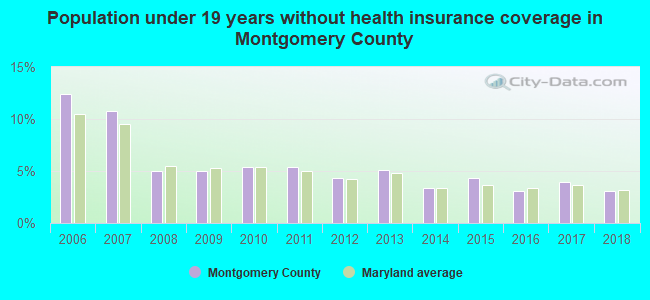
Persons under 19 years old without health insurance coverage in 2018: 3.1%
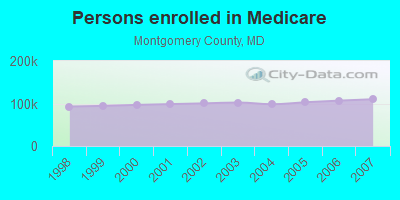
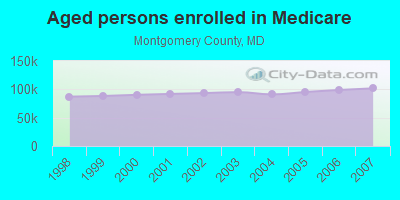
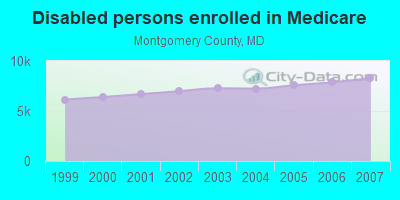
Persons enrolled in hospital insurance and/or supplemental medical insurance (Medicare) in July 1, 2007: 110,053 (101,757 aged, 8,296 disabled)
Children under 18 without health insurance coverage in 2007: 20,870 (8%)
Most common underlying causes of death in Montgomery County, Maryland in 1999 - 2019:
- Atherosclerotic heart disease (6,574)
- Unspecified dementia (6,099)
- Acute myocardial infarction, unspecified (5,914)
- Bronchus or lung, unspecified - Malignant neoplasms (5,614)
- Atherosclerotic cardiovascular disease, so described (4,378)
- Stroke, not specified as haemorrhage or infarction (3,332)
- Pneumonia, unspecified (3,228)
- Chronic obstructive pulmonary disease, unspecified (3,049)
- Alzheimer disease, unspecified (3,026)
- Breast, unspecified - Malignant neoplasms (2,482)
Population without health insurance coverage in 2000: 12%
Children under 18 without health insurance coverage in 2000: 13%
Short term general hospital admissions per 100,000 population in 2004: 10,279
Short term general hospital beds per 100,000 population in 2004: 170
Emergency room visits per 100,000 population in 2004: 31,191
General practice office based MDs per 100,000 population in 2005: 1,464
Medical specialist MDs per 100,000 population in 2005: 619
Dentists per 100,000 population in 1998: 12
Total births per 100,000 population, July 2005 - July 2006 : 91
Total deaths per 100,000 population, July 2005 - July 2006: 95
Limited-service eating places per 100,000 population in 2005 : 14
Beer, wine & liquor stores per 100,000 population in 2005: 1
Fitness & recreation sports centers per 100,000 population in 2005: 4,336
Homicides per 1,000,000 population from 2000 to 2006: 30.4. This is less than state average.
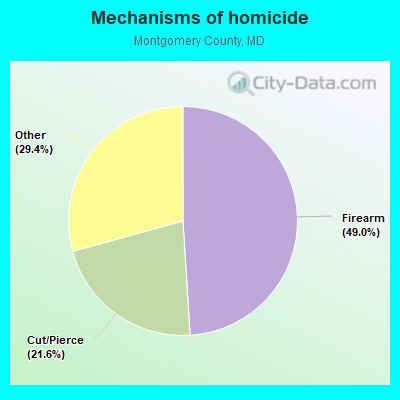
- Firearm - 14.9
- Cut/Pierce - 6.6
- Other - 8.9
Suicides per 1,000,000 population from 2000 to 2006: 59.9. This is less than state average.
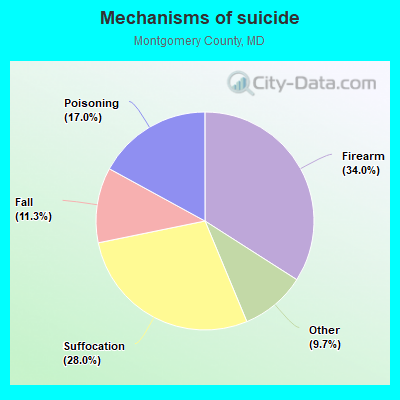
- Firearm - 20.4
- Suffocation - 16.8
- Poisoning - 10.2
- Fall - 6.7
- Other - 5.8
Household type by relationship:
Households: 1,052,521- Male householders: 201,665 (44,943 living alone), Female householders: 189,632 (64,844 living alone)
201,954 spouses (199,220 opposite-sex spouses), 20,592 unmarried partners, (19,435 opposite-sex unmarried partners), 315,300 children (300,186 natural, 6,744 adopted, 8,370 stepchildren), 14,077 grandchildren, 15,117 brothers or sisters, 25,680 parents, 255 foster children, 21,828 other relatives, 37,741 non-relatives
- In group quarters: 8,680
Size of family households: 100,574 2-persons, 61,715 3-persons, 58,229 4-persons, 24,959 5-persons, 9,474 6-persons, 6,299 7-or-more-persons.
Size of nonfamily households: 109,787 1-person, 16,313 2-persons, 2,446 3-persons, 925 4-persons, 439 5-persons, 137 6-persons.
169,922 married couples with children.
45,315 single-parent households (11,512 men, 33,803 women).
56.8% of residents of Montgomery speak English at home.
17.2% of residents speak Spanish at home (55% speak English very well, 19% speak English well, 18% speak English not well, 8% don't speak English at all).
10.3% of residents speak other Indo-European language at home (74% speak English very well, 17% speak English well, 7% speak English not well, 2% don't speak English at all).
9.8% of residents speak Asian or Pacific Island language at home (57% speak English very well, 23% speak English well, 17% speak English not well, 3% don't speak English at all).
5.9% of residents speak other language at home (76% speak English very well, 18% speak English well, 4% speak English not well, 1% don't speak English at all).
In fiscal year 2004:
Federal Government expenditure: $15,294,395,000 ($16,594 per capita)
Department of Defense expenditure: $2,661,203,000
Federal direct payments to individuals for retirement and disability: $2,248,486,000
Federal other direct payments to individuals: $746,746,000
Federal direct payments not to individuals: $10,809,000
Federal grants: $1,236,471,000
Federal procurement contracts: $7,510,566,000 ($1,917,702,000 Department of Defense)
Federal salaries and wages: $3,541,317,000 ($467,512,000 Department of Defense)
Federal Government direct loans: $1,953,000
Federal guaranteed/insured loans: $558,562,000
Federal Government insurance: $191,077,000
Population change from April 1, 2000 to July 1, 2005:
Births: 70,527| Here: | 76 per 1000 residents |
| State: | 71 per 1000 residents |
Deaths: 28,966
| Here: | 31 per 1000 residents |
| State: | 41 per 1000 residents |
Net international migration: +51,170
| Here: | +55 per 1000 residents |
| State: | +19 per 1000 residents |
Net internal migration: -38,228
| Here: | |
| State: |
Total withdrawal of fresh water for public supply: 380.22 millions of gallons per day (0% from ground, 100% from surface)
| Here: | 7.7 |
| State: | 7.3 |
| Here: | 3.9 |
| State: | 4.2 |
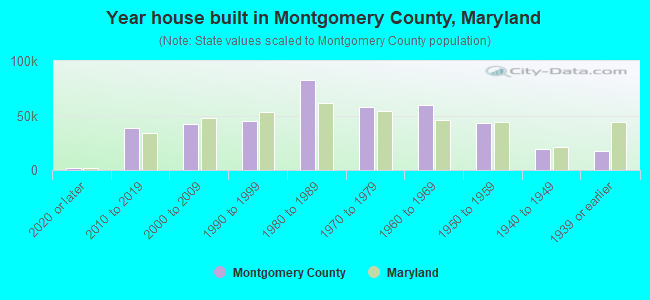
- Year house built in Montgomery County, Maryland
- 4,4572020 or later
- 37,2392010 to 2019
- 45,8402000 to 2009
- 46,5981990 to 1999
- 75,8701980 to 1989
- 63,0831970 to 1979
- 55,1431960 to 1969
- 46,4251950 to 1959
- 16,4041940 to 1949
- 15,7911939 or earlier
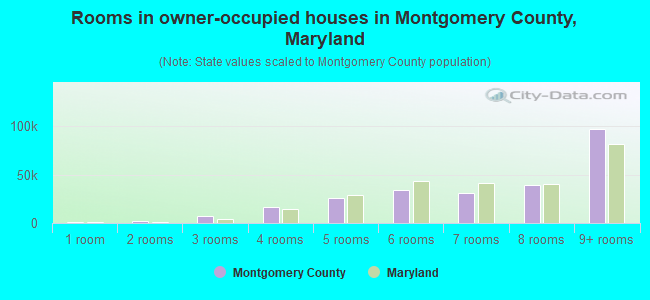
- Rooms in owner-occupied houses in Montgomery County, Maryland
- 8301 room
- 1,0472 rooms
- 7,8603 rooms
- 18,6524 rooms
- 24,6725 rooms
- 33,6536 rooms
- 33,4377 rooms
- 41,6618 rooms
- 95,7759+ rooms
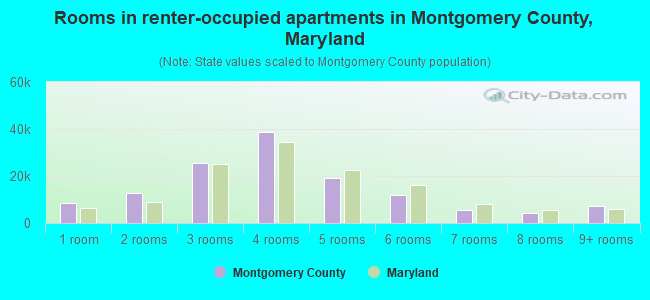
- Rooms in renter-occupied apartments in Montgomery County, Maryland
- 8,8411 room
- 11,5562 rooms
- 31,9373 rooms
- 32,6944 rooms
- 21,3175 rooms
- 10,3246 rooms
- 7,5107 rooms
- 4,7658 rooms
- 4,7669+ rooms
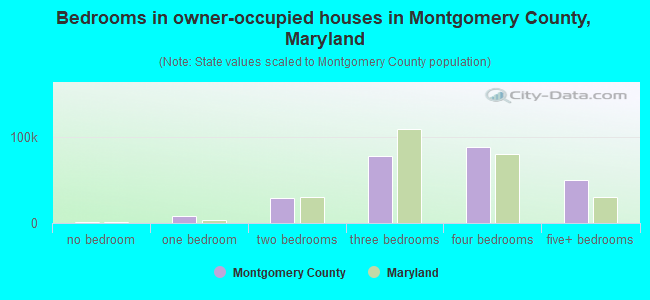
- Bedrooms in owner-occupied houses in Montgomery County, Maryland
- 933no bedroom
- 6,9861 bedroom
- 31,2712 bedrooms
- 80,4463 bedrooms
- 90,0924 bedrooms
- 47,8595+ bedrooms
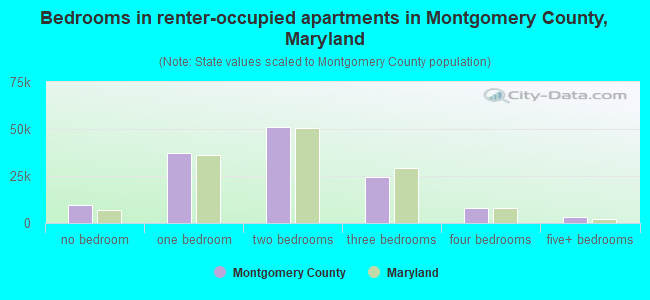
- Bedrooms in renter-occupied apartments in Montgomery County, Maryland
- 10,788no bedroom
- 43,8191 bedroom
- 46,5482 bedrooms
- 21,9353 bedrooms
- 7,3074 bedrooms
- 3,3135+ bedrooms
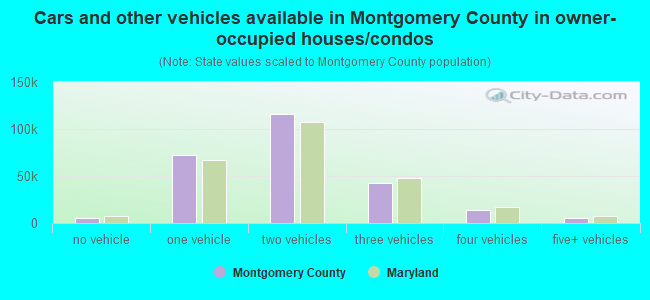
- Cars and other vehicles available in Montgomery County in owner-occupied houses/condos
- 8,429no vehicle
- 73,2141 vehicle
- 117,2702 vehicles
- 43,6113 vehicles
- 10,9064 vehicles
- 4,1575+ vehicles
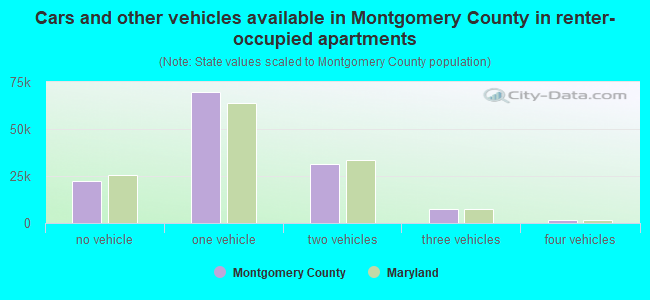
- Cars and other vehicles available in Montgomery County in renter-occupied apartments
- 27,580no vehicle
- 65,4051 vehicle
- 32,4492 vehicles
- 7,0923 vehicles
- 8654 vehicles
- 3195+ vehicles
88.2% of Montgomery County residents lived in the same house 1 years ago.
Out of people who lived in different houses, 37% lived in this county.
Out of people who lived in different counties, 35% lived in Maryland.
| Montgomery County: | 88.2% |
| State average: | 88.5% |
Place of birth for U.S.-born residents:
- This state: 277,136
- Other state: 394,349
- Northeast: 117,518
- Midwest: 51,925
- South: 190,361
- West: 34,545
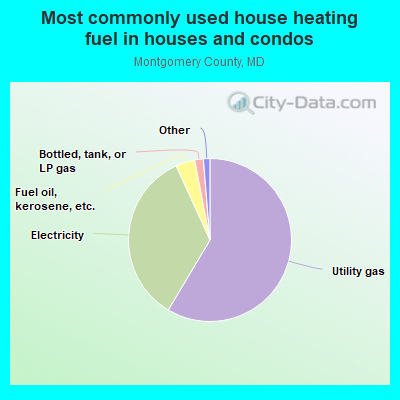
- 59.3%Utility gas
- 34.7%Electricity
- 3.1%Fuel oil, kerosene, etc.
- 1.7%Bottled, tank, or LP gas
- 0.4%No fuel used
- 0.3%Solar energy
- 0.3%Other fuel
- 0.2%Wood
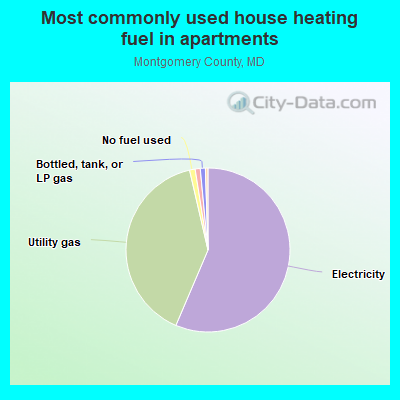
- 53.6%Electricity
- 42.2%Utility gas
- 1.4%Bottled, tank, or LP gas
- 1.2%No fuel used
- 0.9%Fuel oil, kerosene, etc.
- 0.6%Other fuel
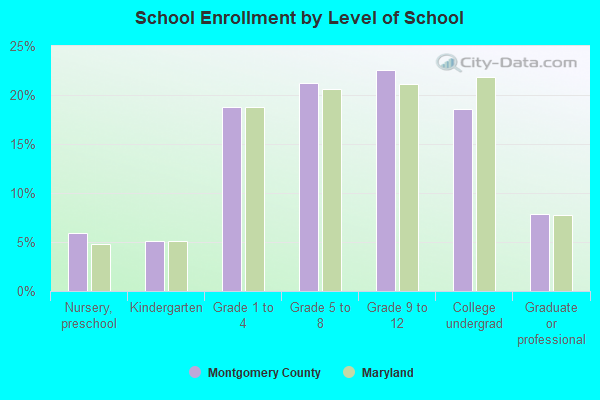
Private vs. public school enrollment:
| Here: | 13.4% |
| Maryland: | 15.2% |
| Here: | 14.8% |
| Maryland: | 14.4% |
| Here: | 25.9% |
| Maryland: | 20.2% |
Montgomery County government finances - Expenditure in 2018:
- Bond Funds - Cash and Securities: $331,671,000
Cash and Securities: $199,363,000
- Charges - Sewerage: $393,662,000
Sewerage: $364,146,000
Other: $321,085,000
Other: $256,030,000
Housing and Community Development: $159,757,000
Housing and Community Development: $120,247,000
Solid Waste Management: $108,760,000
Solid Waste Management: $107,963,000
Higher Education - Other: $65,662,000
Higher Education - Other: $60,786,000
Parks and Recreation: $52,846,000
Parks and Recreation: $49,640,000
Miscellaneous Commercial Activities: $37,745,000
Parking Facilities: $28,534,000
Miscellaneous Commercial Activities: $25,411,000
Parking Facilities: $22,772,000
Elementary and Secondary Education School Lunch: $17,477,000
Elementary and Secondary Education School Lunch: $12,830,000
Higher Education Auxiliary Enterprises: $5,268,000
Higher Education Auxiliary Enterprises: $5,213,000
Elementary and Secondary Education School Tuition and Transportation: $3,950,000
Elementary and Secondary Education School Tuition and Transportation: $2,929,000
Elementary and Secondary Education - Other: $2,548,000
- Construction - Sewerage: $420,015,000
Elementary and Secondary Education: $371,725,000
Water Utilities: $335,678,000
Elementary and Secondary Education: $285,781,000
Water Utilities: $194,281,000
Sewerage: $194,281,000
Parks and Recreation: $58,672,000
Other Higher Education: $34,325,000
Other Higher Education: $31,950,000
Parks and Recreation: $18,405,000
- Current Operations - Elementary and Secondary Education: $2,599,543,000
Elementary and Secondary Education: $2,435,394,000
General - Other: $993,455,000
General - Other: $772,888,000
Parks and Recreation: $420,497,000
Parks and Recreation: $404,902,000
Housing and Community Development: $329,014,000
Housing and Community Development: $294,756,000
Other Higher Education: $291,322,000
Police Protection: $283,575,000
Local Fire Protection: $281,594,000
Other Higher Education: $274,820,000
Police Protection: $270,113,000
Sewerage: $269,667,000
Liquor Stores: $265,023,000
Liquor Stores: $263,851,000
Local Fire Protection: $239,387,000
Sewerage: $235,557,000
Water Utilities: $233,797,000
Water Utilities: $214,670,000
Regular Highways: $212,879,000
Transit Utilities: $196,414,000
Transit Utilities: $193,564,000
Regular Highways: $181,791,000
Health - Other: $158,635,000
Solid Waste Management: $144,578,000
Health - Other: $118,065,000
General Public Buildings: $110,937,000
General Public Buildings: $100,167,000
Solid Waste Management: $94,315,000
Correctional Institutions: $74,541,000
Correctional Institutions: $68,120,000
Judicial and Legal Services: $65,880,000
Central Staff Services: $62,653,000
Judicial and Legal Services: $61,251,000
Central Staff Services: $59,129,000
Natural Resources - Other: $51,898,000
Public Welfare - Other: $48,734,000
Public Welfare - Other: $46,762,000
Natural Resources - Other: $41,411,000
Libraries: $41,282,000
Libraries: $40,867,000
Public Welfare Institutions: $38,693,000
Public Welfare Institutions: $36,618,000
Financial Administration: $33,856,000
Parking Facilities: $29,657,000
Financial Administration: $25,698,000
Parking Facilities: $21,353,000
Miscellaneous Commercial Activities - Other: $15,679,000
Protective Inspection and Regulation - Other: $14,561,000
Protective Inspection and Regulation - Other: $13,466,000
Miscellaneous Commercial Activities - Other: $11,727,000
Higher Education Auxiliary Enterprises: $3,249,000
Higher Education Auxiliary Enterprises: $3,155,000
- Federal Intergovernmental - Housing and Community Development: $160,731,000
Housing and Community Development: $142,103,000
Health and Hospitals: $69,444,000
Health and Hospitals: $61,727,000
Other: $52,472,000
Highways: $43,484,000
Other: $30,765,000
Highways: $30,728,000
Education: $25,189,000
Education: $23,205,000
Transit Utilities: $5,427,000
Transit Utilities: $3,620,000
Sewerage: $82,000
Water Utilities: $39,000
- General - Interest on Debt: $281,649,000
Interest on Debt: $226,111,000
- Intergovernmental to Local - Other - Elementary and Secondary Education: $47,581,000
Other - Elementary and Secondary Education: $44,676,000
Other - General - Other: $20,711,000
Other - General - Other: $13,393,000
- Local Intergovernmental - Education: $193,079,000
Education: $189,594,000
Other: $28,254,000
Other: $21,811,000
Water Utilities: $5,079,000
Sewerage: $3,762,000
- Long Term Debt - Outstanding Unspecified Public Purpose: $11,262,276,000
Beginning Outstanding - Unspecified Public Purpose: $10,810,516,000
Outstanding Unspecified Public Purpose: $7,583,420,000
Beginning Outstanding - Unspecified Public Purpose: $6,959,255,000
Issue, Unspecified Public Purpose: $2,085,735,000
Issue, Unspecified Public Purpose: $2,033,941,000
Retired Unspecified Public Purpose: $1,582,181,000
Beginning Outstanding - Public Debt for Private Purpose: $1,513,510,000
Outstanding Nonguaranteed - Industrial Revenue: $1,464,029,000
Retired Unspecified Public Purpose: $1,461,569,000
Outstanding Nonguaranteed - Industrial Revenue: $656,143,000
Beginning Outstanding - Public Debt for Private Purpose: $642,148,000
Retired Nonguaranteed - Public Debt for Private Purpose: $167,746,000
Issue, Nonguaranteed - Public Debt for Private Purpose: $118,266,000
Issue, Nonguaranteed - Public Debt for Private Purpose: $50,494,000
Retired Nonguaranteed - Public Debt for Private Purpose: $36,499,000
- Miscellaneous - General Revenue - Other: $125,667,000
General Revenue - Other: $103,733,000
Special Assessments: $68,484,000
Special Assessments: $63,524,000
Fines and Forfeits: $37,414,000
Fines and Forfeits: $36,534,000
Interest Earnings: $32,293,000
Interest Earnings: $30,349,000
Rents: $6,605,000
Rents: $6,029,000
Donations From Private Sources: $1,625,000
Donations From Private Sources: $1,578,000
Sale of Property: $82,000
- Other Capital Outlay - Elementary and Secondary Education: $28,432,000
Elementary and Secondary Education: $24,579,000
Other Higher Education: $8,038,000
Other Higher Education: $4,170,000
Parks and Recreation: $934,000
Police Protection: $148,000
Financial Administration: $41,000
Central Staff Services: $32,000
Central Staff Services: $20,000
Financial Administration: $5,000
- Other Funds - Cash and Securities: $2,416,948,000
Cash and Securities: $1,696,275,000
- Revenue - Water Utilities: $317,450,000
Water Utilities: $311,662,000
Liquor Stores: $304,492,000
Liquor Stores: $296,899,000
Transit Utilities: $27,332,000
Transit Utilities: $21,043,000
- Short Term Debt Outstanding - Beginning: $702,600,000
End of Fiscal Year: $690,200,000
End of Fiscal Year: $688,360,000
Beginning: $688,202,000
- Sinking Funds - Cash and Securities: $1,477,246,000
Cash and Securities: $844,580,000
- State Intergovernmental - Education: $1,001,161,000
Education: $914,021,000
Other: $77,744,000
Other: $62,612,000
Transit Utilities: $42,554,000
Transit Utilities: $42,140,000
Health and Hospitals: $32,749,000
Health and Hospitals: $31,154,000
Highways: $7,290,000
Highways: $4,544,000
Sewerage: $1,589,000
Housing and Community Development: $171,000
Housing and Community Development: $70,000
Sewerage: $65,000
Water Utilities: $11,000
- Tax - Property: $2,389,811,000
Property: $2,325,543,000
Individual Income: $1,700,584,000
Individual Income: $1,469,251,000
Public Utilities Sales: $246,359,000
Public Utilities Sales: $238,651,000
Other Selective Sales: $218,234,000
Other Selective Sales: $205,514,000
Documentary and Stock Transfer: $173,412,000
Documentary and Stock Transfer: $158,588,000
Other License: $10,845,000
Other License: $7,277,000
Occupation and Business License - Other: $4,793,000
Occupation and Business License - Other: $3,604,000
Amusements Sales: $3,329,000
Amusements Sales: $2,497,000
- Total Salaries and Wages: $2,653,052,000
: $2,459,690,000
- Water Utilities - Interest on Debt: $44,963,000
Interest on Debt: $19,782,000
Montgomery County government finances - Revenue in 2018:
- Bond Funds - Cash and Securities: $331,671,000
Cash and Securities: $199,363,000
- Charges - Sewerage: $393,662,000
Sewerage: $364,146,000
Other: $321,085,000
Other: $256,030,000
Housing and Community Development: $159,757,000
Housing and Community Development: $120,247,000
Solid Waste Management: $108,760,000
Solid Waste Management: $107,963,000
Higher Education - Other: $65,662,000
Higher Education - Other: $60,786,000
Parks and Recreation: $52,846,000
Parks and Recreation: $49,640,000
Miscellaneous Commercial Activities: $37,745,000
Parking Facilities: $28,534,000
Miscellaneous Commercial Activities: $25,411,000
Parking Facilities: $22,772,000
Elementary and Secondary Education School Lunch: $17,477,000
Elementary and Secondary Education School Lunch: $12,830,000
Higher Education Auxiliary Enterprises: $5,268,000
Higher Education Auxiliary Enterprises: $5,213,000
Elementary and Secondary Education School Tuition and Transportation: $3,950,000
Elementary and Secondary Education School Tuition and Transportation: $2,929,000
Elementary and Secondary Education - Other: $2,548,000
- Construction - Sewerage: $420,015,000
Elementary and Secondary Education: $371,725,000
Water Utilities: $335,678,000
Elementary and Secondary Education: $285,781,000
Water Utilities: $194,281,000
Sewerage: $194,281,000
Parks and Recreation: $58,672,000
Other Higher Education: $34,325,000
Other Higher Education: $31,950,000
Parks and Recreation: $18,405,000
- Current Operations - Elementary and Secondary Education: $2,599,543,000
Elementary and Secondary Education: $2,435,394,000
General - Other: $993,455,000
General - Other: $772,888,000
Parks and Recreation: $420,497,000
Parks and Recreation: $404,902,000
Housing and Community Development: $329,014,000
Housing and Community Development: $294,756,000
Other Higher Education: $291,322,000
Police Protection: $283,575,000
Local Fire Protection: $281,594,000
Other Higher Education: $274,820,000
Police Protection: $270,113,000
Sewerage: $269,667,000
Liquor Stores: $265,023,000
Liquor Stores: $263,851,000
Local Fire Protection: $239,387,000
Sewerage: $235,557,000
Water Utilities: $233,797,000
Water Utilities: $214,670,000
Regular Highways: $212,879,000
Transit Utilities: $196,414,000
Transit Utilities: $193,564,000
Regular Highways: $181,791,000
Health - Other: $158,635,000
Solid Waste Management: $144,578,000
Health - Other: $118,065,000
General Public Buildings: $110,937,000
General Public Buildings: $100,167,000
Solid Waste Management: $94,315,000
Correctional Institutions: $74,541,000
Correctional Institutions: $68,120,000
Judicial and Legal Services: $65,880,000
Central Staff Services: $62,653,000
Judicial and Legal Services: $61,251,000
Central Staff Services: $59,129,000
Natural Resources - Other: $51,898,000
Public Welfare - Other: $48,734,000
Public Welfare - Other: $46,762,000
Natural Resources - Other: $41,411,000
Libraries: $41,282,000
Libraries: $40,867,000
Public Welfare Institutions: $38,693,000
Public Welfare Institutions: $36,618,000
Financial Administration: $33,856,000
Parking Facilities: $29,657,000
Financial Administration: $25,698,000
Parking Facilities: $21,353,000
Miscellaneous Commercial Activities - Other: $15,679,000
Protective Inspection and Regulation - Other: $14,561,000
Protective Inspection and Regulation - Other: $13,466,000
Miscellaneous Commercial Activities - Other: $11,727,000
Higher Education Auxiliary Enterprises: $3,249,000
Higher Education Auxiliary Enterprises: $3,155,000
- Federal Intergovernmental - Housing and Community Development: $160,731,000
Housing and Community Development: $142,103,000
Health and Hospitals: $69,444,000
Health and Hospitals: $61,727,000
Other: $52,472,000
Highways: $43,484,000
Other: $30,765,000
Highways: $30,728,000
Education: $25,189,000
Education: $23,205,000
Transit Utilities: $5,427,000
Transit Utilities: $3,620,000
Sewerage: $82,000
Water Utilities: $39,000
- General - Interest on Debt: $281,649,000
Interest on Debt: $226,111,000
- Intergovernmental to Local - Other - Elementary and Secondary Education: $47,581,000
Other - Elementary and Secondary Education: $44,676,000
Other - General - Other: $20,711,000
Other - General - Other: $13,393,000
- Local Intergovernmental - Education: $193,079,000
Education: $189,594,000
Other: $28,254,000
Other: $21,811,000
Water Utilities: $5,079,000
Sewerage: $3,762,000
- Long Term Debt - Outstanding Unspecified Public Purpose: $11,262,276,000
Beginning Outstanding - Unspecified Public Purpose: $10,810,516,000
Outstanding Unspecified Public Purpose: $7,583,420,000
Beginning Outstanding - Unspecified Public Purpose: $6,959,255,000
Issue, Unspecified Public Purpose: $2,085,735,000
Issue, Unspecified Public Purpose: $2,033,941,000
Retired Unspecified Public Purpose: $1,582,181,000
Beginning Outstanding - Public Debt for Private Purpose: $1,513,510,000
Outstanding Nonguaranteed - Industrial Revenue: $1,464,029,000
Retired Unspecified Public Purpose: $1,461,569,000
Outstanding Nonguaranteed - Industrial Revenue: $656,143,000
Beginning Outstanding - Public Debt for Private Purpose: $642,148,000
Retired Nonguaranteed - Public Debt for Private Purpose: $167,746,000
Issue, Nonguaranteed - Public Debt for Private Purpose: $118,266,000
Issue, Nonguaranteed - Public Debt for Private Purpose: $50,494,000
Retired Nonguaranteed - Public Debt for Private Purpose: $36,499,000
- Miscellaneous - General Revenue - Other: $125,667,000
General Revenue - Other: $103,733,000
Special Assessments: $68,484,000
Special Assessments: $63,524,000
Fines and Forfeits: $37,414,000
Fines and Forfeits: $36,534,000
Interest Earnings: $32,293,000
Interest Earnings: $30,349,000
Rents: $6,605,000
Rents: $6,029,000
Donations From Private Sources: $1,625,000
Donations From Private Sources: $1,578,000
Sale of Property: $82,000
- Other Capital Outlay - Elementary and Secondary Education: $28,432,000
Elementary and Secondary Education: $24,579,000
Other Higher Education: $8,038,000
Other Higher Education: $4,170,000
Parks and Recreation: $934,000
Police Protection: $148,000
Financial Administration: $41,000
Central Staff Services: $32,000
Central Staff Services: $20,000
Financial Administration: $5,000
- Other Funds - Cash and Securities: $2,416,948,000
Cash and Securities: $1,696,275,000
- Revenue - Water Utilities: $317,450,000
Water Utilities: $311,662,000
Liquor Stores: $304,492,000
Liquor Stores: $296,899,000
Transit Utilities: $27,332,000
Transit Utilities: $21,043,000
- Short Term Debt Outstanding - Beginning: $702,600,000
End of Fiscal Year: $690,200,000
End of Fiscal Year: $688,360,000
Beginning: $688,202,000
- Sinking Funds - Cash and Securities: $1,477,246,000
Cash and Securities: $844,580,000
- State Intergovernmental - Education: $1,001,161,000
Education: $914,021,000
Other: $77,744,000
Other: $62,612,000
Transit Utilities: $42,554,000
Transit Utilities: $42,140,000
Health and Hospitals: $32,749,000
Health and Hospitals: $31,154,000
Highways: $7,290,000
Highways: $4,544,000
Sewerage: $1,589,000
Housing and Community Development: $171,000
Housing and Community Development: $70,000
Sewerage: $65,000
Water Utilities: $11,000
- Tax - Property: $2,389,811,000
Property: $2,325,543,000
Individual Income: $1,700,584,000
Individual Income: $1,469,251,000
Public Utilities Sales: $246,359,000
Public Utilities Sales: $238,651,000
Other Selective Sales: $218,234,000
Other Selective Sales: $205,514,000
Documentary and Stock Transfer: $173,412,000
Documentary and Stock Transfer: $158,588,000
Other License: $10,845,000
Other License: $7,277,000
Occupation and Business License - Other: $4,793,000
Occupation and Business License - Other: $3,604,000
Amusements Sales: $3,329,000
Amusements Sales: $2,497,000
- Total Salaries and Wages: $2,653,052,000
: $2,459,690,000
- Water Utilities - Interest on Debt: $44,963,000
Interest on Debt: $19,782,000
Montgomery County government finances - Debt in 2018:
- Bond Funds - Cash and Securities: $331,671,000
Cash and Securities: $199,363,000
- Charges - Sewerage: $393,662,000
Sewerage: $364,146,000
Other: $321,085,000
Other: $256,030,000
Housing and Community Development: $159,757,000
Housing and Community Development: $120,247,000
Solid Waste Management: $108,760,000
Solid Waste Management: $107,963,000
Higher Education - Other: $65,662,000
Higher Education - Other: $60,786,000
Parks and Recreation: $52,846,000
Parks and Recreation: $49,640,000
Miscellaneous Commercial Activities: $37,745,000
Parking Facilities: $28,534,000
Miscellaneous Commercial Activities: $25,411,000
Parking Facilities: $22,772,000
Elementary and Secondary Education School Lunch: $17,477,000
Elementary and Secondary Education School Lunch: $12,830,000
Higher Education Auxiliary Enterprises: $5,268,000
Higher Education Auxiliary Enterprises: $5,213,000
Elementary and Secondary Education School Tuition and Transportation: $3,950,000
Elementary and Secondary Education School Tuition and Transportation: $2,929,000
Elementary and Secondary Education - Other: $2,548,000
- Construction - Sewerage: $420,015,000
Elementary and Secondary Education: $371,725,000
Water Utilities: $335,678,000
Elementary and Secondary Education: $285,781,000
Water Utilities: $194,281,000
Sewerage: $194,281,000
Parks and Recreation: $58,672,000
Other Higher Education: $34,325,000
Other Higher Education: $31,950,000
Parks and Recreation: $18,405,000
- Current Operations - Elementary and Secondary Education: $2,599,543,000
Elementary and Secondary Education: $2,435,394,000
General - Other: $993,455,000
General - Other: $772,888,000
Parks and Recreation: $420,497,000
Parks and Recreation: $404,902,000
Housing and Community Development: $329,014,000
Housing and Community Development: $294,756,000
Other Higher Education: $291,322,000
Police Protection: $283,575,000
Local Fire Protection: $281,594,000
Other Higher Education: $274,820,000
Police Protection: $270,113,000
Sewerage: $269,667,000
Liquor Stores: $265,023,000
Liquor Stores: $263,851,000
Local Fire Protection: $239,387,000
Sewerage: $235,557,000
Water Utilities: $233,797,000
Water Utilities: $214,670,000
Regular Highways: $212,879,000
Transit Utilities: $196,414,000
Transit Utilities: $193,564,000
Regular Highways: $181,791,000
Health - Other: $158,635,000
Solid Waste Management: $144,578,000
Health - Other: $118,065,000
General Public Buildings: $110,937,000
General Public Buildings: $100,167,000
Solid Waste Management: $94,315,000
Correctional Institutions: $74,541,000
Correctional Institutions: $68,120,000
Judicial and Legal Services: $65,880,000
Central Staff Services: $62,653,000
Judicial and Legal Services: $61,251,000
Central Staff Services: $59,129,000
Natural Resources - Other: $51,898,000
Public Welfare - Other: $48,734,000
Public Welfare - Other: $46,762,000
Natural Resources - Other: $41,411,000
Libraries: $41,282,000
Libraries: $40,867,000
Public Welfare Institutions: $38,693,000
Public Welfare Institutions: $36,618,000
Financial Administration: $33,856,000
Parking Facilities: $29,657,000
Financial Administration: $25,698,000
Parking Facilities: $21,353,000
Miscellaneous Commercial Activities - Other: $15,679,000
Protective Inspection and Regulation - Other: $14,561,000
Protective Inspection and Regulation - Other: $13,466,000
Miscellaneous Commercial Activities - Other: $11,727,000
Higher Education Auxiliary Enterprises: $3,249,000
Higher Education Auxiliary Enterprises: $3,155,000
- Federal Intergovernmental - Housing and Community Development: $160,731,000
Housing and Community Development: $142,103,000
Health and Hospitals: $69,444,000
Health and Hospitals: $61,727,000
Other: $52,472,000
Highways: $43,484,000
Other: $30,765,000
Highways: $30,728,000
Education: $25,189,000
Education: $23,205,000
Transit Utilities: $5,427,000
Transit Utilities: $3,620,000
Sewerage: $82,000
Water Utilities: $39,000
- General - Interest on Debt: $281,649,000
Interest on Debt: $226,111,000
- Intergovernmental to Local - Other - Elementary and Secondary Education: $47,581,000
Other - Elementary and Secondary Education: $44,676,000
Other - General - Other: $20,711,000
Other - General - Other: $13,393,000
- Local Intergovernmental - Education: $193,079,000
Education: $189,594,000
Other: $28,254,000
Other: $21,811,000
Water Utilities: $5,079,000
Sewerage: $3,762,000
- Long Term Debt - Outstanding Unspecified Public Purpose: $11,262,276,000
Beginning Outstanding - Unspecified Public Purpose: $10,810,516,000
Outstanding Unspecified Public Purpose: $7,583,420,000
Beginning Outstanding - Unspecified Public Purpose: $6,959,255,000
Issue, Unspecified Public Purpose: $2,085,735,000
Issue, Unspecified Public Purpose: $2,033,941,000
Retired Unspecified Public Purpose: $1,582,181,000
Beginning Outstanding - Public Debt for Private Purpose: $1,513,510,000
Outstanding Nonguaranteed - Industrial Revenue: $1,464,029,000
Retired Unspecified Public Purpose: $1,461,569,000
Outstanding Nonguaranteed - Industrial Revenue: $656,143,000
Beginning Outstanding - Public Debt for Private Purpose: $642,148,000
Retired Nonguaranteed - Public Debt for Private Purpose: $167,746,000
Issue, Nonguaranteed - Public Debt for Private Purpose: $118,266,000
Issue, Nonguaranteed - Public Debt for Private Purpose: $50,494,000
Retired Nonguaranteed - Public Debt for Private Purpose: $36,499,000
- Miscellaneous - General Revenue - Other: $125,667,000
General Revenue - Other: $103,733,000
Special Assessments: $68,484,000
Special Assessments: $63,524,000
Fines and Forfeits: $37,414,000
Fines and Forfeits: $36,534,000
Interest Earnings: $32,293,000
Interest Earnings: $30,349,000
Rents: $6,605,000
Rents: $6,029,000
Donations From Private Sources: $1,625,000
Donations From Private Sources: $1,578,000
Sale of Property: $82,000
- Other Capital Outlay - Elementary and Secondary Education: $28,432,000
Elementary and Secondary Education: $24,579,000
Other Higher Education: $8,038,000
Other Higher Education: $4,170,000
Parks and Recreation: $934,000
Police Protection: $148,000
Financial Administration: $41,000
Central Staff Services: $32,000
Central Staff Services: $20,000
Financial Administration: $5,000
- Other Funds - Cash and Securities: $2,416,948,000
Cash and Securities: $1,696,275,000
- Revenue - Water Utilities: $317,450,000
Water Utilities: $311,662,000
Liquor Stores: $304,492,000
Liquor Stores: $296,899,000
Transit Utilities: $27,332,000
Transit Utilities: $21,043,000
- Short Term Debt Outstanding - Beginning: $702,600,000
End of Fiscal Year: $690,200,000
End of Fiscal Year: $688,360,000
Beginning: $688,202,000
- Sinking Funds - Cash and Securities: $1,477,246,000
Cash and Securities: $844,580,000
- State Intergovernmental - Education: $1,001,161,000
Education: $914,021,000
Other: $77,744,000
Other: $62,612,000
Transit Utilities: $42,554,000
Transit Utilities: $42,140,000
Health and Hospitals: $32,749,000
Health and Hospitals: $31,154,000
Highways: $7,290,000
Highways: $4,544,000
Sewerage: $1,589,000
Housing and Community Development: $171,000
Housing and Community Development: $70,000
Sewerage: $65,000
Water Utilities: $11,000
- Tax - Property: $2,389,811,000
Property: $2,325,543,000
Individual Income: $1,700,584,000
Individual Income: $1,469,251,000
Public Utilities Sales: $246,359,000
Public Utilities Sales: $238,651,000
Other Selective Sales: $218,234,000
Other Selective Sales: $205,514,000
Documentary and Stock Transfer: $173,412,000
Documentary and Stock Transfer: $158,588,000
Other License: $10,845,000
Other License: $7,277,000
Occupation and Business License - Other: $4,793,000
Occupation and Business License - Other: $3,604,000
Amusements Sales: $3,329,000
Amusements Sales: $2,497,000
- Total Salaries and Wages: $2,653,052,000
: $2,459,690,000
- Water Utilities - Interest on Debt: $44,963,000
Interest on Debt: $19,782,000
Montgomery County government finances - Cash and Securities in 2018:
- Bond Funds - Cash and Securities: $331,671,000
Cash and Securities: $199,363,000
- Charges - Sewerage: $393,662,000
Sewerage: $364,146,000
Other: $321,085,000
Other: $256,030,000
Housing and Community Development: $159,757,000
Housing and Community Development: $120,247,000
Solid Waste Management: $108,760,000
Solid Waste Management: $107,963,000
Higher Education - Other: $65,662,000
Higher Education - Other: $60,786,000
Parks and Recreation: $52,846,000
Parks and Recreation: $49,640,000
Miscellaneous Commercial Activities: $37,745,000
Parking Facilities: $28,534,000
Miscellaneous Commercial Activities: $25,411,000
Parking Facilities: $22,772,000
Elementary and Secondary Education School Lunch: $17,477,000
Elementary and Secondary Education School Lunch: $12,830,000
Higher Education Auxiliary Enterprises: $5,268,000
Higher Education Auxiliary Enterprises: $5,213,000
Elementary and Secondary Education School Tuition and Transportation: $3,950,000
Elementary and Secondary Education School Tuition and Transportation: $2,929,000
Elementary and Secondary Education - Other: $2,548,000
- Construction - Sewerage: $420,015,000
Elementary and Secondary Education: $371,725,000
Water Utilities: $335,678,000
Elementary and Secondary Education: $285,781,000
Water Utilities: $194,281,000
Sewerage: $194,281,000
Parks and Recreation: $58,672,000
Other Higher Education: $34,325,000
Other Higher Education: $31,950,000
Parks and Recreation: $18,405,000
- Current Operations - Elementary and Secondary Education: $2,599,543,000
Elementary and Secondary Education: $2,435,394,000
General - Other: $993,455,000
General - Other: $772,888,000
Parks and Recreation: $420,497,000
Parks and Recreation: $404,902,000
Housing and Community Development: $329,014,000
Housing and Community Development: $294,756,000
Other Higher Education: $291,322,000
Police Protection: $283,575,000
Local Fire Protection: $281,594,000
Other Higher Education: $274,820,000
Police Protection: $270,113,000
Sewerage: $269,667,000
Liquor Stores: $265,023,000
Liquor Stores: $263,851,000
Local Fire Protection: $239,387,000
Sewerage: $235,557,000
Water Utilities: $233,797,000
Water Utilities: $214,670,000
Regular Highways: $212,879,000
Transit Utilities: $196,414,000
Transit Utilities: $193,564,000
Regular Highways: $181,791,000
Health - Other: $158,635,000
Solid Waste Management: $144,578,000
Health - Other: $118,065,000
General Public Buildings: $110,937,000
General Public Buildings: $100,167,000
Solid Waste Management: $94,315,000
Correctional Institutions: $74,541,000
Correctional Institutions: $68,120,000
Judicial and Legal Services: $65,880,000
Central Staff Services: $62,653,000
Judicial and Legal Services: $61,251,000
Central Staff Services: $59,129,000
Natural Resources - Other: $51,898,000
Public Welfare - Other: $48,734,000
Public Welfare - Other: $46,762,000
Natural Resources - Other: $41,411,000
Libraries: $41,282,000
Libraries: $40,867,000
Public Welfare Institutions: $38,693,000
Public Welfare Institutions: $36,618,000
Financial Administration: $33,856,000
Parking Facilities: $29,657,000
Financial Administration: $25,698,000
Parking Facilities: $21,353,000
Miscellaneous Commercial Activities - Other: $15,679,000
Protective Inspection and Regulation - Other: $14,561,000
Protective Inspection and Regulation - Other: $13,466,000
Miscellaneous Commercial Activities - Other: $11,727,000
Higher Education Auxiliary Enterprises: $3,249,000
Higher Education Auxiliary Enterprises: $3,155,000
- Federal Intergovernmental - Housing and Community Development: $160,731,000
Housing and Community Development: $142,103,000
Health and Hospitals: $69,444,000
Health and Hospitals: $61,727,000
Other: $52,472,000
Highways: $43,484,000
Other: $30,765,000
Highways: $30,728,000
Education: $25,189,000
Education: $23,205,000
Transit Utilities: $5,427,000
Transit Utilities: $3,620,000
Sewerage: $82,000
Water Utilities: $39,000
- General - Interest on Debt: $281,649,000
Interest on Debt: $226,111,000
- Intergovernmental to Local - Other - Elementary and Secondary Education: $47,581,000
Other - Elementary and Secondary Education: $44,676,000
Other - General - Other: $20,711,000
Other - General - Other: $13,393,000
- Local Intergovernmental - Education: $193,079,000
Education: $189,594,000
Other: $28,254,000
Other: $21,811,000
Water Utilities: $5,079,000
Sewerage: $3,762,000
- Long Term Debt - Outstanding Unspecified Public Purpose: $11,262,276,000
Beginning Outstanding - Unspecified Public Purpose: $10,810,516,000
Outstanding Unspecified Public Purpose: $7,583,420,000
Beginning Outstanding - Unspecified Public Purpose: $6,959,255,000
Issue, Unspecified Public Purpose: $2,085,735,000
Issue, Unspecified Public Purpose: $2,033,941,000
Retired Unspecified Public Purpose: $1,582,181,000
Beginning Outstanding - Public Debt for Private Purpose: $1,513,510,000
Outstanding Nonguaranteed - Industrial Revenue: $1,464,029,000
Retired Unspecified Public Purpose: $1,461,569,000
Outstanding Nonguaranteed - Industrial Revenue: $656,143,000
Beginning Outstanding - Public Debt for Private Purpose: $642,148,000
Retired Nonguaranteed - Public Debt for Private Purpose: $167,746,000
Issue, Nonguaranteed - Public Debt for Private Purpose: $118,266,000
Issue, Nonguaranteed - Public Debt for Private Purpose: $50,494,000
Retired Nonguaranteed - Public Debt for Private Purpose: $36,499,000
- Miscellaneous - General Revenue - Other: $125,667,000
General Revenue - Other: $103,733,000
Special Assessments: $68,484,000
Special Assessments: $63,524,000
Fines and Forfeits: $37,414,000
Fines and Forfeits: $36,534,000
Interest Earnings: $32,293,000
Interest Earnings: $30,349,000
Rents: $6,605,000
Rents: $6,029,000
Donations From Private Sources: $1,625,000
Donations From Private Sources: $1,578,000
Sale of Property: $82,000
- Other Capital Outlay - Elementary and Secondary Education: $28,432,000
Elementary and Secondary Education: $24,579,000
Other Higher Education: $8,038,000
Other Higher Education: $4,170,000
Parks and Recreation: $934,000
Police Protection: $148,000
Financial Administration: $41,000
Central Staff Services: $32,000
Central Staff Services: $20,000
Financial Administration: $5,000
- Other Funds - Cash and Securities: $2,416,948,000
Cash and Securities: $1,696,275,000
- Revenue - Water Utilities: $317,450,000
Water Utilities: $311,662,000
Liquor Stores: $304,492,000
Liquor Stores: $296,899,000
Transit Utilities: $27,332,000
Transit Utilities: $21,043,000
- Short Term Debt Outstanding - Beginning: $702,600,000
End of Fiscal Year: $690,200,000
End of Fiscal Year: $688,360,000
Beginning: $688,202,000
- Sinking Funds - Cash and Securities: $1,477,246,000
Cash and Securities: $844,580,000
- State Intergovernmental - Education: $1,001,161,000
Education: $914,021,000
Other: $77,744,000
Other: $62,612,000
Transit Utilities: $42,554,000
Transit Utilities: $42,140,000
Health and Hospitals: $32,749,000
Health and Hospitals: $31,154,000
Highways: $7,290,000
Highways: $4,544,000
Sewerage: $1,589,000
Housing and Community Development: $171,000
Housing and Community Development: $70,000
Sewerage: $65,000
Water Utilities: $11,000
- Tax - Property: $2,389,811,000
Property: $2,325,543,000
Individual Income: $1,700,584,000
Individual Income: $1,469,251,000
Public Utilities Sales: $246,359,000
Public Utilities Sales: $238,651,000
Other Selective Sales: $218,234,000
Other Selective Sales: $205,514,000
Documentary and Stock Transfer: $173,412,000
Documentary and Stock Transfer: $158,588,000
Other License: $10,845,000
Other License: $7,277,000
Occupation and Business License - Other: $4,793,000
Occupation and Business License - Other: $3,604,000
Amusements Sales: $3,329,000
Amusements Sales: $2,497,000
- Total Salaries and Wages: $2,653,052,000
: $2,459,690,000
- Water Utilities - Interest on Debt: $44,963,000
Interest on Debt: $19,782,000
Supplemental Security Income (SSI) in 2006:
- Total number of recipients: 11,696
- Number of aged recipients: 5,354
- Number of blind and disabled recipients: 6,342
- Number of recipients under 18: 1,025
- Number of recipients between 18 and 64: 4,235
- Number of recipients older than 64: 6,436
- Number of recipients also receiving OASDI: 2,815
- Amount of payments (thousands of dollars): 5,262
| Home Mortgage Disclosure Act Aggregated Statistics For Year 2009 (Based on 177 full tracts) | ||||||||||||||
| A) FHA, FSA/RHS & VA Home Purchase Loans | B) Conventional Home Purchase Loans | C) Refinancings | D) Home Improvement Loans | E) Loans on Dwellings For 5+ Families | F) Non-occupant Loans on < 5 Family Dwellings (A B C & D) | G) Loans On Manufactured Home Dwelling (A B C & D) | ||||||||
|---|---|---|---|---|---|---|---|---|---|---|---|---|---|---|
| Number | Average Value | Number | Average Value | Number | Average Value | Number | Average Value | Number | Average Value | Number | Average Value | Number | Average Value | |
| LOANS ORIGINATED | 4,202 | $310,444 | 6,139 | $378,090 | 30,059 | $342,507 | 920 | $203,835 | 24 | $17,340,042 | 1,214 | $247,269 | 8 | $234,750 |
| APPLICATIONS APPROVED, NOT ACCEPTED | 237 | $290,932 | 414 | $382,452 | 2,295 | $336,645 | 158 | $132,373 | 0 | $0 | 153 | $232,693 | 1 | $540,000 |
| APPLICATIONS DENIED | 514 | $285,813 | 647 | $373,034 | 7,449 | $358,454 | 436 | $139,734 | 3 | $85,667 | 543 | $250,192 | 3 | $256,000 |
| APPLICATIONS WITHDRAWN | 579 | $298,472 | 940 | $381,498 | 5,888 | $349,764 | 205 | $220,990 | 3 | $4,226,667 | 350 | $259,106 | 0 | $0 |
| FILES CLOSED FOR INCOMPLETENESS | 93 | $283,849 | 188 | $324,149 | 1,791 | $320,982 | 74 | $179,338 | 0 | $0 | 133 | $264,150 | 0 | $0 |
| Private Mortgage Insurance Companies Aggregated Statistics For Year 2009 (Based on 165 full tracts) | ||||||
| A) Conventional Home Purchase Loans | B) Refinancings | C) Non-occupant Loans on < 5 Family Dwellings (A & B) | ||||
|---|---|---|---|---|---|---|
| Number | Average Value | Number | Average Value | Number | Average Value | |
| LOANS ORIGINATED | 660 | $334,368 | 320 | $358,388 | 6 | $198,333 |
| APPLICATIONS APPROVED, NOT ACCEPTED | 210 | $344,600 | 178 | $370,006 | 4 | $246,000 |
| APPLICATIONS DENIED | 85 | $355,212 | 103 | $347,117 | 0 | $0 |
| APPLICATIONS WITHDRAWN | 55 | $351,745 | 47 | $334,191 | 1 | $187,000 |
| FILES CLOSED FOR INCOMPLETENESS | 25 | $303,960 | 9 | $393,889 | 0 | $0 |
| Most common first names in Montgomery County, MD among deceased individuals | ||
| Name | Count | Lived (average) |
|---|---|---|
| Mary | 3,320 | 81.3 years |
| John | 2,918 | 75.2 years |
| William | 2,607 | 75.9 years |
| Robert | 1,977 | 73.2 years |
| James | 1,962 | 72.9 years |
| Helen | 1,713 | 82.0 years |
| Margaret | 1,648 | 81.3 years |
| Charles | 1,514 | 75.7 years |
| Joseph | 1,484 | 77.1 years |
| George | 1,429 | 77.2 years |
| Most common last names in Montgomery County, MD among deceased individuals | ||
| Last name | Count | Lived (average) |
|---|---|---|
| Smith | 958 | 77.2 years |
| Johnson | 636 | 76.6 years |
| Brown | 594 | 77.5 years |
| Miller | 576 | 78.7 years |
| Williams | 489 | 75.3 years |
| Jones | 467 | 77.1 years |
| Davis | 422 | 76.9 years |
| Lee | 339 | 76.6 years |
| Thompson | 339 | 77.0 years |
| Taylor | 312 | 76.1 years |
| Businesses in Montgomery County, MD | ||||
| Name | Count | Name | Count | |
|---|---|---|---|---|
| 7-Eleven | 59 | J. Jill | 1 | |
| ALDI | 1 | J.Crew | 1 | |
| ALDO | 2 | JCPenney | 2 | |
| AMF Bowling | 1 | JoS. A. Bank | 5 | |
| AT&T | 16 | Jones New York | 15 | |
| Abercrombie & Fitch | 1 | Journeys | 3 | |
| Abercrombie Kids | 1 | Just Tires | 1 | |
| Ace Hardware | 4 | Justice | 2 | |
| Advance Auto Parts | 12 | KFC | 10 | |
| Aeropostale | 3 | Kmart | 2 | |
| American Eagle Outfitters | 3 | Kohl's | 2 | |
| Ann Taylor | 5 | Kroger | 1 | |
| Apple Store | 2 | LA Fitness | 6 | |
| Applebee's | 2 | La-Z-Boy | 1 | |
| Arby's | 3 | Lane Bryant | 3 | |
| Audi | 1 | Lane Furniture | 6 | |
| AutoZone | 2 | LensCrafters | 5 | |
| Avenue | 1 | Little Caesars Pizza | 3 | |
| BMW | 1 | Lowe's | 2 | |
| Baja Fresh Mexican Grill | 6 | Macy's | 4 | |
| Bakers | 2 | Marriott | 13 | |
| Bally Total Fitness | 3 | Marshalls | 4 | |
| Banana Republic | 3 | MasterBrand Cabinets | 64 | |
| Barnes & Noble | 3 | Mazda | 2 | |
| Baskin-Robbins | 12 | McDonald's | 42 | |
| Bath & Body Works | 6 | Men's Wearhouse | 6 | |
| Bebe | 1 | Motel 6 | 1 | |
| Bed Bath & Beyond | 3 | Motherhood Maternity | 4 | |
| Ben & Jerry's | 2 | New Balance | 14 | |
| Bentleymotors.Com | 1 | New York & Co | 3 | |
| Best Western | 1 | Nike | 66 | |
| Blockbuster | 5 | Nissan | 3 | |
| Brooks Brothers | 1 | Nordstrom | 2 | |
| Brookstone | 2 | Office Depot | 4 | |
| Budget Car Rental | 5 | Old Country Buffet | 2 | |
| Buffalo Wild Wings | 1 | Old Navy | 3 | |
| Burger King | 9 | Olive Garden | 1 | |
| Buybuy BABY | 1 | Outback | 3 | |
| CVS | 39 | Outback Steakhouse | 3 | |
| Cache | 2 | Pac Sun | 2 | |
| CarMax | 1 | Panda Express | 3 | |
| Caribou Coffee | 4 | Panera Bread | 8 | |
| Casual Male XL | 1 | Papa John's Pizza | 6 | |
| Catherines | 1 | Payless | 11 | |
| Charlotte Russe | 2 | Penske | 6 | |
| Chevrolet | 3 | PetSmart | 5 | |
| Chick-Fil-A | 5 | Pier 1 Imports | 2 | |
| Chico's | 6 | Pizza Hut | 16 | |
| Chipotle | 14 | Popeyes | 8 | |
| Chuck E. Cheese's | 3 | Pottery Barn | 1 | |
| Cinnabon | 1 | Pottery Barn Kids | 1 | |
| Circle K | 2 | Qdoba Mexican Grill | 3 | |
| Clarks | 1 | Quality | 2 | |
| Cold Stone Creamery | 5 | Quiznos | 14 | |
| Coldwater Creek | 1 | RadioShack | 21 | |
| Comfort Inn | 2 | Red Lobster | 3 | |
| Comfort Suites | 1 | Red Robin | 2 | |
| Costco | 1 | Red Roof Inn | 1 | |
| Crate & Barrel | 1 | Rite Aid | 9 | |
| Cricket Wireless | 21 | Ruby Tuesday | 4 | |
| Curves | 8 | SAS Shoes | 3 | |
| DHL | 21 | Safeway | 19 | |
| Dairy Queen | 4 | Saks Fifth Avenue | 1 | |
| Days Inn | 1 | Sam's Club | 1 | |
| Deb | 1 | Sears | 9 | |
| Decora Cabinetry | 24 | Sephora | 2 | |
| Dennys | 2 | Sheraton | 1 | |
| Domino's Pizza | 6 | Sleep Inn | 1 | |
| DressBarn | 6 | Soma Intimates | 2 | |
| Dressbarn | 6 | Spencer Gifts | 1 | |
| Dunkin Donuts | 18 | Sprint Nextel | 12 | |
| Econo Lodge | 1 | Staples | 8 | |
| Ethan Allen | 1 | Starbucks | 54 | |
| Express | 3 | Subaru | 2 | |
| Extended Stay America | 2 | Subway | 44 | |
| Extended Stay Deluxe | 1 | T-Mobile | 18 | |
| Famous Footwear | 2 | T.G.I. Driday's | 2 | |
| Fashion Bug | 1 | T.J.Maxx | 3 | |
| FedEx | 171 | Taco Bell | 10 | |
| Finish Line | 3 | Talbots | 3 | |
| Firestone Complete Auto Care | 1 | Target | 4 | |
| Foot Locker | 4 | The Cheesecake Factory | 1 | |
| Ford | 3 | The Limited | 2 | |
| Forever 21 | 3 | The Room Place | 2 | |
| GNC | 16 | Torrid | 1 | |
| GameStop | 13 | Toyota | 2 | |
| Gap | 3 | Toys"R"Us | 4 | |
| Giant | 26 | Trader Joe's | 4 | |
| Goodwill | 2 | Travelodge | 1 | |
| Gymboree | 4 | True Value | 7 | |
| H&M | 2 | U-Haul | 11 | |
| H&R Block | 22 | UPS | 163 | |
| Haagen-Dazs | 2 | Vans | 6 | |
| Havertys Furniture | 1 | Verizon Wireless | 11 | |
| Hilton | 6 | Victoria's Secret | 4 | |
| Holiday Inn | 4 | Volkswagen | 2 | |
| Hollister Co. | 3 | Vons | 18 | |
| Home Depot | 4 | Walgreens | 2 | |
| Homestead Studio Suites | 2 | Walmart | 1 | |
| Honda | 4 | Wendy's | 11 | |
| Hot Topic | 3 | Wet Seal | 1 | |
| Hyatt | 2 | Whole Foods Market | 5 | |
| Hyundai | 2 | YMCA | 3 | |
| IHOP | 6 | |||
Montgomery County on our top lists:
- #4 on the list of "Top 101 counties with the largest number of people without health insurance coverage in 2000 (pop. 50,000+)"
- #6 on the list of "Top 101 counties with the best general health status score of residents (1-5), 3 years of data"
- #9 on the list of "Top 101 counties with the highest surface withdrawal of fresh water for public supply (pop. 50,000+)"
- #10 on the list of "Top 101 counties with the highest surface withdrawal of fresh water for public supply"
- #12 on the list of "Top 101 counties with the highest total withdrawal of fresh water for public supply (pop. 50,000+)"
- #13 on the list of "Top 101 counties with the highest total withdrawal of fresh water for public supply"
- #14 on the list of "Top 101 counties with the highest percentage of residents that visited a dentist within the past year"
- #15 on the list of "Top 101 counties with the largest number of children under 18 without health insurance coverage in 2000 (pop. 50,000+)"
- #16 on the list of "Top 101 counties with the lowest percentage of residents that smoked 100+ cigarettes in their lives"
- #16 on the list of "Top 101 counties with the highest percentage of residents that exercised in the past month"
- #23 on the list of "Top 101 counties with the lowest average weight of females"
- #24 on the list of "Top 101 counties with the most Orthodox adherents (pop. 50,000+)"
- #24 on the list of "Top 101 counties with the most Orthodox adherents"
- #27 on the list of "Top 101 counties with the most Mainline Protestant congregations (pop. 50,000+)"
- #27 on the list of "Top 101 counties with the most Mainline Protestant congregations"
- #29 on the list of "Top 101 counties with the lowest percentage of residents that keep firearms around their homes"
- #29 on the list of "Top 101 counties with the most Other congregations (pop. 50,000+)"
- #30 on the list of "Top 101 counties with the most Other congregations"
- #34 on the list of "Top 101 counties with the most Other adherents"
- #34 on the list of "Top 101 counties with the most Other adherents (pop. 50,000+)"