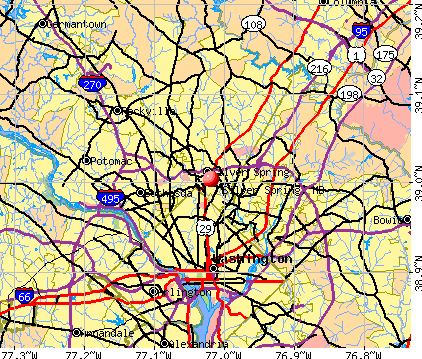
Silver Spring, Maryland
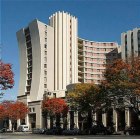
Silver Spring: Crowne Plaza Washington DC - Silver Spring
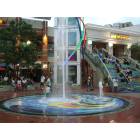
Silver Spring: Downtown Silver Spring

Silver Spring: Fall Foliage at Brookside Gardens
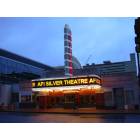
Silver Spring: The 1938 Silver Theatre, designed by John Eberson and restored in 2003.

Silver Spring: Georgia Ave
- add
your
Submit your own pictures of this place and show them to the world
- OSM Map
- General Map
- Google Map
- MSN Map
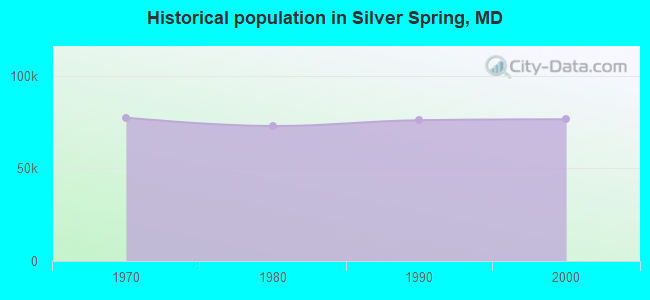
Population change since 2000: -1.6%
| Males: 35,843 | |
| Females: 39,470 |
| Median resident age: | 36.6 years |
| Maryland median age: | 39.7 years |
Zip codes: 20910.
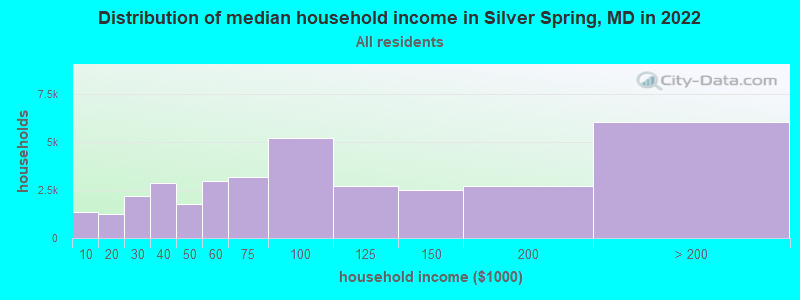
| Silver Spring: | $81,557 |
| MD: | $94,991 |
Estimated per capita income in 2022: $57,305 (it was $26,357 in 2000)
Silver Spring CDP income, earnings, and wages data
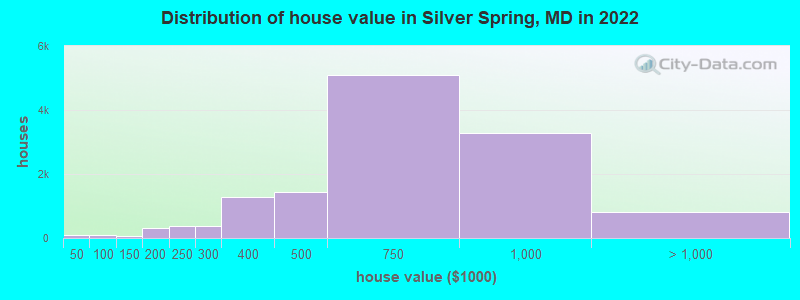
Estimated median house or condo value in 2022: $619,300 (it was $183,300 in 2000)
| Silver Spring: | $619,300 |
| MD: | $398,100 |
Mean prices in 2022: all housing units: $714,693; detached houses: $797,859; townhouses or other attached units: $645,480; in 3-to-4-unit structures: $226,142; in 5-or-more-unit structures: $417,883
Median gross rent in 2022: $1,667.
(3.9% for White Non-Hispanic residents, 12.6% for Black residents, 17.5% for Hispanic or Latino residents, 10.0% for American Indian residents, 13.6% for Native Hawaiian and other Pacific Islander residents, 19.0% for other race residents, 12.9% for two or more races residents)
Detailed information about poverty and poor residents in Silver Spring, MD


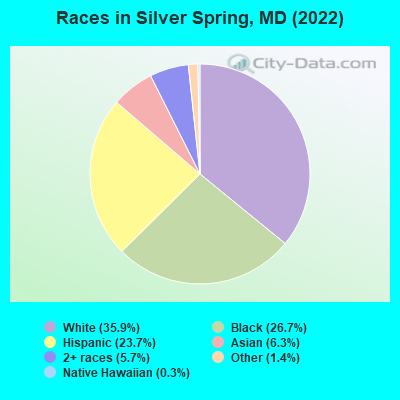
- 27,03035.9%White alone
- 20,08426.7%Black alone
- 17,87723.7%Hispanic
- 4,7426.3%Asian alone
- 4,2675.7%Two or more races
- 1,0711.4%Other race alone
- 2050.3%Native Hawaiian and Other
Pacific Islander alone - 370.05%American Indian alone
Races in Silver Spring detailed stats: ancestries, foreign born residents, place of birth
According to our research of Maryland and other state lists, there were 151 registered sex offenders living in Silver Spring, Maryland as of April 26, 2024.
The ratio of all residents to sex offenders in Silver Spring is 526 to 1.
 Recent articles from our blog. Our writers, many of them Ph.D. graduates or candidates, create easy-to-read articles on a wide variety of topics.


Latest news from Silver Spring, MD collected exclusively by city-data.com from local newspapers, TV, and radio stations
Ancestries: Ethiopian (11.3%), African (3.4%), American (2.8%), European (2.1%), English (1.9%), Irish (1.7%).
Current Local Time: EST time zone
Elevation: 340 feet
Land area: 9.42 square miles.
Population density: 7,993 people per square mile (high).
28,820 residents are foreign born (14.2% Latin America, 11.0% Africa, 6.5% Asia).
| This place: | 35.4% |
| Maryland: | 15.7% |
Median real estate property taxes paid for housing units with mortgages in 2022: $5,102 (0.8%)
Median real estate property taxes paid for housing units with no mortgage in 2022: $5,235 (0.9%)
Nearest city with pop. 200,000+: Washington, DC  (6.3 miles , pop. 572,059).
Nearest city with pop. 1,000,000+: Philadelphia, PA (121.4 miles , pop. 1,517,550).
Nearest cities:
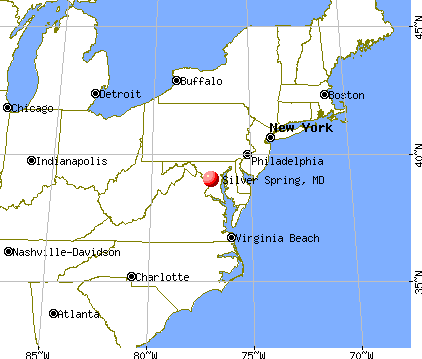
), ), ), ), ), ), )Latitude: 39.00 N, Longitude: 77.02 W
Daytime population change due to commuting: -2,619 (-3.5%)
Workers who live and work in this place: 16,820 (36.4%)
Property values in Silver Spring, MD
Silver Spring tourist attractions:
| Here: | 1.8% |
| Maryland: | 2.0% |
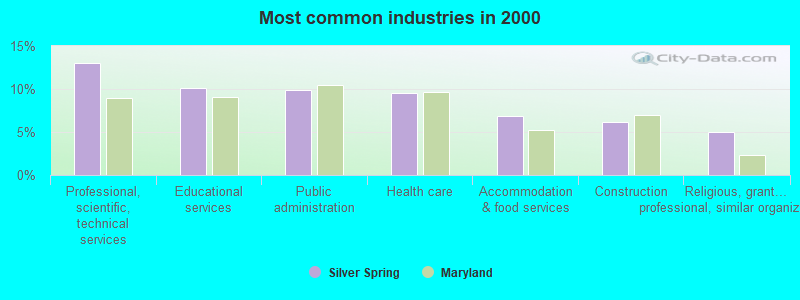
- Professional, scientific, technical services (13.0%)
- Educational services (10.2%)
- Public administration (9.9%)
- Health care (9.5%)
- Accommodation & food services (6.9%)
- Construction (6.2%)
- Religious, grantmaking, civic, professional, similar organizations (5.0%)
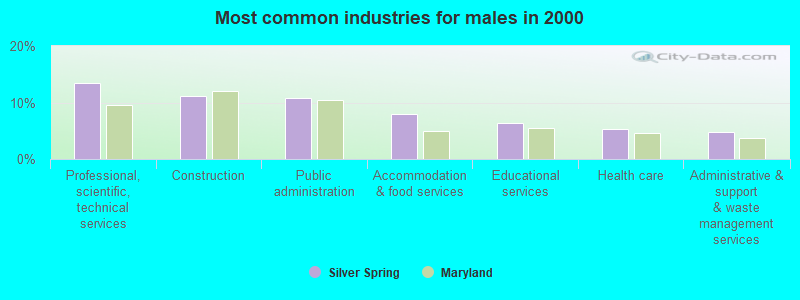
- Professional, scientific, technical services (13.4%)
- Construction (11.2%)
- Public administration (10.8%)
- Accommodation & food services (8.0%)
- Educational services (6.4%)
- Health care (5.4%)
- Administrative & support & waste management services (4.9%)
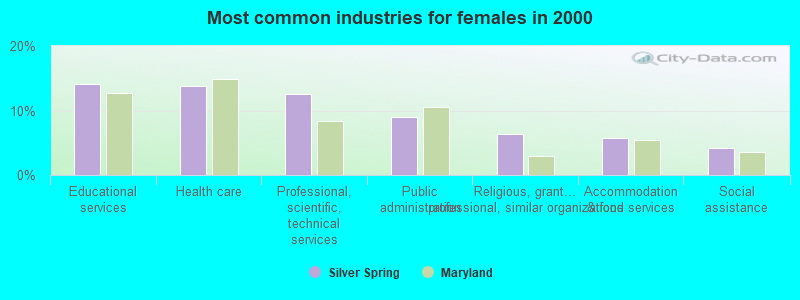
- Educational services (14.1%)
- Health care (13.8%)
- Professional, scientific, technical services (12.6%)
- Public administration (9.0%)
- Religious, grantmaking, civic, professional, similar organizations (6.3%)
- Accommodation & food services (5.8%)
- Social assistance (4.2%)
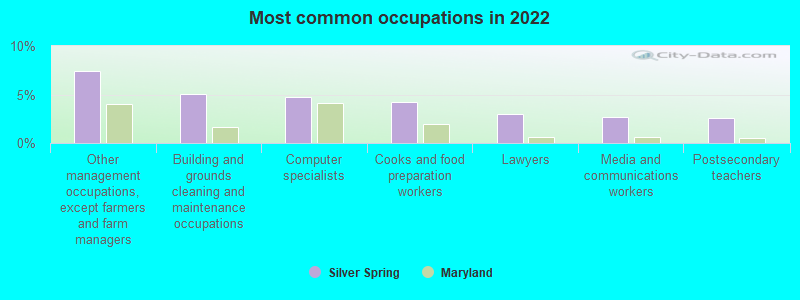
- Other management occupations, except farmers and farm managers (7.4%)
- Building and grounds cleaning and maintenance occupations (5.1%)
- Computer specialists (4.7%)
- Cooks and food preparation workers (4.2%)
- Lawyers (3.0%)
- Media and communications workers (2.7%)
- Postsecondary teachers (2.6%)
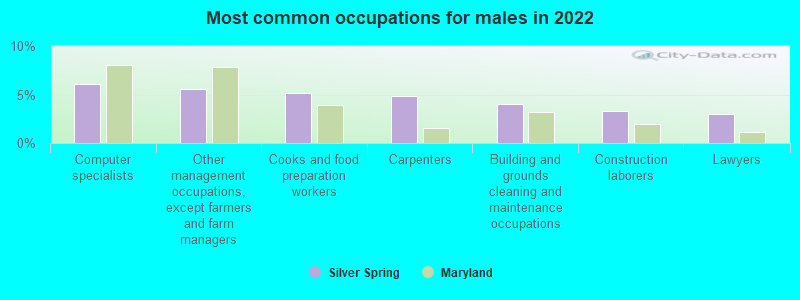
- Computer specialists (6.1%)
- Other management occupations, except farmers and farm managers (5.6%)
- Cooks and food preparation workers (5.1%)
- Carpenters (4.9%)
- Building and grounds cleaning and maintenance occupations (4.0%)
- Construction laborers (3.3%)
- Lawyers (3.0%)
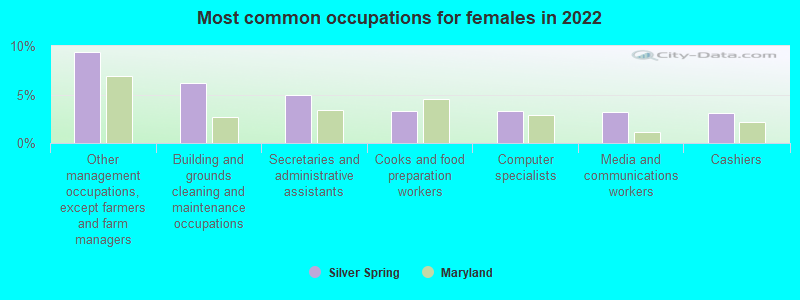
- Other management occupations, except farmers and farm managers (9.4%)
- Building and grounds cleaning and maintenance occupations (6.2%)
- Secretaries and administrative assistants (4.9%)
- Cooks and food preparation workers (3.3%)
- Computer specialists (3.3%)
- Media and communications workers (3.2%)
- Cashiers (3.1%)
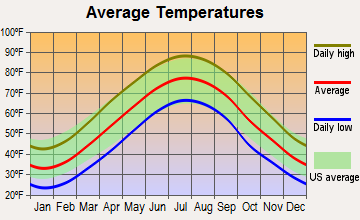
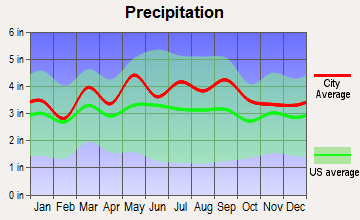
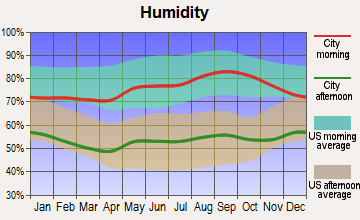
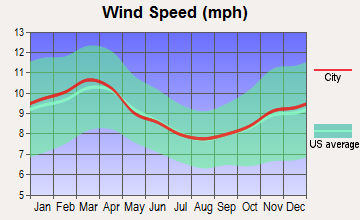
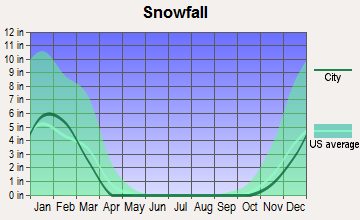
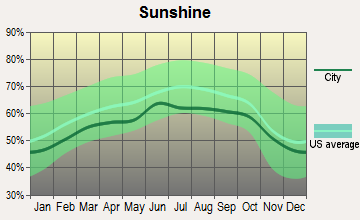
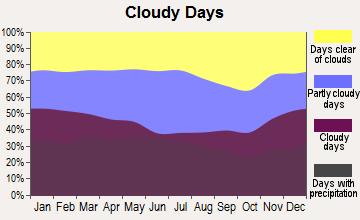
Average climate in Silver Spring, Maryland
Based on data reported by over 4,000 weather stations
|
|

(lower is better)
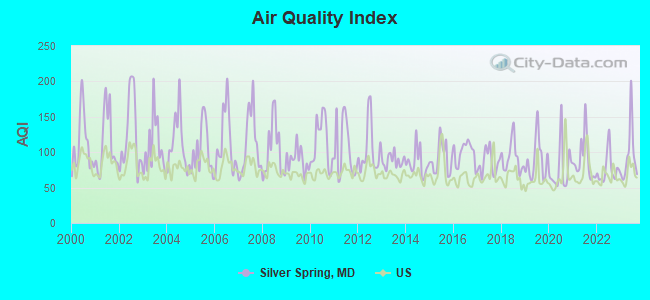
Air Quality Index (AQI) level in 2023 was 95.6. This is worse than average.
| City: | 95.6 |
| U.S.: | 72.6 |
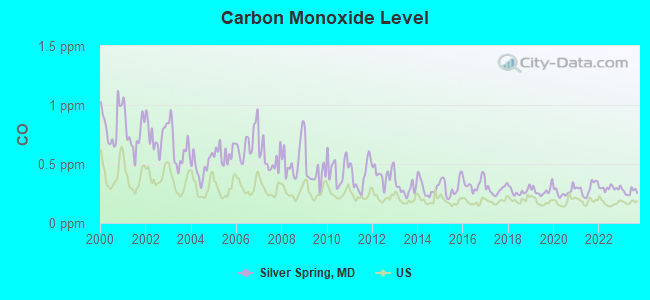
Carbon Monoxide (CO) [ppm] level in 2023 was 0.266. This is about average. Closest monitor was 1.0 miles away from the city center.
| City: | 0.266 |
| U.S.: | 0.251 |
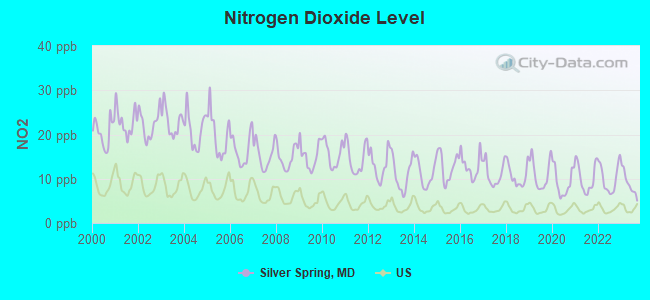
Nitrogen Dioxide (NO2) [ppb] level in 2023 was 8.87. This is significantly worse than average. Closest monitor was 1.0 miles away from the city center.
| City: | 8.87 |
| U.S.: | 5.11 |
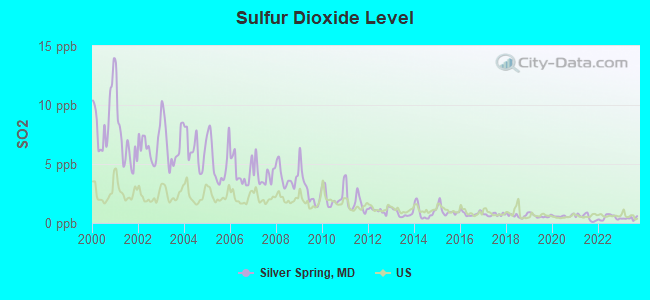
Sulfur Dioxide (SO2) [ppb] level in 2023 was 0.395. This is significantly better than average. Closest monitor was 1.0 miles away from the city center.
| City: | 0.395 |
| U.S.: | 1.515 |
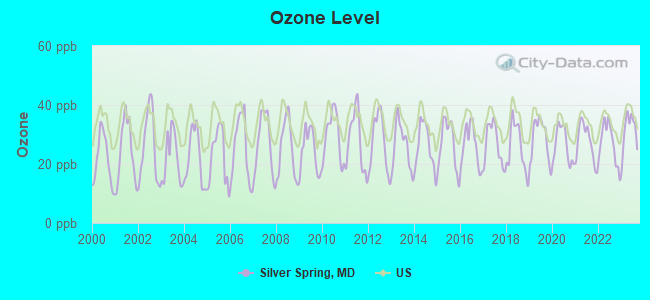
Ozone [ppb] level in 2023 was 31.3. This is about average. Closest monitor was 1.0 miles away from the city center.
| City: | 31.3 |
| U.S.: | 33.3 |
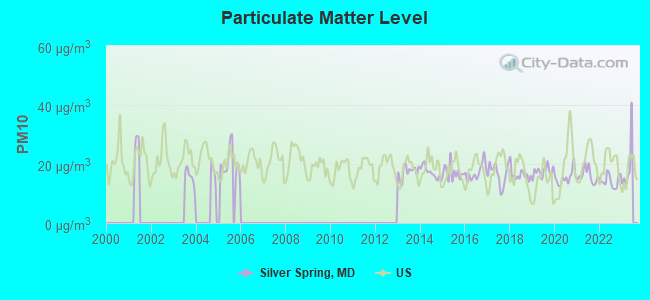
Particulate Matter (PM10) [µg/m3] level in 2022 was 14.3. This is better than average. Closest monitor was 4.1 miles away from the city center.
| City: | 14.3 |
| U.S.: | 19.2 |
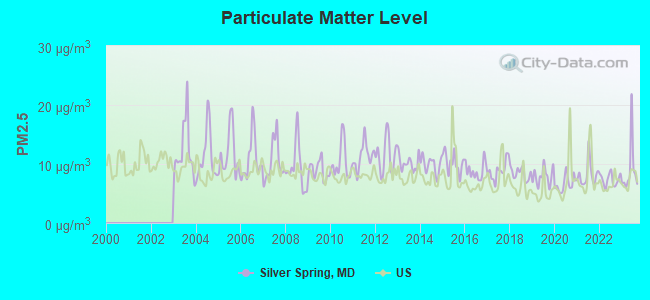
Particulate Matter (PM2.5) [µg/m3] level in 2023 was 8.96. This is about average. Closest monitor was 5.7 miles away from the city center.
| City: | 8.96 |
| U.S.: | 8.11 |
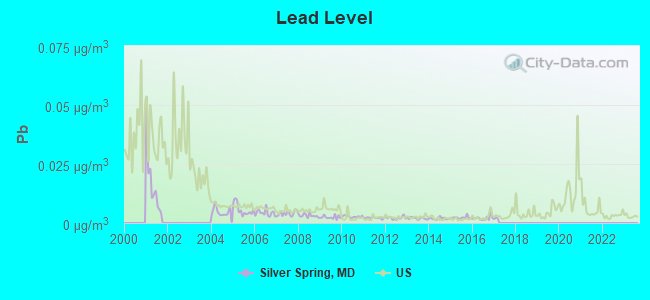
Lead (Pb) [µg/m3] level in 2016 was 0.00212. This is significantly better than average. Closest monitor was 0.8 miles away from the city center.
| City: | 0.00212 |
| U.S.: | 0.00931 |
Tornado activity:
Silver Spring-area historical tornado activity is slightly above Maryland state average. It is 12% greater than the overall U.S. average.
On 9/24/2001, a category F3 (max. wind speeds 158-206 mph) tornado 5.5 miles away from the Silver Spring place center killed 2 people and injured 55 people and caused $101 million in damages.
On 4/28/2002, a category F4 (max. wind speeds 207-260 mph) tornado 32.6 miles away from the place center killed 3 people and injured 122 people and caused $124 million in damages.
Earthquake activity:
Silver Spring-area historical earthquake activity is significantly above Maryland state average. It is 57% smaller than the overall U.S. average.On 8/23/2011 at 17:51:04, a magnitude 5.8 (5.8 MW, Depth: 3.7 mi, Class: Moderate, Intensity: VI - VII) earthquake occurred 90.6 miles away from the city center
On 1/16/1994 at 01:49:16, a magnitude 4.6 (4.6 MB, 4.6 LG, Depth: 3.1 mi, Class: Light, Intensity: IV - V) earthquake occurred 105.6 miles away from Silver Spring center
On 8/25/2011 at 05:07:52, a magnitude 4.5 (4.5 ML, Depth: 4.2 mi) earthquake occurred 89.4 miles away from Silver Spring center
On 12/9/2003 at 20:59:18, a magnitude 4.5 (4.5 ML, Depth: 6.2 mi) earthquake occurred 103.3 miles away from Silver Spring center
On 9/25/1998 at 19:52:52, a magnitude 5.2 (4.8 MB, 4.3 MS, 5.2 LG, 4.5 MW, Depth: 3.1 mi) earthquake occurred 247.7 miles away from Silver Spring center
On 12/9/2003 at 20:59:14, a magnitude 4.5 (4.5 MB, 4.5 LG) earthquake occurred 109.1 miles away from the city center
Magnitude types: regional Lg-wave magnitude (LG), body-wave magnitude (MB), local magnitude (ML), surface-wave magnitude (MS), moment magnitude (MW)
Natural disasters:
The number of natural disasters in Montgomery County (19) is greater than the US average (15).Major Disasters (Presidential) Declared: 14
Emergencies Declared: 5
Causes of natural disasters: Hurricanes: 5, Winter Storms: 5, Snowstorms: 4, Storms: 4, Floods: 3, Winds: 2, Blizzard: 1, Heavy Rain: 1, Snowfall: 1, Tornado: 1, Tropical Storm: 1, Other: 1 (Note: some incidents may be assigned to more than one category).
Main business address for: UNITED THERAPEUTICS CORP (PHARMACEUTICAL PREPARATIONS), CHOICE HOTELS INTERNATIONAL INC /DE (HOTELS & MOTELS).
Hospitals in Silver Spring:
- EASTERN NEURO REHABILITATION HOSPITAL (2105 FAIRLAND ROAD)
- HOLY CROSS HOSPITAL (Voluntary non-profit - Church, provides emergency services, 1500 FOREST GLEN ROAD)
- SILVER SPRING AMBULATORY SURGI (8505 FENTON STREET)
- SURGERY CENTER OF MARYLAND LLC (3801 INTERNATIONAL DRIVE 3RD FLOOR)
Nursing Homes in Silver Spring:
- ALTHEA WOODLAND NURSING HOME (1000 DALEVIEW DRIVE)
- APEX HEALTH OF SILVER SPRING (2700 BARKER STREET)
- ARCOLA HEALTH AND REHABILITATION CENTER (901 ARCOLA AVENUE)
- BEDFORD COURT HEALTHCARE CENT. (3701 INTERNATIONAL DRIVE)
- BEL PRE HEALTH AND REHABILITATION CENTER (2601 BEL PRE ROAD)
- FOX CHASE REHAB AND NURSING CENTER (2015 EAST-WEST HIGHWAY)
- LAYHILL CENTER (3227 BEL PRE ROAD)
- MANORCARE HEALTH SERVICES -SILVER SPRING (2501 MUSGROVE ROAD)
- RIDERWOOD VILLAGE (3160 GRACEFIELD ROAD)
- SPRINGBROOK CENTER (12325 NEW HAMPSHIRE AVENUE)
- WOODSIDE CENTER (9101 SECOND AVENUE)
Dialysis Facilities in Silver Spring:
- DAVITA - SILVER SPRING (8412 GEORGIA AVE)
- FMC - SILVER SPRING (12120 PLUM ORCHARD RD STE 140)
- HOLY CROSS HOSPITAL (RENAL DIALYSIS UNIT)
- SILVER SPRING ARTIFICIAL KIDNEY CENTER (8630 FENTON ST STE 238)
- SPRINGBROOK DIALYSIS CENTER (12325 NEW HAMPSHIRE AVENUE)
Home Health Centers in Silver Spring:
- ADVENTIST HME HLTH SERVS (12041 BOURNEFIELD WAYSUITE B)
- AMEDISYS HOME HEALTH OF BURTONSVILLE (12510 PROSPERITY DRIVE, SUITE 350)
- COMPREHENSIVE HOME HEALTH AGENCY (2141 INDUSTRIAL PARWAY, SUITE 201)
- HOLY CROSS HOME CARE (11800 TECH ROAD - SUITE #240)
- INTERIM HEALTHCARE INC (8401 COLESVILLE ROAD)
- NURSING ENTERPRISES, INC (8701 GEORGIA AVENUE SUITE 701)
Heliports located in Silver Spring:
Amtrak stations near Silver Spring:
- 8 miles: WASHINGTON (50 MASSACHUSETTS AVE. N.E.) . Services: ticket office, fully wheelchair accessible, enclosed waiting area, public restrooms, public payphones, full-service food facilities and snack bar, ATM, paid short-term parking, paid long-term parking, car rental agency, taxi stand, public transit connection.
- 9 miles: ROCKVILLE (HUNGERFORD DR. & PARK ST.) . Services: partially wheelchair accessible, public payphones, paid short-term parking, paid long-term parking, call for taxi service, public transit connection.
- 10 miles: NEW CARROLLTON (4300 GARDEN CITY DR.) . Services: ticket office, fully wheelchair accessible, enclosed waiting area, public restrooms, public payphones, snack bar, ATM, paid short-term parking, paid long-term parking, call for car rental service, taxi stand, public transit connection.
Colleges/Universities in Silver Spring:
- Everest Institute-Silver Spring (Full-time enrollment: 646; Location: 8757 Georgia Avenue; Private, for-profit; Website: www.everest.edu/campus/silver_spring)
- National Labor College (Full-time enrollment: 306; Location: 10000 New Hampshire Ave; Private, not-for-profit; Website: www.nlc.edu)
- Montgomery Beauty School (Full-time enrollment: 117; Location: 8736 Arliss St; Private, for-profit; Website: www.MontgomeryBeautySchool.com)
- Columbia Institute (Full-time enrollment: 30; Location: 12125 Veirs Mill Rd.; Private, for-profit; Website: ccdc.edu)
Colleges/universities with over 2000 students nearest to Silver Spring:
- University of Maryland-University College (about 4 miles; Adelphi, MD; Full-time enrollment: 25,040)
- University of Maryland-College Park (about 5 miles; College Park, MD; FT enrollment: 32,734)
- Catholic University of America (about 5 miles; Washington, DC; FT enrollment: 5,365)
- University of the District of Columbia (about 5 miles; Washington, DC; FT enrollment: 3,675)
- Howard University (about 6 miles; Washington, DC; FT enrollment: 7,838)
- American University (about 6 miles; Washington, DC; FT enrollment: 9,850)
- Strayer University-Global Region (about 7 miles; Washington, DC; FT enrollment: 2,613)
Public high schools in Silver Spring:
- JOHN F. KENNEDY HIGH (Location: 1901 RANDOLPH RD, Grades: 9-12)
- MONTGOMERY BLAIR HIGH (Location: 51 UNIVERSITY BLVD E, Grades: 9-12)
- SPRINGBROOK HIGH (Location: 201 VALLEYBROOK DR, Grades: 9-12)
- TAKOMA PARK MIDDLE SCHOOL (Location: 7611 PINEY BRANCH RD, Grades: 6-9)
- WHEATON HIGH (Location: 12601 DALEWOOD DR, Grades: 9-12)
- JAMES HUBERT BLAKE HIGH (Location: 300 NORWOOD RD, Grades: 9-12)
- SILVER SPRING INTERNATIONAL MIDDLE (Location: 313 WAYNE AVE, Grades: 6-9)
- MCPS TRANSITIONS SCHOOL (Location: 11721 KEMP MILL RD, Grades: 12)
- NORTHWOOD HIGH SCHOOL (Location: 919 UNIVERSITY BLVD W, Grades: 9-12)
Private high schools in Silver Spring:
- BARRIE SCHOOL (Students: 301, Location: 13500 LAYHILL RD, Grades: PK-12)
- YESHIVA OF GREATER WASHINGTON GIRLS DIVISION (Students: 182, Location: 2010 LINDEN LN, Grades: 7-12, Girls only)
- YESHIVA OF GREATER WASHINGTON BOYS DIVISION (Students: 91, Location: 1216 ARCOLA AVE, Grades: 7-12, Boys only)
- THE SIENA SCHOOL (Students: 75, Location: 9727 GEORGIA AVE, Grades: 4-12, Girls only)
- CHELSEA SCHOOL (Students: 72, Location: 711 PERSHING DR, Grades: 6-12)
- THE NORA SCHOOL (Students: 58, Location: 955 SLIGO AVE, Grades: 9-12)
- HAMPSHIRE VIEW CHRISTIAN SCHOOL (Students: 44, Location: 360 EDNOR RD, Grades: UG-12)
- PATHWAYS SCHOOL - NORTHWOOD AT HYATTSVILLE (Students: 23, Location: 1200 UNIVERSITY BLVD W, Grades: 6-12)
- COMMUNITY SCHOOL OF MD AT NORTHWOOD HIGH SCHOOL (Students: 6, Location: 919 UNIVERSITY BLVD WEST ROOM C-203, Grades: 11-12)
Biggest public elementary/middle schools in Silver Spring:
- ARGYLE MIDDLE (Location: 2400 BEL PRE RD, Grades: 6-8)
- BROAD ACRES ELEMENTARY (Location: 710 BEACON RD, Grades: PK-5)
- CANNON ROAD ELEMENTARY (Location: 901 CANNON ROAD, Grades: PK-5)
- COL. E. BROOKE LEE MIDDLE (Location: 11800 MONTICELLO AVE, Grades: 6-8)
- CRESTHAVEN ELEMENTARY (Location: 1234 CRESTHAVEN DR, Grades: PK-5)
- EAST SILVER SPRING ELEMENTARY (Location: 631 SILVER SPRING AVE, Grades: PK-5)
- FAIRLAND ELEMENTARY (Location: 14315 FAIRDALE RD, Grades: PK-5)
- FOREST KNOLLS ELEMENTARY (Location: 10830 EASTWOOD AVE, Grades: PK-5)
- GALWAY ELEMENTARY (Location: 12612 GALWAY DR, Grades: PK-6)
- GEORGIAN FOREST ELEMENTARY (Location: 3100 REGINA DR, Grades: PK-5)
Biggest private elementary/middle schools in Silver Spring:
- FORCEY CHRISTIAN SCHOOL PK-8 (Students: 550, Location: 2130 E RANDOLPH RD, Grades: PK-8)
- ST FRANCIS INTERNATIONAL SCHOOL (Students: 438, Location: 1500 SAINT CAMILLUS DR, Grades: PK-8)
- ST BERNADETTE SCHOOL (Students: 394, Location: 80 UNIVERSITY BLVD E, Grades: KG-8)
- TORAH SCHOOL OF GREATER WASHINGTON (Students: 303, Location: 2010 LINDEN LN, Grades: KG-6)
- ST ANDREW APOSTLE SCHOOL (Students: 278, Location: 11602 KEMP MILL RD, Grades: PK-8)
- ST JOHN THE BAPTIST SCHOOL (Students: 266, Location: 12319 NEW HAMPSHIRE AVE, Grades: KG-8)
- ST JOHN THE EVANGELIST SCHOOL (Students: 250, Location: 10201 WOODLAND DR, Grades: PK-8)
- ST MICHAEL THE ARCHANGEL CATHOLIC SCHOOL (Students: 156, Location: 824 WAYNE AVE, Grades: KG-8)
- JULIA BROWN MONTESSORI SCHOOL (Students: 110, Location: 1300 MILESTONE DR, Grades: PK-3)
- QUALITY TIME EARLY LEARNING CENTER (Students: 99, Location: 8101 GEORGIA AVE, Grades: PK-1)
Points of interest:
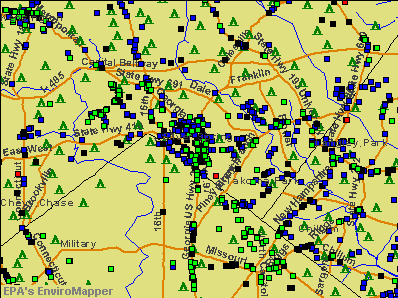
Notable locations in Silver Spring: Sligo Park Golf Course (A), Silver Spring Metro Station (B), Montgomery County Maintenance Yard (C), Walter Reed Fire Department Forest Glenn Station (D), Employment Service Center (E), Housing Opportunities Commission (F), American Red Cross (G), Montgomery County Parks Headquarters (H), Sligo Community Building (I), Silver Spring Volunteer Fire Department Station 19 (J), Silver Spring Volunteer Fire Department Station 16 (K), Walter Reed Military Police Station (L), Long Branch Library (M), Four Corners Library (N), AFI Silver Theatre and Cultural Center (O), Woodside Center Nursing Home (P), The Althea Woodland Nursing Home (Q), Silver Spring Library (R), Silver Spring Railroad Station (S), Silver Spring Volunteer Fire Department Station 1 (T). Display/hide their locations on the map
Shopping Center: Spring Center Shopping Center (1). Display/hide its location on the map
Main business address in Silver Spring: UNITED THERAPEUTICS CORP (A). Display/hide its location on the map
Churches in Silver Spring include: Christ the King Catholic Church (A), Temple Shalom Synagogue (B), Ohr Kodesh Congregational Synagogue (C), First Baptist of Silver Spring Church (D), First Church of Christ Scientist (E), Memorial United Methodist Church (F), Silver Spring Seventh Day Adventist Church (G), Woodside United Methodist Church (H), Woodside Synagogue (I). Display/hide their locations on the map
Cemetery: Grace Episcopal Cemetery (1). Display/hide its location on the map
Reservoir: Burnt Mills Reservoir (A). Display/hide its location on the map
Streams, rivers, and creeks: Coquelin Run (A). Display/hide its location on the map
Parks in Silver Spring include: Northwest Branch Park (1), Sligo Creek Park (2), Quebec Terrace Park (3), Montgomery Hills Park (4), Long Branch Park (5), Jessup Blair Park (6), Fairview Park (7), Rock Creek Stream Valley Park (8), Sligo Park (9). Display/hide their locations on the map
Tourist attractions: Maryland-National Capital Park & Planning Commissn - Montgomery County Department of P (Museums; 1313 Bonifant Road), Anderson Winston A Dr (Museums; 1629 Hopefield Road), Alpha Phi Alpha Fraternity Montgomery County (Museums; 811 East Randolph Road), National Capital Trolley Museum (1303 Bonifant Road), IUL (Museums; 811 East Randolph Road), Montgomery County Government - Libraries- Branch Libraries and Services- White (Cultural Attractions- Events- & Facilities; 11701 New Hampshire Avenue), Montgomery County - Libraries- Administrative Headquarters- Long Br (Cultural Attractions- Events- & Facilities; 8800 Garland Avenue), Research Document Retrievals (Cultural Attractions- Events- & Facilities; 3704 Greenly Street), Maryland National Capital Park & Planning Commission (Nature Centers; 1400 Glenallan Avenue).
Hotels: Sahara International (8115 Fenton St), Accomodation Specialist (502 Pickwick Village Way), Sunburst Hospitality Corporation (10770 Columbia Pike), The Westin Fairfax (3701 International Drive), Army & Air Force Exchange Service - Four Seasons Store (1 Linden Lane), Ramada Limited of Silver Spring (7990 Georgia Avenue), Theincatour (3503 Aston Manor Ct. Suite 301), Residence Inn by Marriott (12000 Plum Orchard Dr), Hampton Inn (13869 Outlet Drive).
Courts: Results Services Inc (8700 1st Avenue), Bedford Court Health Center (3700 International), United States Government - Federal Bureau Of Investigation- Maryland Resident Agen (13975 Connecticut), Justice Department - Federal Bureau Of Investigation- Maryland Resident Agen (4110 Aspen Hill Road).
Birthplace of: Robert Olds - Soilder, Nora Roberts - Romance novelist, Nick Adenhart - Professional baseball player, Dominique Dawes - African- Olympic gymnast, Lewis Black - (born 1948), comedian, Daniel Snyder - Billionaire, Donna Richardson - Exercise instructor, Philip Gyau - Soccer player-coach, Erik Imler - Soccer player-coach, Brady Anderson - (born 1964), baseball player.
Drinking water stations with addresses in Silver Spring and their reported violations in the past:
WASHINGTON SUBURBAN SANITARY COMMISSION (Address: 12245 TECH ROAD , Population served: 1,800,000, Surface water):Past monitoring violations:ANNES MHP (Serves VA, Population served: 110, Groundwater):
- One routine major monitoring violation
Past health violations:DUNKIRK TOWN SQUARE SHOPPING CENTER (Address: 2141 INDUSTRIAL PKWY STE. 200 , Population served: 40, Groundwater):Past monitoring violations:
- MCL, Monthly (TCR) - In OCT-2009, Contaminant: Coliform. Follow-up actions: St Public Notif requested (NOV-09-2009), St Formal NOV issued (NOV-09-2009), St Public Notif received (NOV-18-2009), St Compliance achieved (NOV-19-2009)
- 75 regular monitoring violations
Past health violations:Past monitoring violations:
- Public Education - In NOV-30-2009, Contaminant: Lead and Copper Rule. Follow-up actions: St Violation/Reminder Notice (FEB-03-2010)
- One routine major monitoring violation
- One regular monitoring violation
| This place: | 2.5 people |
| Maryland: | 2.6 people |
| This place: | 54.8% |
| Whole state: | 67.1% |
| This place: | 7.4% |
| Whole state: | 6.4% |
Likely homosexual households (counted as self-reported same-sex unmarried-partner households)
- Lesbian couples: 0.8% of all households
- Gay men: 0.7% of all households
People in group quarters in Silver Spring in 2010:
- 119 people in nursing facilities/skilled-nursing facilities
- 89 people in other noninstitutional facilities
- 74 people in emergency and transitional shelters (with sleeping facilities) for people experiencing homelessness
- 45 people in group homes intended for adults
- 17 people in residential treatment centers for adults
- 17 people in workers' group living quarters and job corps centers
People in group quarters in Silver Spring in 2000:
- 259 people in other noninstitutional group quarters
- 201 people in nursing homes
- 160 people in other nonhousehold living situations
- 26 people in religious group quarters
- 21 people in other group homes
- 19 people in college dormitories (includes college quarters off campus)
- 5 people in homes for the mentally ill
- 3 people in homes for the physically handicapped
- 2 people in homes for the mentally retarded
Banks with most branches in Silver Spring (2011 data):
- Bank of America, National Association: 12 branches. Info updated 2009/11/18: Bank assets: $1,451,969.3 mil, Deposits: $1,077,176.8 mil, headquarters in Charlotte, NC, positive income, 5782 total offices, Holding Company: Bank Of America Corporation
- Capital One, National Association: 12 branches. Info updated 2011/07/01: Bank assets: $133,477.8 mil, Deposits: $97,063.7 mil, headquarters in Mclean, VA, positive income, 984 total offices, Holding Company: Capital One Financial Corporation
- SunTrust Bank: 9 branches. Info updated 2010/05/27: Bank assets: $171,291.7 mil, Deposits: $129,833.2 mil, headquarters in Atlanta, GA, positive income, Commercial Lending Specialization, 1716 total offices, Holding Company: Suntrust Banks, Inc.
- PNC Bank, National Association: Riderwood Branch, Riderwood Village Ii Branch, Wheaton Plaza @ Giant Branch, Silver Spring Branch, Aspen Hill @ Giant Branch. Info updated 2012/03/20: Bank assets: $263,309.6 mil, Deposits: $197,343.0 mil, headquarters in Wilmington, DE, positive income, Commercial Lending Specialization, 3085 total offices, Holding Company: Pnc Financial Services Group, Inc., The
- Manufacturers and Traders Trust Company: Silver Spring Branch, Leisure World Branch, M&T Square Branch, Tech Center Park Branch, White Oak Branch. Info updated 2011/08/08: Bank assets: $76,887.1 mil, Deposits: $60,064.2 mil, headquarters in Buffalo, NY, positive income, Commercial Lending Specialization, 808 total offices, Holding Company: M&T Bank Corporation
- Branch Banking and Trust Company: Layhill Road Branch, Wayne Avenue Branch, Cloverly Branch, New Hampshire Branch. Info updated 2010/03/29: Bank assets: $168,867.6 mil, Deposits: $127,549.5 mil, headquarters in Winston Salem, NC, positive income, Commercial Lending Specialization, 1793 total offices, Holding Company: Bb&T Corporation
- Sandy Spring Bank: Leisureworld Plaza Branch, Layhill Branch, Silver Spring Community Branch, Bedford Court Community Branch. Info updated 2007/07/17: Bank assets: $3,709.4 mil, Deposits: $2,664.0 mil, headquarters in Olney, MD, positive income, Commercial Lending Specialization, 43 total offices, Holding Company: Sandy Spring Bancorp, Inc.
- Wells Fargo Bank, National Association: Leisure World Plaza Branch, Aspen Hill Branch, Georgia Avenue Branch. Info updated 2011/04/05: Bank assets: $1,161,490.0 mil, Deposits: $905,653.0 mil, headquarters in Sioux Falls, SD, positive income, 6395 total offices, Holding Company: Wells Fargo & Company
- TD Bank, National Association: Silver Spring Store at 8661 Colesville Rd, branch established on 2011/07/15; Silver Springs Branch at 3132 Briggs Chaney Road, branch established on 2007/06/23. Info updated 2010/10/04: Bank assets: $188,912.6 mil, Deposits: $153,149.8 mil, headquarters in Wilmington, DE, positive income, 1314 total offices, Holding Company: Toronto-Dominion Bank, The
- 7 other banks with 9 local branches
For population 15 years and over in Silver Spring:
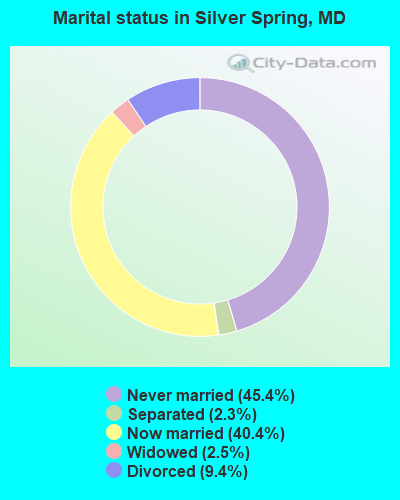
- Never married: 45.4%
- Now married: 40.4%
- Separated: 2.3%
- Widowed: 2.5%
- Divorced: 9.4%
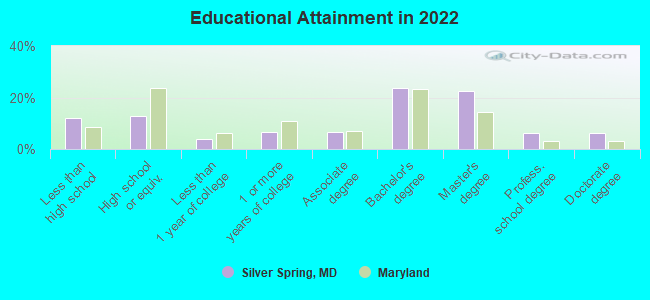
For population 25 years and over in Silver Spring:
- High school or higher: 88.0%
- Bachelor's degree or higher: 58.2%
- Graduate or professional degree: 34.5%
- Unemployed: 4.0%
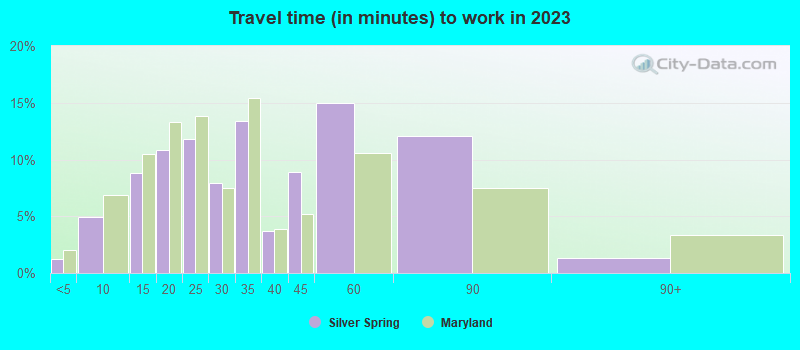
- Mean travel time to work (commute): 25.7 minutes
| Here: | 16.0 |
| Maryland average: | 12.7 |
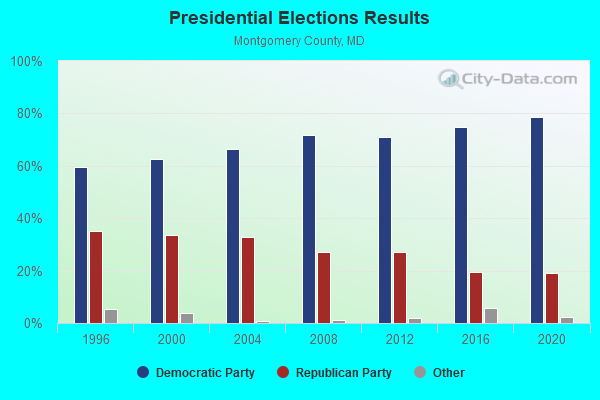
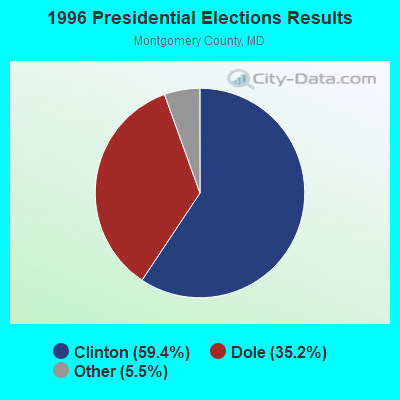
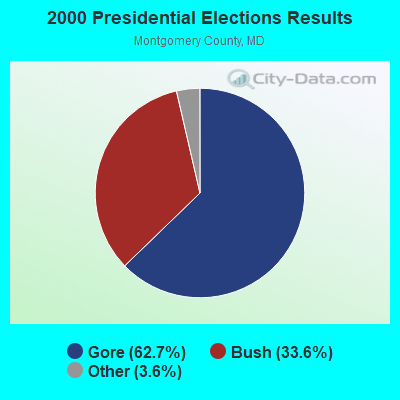
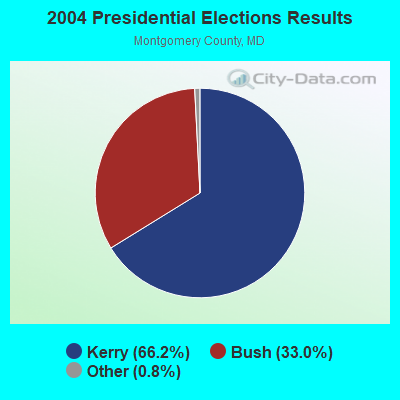
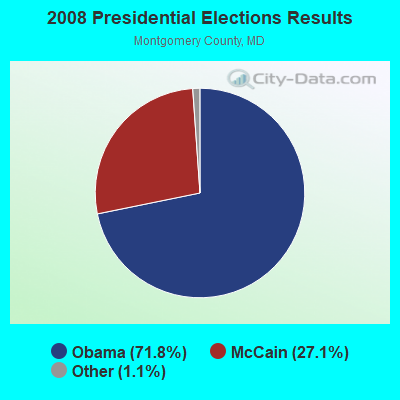
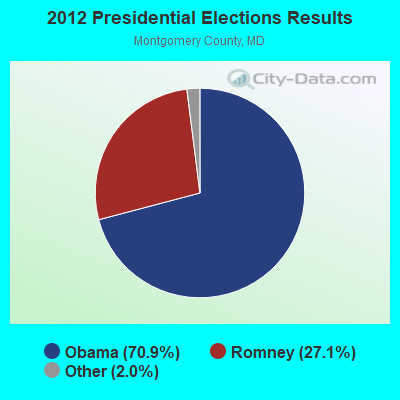
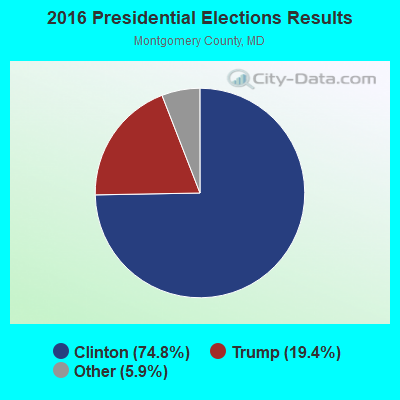
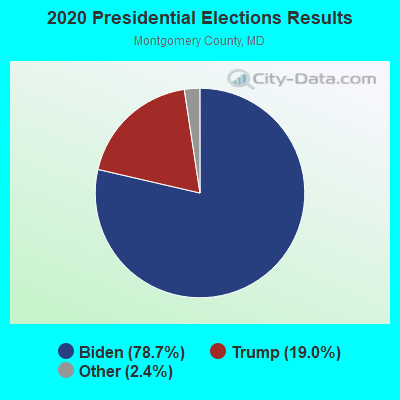
Graphs represent county-level data. Detailed 2008 Election Results
Neighborhoods in Silver Spring:
(Silver Spring, Maryland Neighborhood Map)- Arcola neighborhood
- Blair Portal neighborhood
- Brookside Forest neighborhood
- Burnt Mills Hills neighborhood
- Burnt Mills Knolls neighborhood
- Burnt Mills Manor neighborhood
- Burnt Mills Village neighborhood
- Chestnut Hills neighborhood
- Chestnut Ridge neighborhood
- Clifton Park Village neighborhood
- Connecticut Avenue Park neighborhood
- Cresthaven neighborhood
- Deer Park neighborhood
- Downtown Silver Spring (Downtown) neighborhood
- Downtown Wheaton (Downtown) neighborhood
- East Springbrook neighborhood
- Fairland Heights neighborhood
- Forest Glen neighborhood
- Forest Glen Park neighborhood
- Four Corners neighborhood
- Foxhall neighborhood
- Franklin Knolls neighborhood
- Georgian Forest neighborhood
- Glemont Forest neighborhood
- Glen Haven neighborhood
- Glenallen neighborhood
- Glenmont neighborhood
- Glenmont Hills neighborhood
- Glenmont Village neighborhood
- Glenview neighborhood
- Goodacre Knolls neighborhood
- Green Wood Knolls neighborhood
- Highland View neighborhood
- Hillandale Forest neighborhood
- Hillandale Heights neighborhood
- Holiday Park neighborhood
- Homestead Estates neighborhood
- Indian Spring Terrace neighborhood
- Indian Spring Village neighborhood
- Kemp MIll Estates neighborhood
- Kemp Mill neighborhood
- Layhill South neighborhood
- Linden neighborhood
- Lute neighborhood
- Montgomery Hills neighborhood
- Montgomery Knolls neighborhood
- New Hampshire Estates neighborhood
- North Hills Sligo Park neighborhood
- Northwest Park neighborhood
- Northwood Forest neighborhood
- Northwood Park neighborhood
- Oakview neighborhood
- Pine Hill neighborhood
- Players Mill Estates neighborhood
- Quaint Acres neighborhood
- Rock Creek Gardens neighborhood
- Rolling Acres neighborhood
- Rosemary Hills neighborhood
- Seven Oaks neighborhood
- Silver Spring Park neighborhood
- Sligo Park Hills neighborhood
- South Woodside Park neighborhood
- Springbrook neighborhood
- Springbrook Forest neighborhood
- Springbrook Manor neighborhood
- Stephen Knolls neighborhood
- Stoney Brook Estates neighborhood
- Sunset Terrace (Fairway) neighborhood
- Viers Mill Village neighborhood
- Wheaton neighborhood
- Wheaton Crest neighborhood
- Wheaton Forest neighborhood
- Wheaton Hills neighborhood
- Woodside neighborhood
- Woodside Forest neighborhood
- Woodside Park neighborhood
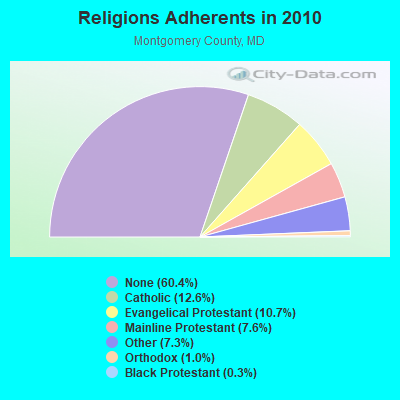
Religion statistics for Silver Spring, MD (based on Montgomery County data)
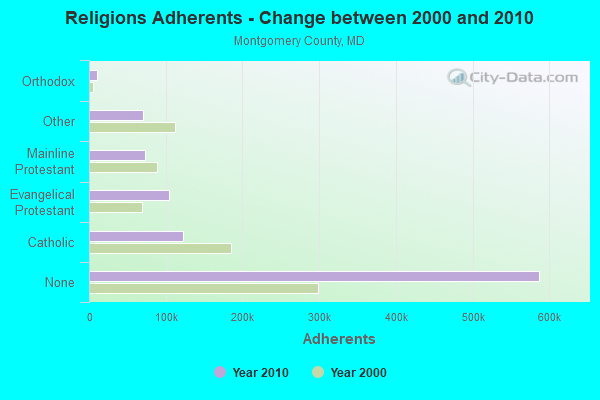
| Religion | Adherents | Congregations |
|---|---|---|
| Catholic | 122,569 | 39 |
| Evangelical Protestant | 104,377 | 319 |
| Mainline Protestant | 73,637 | 186 |
| Other | 70,946 | 153 |
| Orthodox | 9,889 | 14 |
| Black Protestant | 3,189 | 22 |
| None | 587,170 | - |
Food Environment Statistics:
| This county: | 2.16 / 10,000 pop. |
| State: | 1.96 / 10,000 pop. |
| This county: | 0.02 / 10,000 pop. |
| Maryland: | 0.07 / 10,000 pop. |
| This county: | 1.00 / 10,000 pop. |
| Maryland: | 1.22 / 10,000 pop. |
| This county: | 1.42 / 10,000 pop. |
| Maryland: | 2.05 / 10,000 pop. |
| This county: | 5.91 / 10,000 pop. |
| Maryland: | 5.40 / 10,000 pop. |
| Montgomery County: | 6.7% |
| Maryland: | 9.1% |
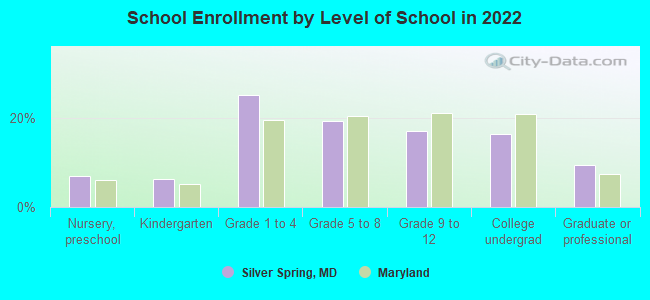
| Here: | 18.8% |
| State: | 26.7% |
| Here: | 19.9% |
| Maryland: | 15.5% |
Health and Nutrition:
| This city: | 48.9% |
| Maryland: | 50.1% |
| Silver Spring: | 48.4% |
| Maryland: | 47.6% |
| Here: | 28.3 |
| Maryland: | 28.8 |
| Silver Spring: | 19.2% |
| Maryland: | 20.0% |
| This city: | 11.1% |
| Maryland: | 11.3% |
| Silver Spring: | 6.7 |
| State: | 6.8 |
| Silver Spring: | 32.1% |
| Maryland: | 34.1% |
| Silver Spring: | 56.9% |
| Maryland: | 56.5% |
| Silver Spring: | 82.1% |
| Maryland: | 80.5% |
More about Health and Nutrition of Silver Spring, MD Residents
6.39% of this county's 2021 resident taxpayers lived in other counties in 2020 ($98,213 average adjusted gross income)
| Here: | 6.39% |
| Maryland average: | 7.42% |
0.04% of residents moved from foreign countries ($657 average AGI)
Montgomery County: 0.04% Maryland average: 0.05%
Top counties from which taxpayers relocated into this county between 2020 and 2021:
| from Prince George's County, MD | |
| from District of Columbia, DC | |
| from Fairfax County, VA |
7.69% of this county's 2020 resident taxpayers moved to other counties in 2021 ($102,008 average adjusted gross income)
| Here: | 7.69% |
| Maryland average: | 7.91% |
0.05% of residents moved to foreign countries ($861 average AGI)
Montgomery County: 0.05% Maryland average: 0.04%
Top counties to which taxpayers relocated from this county between 2020 and 2021:
| to Prince George's County, MD | |
| to Frederick County, MD | |
| to District of Columbia, DC |
| Businesses in Silver Spring, MD | ||||
| Name | Count | Name | Count | |
|---|---|---|---|---|
| 7-Eleven | 17 | Kmart | 1 | |
| AT&T | 3 | Kohl's | 1 | |
| Advance Auto Parts | 3 | LA Fitness | 1 | |
| Aeropostale | 1 | Little Caesars Pizza | 1 | |
| Ann Taylor | 1 | Marriott | 2 | |
| Audi | 1 | Marshalls | 1 | |
| BMW | 1 | MasterBrand Cabinets | 1 | |
| Baja Fresh Mexican Grill | 1 | Mazda | 1 | |
| Bally Total Fitness | 1 | Men's Wearhouse | 1 | |
| Baskin-Robbins | 3 | Motherhood Maternity | 1 | |
| Ben & Jerry's | 1 | New Balance | 2 | |
| Blockbuster | 1 | Nike | 9 | |
| Budget Car Rental | 1 | Nissan | 1 | |
| Burger King | 2 | Office Depot | 2 | |
| Burlington Coat Factory | 1 | Outback | 1 | |
| CVS | 7 | Outback Steakhouse | 1 | |
| Caribou Coffee | 1 | Panera Bread | 2 | |
| Chevrolet | 1 | Payless | 4 | |
| Chick-Fil-A | 2 | PetSmart | 1 | |
| Chico's | 1 | Pizza Hut | 6 | |
| Chipotle | 2 | Popeyes | 2 | |
| Chuck E. Cheese's | 1 | Qdoba Mexican Grill | 1 | |
| Circle K | 1 | Quiznos | 4 | |
| Cold Stone Creamery | 1 | RadioShack | 3 | |
| Comfort Inn | 1 | Rite Aid | 4 | |
| Cricket Wireless | 8 | SAS Shoes | 2 | |
| Curves | 2 | Safeway | 4 | |
| DHL | 5 | Sears | 4 | |
| Days Inn | 1 | Sprint Nextel | 4 | |
| Domino's Pizza | 5 | Staples | 3 | |
| DressBarn | 1 | Starbucks | 10 | |
| Dressbarn | 1 | Subaru | 1 | |
| Dunkin Donuts | 3 | Subway | 11 | |
| Famous Footwear | 1 | T-Mobile | 2 | |
| FedEx | 30 | T.G.I. Driday's | 1 | |
| Ford | 1 | Taco Bell | 2 | |
| Forever 21 | 1 | Target | 1 | |
| GNC | 2 | Toys"R"Us | 2 | |
| GameStop | 3 | Trader Joe's | 1 | |
| Giant | 5 | Travelodge | 1 | |
| H&R Block | 4 | True Value | 1 | |
| Hilton | 3 | UPS | 25 | |
| Holiday Inn | 1 | Volkswagen | 1 | |
| Home Depot | 1 | Vons | 4 | |
| Honda | 2 | Walgreens | 1 | |
| IHOP | 1 | Wendy's | 3 | |
| Jones New York | 2 | Whole Foods Market | 1 | |
| KFC | 2 | YMCA | 1 | |
Strongest AM radio stations in Silver Spring:
- WACA (1540 AM; daytime; 5 kW; WHEATON, MD; Owner: AC ACQUISITION, LLC)
- WTOP (1500 AM; 50 kW; WASHINGTON, DC; Owner: BONNEVILLE HOLDING COMPANY)
- WTEM (980 AM; 50 kW; WASHINGTON, DC; Owner: AMFM RADIO LICENSES, L.L.C.)
- WPLC (1050 AM; 1 kW; SILVER SPRING, MD; Owner: METRO RADIO, INC.)
- WWRC (1260 AM; 5 kW; WASHINGTON, DC; Owner: AMFM RADIO LICENSES, L.L.C.)
- WPGC (1580 AM; 50 kW; MORNINGSIDE, MD; Owner: INFINITY WPGC(AM), INC.)
- WMAL (630 AM; 5 kW; WASHINGTON, DC; Owner: WMAL, INC.)
- WUST (1120 AM; daytime; 20 kW; WASHINGTON, DC)
- WMET (1150 AM; 50 kW; GAITHERSBURG, MD; Owner: BELTWAY ACQUISITION CORPORATION)
- WTNT (570 AM; 5 kW; BETHESDA, MD; Owner: AMFM RADIO LICENSES, L.L.C.)
- WCBM (680 AM; 50 kW; BALTIMORE, MD; Owner: WCBM MARYLAND, INC.)
- WABS (780 AM; daytime; 5 kW; ARLINGTON, VA; Owner: SALEM MEDIA OF VIRGINIA, INC.)
- WBAL (1090 AM; 50 kW; BALTIMORE, MD; Owner: HEARST RADIO, INC.)
Strongest FM radio stations in Silver Spring:
- WWDC-FM (101.1 FM; WASHINGTON, DC; Owner: AMFM RADIO LICENSES, L.L.C.)
- WCSP-FM (90.1 FM; WASHINGTON, DC; Owner: NATIONAL CABLE SATELLITE CORPORATION)
- WBIG-FM (100.3 FM; WASHINGTON, DC; Owner: AMFM RADIO LICENSES, L.L.C.)
- WASH (97.1 FM; WASHINGTON, DC; Owner: AMFM RADIO LICENSES, L.L.C.)
- WRQX (107.3 FM; WASHINGTON, DC; Owner: WMAL, INC.)
- WHUR-FM (96.3 FM; WASHINGTON, DC; Owner: THE HOWARD UNIVERSITY)
- WARW (94.7 FM; BETHESDA, MD; Owner: INFINITY BROADCASTING OPERATIONS, INC.)
- WIHT (99.5 FM; WASHINGTON, DC; Owner: AMFM RADIO LICENSES, L.L.C.)
- WKYS (93.9 FM; WASHINGTON, DC; Owner: RADIO ONE LICENSES, LLC)
- WGMS-FM (103.5 FM; WASHINGTON, DC; Owner: BONNEVILLE HOLDING COMPANY)
- WAMU (88.5 FM; WASHINGTON, DC; Owner: THE EXEC. COMM. OF THE BD. OF TRUSTEES OF AMERICAN UNIV.)
- WMMJ (102.3 FM; BETHESDA, MD; Owner: RADIO ONE LICENSES, LLC)
- WPFW (89.3 FM; WASHINGTON, DC; Owner: PACIFICA FOUNDATION, INC.)
- WGTS (91.9 FM; TAKOMA PARK, MD; Owner: COLUMBIA UNION COLLEGE BROADCASTING, INC.)
- WETA (90.9 FM; WASHINGTON, DC; Owner: GREATER WASHINGTON EDUCATIONAL TELECOMMUNICATIONS ASSN.)
- WAVA (105.1 FM; ARLINGTON, VA; Owner: SALEM MEDIA OF VIRGINIA, INC.)
- WJFK-FM (106.7 FM; MANASSAS, VA; Owner: INFINITY BROADCASTING CORP. OF WASHINGTON, DC)
- WPGC-FM (95.5 FM; MORNINGSIDE, MD; Owner: INFINITY BROADCASTING CORPORATION OF MARYLAND)
- WMZQ-FM (98.7 FM; WASHINGTON, DC; Owner: AMFM RADIO LICENSES, L.L.C.)
- WHFS (99.1 FM; ANNAPOLIS, MD; Owner: INFINITY BROADCASTING OPERATIONS, INC.)
TV broadcast stations around Silver Spring:
- WBDC-TV (Channel 50; WASHINGTON, DC; Owner: WBDC BROADCASTING, INC.)
- WTTG (Channel 5; WASHINGTON, DC; Owner: FOX TELEVISION STATIONS, INC.)
- WJLA-TV (Channel 7; WASHINGTON, DC; Owner: ACC LICENSEE, INC.)
- WUSA (Channel 9; WASHINGTON, DC; Owner: THE DETROIT NEWS, INC.)
- WZDC-LP (Channel 64; WASHINGTON, DC; Owner: ONDA CAPITAL, INC.)
- WHUT-TV (Channel 32; WASHINGTON, DC; Owner: HOWARD UNIVERSITY)
- WETA-TV (Channel 26; WASHINGTON, DC; Owner: THE GREATER WASHINGTON ED TELECOMM. ASSOC)
- WDCA (Channel 20; WASHINGTON, DC; Owner: FOX TELEVISION STATIONS, INC.)
- WRC-TV (Channel 4; WASHINGTON, DC; Owner: NBC SUBSIDIARY (WRC-TV), INC.)
- W28BY (Channel 63; BALTIMORE, MD; Owner: INFORMATION SUPER STATION, L.L.C.)
- WMDO-CA (Channel 30; WASHINGTON, DC; Owner: ENTRAVISION HOLDINGS, LLC)
- WKRP-LP (Channel 42; WASHINGTON, DC; Owner: CAPITAL MEDIA, LLC)
- WNVC (Channel 56; FAIRFAX, VA; Owner: COMMONWEALTH PUBLIC BROADCASTING CORPORATION)
- WMPT (Channel 22; ANNAPOLIS, MD; Owner: MARYLAND PUBLIC BROADCASTING COMMISSION)
- WBAL-TV (Channel 11; BALTIMORE, MD; Owner: WBAL HEARST-ARGYLE TV, INC. (CA CORP.))
- WMAR-TV (Channel 2; BALTIMORE, MD; Owner: SCRIPPS HOWARD BROADCASTING COMPANY)
- WBFF (Channel 45; BALTIMORE, MD; Owner: CHESAPEAKE TELEVISION LICENSEE, LLC)
- WNUV (Channel 54; BALTIMORE, MD; Owner: BALTIMORE (WNUV-TV) LICENSEE, INC.)
- WUTB (Channel 24; BALTIMORE, MD; Owner: FOX TELEVISION STATIONS, INC.)
- WJZ-TV (Channel 13; BALTIMORE, MD; Owner: VIACOM INC.)
- WMPB (Channel 67; BALTIMORE, MD; Owner: MARYLAND PUBLIC BROADCASTING COMMISSION)
- WIAV-LP (Channel 58; WASHINGTON, DC; Owner: ASIAVISION, INC.)
- WPXW (Channel 66; MANASSAS, VA; Owner: PAXSON WASHINGTON LICENSE, INC.)
- WFPT (Channel 62; FREDERICK, MD; Owner: MARYLAND PUBLIC BROADCASTING COMMISSION)
- WNVT (Channel 53; GOLDVEIN, VA; Owner: COMMONWEALTH PUBLIC BROADCASTING CORPORATION)
- National Bridge Inventory (NBI) Statistics
- 39Number of bridges
- 643ft / 196mTotal length
- $9,981,000Total costs
- 2,241,071Total average daily traffic
- 99,368Total average daily truck traffic
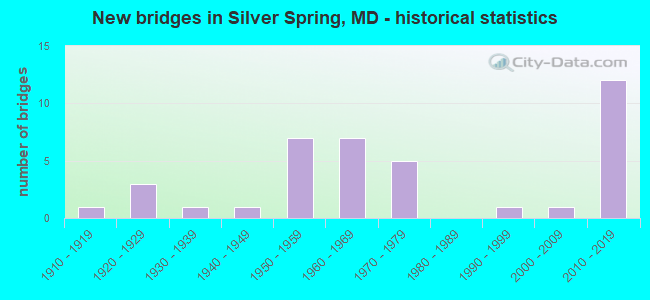
- New bridges - historical statistics
- 11910-1919
- 31920-1929
- 11930-1939
- 11940-1949
- 71950-1959
- 71960-1969
- 51970-1979
- 11990-1999
- 12000-2009
- 122010-2019
FCC Registered Antenna Towers: 81 (See the full list of FCC Registered Antenna Towers)
FCC Registered Commercial Land Mobile Towers: 3 (See the full list of FCC Registered Commercial Land Mobile Towers in Silver Spring, MD)
FCC Registered Private Land Mobile Towers: 14 (See the full list of FCC Registered Private Land Mobile Towers)
FCC Registered Broadcast Land Mobile Towers: 63 (See the full list of FCC Registered Broadcast Land Mobile Towers)
FCC Registered Microwave Towers: 95 (See the full list of FCC Registered Microwave Towers in this town)
FCC Registered Paging Towers: 20 (See the full list of FCC Registered Paging Towers)
FCC Registered Maritime Coast & Aviation Ground Towers: 1 (See the full list of FCC Registered Maritime Coast & Aviation Ground Towers)
FCC Registered Amateur Radio Licenses: 967 (See the full list of FCC Registered Amateur Radio Licenses in Silver Spring)
FAA Registered Aircraft Manufacturers and Dealers: 1 (See the full list of FAA Registered Manufacturers and Dealers in Silver Spring)
FAA Registered Aircraft: 49 (See the full list of FAA Registered Aircraft)
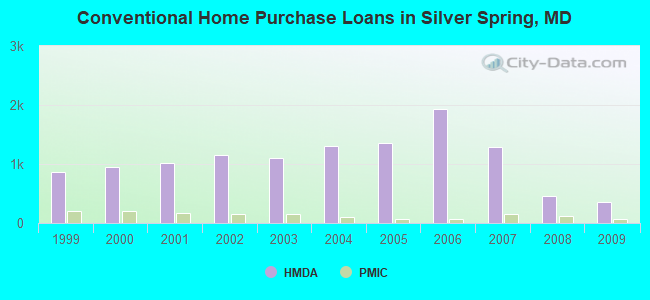
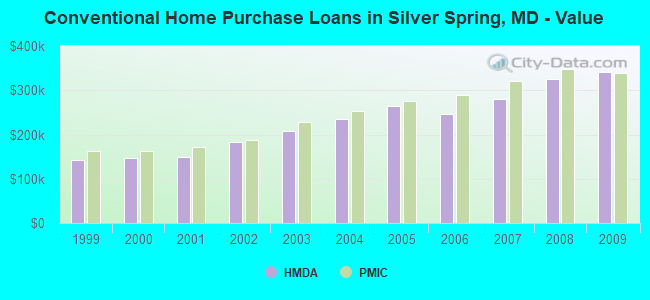
| Home Mortgage Disclosure Act Aggregated Statistics For Year 2009 (Based on 15 full and 4 partial tracts) | ||||||||||||||
| A) FHA, FSA/RHS & VA Home Purchase Loans | B) Conventional Home Purchase Loans | C) Refinancings | D) Home Improvement Loans | E) Loans on Dwellings For 5+ Families | F) Non-occupant Loans on < 5 Family Dwellings (A B C & D) | G) Loans On Manufactured Home Dwelling (A B C & D) | ||||||||
|---|---|---|---|---|---|---|---|---|---|---|---|---|---|---|
| Number | Average Value | Number | Average Value | Number | Average Value | Number | Average Value | Number | Average Value | Number | Average Value | Number | Average Value | |
| LOANS ORIGINATED | 227 | $345,903 | 349 | $341,614 | 1,794 | $307,242 | 82 | $185,083 | 3 | $14,316,000 | 65 | $241,456 | 0 | $0 |
| APPLICATIONS APPROVED, NOT ACCEPTED | 15 | $338,883 | 23 | $338,336 | 123 | $296,135 | 10 | $83,939 | 0 | $0 | 8 | $191,705 | 0 | $0 |
| APPLICATIONS DENIED | 26 | $271,939 | 33 | $259,868 | 470 | $319,786 | 29 | $105,290 | 0 | $0 | 34 | $206,512 | 1 | $188,380 |
| APPLICATIONS WITHDRAWN | 43 | $299,395 | 60 | $337,086 | 339 | $307,810 | 18 | $143,652 | 0 | $0 | 26 | $229,863 | 0 | $0 |
| FILES CLOSED FOR INCOMPLETENESS | 3 | $375,287 | 8 | $214,312 | 103 | $292,421 | 10 | $245,900 | 0 | $0 | 7 | $271,807 | 0 | $0 |
Detailed mortgage data for all 19 tracts in Silver Spring, MD
| Private Mortgage Insurance Companies Aggregated Statistics For Year 2009 (Based on 14 full and 4 partial tracts) | ||||
| A) Conventional Home Purchase Loans | B) Refinancings | |||
|---|---|---|---|---|
| Number | Average Value | Number | Average Value | |
| LOANS ORIGINATED | 70 | $338,784 | 30 | $368,195 |
| APPLICATIONS APPROVED, NOT ACCEPTED | 14 | $306,749 | 6 | $409,250 |
| APPLICATIONS DENIED | 2 | $196,125 | 11 | $336,105 |
| APPLICATIONS WITHDRAWN | 3 | $262,333 | 4 | $302,382 |
| FILES CLOSED FOR INCOMPLETENESS | 0 | $0 | 1 | $384,000 |
2004 - 2018 National Fire Incident Reporting System (NFIRS) incidents
- Fire incident types reported to NFIRS in Silver Spring, MD
- 2,03840.4%Structure Fires
- 1,74534.6%Outside Fires
- 1,02220.3%Mobile Property/Vehicle Fires
- 2344.6%Other
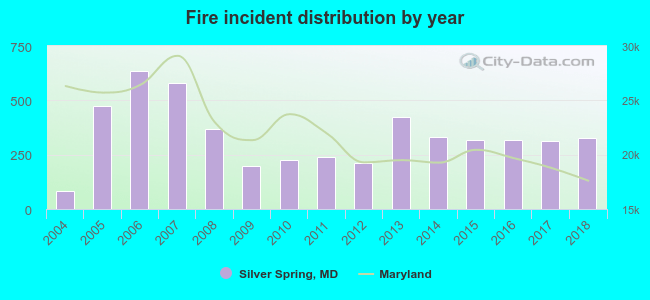 According to the data from the years 2004 - 2018 the average number of fires per year is 336. The highest number of reported fires - 636 took place in 2006, and the least - 82 in 2004. The data has a growing trend.
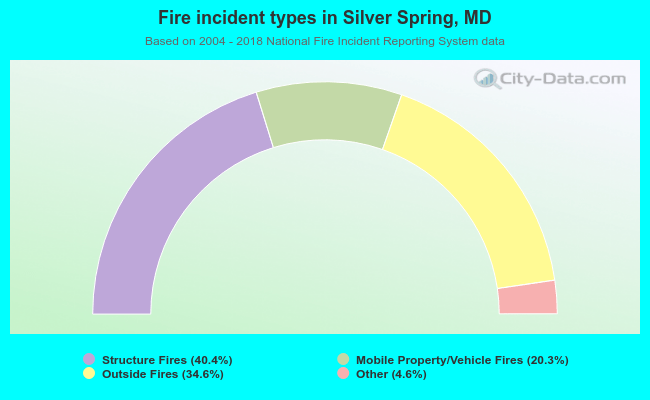 When looking into fire subcategories, the most reports belonged to: Structure Fires (40.4%), and Outside Fires (34.6%).
Fire-safe hotels and motels in Silver Spring, Maryland:
- Doubletree By Hilton Washington DC/Silver Spring, 8727 Colesville Rd, Silver Spring, Maryland 20910 , Phone: (301) 589-5200, Fax: (301) 589-0269
- Sheraton Silver Spring Hotel, 8777 Georgia Ave, Silver Spring, Maryland 20910 , Phone: (301) 589-0800, Fax: (301) 587-4791
- Courtyard By Marriott-Silver Spring Downtown, 8506 Fenton St, Silver Spring, Maryland 20910 , Phone: (301) 589-4899, Fax: (301) 589-4898
- Holiday Inn Express Washington DC & North Silver Spring, 7990 Georgia Ave, Silver Spring, Maryland 20910 , Phone: (301) 565-3444, Fax: (301) 588-2207
- Residence Inn By Marriott Silver Spring, 12000 Plum Orchard Dr, Silver Spring, Maryland 20904 , Phone: (301) 572-2322, Fax: (301) 572-2362
- Hampton Inn/Homewood Suites Silver Spring, 8728 Colesville Rd, Silver Spring, Maryland 20910 , Phone: (301) 588-5887, Fax: (301) 588-5889
- Homewood Suites Silver Spring, 8728 - B Colesville Rd, Silver Spring, Maryland 20910 , Phone: (301) 565-0005, Fax: (301) 588-5889
- Hilton Garden Inn Silver Spring North, 2200 Broadbirch Dr, Silver Spring, Maryland 20904 , Phone: (301) 622-3333, Fax: (301) 622-3338
- 2 other hotels and motels
| Most common first names in Silver Spring, MD among deceased individuals | ||
| Name | Count | Lived (average) |
|---|---|---|
| Mary | 1,354 | 80.9 years |
| John | 1,266 | 74.8 years |
| William | 1,120 | 75.9 years |
| James | 819 | 72.7 years |
| Robert | 753 | 73.2 years |
| Joseph | 730 | 77.0 years |
| Helen | 707 | 81.3 years |
| Charles | 684 | 75.6 years |
| Margaret | 653 | 80.5 years |
| George | 646 | 77.2 years |
| Most common last names in Silver Spring, MD among deceased individuals | ||
| Last name | Count | Lived (average) |
|---|---|---|
| Smith | 433 | 76.2 years |
| Miller | 268 | 78.0 years |
| Johnson | 255 | 76.1 years |
| Brown | 253 | 75.8 years |
| Jones | 229 | 76.3 years |
| Williams | 225 | 74.3 years |
| Davis | 193 | 77.4 years |
| Thompson | 149 | 76.9 years |
| Lee | 149 | 75.7 years |
| Cohen | 139 | 79.8 years |
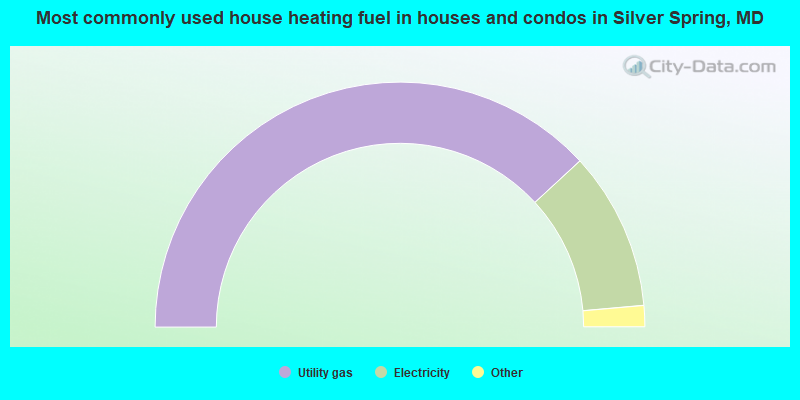
- 76.3%Utility gas
- 20.9%Electricity
- 1.1%Other fuel
- 0.9%Fuel oil, kerosene, etc.
- 0.6%Bottled, tank, or LP gas
- 0.2%Solar energy
- 0.1%Wood
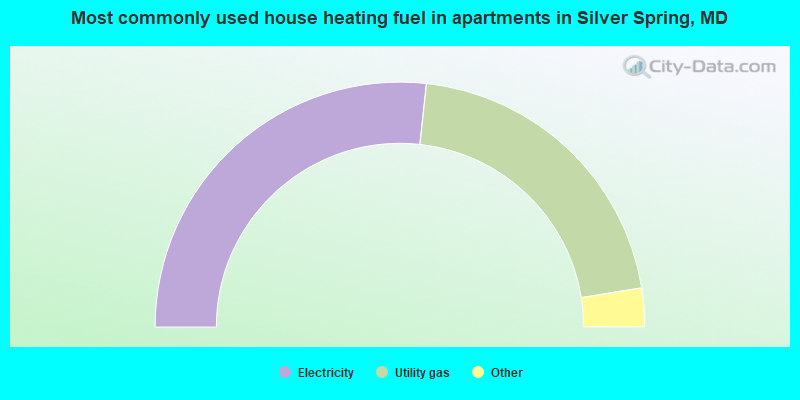
- 53.4%Electricity
- 41.4%Utility gas
- 1.5%No fuel used
- 1.3%Bottled, tank, or LP gas
- 1.2%Other fuel
- 0.8%Fuel oil, kerosene, etc.
- 0.2%Wood
Silver Spring compared to Maryland state average:
- Median house value above state average.
- Unemployed percentage significantly below state average.
- Hispanic race population percentage above state average.
- Foreign-born population percentage significantly above state average.
- Renting percentage above state average.
- Number of rooms per house significantly below state average.
- Percentage of population with a bachelor's degree or higher above state average.
Silver Spring on our top lists:
- #4 on the list of "Top 101 cities with largest percentage of females in industries: other services, except public administration (population 50,000+)"
- #4 on the list of "Top 101 larger cities with the highest increase in house/condo value from 2000 (population 50,000+)"
- #6 on the list of "Top 101 cities with the most residents born in Ethiopia (population 500+)"
- #11 on the list of "Top 101 cities with largest percentage of females in industries: public administration (population 50,000+)"
- #12 on the list of "Top 101 cities with largest percentage of females in occupations: arts, design, entertainment, sports, and media occupations (population 50,000+)"
- #14 on the list of "Top 101 cities with the most people having professional degrees (population 50,000+)"
- #16 on the list of "Top 101 cities with the most residents born in Eastern Africa (population 500+)"
- #18 on the list of "Top 101 cities with largest percentage of females in occupations: computer and mathematical occupations (population 50,000+)"
- #18 on the list of "Top 101 cities with largest percentage of females in occupations: legal occupations (population 50,000+)"
- #22 on the list of "Top 101 cities with largest percentage of males in occupations: arts, design, entertainment, sports, and media occupations (population 50,000+)"
- #23 on the list of "Top 101 cities with the largest percentage of likely lesbian couples (counted as self-reported female-female unmarried-partner households) (population 50,000+)"
- #24 on the list of "Top 101 cities with the most residents born in Africa (population 500+)"
- #26 on the list of "Top 100 cities with declining populations from 2000 to 2014 (pop. 50,000+)"
- #27 on the list of "Top 101 cities with the largest percentage population decrease from 2000 (population 50,000+)"
- #28 on the list of "Top 101 cities with the largest percentage of likely homosexual households (counted as self-reported same-sex unmarried-partner households) (population 50,000+)"
- #29 on the list of "Top 101 cities with the most residents born in Middle Africa (population 500+)"
- #31 on the list of "Top 101 cities with largest percentage of males in occupations: construction and extraction occupations (population 50,000+)"
- #31 on the list of "Top 100 most racially diverse cities (pop. 50,000+)"
- #32 on the list of "Top 101 cities with largest percentage of females in occupations: life, physical, and social science occupations (population 50,000+)"
- #33 on the list of "Top 101 cities with largest percentage of males in industries: public administration (population 50,000+)"
- #4 on the list of "Top 101 counties with the largest number of people without health insurance coverage in 2000 (pop. 50,000+)"
- #6 on the list of "Top 101 counties with the best general health status score of residents (1-5), 3 years of data"
- #10 on the list of "Top 101 counties with the highest surface withdrawal of fresh water for public supply"
- #13 on the list of "Top 101 counties with the highest total withdrawal of fresh water for public supply"
- #14 on the list of "Top 101 counties with the highest percentage of residents that visited a dentist within the past year"

|
|
Total of 2073 patent applications in 2008-2024.