Frederick County, Maryland (MD)
County owner-occupied free and clear houses and condos in 2010: 11,458
County owner-occupied houses and condos in 2000: 53,138
Renter-occupied apartments: 20,485 (it was 16,922 in 2000)
| % of renters here: | 24% |
| State: | 32% |
Land area: 663 sq. mi.
Water area: 4.5 sq. mi.
Population density: 433 people per square mile (high).
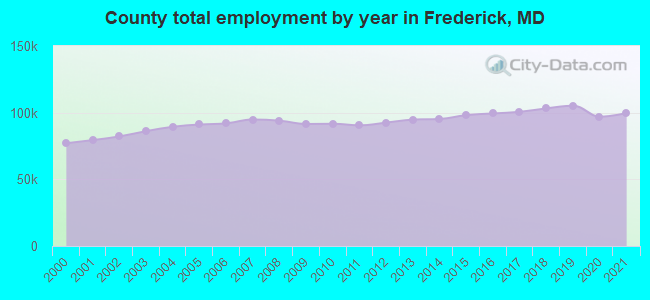
Industries providing employment: Professional, scientific, management, administrative, and waste management services (21.2%), Educational, health and social services (19.9%).
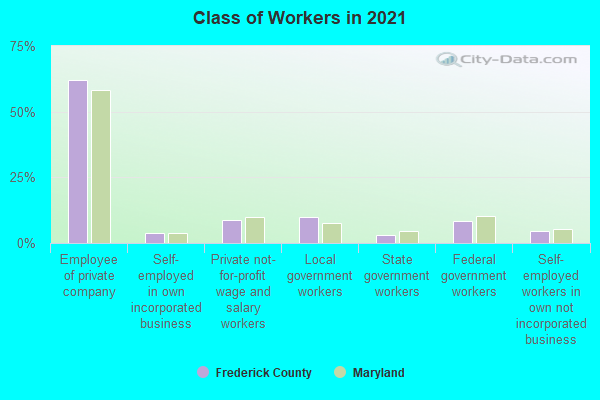
Type of workers:
- Private wage or salary: 74%
- Government: 20%
- Self-employed, not incorporated: 5%
- Unpaid family work: 0%
- OSM Map
- General Map
- Google Map
- MSN Map

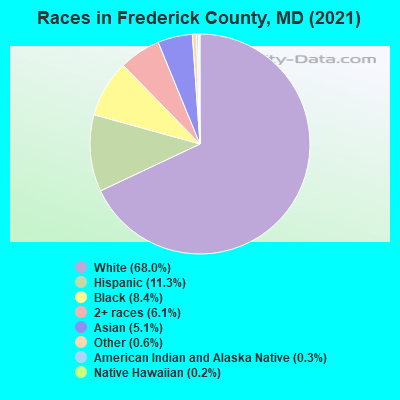
- 189,92766.2%White Non-Hispanic Alone
- 34,19411.9%Hispanic or Latino
- 27,4569.6%Black Non-Hispanic Alone
- 16,4695.7%Asian alone
- 15,6835.5%Two or more races
- 1,7970.6%American Indian and Alaska Native alone
- 1,4900.5%Some other race alone
- 630.02%Native Hawaiian and Other
Pacific Islander alone
| Median resident age: | 39.6 years |
| Maryland median age: | 39.7 years |
| Males: 142,093 | |
| Females: 144,986 |

 | Possible Move to Frederick, MD (43 replies) |
| Downtown Frederick of the Past (8 replies) |
| Living Near Frederick County Landfill (Reichs Ford Road) (6 replies) |
| Relocating to Middletown, Lovettsville, Knoxville, Brunswick, POR, or Adamstown (6 replies) |
| Racism in Middletown (84 replies) |
| Moving from NY To Maryland (12 replies) |
| Frederick County: | 2.0 people |
| Maryland: | 3 people |
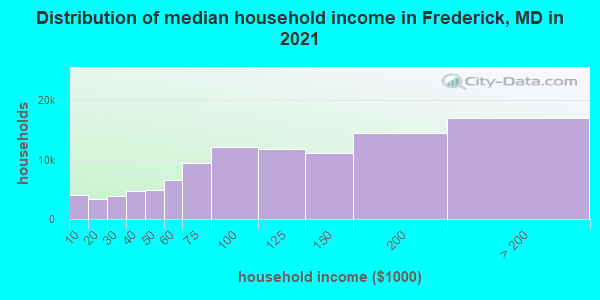
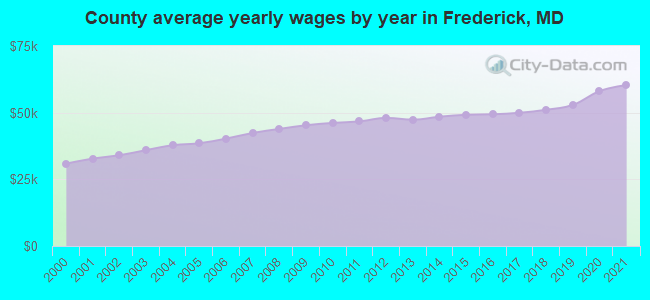
Estimated median household income in 2022: $119,122 ($60,276 in 1999)
| This county: | $119,122 |
| Maryland: | $94,991 |
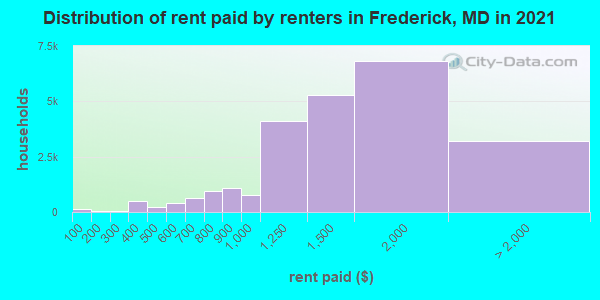
Median contract rent in 2022 for apartments: $1,541 (lower quartile is $1,069, upper quartile is $1,928)
| This county: | $1541 |
| State: | $1388 |
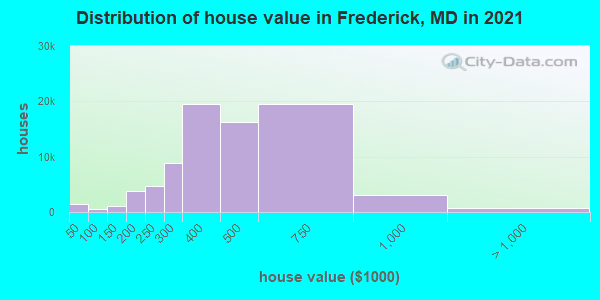
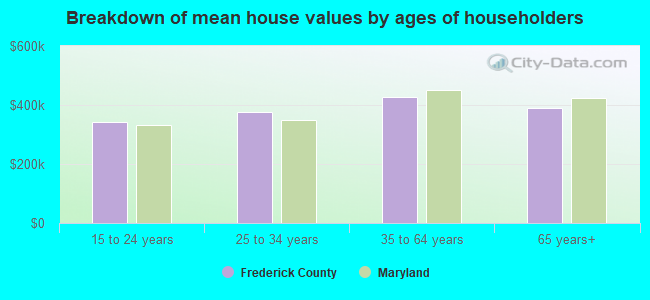
Estimated median house or condo value in 2022: $453,400 (it was $161,000 in 2000)
| Frederick: | $453,400 |
| Maryland: | $398,100 |
Mean price in 2022:
Median monthly housing costs for homes and condos with a mortgage: $2,227Detached houses: $575,676
Here: $575,676 State: $526,819 Townhouses or other attached units: $390,501
Here: $390,501 State: $328,305 In 2-unit structures: $340,938
Here: $340,938 State: $346,599 In 3-to-4-unit structures: $324,226
Here: $324,226 State: $295,378 In 5-or-more-unit structures: $258,566
Here: $258,566 State: $350,378 Mobile homes: $221,205
Here: $221,205 State: $89,353
Median monthly housing costs for units without a mortgage: $657
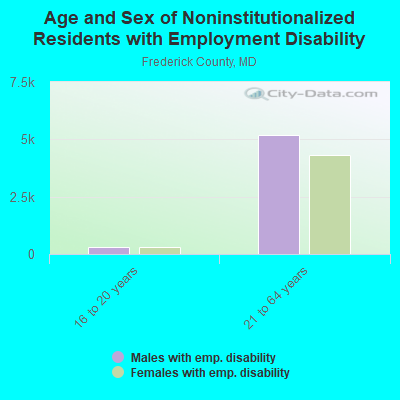
Institutionalized population: 1,640
Crime in 2020 (reported by the sheriff's office or county police, not the county total):
- Murders: 4
- Rapes: 13
- Robberies: 16
- Assaults: 85
- Burglaries: 83
- Thefts: 589
- Auto thefts: 21
Crime in 2019 (reported by the sheriff's office or county police, not the county total):
- Murders: 0
- Rapes: 20
- Robberies: 23
- Assaults: 153
- Burglaries: 153
- Thefts: 979
- Auto thefts: 51
Health of residents in Frederick County based on CDC Behavioral Risk Factor Surveillance System Survey Questionnaires from 2003 to 2012:
General health status score of residents in this county from 1 (poor) to 5 (excellent) is 3.7. This is better than average.77.3% of residents exercised in the past month. This is about average.
42.8% of residents smoked 100+ cigarettes in their lives. This is about average.
77.1% of adult residents drank alcohol in the past 30 days. This is about average.
77.6% of residents visited a dentist within the past year. This is more than average.
Average weight of males is 197 pounds. This is about average.
Average weight of females is 163 pounds. This is about average.
32.4% of residents keep firearms around their homes. This is more than average.
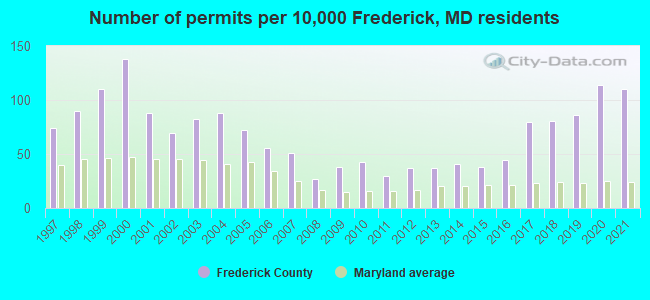
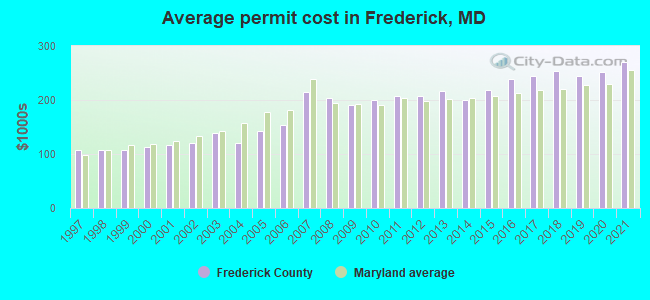
Single-family new house construction building permits:
- 2022: 1476 buildings, average cost: $253,300
- 2021: 2144 buildings, average cost: $271,100
- 2020: 2217 buildings, average cost: $251,700
- 2019: 1688 buildings, average cost: $244,300
- 2018: 1584 buildings, average cost: $253,900
- 2017: 1566 buildings, average cost: $244,200
- 2016: 856 buildings, average cost: $237,900
- 2015: 740 buildings, average cost: $218,800
- 2014: 807 buildings, average cost: $199,900
- 2013: 722 buildings, average cost: $215,700
- 2012: 730 buildings, average cost: $207,100
- 2011: 594 buildings, average cost: $208,200
- 2010: 844 buildings, average cost: $200,300
- 2009: 749 buildings, average cost: $191,300
- 2008: 535 buildings, average cost: $203,600
- 2007: 1003 buildings, average cost: $213,600
- 2006: 1098 buildings, average cost: $153,800
- 2005: 1414 buildings, average cost: $141,900
- 2004: 1718 buildings, average cost: $121,400
- 2003: 1605 buildings, average cost: $138,800
- 2002: 1352 buildings, average cost: $120,400
- 2001: 1721 buildings, average cost: $117,400
- 2000: 2695 buildings, average cost: $113,200
- 1999: 2151 buildings, average cost: $107,100
- 1998: 1762 buildings, average cost: $107,800
- 1997: 1438 buildings, average cost: $107,200
Median real estate property taxes paid for housing units with mortgages in 2022: $4,467 (1.0%)
Median real estate property taxes paid for housing units with no mortgage in 2022: $3,826 (0.9%)
| Frederick County: | 5.1% |
| Maryland: | 9.6% |
Median age of residents in 2022: 39.6 years old
(Males: 39.0 years old, Females: 40.6 years old)
(Median age for: White residents: 43.3 years old, Black residents: 34.4 years old, American Indian residents: 31.8 years old, Asian residents: 39.2 years old, Hispanic or Latino residents: 29.9 years old, Other race residents: 30.1 years old)
Area name: Washington-Arlington-Alexandria, DC-VA-MD HUD Metro FMR Area
Fair market rent in 2006 for a 1-bedroom apartment in Frederick County is $1080 a month.
Fair market rent for a 2-bedroom apartment is $1225 a month.
Fair market rent for a 3-bedroom apartment is $1580 a month.
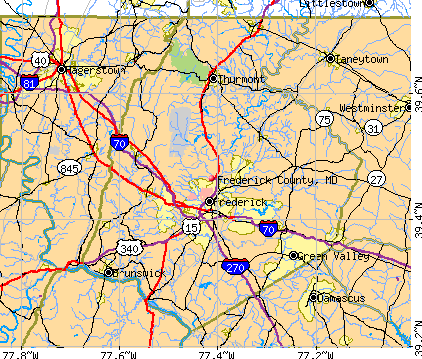
Cities in this county include: Frederick, Ballenger Creek, Linganore-Bartonsville, Green Valley, Urbana, Linganore, District 3, Middletown, District 1, Buckeystown, Thurmont, Walkersville.
2023 air pollution in Frederick County:
Ozone (1-hour): 0.035 ppm (standard limit: 0.12 ppm). Near U.S. average.
Neighboring counties: Carbon County, Utah  , Cass County, Illinois , Clear Creek County, Colorado , Cumberland County, Illinois , Greene County, Illinois , Kit Carson County, Colorado .
| Here: | 1.9% |
| Maryland: | 2.0% |

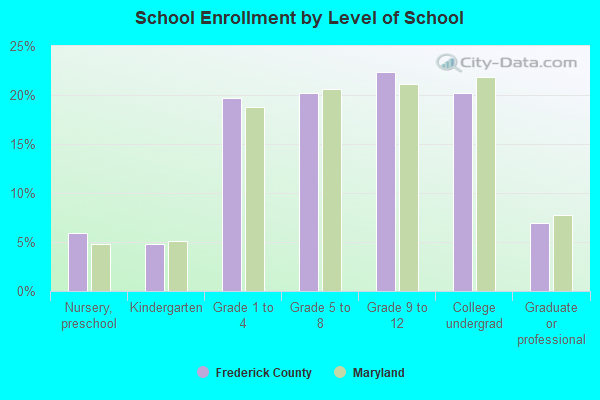
Current college students: 10,587
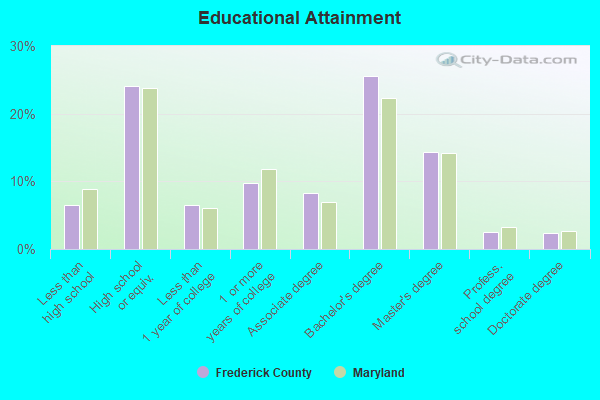
People 25 years of age or older with a high school degree or higher: 93.9%
People 25 years of age or older with a bachelor's degree or higher: 47.4%
Number of foreign born residents: 40,405 (54.4% naturalized citizens)
| Frederick County: | 14.1% |
| Whole state: | 16.7% |
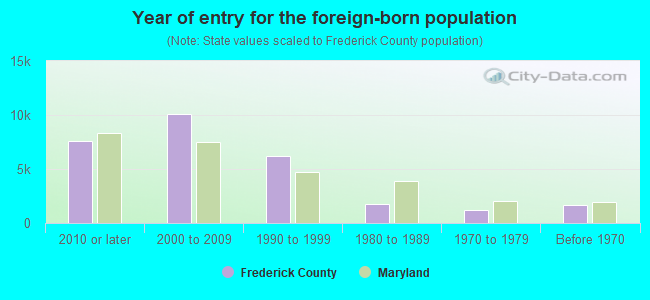
- Year of entry for the foreign-born population
- 12,4642010 or later
- 10,6272000 to 2009
- 8,2871990 to 1999
- 1,7591980 to 1989
- 1,1631970 to 1979
- 1,665Before 1970
Mean travel time to work (commute): minutes
Percentage of county residents living and working in this county: 90.9%
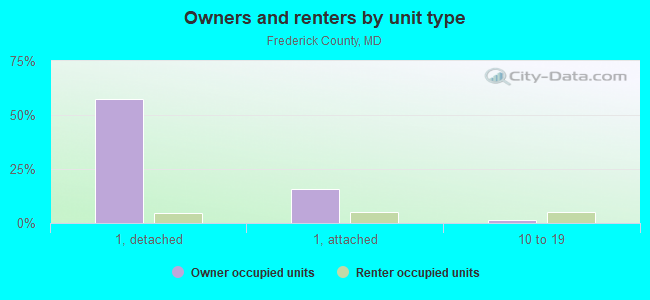
Housing units in structures:
- One, detached: 66,530
- One, attached: 20,752
- Two: 1,646
- 3 or 4: 1,239
- 5 to 9: 4,689
- 10 to 19: 8,027
- 20 to 49: 3,146
- 50 or more: 2,486
- Mobile homes: 481
Housing units in Frederick County with a mortgage: 62,252 (7,251 second mortgage, 39 home equity loan, 6,251 both second mortgage and home equity loan)
Houses without a mortgage: 1,337
| Here: | 98.4% with mortgage |
| State: | 97.5% with mortgage |
Religion statistics for Frederick County
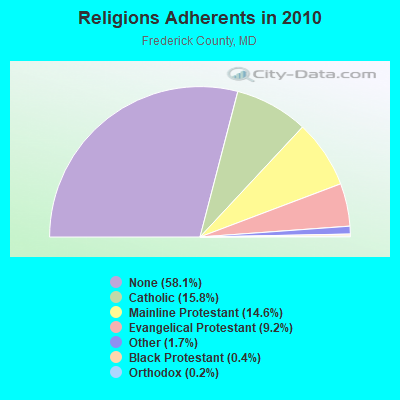
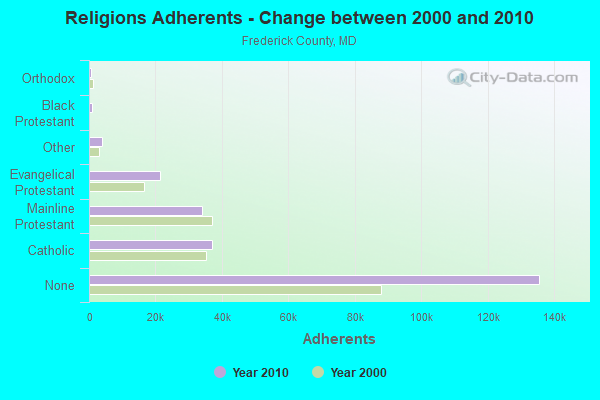
| Religion | Adherents | Congregations |
|---|---|---|
| Catholic | 36,923 | 12 |
| Mainline Protestant | 34,107 | 110 |
| Evangelical Protestant | 21,401 | 113 |
| Other | 3,901 | 19 |
| Black Protestant | 931 | 5 |
| Orthodox | 545 | 2 |
| None | 135,577 | - |
Source: Clifford Grammich, Kirk Hadaway, Richard Houseal, Dale E.Jones, Alexei Krindatch, Richie Stanley and Richard H.Taylor. 2012. 2010 U.S.Religion Census: Religious Congregations & Membership Study. Association of Statisticians of American Religious Bodies. Jones, Dale E., et al. 2002. Congregations and Membership in the United States 2000. Nashville, TN: Glenmary Research Center.
Food Environment Statistics:
| Frederick County: | 1.65 / 10,000 pop. |
| State: | 1.96 / 10,000 pop. |
| Here: | 0.09 / 10,000 pop. |
| Maryland: | 0.07 / 10,000 pop. |
| This county: | 0.94 / 10,000 pop. |
| Maryland: | 1.22 / 10,000 pop. |
| Frederick County: | 2.14 / 10,000 pop. |
| Maryland: | 2.05 / 10,000 pop. |
| This county: | 5.62 / 10,000 pop. |
| State: | 5.40 / 10,000 pop. |
| Frederick County: | 7.8% |
| Maryland: | 9.1% |
| Frederick County: | 26.4% |
| State: | 26.7% |
| Here: | 17.5% |
| State: | 15.5% |
Agriculture in Frederick County:
Average size of farms: 154 acresAverage value of agricultural products sold per farm: $76,004
Average value of crops sold per acre for harvested cropland: $170.53
The value of nursery, greenhouse, floriculture, and sod as a percentage of the total market value of agricultural products sold: 5.07%
The value of livestock, poultry, and their products as a percentage of the total market value of agricultural products sold: 78.60%
Average total farm production expenses per farm: $76,284
Harvested cropland as a percentage of land in farms: 62.00%
Irrigated harvested cropland as a percentage of land in farms: 0.97%
Average market value of all machinery and equipment per farm: $76,343
The percentage of farms operated by a family or individual: 86.02%
Average age of principal farm operators: 56 years
Average number of cattle and calves per 100 acres of all land in farms: 27.03
Milk cows as a percentage of all cattle and calves: 42.14%
Corn for grain: 22101 harvested acres
All wheat for grain: 11908 harvested acres
Soybeans for beans: 21702 harvested acres
Vegetables: 488 harvested acres
Land in orchards: 439 acres
Earthquake activity:
Frederick County-area historical earthquake activity is significantly above Maryland state average. It is 56% smaller than the overall U.S. average.On 8/23/2011 at 17:51:04, a magnitude 5.8 (5.8 MW, Depth: 3.7 mi, Class: Moderate, Intensity: VI - VII) earthquake occurred 111.1 miles away from Frederick County center
On 9/25/1998 at 19:52:52, a magnitude 5.2 (4.8 MB, 4.3 MS, 5.2 LG, 4.5 MW, Depth: 3.1 mi) earthquake occurred 210.4 miles away from the county center
On 1/16/1994 at 01:49:16, a magnitude 4.6 (4.6 MB, 4.6 LG, Depth: 3.1 mi, Class: Light, Intensity: IV - V) earthquake occurred 94.5 miles away from the county center
On 8/25/2011 at 05:07:52, a magnitude 4.5 (4.5 ML, Depth: 4.2 mi) earthquake occurred 109.1 miles away from the county center
On 12/9/2003 at 20:59:18, a magnitude 4.5 (4.5 ML, Depth: 6.2 mi) earthquake occurred 122.6 miles away from Frederick County center
On 12/9/2003 at 20:59:14, a magnitude 4.5 (4.5 MB, 4.5 LG) earthquake occurred 132.5 miles away from the county center
Magnitude types: regional Lg-wave magnitude (LG), body-wave magnitude (MB), local magnitude (ML), surface-wave magnitude (MS), moment magnitude (MW)
Most recent natural disasters:
- Maryland Covid-19 Pandemic, Incident Period: January 20, 2020, Major Disaster (Presidential) Declared DR-4491-MD: March 26, 2020, FEMA Id: 4491, Natural disaster type: Other
- Maryland Severe Storms And Flooding, Incident Period: May 15, 2018 - May 19, 2018, FEMA Id: 4374, Natural disaster type: Storm, Flood
- Maryland Severe Winter Storm and Snowstorm, Incident Period: January 22, 2016 to January 23, 2016, Major Disaster (Presidential) Declared DR-4261: March 04, 2016, FEMA Id: 4261, Natural disaster type: Snowstorm, Winter Storm
- Maryland Hurricane Sandy, Incident Period: October 26, 2012 to November 08, 2012, Emergency Declared EM-3349: October 28, 2012, FEMA Id: 3349, Natural disaster type: Hurricane
- Maryland Hurricane Sandy, Incident Period: October 26, 2012 to November 04, 2012, Major Disaster (Presidential) Declared DR-4091: November 20, 2012, FEMA Id: 4091, Natural disaster type: Hurricane
- Maryland Hurricane Irene, Incident Period: August 26, 2011 to September 05, 2011, Emergency Declared EM-3335: August 27, 2011, FEMA Id: 3335, Natural disaster type: Hurricane
- Maryland Severe Winter Storms and Snowstorms, Incident Period: February 05, 2010 to February 11, 2010, Major Disaster (Presidential) Declared DR-1910: May 06, 2010, FEMA Id: 1910, Natural disaster type: Snowstorm, Winter Storm
- Maryland Hurricane Katrina Evacuation, Incident Period: August 29, 2005 to October 01, 2005, Emergency Declared EM-3251: September 13, 2005, FEMA Id: 3251, Natural disaster type: Hurricane
- Maryland Hurricane Isabel, Incident Period: September 18, 2003 to September 29, 2003, Major Disaster (Presidential) Declared DR-1492: September 19, 2003, FEMA Id: 1492, Natural disaster type: Hurricane
- Maryland Snowstorm, Incident Period: February 14, 2003 to February 23, 2003, Emergency Declared EM-3179: March 14, 2003, FEMA Id: 3179, Natural disaster type: Snowstorm
- 11 other natural disasters have been reported since 1953.
The number of natural disasters in Frederick County (21) is greater than the US average (15).
Major Disasters (Presidential) Declared: 15
Emergencies Declared: 5
Causes of natural disasters: Floods: 6, Hurricanes: 6, Storms: 5, Winter Storms: 5, Snowstorms: 3, Blizzard: 1, Heavy Rain: 1, Ice Storm: 1, Snowfall: 1, Tornado: 1, Tropical Storm: 1, Other: 1 (Note: some incidents may be assigned to more than one category).
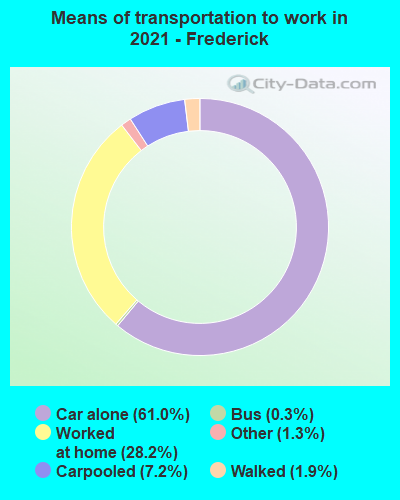
Means of transportation to work:
- Drove a car alone: 83,782 (63.8%)
- Carpooled: 9,980 (7.6%)
- Bus: 251 (0.2%)
- Subway or elevated rail: 59 (0.0%)
- Long-distance train or commuter rail: 54 (0.0%)
- Taxicab, motorcycle, or other means: 1,428 (1.1%)
- Bicycle: 620 (0.5%)
- Walked: 1,607 (1.2%)
- Worked at home: 33,610 (25.6%)
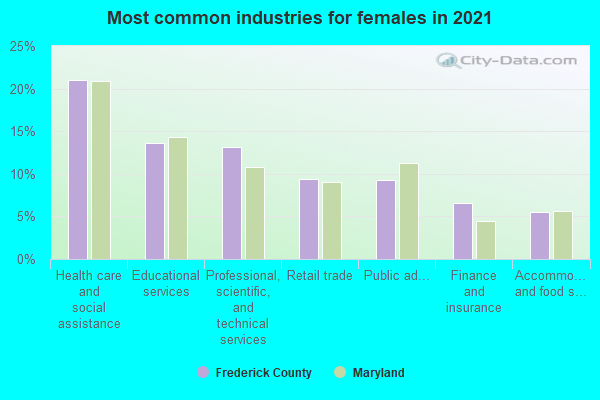
- Health care and social assistance (16%)
- Professional, scientific, and technical services (14%)
- Educational services (13%)
- Retail trade (7%)
- Accommodation and food services (5%)
- Public administration (5%)
- Other services, except public administration (5%)
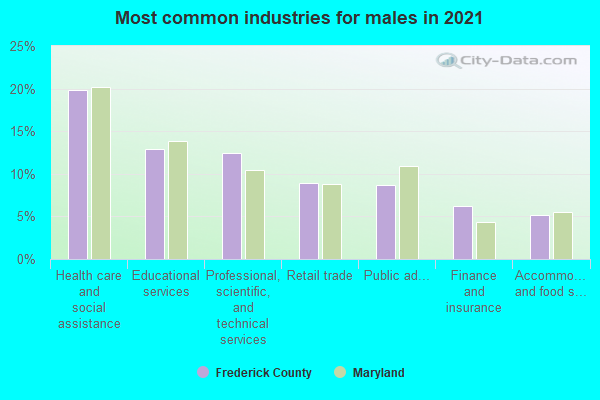
- Health care and social assistance (19%)
- Professional, scientific, and technical services (16%)
- Educational services (15%)
- Retail trade (9%)
- Accommodation and food services (6%)
- Public administration (6%)
- Other services, except public administration (6%)
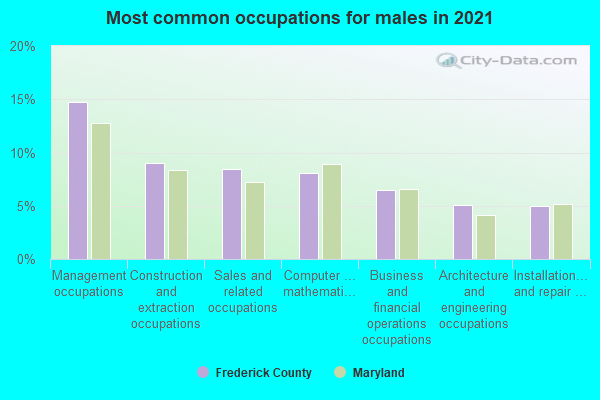
- Management occupations (17%)
- Sales and related occupations (11%)
- Computer and mathematical occupations (9%)
- Construction and extraction occupations (8%)
- Business and financial operations occupations (5%)
- Building and grounds cleaning and maintenance occupations (5%)
- Installation, maintenance, and repair occupations (5%)
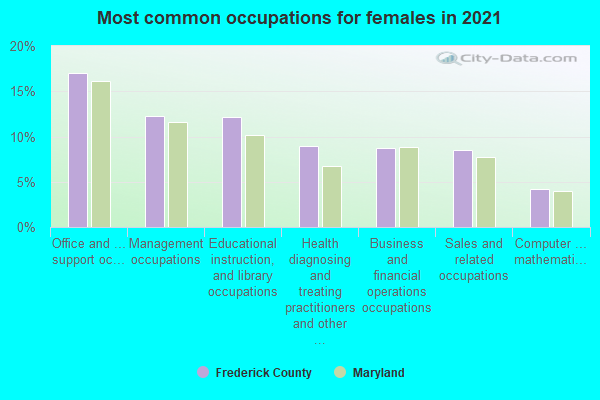
- Management occupations (13%)
- Office and administrative support occupations (13%)
- Educational instruction, and library occupations (11%)
- Business and financial operations occupations (11%)
- Sales and related occupations (7%)
- Health diagnosing and treating practitioners and other technical occupations (7%)
- Computer and mathematical occupations (5%)
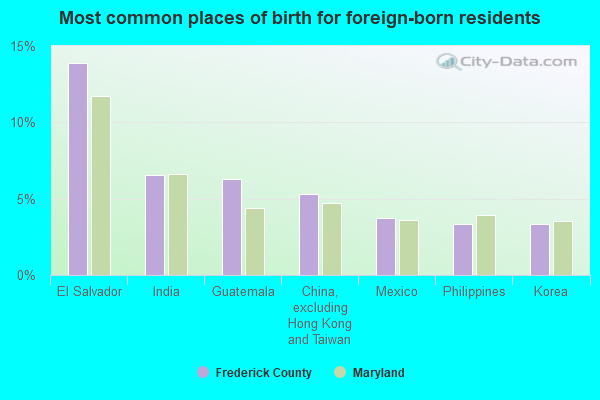
- El Salvador (13%)
- India (8%)
- Guatemala (5%)
- China, excluding Hong Kong and Taiwan (4%)
- Mexico (4%)
- Ghana (4%)
- Philippines (3%)
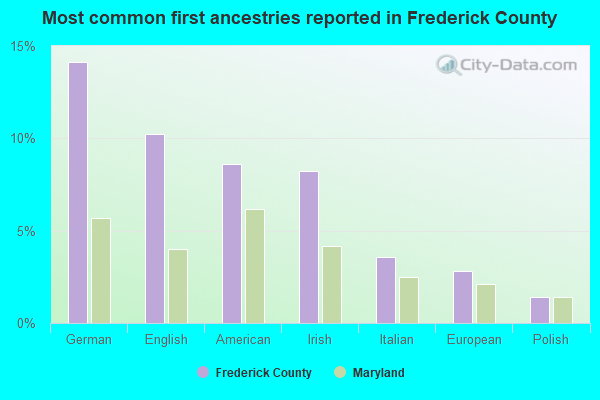
- German (14%)
- English (10%)
- American (8%)
- Irish (8%)
- Italian (3%)
- European (3%)
- Polish (2%)
People in group quarters in Frederick County, Maryland in 2010:
- 1,837 people in college/university student housing
- 1,093 people in nursing facilities/skilled-nursing facilities
- 430 people in local jails and other municipal confinement facilities
- 285 people in other noninstitutional facilities
- 183 people in military barracks and dormitories (nondisciplinary)
- 87 people in residential treatment centers for adults
- 61 people in group homes intended for adults
- 54 people in correctional facilities intended for juveniles
- 49 people in residential treatment centers for juveniles (non-correctional)
- 48 people in emergency and transitional shelters (with sleeping facilities) for people experiencing homelessness
- 41 people in workers' group living quarters and job corps centers
- 13 people in group homes for juveniles (non-correctional)
People in group quarters in Frederick County, Maryland in 2000:
- 1,690 people in college dormitories (includes college quarters off campus)
- 1,283 people in nursing homes
- 396 people in local jails and other confinement facilities (including police lockups)
- 254 people in military barracks, etc.
- 211 people in training schools for juvenile delinquents
- 208 people in religious group quarters
- 208 people in other noninstitutional group quarters
- 152 people in homes or halfway houses for drug/alcohol abuse
- 150 people in homes for the mentally retarded
- 48 people in residential treatment centers for emotionally disturbed children
- 25 people in homes for abused, dependent, and neglected children
- 14 people in agriculture workers' dormitories on farms
- 9 people in homes for the physically handicapped
- 7 people in homes for the mentally ill
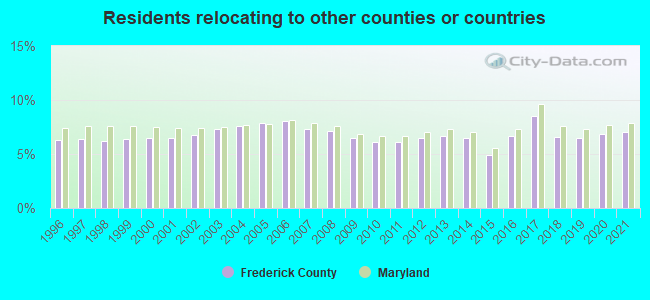
8.94% of this county's 2021 resident taxpayers lived in other counties in 2020 ($83,001 average adjusted gross income)
| Here: | 8.94% |
| Maryland average: | 7.42% |
0.06% of residents moved from foreign countries ($513 average AGI)
Frederick County: 0.06% Maryland average: 0.05%
5.39% relocated from other counties in Maryland ($50,510 average AGI)
3.50% relocated from other states ($31,979 average AGI)
Frederick County: 3.50% Maryland average: 3.41%

Top counties from which taxpayers relocated into this county between 2020 and 2021:
| from Montgomery County, MD | |
| from Howard County, MD | |
| from Washington County, MD | |
| from Carroll County, MD | |
| from Anne Arundel County, MD | |
| from Prince George's County, MD | |
| from Baltimore County, MD |
7.01% of this county's 2020 resident taxpayers moved to other counties in 2021 ($77,350 average adjusted gross income)
| Here: | 7.01% |
| Maryland average: | 7.91% |
0.03% of residents moved to foreign countries ($420 average AGI)
Frederick County: 0.03% Maryland average: 0.04%
3.03% relocated to other counties in Maryland ($29,351 average AGI)
3.95% relocated to other states ($47,579 average AGI)
Frederick County: 3.95% Maryland average: 3.93%
Top counties to which taxpayers relocated from this county between 2020 and 2021:
| to Washington County, MD | |
| to Montgomery County, MD | |
| to Carroll County, MD | |
| to Berkeley County, WV | |
| to Howard County, MD | |
| to Baltimore County, MD | |
| to Anne Arundel County, MD |
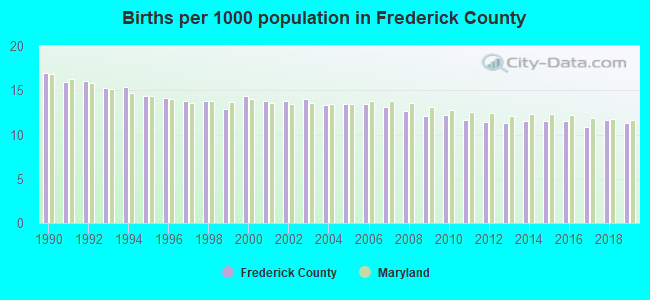
Births per 1000 population from 1990 to 1999: 14.9
Births per 1000 population from 2000 to 2009: 13.4
Births per 1000 population from 2010 to 2022: 9.7
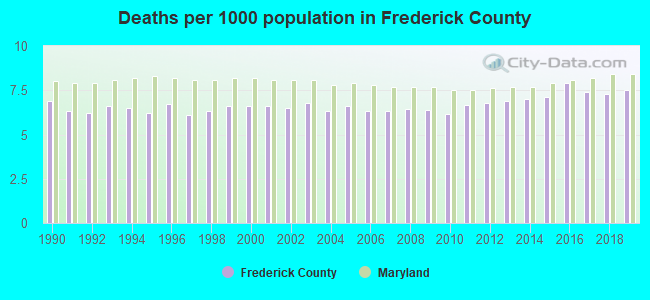
Deaths per 1000 population from 1990 to 1999: 6.4
Deaths per 1000 population from 2000 to 2009: 6.5
Deaths per 1000 population from 2010 to 2020: 7.2
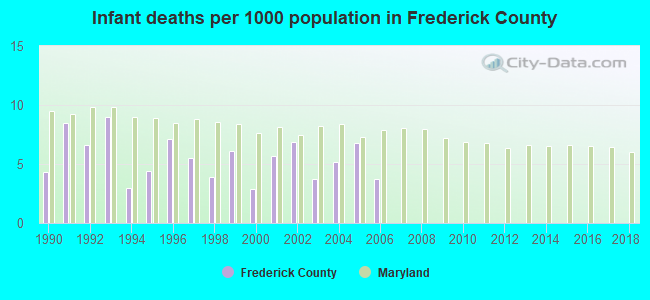
Infant deaths per 1000 live births from 1990 to 1999: 5.8
Infant deaths per 1000 live births from 2000 to 2006: 5.0
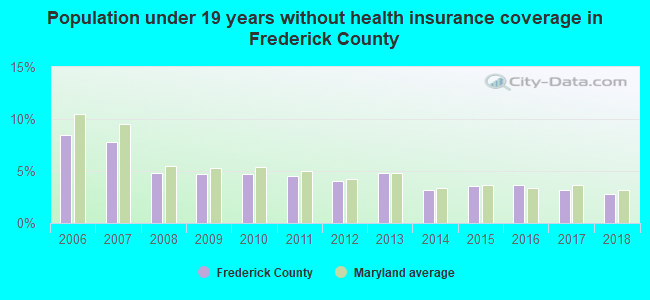
Persons under 19 years old without health insurance coverage in 2018: 2.8%
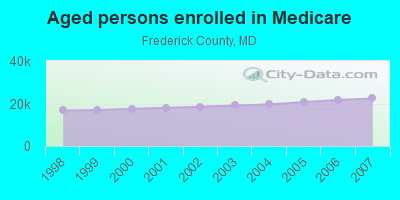
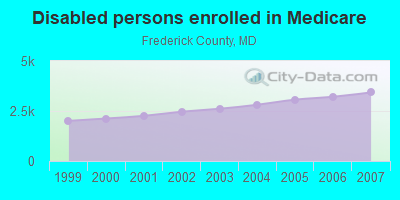
Persons enrolled in hospital insurance and/or supplemental medical insurance (Medicare) in July 1, 2007: 25,815 (22,386 aged, 3,429 disabled)
Children under 18 without health insurance coverage in 2007: 3,262 (5%)

Most common underlying causes of death in Frederick County, Maryland in 1999 - 2019:
- Atherosclerotic heart disease (1,937)
- Bronchus or lung, unspecified - Malignant neoplasms (1,885)
- Atherosclerotic cardiovascular disease, so described (1,666)
- Acute myocardial infarction, unspecified (1,622)
- Unspecified dementia (1,524)
- Chronic obstructive pulmonary disease, unspecified (1,270)
- Stroke, not specified as haemorrhage or infarction (1,112)
- Pneumonia, unspecified (803)
- Alzheimer disease, unspecified (789)
- Congestive heart failure (670)
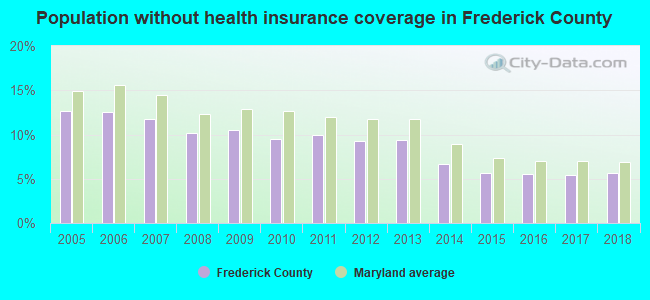
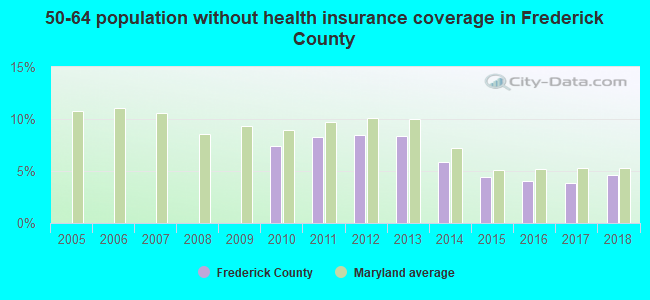
Population without health insurance coverage in 2000: 8%
Children under 18 without health insurance coverage in 2000: 7%
Short term general hospital admissions per 100,000 population in 2004: 7,054
Short term general hospital beds per 100,000 population in 2004: 92
Emergency room visits per 100,000 population in 2004: 26,578
General practice office based MDs per 100,000 population in 2005: 1,352
Medical specialist MDs per 100,000 population in 2005: 686
Dentists per 100,000 population in 1998: 19
Total births per 100,000 population, July 2005 - July 2006 : 55
Total deaths per 100,000 population, July 2005 - July 2006: 80
Limited-service eating places per 100,000 population in 2005 : 14
Beer, wine & liquor stores per 100,000 population in 2005: 1
Homicides per 1,000,000 population from 2000 to 2006: 22.3. This is less than state average.
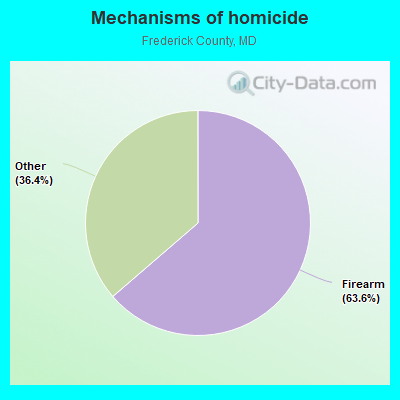
- Firearm - 14.2
- Other - 8.1
Suicides per 1,000,000 population from 2000 to 2006: 95.5. This is more than state average.
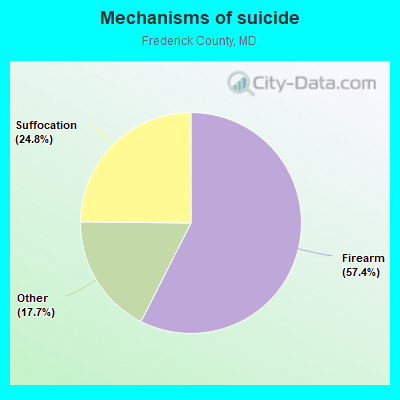
- Firearm - 54.9
- Suffocation - 23.7
- Other - 16.9
Household type by relationship:
Households: 287,079- Male householders: 54,801 (9,156 living alone), Female householders: 50,111 (12,990 living alone)
61,268 spouses (60,201 opposite-sex spouses), 6,896 unmarried partners, (6,522 opposite-sex unmarried partners), 87,837 children (81,892 natural, 1,114 adopted, 4,831 stepchildren), 4,039 grandchildren, 2,242 brothers or sisters, 4,082 parents, 0 foster children, 4,385 other relatives, 6,957 non-relatives
- In group quarters: 4,461
Size of family households: 29,656 2-persons, 17,218 3-persons, 16,571 4-persons, 8,897 5-persons, 2,971 6-persons, 1,034 7-or-more-persons.
Size of nonfamily households: 22,146 1-person, 5,077 2-persons, 1,113 3-persons, 229 4-persons.
51,953 married couples with children.
10,134 single-parent households (2,293 men, 7,841 women).
83.5% of residents of Frederick speak English at home.
7.8% of residents speak Spanish at home (61% speak English very well, 22% speak English well, 13% speak English not well, 4% don't speak English at all).
3.5% of residents speak other Indo-European language at home (78% speak English very well, 17% speak English well, 4% speak English not well, 1% don't speak English at all).
3.1% of residents speak Asian or Pacific Island language at home (65% speak English very well, 24% speak English well, 9% speak English not well, 2% don't speak English at all).
1.5% of residents speak other language at home (84% speak English very well, 10% speak English well, 2% speak English not well, 4% don't speak English at all).
In fiscal year 2004:
Federal Government expenditure: $1,947,083,000 ($8,946 per capita)
Department of Defense expenditure: $479,193,000
Federal direct payments to individuals for retirement and disability: $473,135,000
Federal other direct payments to individuals: $130,066,000
Federal direct payments not to individuals: $6,878,000
Federal grants: $329,038,000
Federal procurement contracts: $775,537,000 ($296,725,000 Department of Defense)
Federal salaries and wages: $232,429,000 ($121,229,000 Department of Defense)
Federal Government direct loans: $4,802,000
Federal guaranteed/insured loans: $326,891,000
Federal Government insurance: $66,006,000
Population change from April 1, 2000 to July 1, 2005:
Births: 15,705| Here: | 71 per 1000 residents |
| State: | 71 per 1000 residents |
Deaths: 7,253
| Here: | 33 per 1000 residents |
| State: | 41 per 1000 residents |
Net international migration: +1,610
| Here: | +7 per 1000 residents |
| State: | +19 per 1000 residents |
Net internal migration: +15,645
| Here: | +71 per 1000 residents |
| State: | +2 per 1000 residents |
Total withdrawal of fresh water for public supply: 15.18 millions of gallons per day (21% from ground, 79% from surface)
| Here: | 7.6 |
| State: | 7.3 |
| Here: | 4.7 |
| State: | 4.2 |
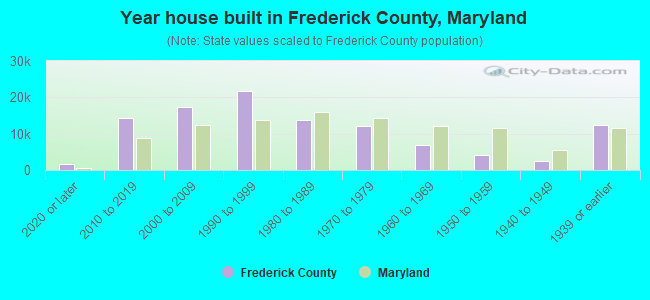
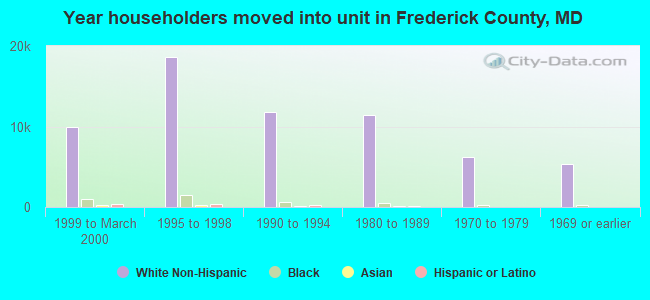
- Year house built in Frederick County, Maryland
- 3,7752020 or later
- 14,4032010 to 2019
- 17,3452000 to 2009
- 22,9171990 to 1999
- 14,6251980 to 1989
- 9,8901970 to 1979
- 5,8951960 to 1969
- 5,1161950 to 1959
- 2,0661940 to 1949
- 12,9641939 or earlier
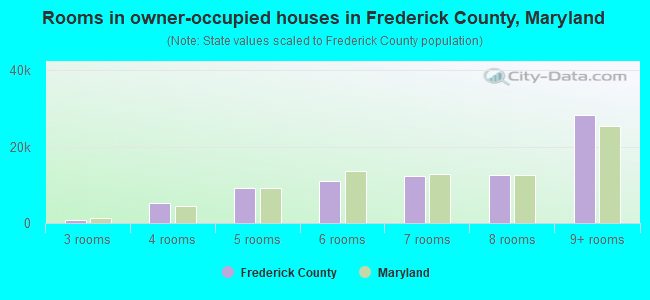
- Rooms in owner-occupied houses in Frederick County, Maryland
- 441 room
- 632 rooms
- 9113 rooms
- 2,9964 rooms
- 7,8555 rooms
- 14,0206 rooms
- 12,6087 rooms
- 12,8148 rooms
- 28,0219+ rooms
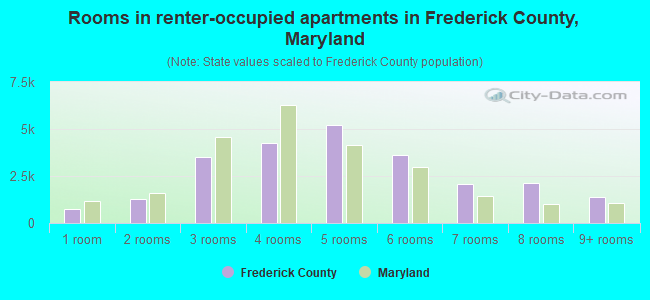
- Rooms in renter-occupied apartments in Frederick County, Maryland
- 8721 room
- 1,3782 rooms
- 3,4053 rooms
- 5,9264 rooms
- 5,3285 rooms
- 3,5126 rooms
- 1,1457 rooms
- 2,5438 rooms
- 1,4719+ rooms
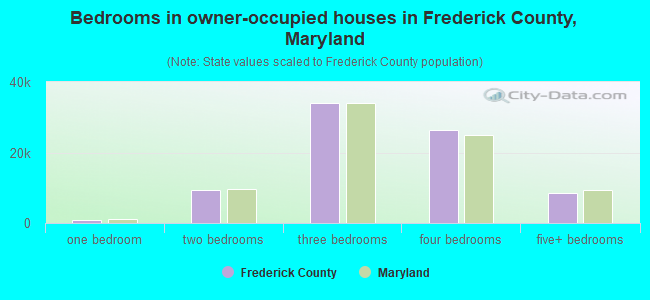
- Bedrooms in owner-occupied houses in Frederick County, Maryland
- 44no bedroom
- 5731 bedroom
- 6,7052 bedrooms
- 33,6113 bedrooms
- 28,1564 bedrooms
- 10,2435+ bedrooms
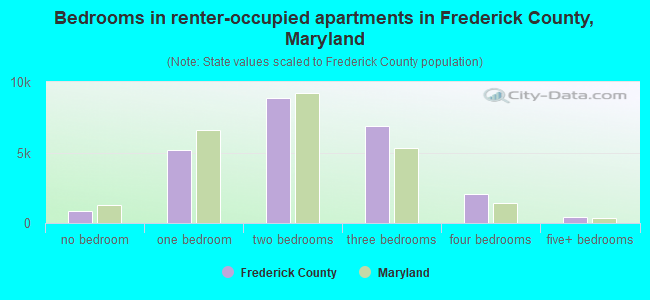
- Bedrooms in renter-occupied apartments in Frederick County, Maryland
- 922no bedroom
- 5,1931 bedroom
- 8,9702 bedrooms
- 7,0323 bedrooms
- 2,5194 bedrooms
- 9445+ bedrooms
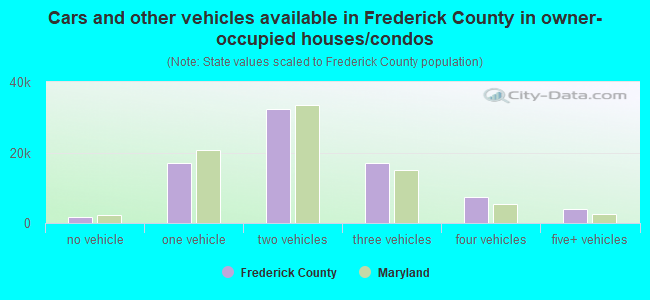
- Cars and other vehicles available in Frederick County in owner-occupied houses/condos
- 1,114no vehicle
- 14,5991 vehicle
- 33,4822 vehicles
- 18,1343 vehicles
- 7,7784 vehicles
- 4,2255+ vehicles
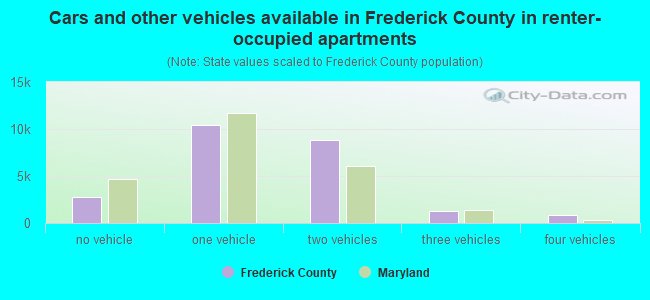
- Cars and other vehicles available in Frederick County in renter-occupied apartments
- 3,575no vehicle
- 11,7191 vehicle
- 6,7312 vehicles
- 2,9863 vehicles
- 3554 vehicles
- 2145+ vehicles
88.6% of Frederick County residents lived in the same house 1 years ago.
Out of people who lived in different houses, 31% lived in this county.
Out of people who lived in different counties, 64% lived in Maryland.
| Frederick County: | 88.6% |
| State average: | 88.5% |
Place of birth for U.S.-born residents:
- This state: 135,526
- Other state: 106,969
- Northeast: 36,685
- Midwest: 15,728
- South: 43,504
- West: 11,052
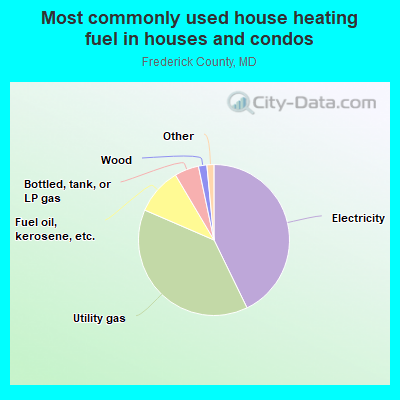
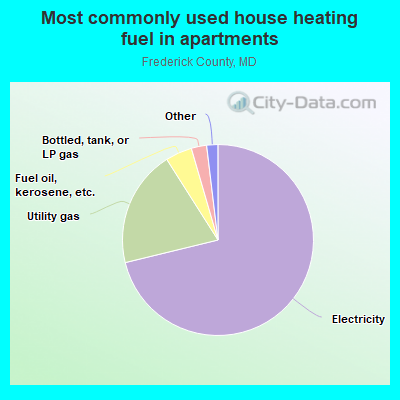
- 46.0%Electricity
- 37.3%Utility gas
- 9.7%Fuel oil, kerosene, etc.
- 4.0%Bottled, tank, or LP gas
- 1.8%Wood
- 0.5%Solar energy
- 0.3%Other fuel
- 0.2%Coal or coke
- 0.2%No fuel used
- 71.0%Electricity
- 20.4%Utility gas
- 5.8%Fuel oil, kerosene, etc.
- 1.5%Bottled, tank, or LP gas
- 0.7%Wood
- 0.2%No fuel used
- 0.2%Other fuel
- 0.1%Solar energy
Private vs. public school enrollment:
| Here: | 9.9% |
| Maryland: | 15.2% |
| Here: | 15.4% |
| Maryland: | 14.4% |
| Here: | 31.4% |
| Maryland: | 20.2% |
Frederick County government finances - Expenditure in 2020:
- Bond Funds - Cash and Securities: $160,163,000
Cash and Securities: $108,364,000
- Charges - Other: $106,468,000
Other: $92,046,000
Solid Waste Management: $27,714,000
Solid Waste Management: $25,839,000
Higher Education - Other: $19,539,000
Higher Education - Other: $18,314,000
Sewerage: $17,732,000
Sewerage: $14,854,000
Elementary and Secondary Education School Lunch: $4,745,000
Elementary and Secondary Education School Lunch: $3,825,000
Higher Education Auxiliary Enterprises: $3,701,000
Higher Education Auxiliary Enterprises: $2,493,000
Parks and Recreation: $1,626,000
Parks and Recreation: $1,270,000
Elementary and Secondary Education - Other: $502,000
Regular Highways: $384,000
Regular Highways: $306,000
Elementary and Secondary Education School Tuition and Transportation: $148,000
Elementary and Secondary Education School Tuition and Transportation: $119,000
- Construction - Elementary and Secondary Education: $107,716,000
Elementary and Secondary Education: $86,083,000
Other Higher Education: $8,385,000
Other Higher Education: $1,516,000
- Current Operations - Elementary and Secondary Education: $565,608,000
Elementary and Secondary Education: $516,357,000
Local Fire Protection: $71,978,000
Local Fire Protection: $69,056,000
Regular Highways: $49,078,000
General - Other: $48,934,000
Other Higher Education: $48,637,000
Other Higher Education: $48,523,000
Regular Highways: $47,770,000
Health - Other: $39,918,000
Health - Other: $39,163,000
General - Other: $37,685,000
Police Protection: $31,430,000
Police Protection: $29,798,000
Solid Waste Management: $26,752,000
Water Utilities: $26,418,000
Parks and Recreation: $26,246,000
Solid Waste Management: $24,946,000
Sewerage: $20,522,000
Sewerage: $20,197,000
Water Utilities: $19,089,000
Natural Resources - Other: $18,658,000
Financial Administration: $17,083,000
Parks and Recreation: $17,063,000
Correctional Institutions: $16,622,000
Financial Administration: $16,083,000
Correctional Institutions: $14,413,000
Natural Resources - Other: $12,602,000
Judicial and Legal Services: $11,918,000
Judicial and Legal Services: $11,541,000
Central Staff Services: $10,041,000
Central Staff Services: $9,119,000
General Public Buildings: $9,115,000
General Public Buildings: $8,826,000
Housing and Community Development: $8,694,000
Housing and Community Development: $8,592,000
Transit Utilities: $8,043,000
Transit Utilities: $7,451,000
Corrections - Other: $4,169,000
Higher Education Auxiliary Enterprises: $3,838,000
Corrections - Other: $3,729,000
Higher Education Auxiliary Enterprises: $2,781,000
Protective Inspection and Regulation - Other: $1,084,000
Protective Inspection and Regulation - Other: $1,020,000
Air Transportation: $133,000
Air Transportation: $105,000
Electric Utilities: $14,000
Gas Utilities: $14,000
- Federal Intergovernmental - Other: $13,038,000
Other: $9,899,000
Housing and Community Development: $7,527,000
Housing and Community Development: $7,275,000
Transit Utilities: $4,174,000
Education: $3,997,000
Education: $3,907,000
Transit Utilities: $3,418,000
Highways: $2,229,000
Health and Hospitals: $2,059,000
Health and Hospitals: $649,000
Highways: $507,000
Natural Resources: $328,000
Natural Resources: $157,000
General Local Government Support: $65,000
General Local Government Support: $62,000
Sewerage: $18,000
Water Utilities: $14,000
- General - Interest on Debt: $38,795,000
Interest on Debt: $35,467,000
- Intergovernmental to Local - Other - Libraries: $11,778,000
Other - Libraries: $11,354,000
Other - Elementary and Secondary Education: $10,869,000
Other - Elementary and Secondary Education: $9,745,000
Other - General - Other: $4,955,000
Other - General - Other: $4,495,000
- Local Intergovernmental - Education: $4,836,000
Education: $1,885,000
- Long Term Debt - Outstanding Unspecified Public Purpose: $764,457,000
Beginning Outstanding - Unspecified Public Purpose: $719,804,000
Beginning Outstanding - Unspecified Public Purpose: $712,476,000
Outstanding Unspecified Public Purpose: $677,163,000
Retired Unspecified Public Purpose: $186,159,000
Issue, Unspecified Public Purpose: $150,845,000
Issue, Unspecified Public Purpose: $140,513,000
Retired Unspecified Public Purpose: $95,859,000
- Miscellaneous - General Revenue - Other: $20,337,000
Interest Earnings: $14,803,000
General Revenue - Other: $12,763,000
Interest Earnings: $5,513,000
Rents: $1,653,000
Rents: $1,577,000
Fines and Forfeits: $310,000
Fines and Forfeits: $245,000
Sale of Property: $39,000
Special Assessments: $1,000
Special Assessments: $1,000
- Other Capital Outlay - Elementary and Secondary Education: $8,195,000
Elementary and Secondary Education: $4,890,000
General - Other: $860,000
Other Higher Education: $729,000
Other Higher Education: $573,000
General - Other: $520,000
Regular Highways: $424,000
Local Fire Protection: $349,000
Local Fire Protection: $86,000
Correctional Institutions: $67,000
Police Protection: $60,000
Health - Other: $37,000
Central Staff Services: $4,000
Higher Education - Auxiliary Enterprises: $3,000
- Other Funds - Cash and Securities: $466,146,000
Cash and Securities: $371,822,000
- Revenue - Water Utilities: $23,590,000
Water Utilities: $22,003,000
Transit Utilities: $621,000
Transit Utilities: $463,000
- Short Term Debt Outstanding - End of Fiscal Year: $295,000
End of Fiscal Year: $285,000
Beginning: $285,000
Beginning: $275,000
- Sinking Funds - Cash and Securities: $71,670,000
Cash and Securities: $1,101,000
- State Intergovernmental - Education: $314,466,000
Education: $286,618,000
Other: $11,477,000
Other: $9,435,000
Highways: $2,356,000
Highways: $1,960,000
Transit Utilities: $1,452,000
Transit Utilities: $1,361,000
Health and Hospitals: $240,000
Housing and Community Development: $211,000
General Local Government Support: $168,000
General Local Government Support: $130,000
Housing and Community Development: $84,000
Health and Hospitals: $82,000
- Tax - Property: $431,163,000
Property: $384,563,000
Individual Income: $246,930,000
Individual Income: $217,211,000
Documentary and Stock Transfer: $43,675,000
Documentary and Stock Transfer: $37,477,000
Other License: $6,061,000
Other License: $5,250,000
Other Selective Sales: $2,784,000
Other Selective Sales: $2,137,000
Alcoholic Beverage License: $406,000
Alcoholic Beverage License: $334,000
Occupation and Business License - Other: $214,000
Occupation and Business License - Other: $169,000
- Total Salaries and Wages: $476,332,000
: $400,786,000
Frederick County government finances - Revenue in 2020:
- Bond Funds - Cash and Securities: $160,163,000
Cash and Securities: $108,364,000
- Charges - Other: $106,468,000
Other: $92,046,000
Solid Waste Management: $27,714,000
Solid Waste Management: $25,839,000
Higher Education - Other: $19,539,000
Higher Education - Other: $18,314,000
Sewerage: $17,732,000
Sewerage: $14,854,000
Elementary and Secondary Education School Lunch: $4,745,000
Elementary and Secondary Education School Lunch: $3,825,000
Higher Education Auxiliary Enterprises: $3,701,000
Higher Education Auxiliary Enterprises: $2,493,000
Parks and Recreation: $1,626,000
Parks and Recreation: $1,270,000
Elementary and Secondary Education - Other: $502,000
Regular Highways: $384,000
Regular Highways: $306,000
Elementary and Secondary Education School Tuition and Transportation: $148,000
Elementary and Secondary Education School Tuition and Transportation: $119,000
- Construction - Elementary and Secondary Education: $107,716,000
Elementary and Secondary Education: $86,083,000
Other Higher Education: $8,385,000
Other Higher Education: $1,516,000
- Current Operations - Elementary and Secondary Education: $565,608,000
Elementary and Secondary Education: $516,357,000
Local Fire Protection: $71,978,000
Local Fire Protection: $69,056,000
Regular Highways: $49,078,000
General - Other: $48,934,000
Other Higher Education: $48,637,000
Other Higher Education: $48,523,000
Regular Highways: $47,770,000
Health - Other: $39,918,000
Health - Other: $39,163,000
General - Other: $37,685,000
Police Protection: $31,430,000
Police Protection: $29,798,000
Solid Waste Management: $26,752,000
Water Utilities: $26,418,000
Parks and Recreation: $26,246,000
Solid Waste Management: $24,946,000
Sewerage: $20,522,000
Sewerage: $20,197,000
Water Utilities: $19,089,000
Natural Resources - Other: $18,658,000
Financial Administration: $17,083,000
Parks and Recreation: $17,063,000
Correctional Institutions: $16,622,000
Financial Administration: $16,083,000
Correctional Institutions: $14,413,000
Natural Resources - Other: $12,602,000
Judicial and Legal Services: $11,918,000
Judicial and Legal Services: $11,541,000
Central Staff Services: $10,041,000
Central Staff Services: $9,119,000
General Public Buildings: $9,115,000
General Public Buildings: $8,826,000
Housing and Community Development: $8,694,000
Housing and Community Development: $8,592,000
Transit Utilities: $8,043,000
Transit Utilities: $7,451,000
Corrections - Other: $4,169,000
Higher Education Auxiliary Enterprises: $3,838,000
Corrections - Other: $3,729,000
Higher Education Auxiliary Enterprises: $2,781,000
Protective Inspection and Regulation - Other: $1,084,000
Protective Inspection and Regulation - Other: $1,020,000
Air Transportation: $133,000
Air Transportation: $105,000
Electric Utilities: $14,000
Gas Utilities: $14,000
- Federal Intergovernmental - Other: $13,038,000
Other: $9,899,000
Housing and Community Development: $7,527,000
Housing and Community Development: $7,275,000
Transit Utilities: $4,174,000
Education: $3,997,000
Education: $3,907,000
Transit Utilities: $3,418,000
Highways: $2,229,000
Health and Hospitals: $2,059,000
Health and Hospitals: $649,000
Highways: $507,000
Natural Resources: $328,000
Natural Resources: $157,000
General Local Government Support: $65,000
General Local Government Support: $62,000
Sewerage: $18,000
Water Utilities: $14,000
- General - Interest on Debt: $38,795,000
Interest on Debt: $35,467,000
- Intergovernmental to Local - Other - Libraries: $11,778,000
Other - Libraries: $11,354,000
Other - Elementary and Secondary Education: $10,869,000
Other - Elementary and Secondary Education: $9,745,000
Other - General - Other: $4,955,000
Other - General - Other: $4,495,000
- Local Intergovernmental - Education: $4,836,000
Education: $1,885,000
- Long Term Debt - Outstanding Unspecified Public Purpose: $764,457,000
Beginning Outstanding - Unspecified Public Purpose: $719,804,000
Beginning Outstanding - Unspecified Public Purpose: $712,476,000
Outstanding Unspecified Public Purpose: $677,163,000
Retired Unspecified Public Purpose: $186,159,000
Issue, Unspecified Public Purpose: $150,845,000
Issue, Unspecified Public Purpose: $140,513,000
Retired Unspecified Public Purpose: $95,859,000
- Miscellaneous - General Revenue - Other: $20,337,000
Interest Earnings: $14,803,000
General Revenue - Other: $12,763,000
Interest Earnings: $5,513,000
Rents: $1,653,000
Rents: $1,577,000
Fines and Forfeits: $310,000
Fines and Forfeits: $245,000
Sale of Property: $39,000
Special Assessments: $1,000
Special Assessments: $1,000
- Other Capital Outlay - Elementary and Secondary Education: $8,195,000
Elementary and Secondary Education: $4,890,000
General - Other: $860,000
Other Higher Education: $729,000
Other Higher Education: $573,000
General - Other: $520,000
Regular Highways: $424,000
Local Fire Protection: $349,000
Local Fire Protection: $86,000
Correctional Institutions: $67,000
Police Protection: $60,000
Health - Other: $37,000
Central Staff Services: $4,000
Higher Education - Auxiliary Enterprises: $3,000
- Other Funds - Cash and Securities: $466,146,000
Cash and Securities: $371,822,000
- Revenue - Water Utilities: $23,590,000
Water Utilities: $22,003,000
Transit Utilities: $621,000
Transit Utilities: $463,000
- Short Term Debt Outstanding - End of Fiscal Year: $295,000
End of Fiscal Year: $285,000
Beginning: $285,000
Beginning: $275,000
- Sinking Funds - Cash and Securities: $71,670,000
Cash and Securities: $1,101,000
- State Intergovernmental - Education: $314,466,000
Education: $286,618,000
Other: $11,477,000
Other: $9,435,000
Highways: $2,356,000
Highways: $1,960,000
Transit Utilities: $1,452,000
Transit Utilities: $1,361,000
Health and Hospitals: $240,000
Housing and Community Development: $211,000
General Local Government Support: $168,000
General Local Government Support: $130,000
Housing and Community Development: $84,000
Health and Hospitals: $82,000
- Tax - Property: $431,163,000
Property: $384,563,000
Individual Income: $246,930,000
Individual Income: $217,211,000
Documentary and Stock Transfer: $43,675,000
Documentary and Stock Transfer: $37,477,000
Other License: $6,061,000
Other License: $5,250,000
Other Selective Sales: $2,784,000
Other Selective Sales: $2,137,000
Alcoholic Beverage License: $406,000
Alcoholic Beverage License: $334,000
Occupation and Business License - Other: $214,000
Occupation and Business License - Other: $169,000
- Total Salaries and Wages: $476,332,000
: $400,786,000
Frederick County government finances - Debt in 2020:
- Bond Funds - Cash and Securities: $160,163,000
Cash and Securities: $108,364,000
- Charges - Other: $106,468,000
Other: $92,046,000
Solid Waste Management: $27,714,000
Solid Waste Management: $25,839,000
Higher Education - Other: $19,539,000
Higher Education - Other: $18,314,000
Sewerage: $17,732,000
Sewerage: $14,854,000
Elementary and Secondary Education School Lunch: $4,745,000
Elementary and Secondary Education School Lunch: $3,825,000
Higher Education Auxiliary Enterprises: $3,701,000
Higher Education Auxiliary Enterprises: $2,493,000
Parks and Recreation: $1,626,000
Parks and Recreation: $1,270,000
Elementary and Secondary Education - Other: $502,000
Regular Highways: $384,000
Regular Highways: $306,000
Elementary and Secondary Education School Tuition and Transportation: $148,000
Elementary and Secondary Education School Tuition and Transportation: $119,000
- Construction - Elementary and Secondary Education: $107,716,000
Elementary and Secondary Education: $86,083,000
Other Higher Education: $8,385,000
Other Higher Education: $1,516,000
- Current Operations - Elementary and Secondary Education: $565,608,000
Elementary and Secondary Education: $516,357,000
Local Fire Protection: $71,978,000
Local Fire Protection: $69,056,000
Regular Highways: $49,078,000
General - Other: $48,934,000
Other Higher Education: $48,637,000
Other Higher Education: $48,523,000
Regular Highways: $47,770,000
Health - Other: $39,918,000
Health - Other: $39,163,000
General - Other: $37,685,000
Police Protection: $31,430,000
Police Protection: $29,798,000
Solid Waste Management: $26,752,000
Water Utilities: $26,418,000
Parks and Recreation: $26,246,000
Solid Waste Management: $24,946,000
Sewerage: $20,522,000
Sewerage: $20,197,000
Water Utilities: $19,089,000
Natural Resources - Other: $18,658,000
Financial Administration: $17,083,000
Parks and Recreation: $17,063,000
Correctional Institutions: $16,622,000
Financial Administration: $16,083,000
Correctional Institutions: $14,413,000
Natural Resources - Other: $12,602,000
Judicial and Legal Services: $11,918,000
Judicial and Legal Services: $11,541,000
Central Staff Services: $10,041,000
Central Staff Services: $9,119,000
General Public Buildings: $9,115,000
General Public Buildings: $8,826,000
Housing and Community Development: $8,694,000
Housing and Community Development: $8,592,000
Transit Utilities: $8,043,000
Transit Utilities: $7,451,000
Corrections - Other: $4,169,000
Higher Education Auxiliary Enterprises: $3,838,000
Corrections - Other: $3,729,000
Higher Education Auxiliary Enterprises: $2,781,000
Protective Inspection and Regulation - Other: $1,084,000
Protective Inspection and Regulation - Other: $1,020,000
Air Transportation: $133,000
Air Transportation: $105,000
Electric Utilities: $14,000
Gas Utilities: $14,000
- Federal Intergovernmental - Other: $13,038,000
Other: $9,899,000
Housing and Community Development: $7,527,000
Housing and Community Development: $7,275,000
Transit Utilities: $4,174,000
Education: $3,997,000
Education: $3,907,000
Transit Utilities: $3,418,000
Highways: $2,229,000
Health and Hospitals: $2,059,000
Health and Hospitals: $649,000
Highways: $507,000
Natural Resources: $328,000
Natural Resources: $157,000
General Local Government Support: $65,000
General Local Government Support: $62,000
Sewerage: $18,000
Water Utilities: $14,000
- General - Interest on Debt: $38,795,000
Interest on Debt: $35,467,000
- Intergovernmental to Local - Other - Libraries: $11,778,000
Other - Libraries: $11,354,000
Other - Elementary and Secondary Education: $10,869,000
Other - Elementary and Secondary Education: $9,745,000
Other - General - Other: $4,955,000
Other - General - Other: $4,495,000
- Local Intergovernmental - Education: $4,836,000
Education: $1,885,000
- Long Term Debt - Outstanding Unspecified Public Purpose: $764,457,000
Beginning Outstanding - Unspecified Public Purpose: $719,804,000
Beginning Outstanding - Unspecified Public Purpose: $712,476,000
Outstanding Unspecified Public Purpose: $677,163,000
Retired Unspecified Public Purpose: $186,159,000
Issue, Unspecified Public Purpose: $150,845,000
Issue, Unspecified Public Purpose: $140,513,000
Retired Unspecified Public Purpose: $95,859,000
- Miscellaneous - General Revenue - Other: $20,337,000
Interest Earnings: $14,803,000
General Revenue - Other: $12,763,000
Interest Earnings: $5,513,000
Rents: $1,653,000
Rents: $1,577,000
Fines and Forfeits: $310,000
Fines and Forfeits: $245,000
Sale of Property: $39,000
Special Assessments: $1,000
Special Assessments: $1,000
- Other Capital Outlay - Elementary and Secondary Education: $8,195,000
Elementary and Secondary Education: $4,890,000
General - Other: $860,000
Other Higher Education: $729,000
Other Higher Education: $573,000
General - Other: $520,000
Regular Highways: $424,000
Local Fire Protection: $349,000
Local Fire Protection: $86,000
Correctional Institutions: $67,000
Police Protection: $60,000
Health - Other: $37,000
Central Staff Services: $4,000
Higher Education - Auxiliary Enterprises: $3,000
- Other Funds - Cash and Securities: $466,146,000
Cash and Securities: $371,822,000
- Revenue - Water Utilities: $23,590,000
Water Utilities: $22,003,000
Transit Utilities: $621,000
Transit Utilities: $463,000
- Short Term Debt Outstanding - End of Fiscal Year: $295,000
End of Fiscal Year: $285,000
Beginning: $285,000
Beginning: $275,000
- Sinking Funds - Cash and Securities: $71,670,000
Cash and Securities: $1,101,000
- State Intergovernmental - Education: $314,466,000
Education: $286,618,000
Other: $11,477,000
Other: $9,435,000
Highways: $2,356,000
Highways: $1,960,000
Transit Utilities: $1,452,000
Transit Utilities: $1,361,000
Health and Hospitals: $240,000
Housing and Community Development: $211,000
General Local Government Support: $168,000
General Local Government Support: $130,000
Housing and Community Development: $84,000
Health and Hospitals: $82,000
- Tax - Property: $431,163,000
Property: $384,563,000
Individual Income: $246,930,000
Individual Income: $217,211,000
Documentary and Stock Transfer: $43,675,000
Documentary and Stock Transfer: $37,477,000
Other License: $6,061,000
Other License: $5,250,000
Other Selective Sales: $2,784,000
Other Selective Sales: $2,137,000
Alcoholic Beverage License: $406,000
Alcoholic Beverage License: $334,000
Occupation and Business License - Other: $214,000
Occupation and Business License - Other: $169,000
- Total Salaries and Wages: $476,332,000
: $400,786,000
Frederick County government finances - Cash and Securities in 2020:
- Bond Funds - Cash and Securities: $160,163,000
Cash and Securities: $108,364,000
- Charges - Other: $106,468,000
Other: $92,046,000
Solid Waste Management: $27,714,000
Solid Waste Management: $25,839,000
Higher Education - Other: $19,539,000
Higher Education - Other: $18,314,000
Sewerage: $17,732,000
Sewerage: $14,854,000
Elementary and Secondary Education School Lunch: $4,745,000
Elementary and Secondary Education School Lunch: $3,825,000
Higher Education Auxiliary Enterprises: $3,701,000
Higher Education Auxiliary Enterprises: $2,493,000
Parks and Recreation: $1,626,000
Parks and Recreation: $1,270,000
Elementary and Secondary Education - Other: $502,000
Regular Highways: $384,000
Regular Highways: $306,000
Elementary and Secondary Education School Tuition and Transportation: $148,000
Elementary and Secondary Education School Tuition and Transportation: $119,000
- Construction - Elementary and Secondary Education: $107,716,000
Elementary and Secondary Education: $86,083,000
Other Higher Education: $8,385,000
Other Higher Education: $1,516,000
- Current Operations - Elementary and Secondary Education: $565,608,000
Elementary and Secondary Education: $516,357,000
Local Fire Protection: $71,978,000
Local Fire Protection: $69,056,000
Regular Highways: $49,078,000
General - Other: $48,934,000
Other Higher Education: $48,637,000
Other Higher Education: $48,523,000
Regular Highways: $47,770,000
Health - Other: $39,918,000
Health - Other: $39,163,000
General - Other: $37,685,000
Police Protection: $31,430,000
Police Protection: $29,798,000
Solid Waste Management: $26,752,000
Water Utilities: $26,418,000
Parks and Recreation: $26,246,000
Solid Waste Management: $24,946,000
Sewerage: $20,522,000
Sewerage: $20,197,000
Water Utilities: $19,089,000
Natural Resources - Other: $18,658,000
Financial Administration: $17,083,000
Parks and Recreation: $17,063,000
Correctional Institutions: $16,622,000
Financial Administration: $16,083,000
Correctional Institutions: $14,413,000
Natural Resources - Other: $12,602,000
Judicial and Legal Services: $11,918,000
Judicial and Legal Services: $11,541,000
Central Staff Services: $10,041,000
Central Staff Services: $9,119,000
General Public Buildings: $9,115,000
General Public Buildings: $8,826,000
Housing and Community Development: $8,694,000
Housing and Community Development: $8,592,000
Transit Utilities: $8,043,000
Transit Utilities: $7,451,000
Corrections - Other: $4,169,000
Higher Education Auxiliary Enterprises: $3,838,000
Corrections - Other: $3,729,000
Higher Education Auxiliary Enterprises: $2,781,000
Protective Inspection and Regulation - Other: $1,084,000
Protective Inspection and Regulation - Other: $1,020,000
Air Transportation: $133,000
Air Transportation: $105,000
Electric Utilities: $14,000
Gas Utilities: $14,000
- Federal Intergovernmental - Other: $13,038,000
Other: $9,899,000
Housing and Community Development: $7,527,000
Housing and Community Development: $7,275,000
Transit Utilities: $4,174,000
Education: $3,997,000
Education: $3,907,000
Transit Utilities: $3,418,000
Highways: $2,229,000
Health and Hospitals: $2,059,000
Health and Hospitals: $649,000
Highways: $507,000
Natural Resources: $328,000
Natural Resources: $157,000
General Local Government Support: $65,000
General Local Government Support: $62,000
Sewerage: $18,000
Water Utilities: $14,000
- General - Interest on Debt: $38,795,000
Interest on Debt: $35,467,000
- Intergovernmental to Local - Other - Libraries: $11,778,000
Other - Libraries: $11,354,000
Other - Elementary and Secondary Education: $10,869,000
Other - Elementary and Secondary Education: $9,745,000
Other - General - Other: $4,955,000
Other - General - Other: $4,495,000
- Local Intergovernmental - Education: $4,836,000
Education: $1,885,000
- Long Term Debt - Outstanding Unspecified Public Purpose: $764,457,000
Beginning Outstanding - Unspecified Public Purpose: $719,804,000
Beginning Outstanding - Unspecified Public Purpose: $712,476,000
Outstanding Unspecified Public Purpose: $677,163,000
Retired Unspecified Public Purpose: $186,159,000
Issue, Unspecified Public Purpose: $150,845,000
Issue, Unspecified Public Purpose: $140,513,000
Retired Unspecified Public Purpose: $95,859,000
- Miscellaneous - General Revenue - Other: $20,337,000
Interest Earnings: $14,803,000
General Revenue - Other: $12,763,000
Interest Earnings: $5,513,000
Rents: $1,653,000
Rents: $1,577,000
Fines and Forfeits: $310,000
Fines and Forfeits: $245,000
Sale of Property: $39,000
Special Assessments: $1,000
Special Assessments: $1,000
- Other Capital Outlay - Elementary and Secondary Education: $8,195,000
Elementary and Secondary Education: $4,890,000
General - Other: $860,000
Other Higher Education: $729,000
Other Higher Education: $573,000
General - Other: $520,000
Regular Highways: $424,000
Local Fire Protection: $349,000
Local Fire Protection: $86,000
Correctional Institutions: $67,000
Police Protection: $60,000
Health - Other: $37,000
Central Staff Services: $4,000
Higher Education - Auxiliary Enterprises: $3,000
- Other Funds - Cash and Securities: $466,146,000
Cash and Securities: $371,822,000
- Revenue - Water Utilities: $23,590,000
Water Utilities: $22,003,000
Transit Utilities: $621,000
Transit Utilities: $463,000
- Short Term Debt Outstanding - End of Fiscal Year: $295,000
End of Fiscal Year: $285,000
Beginning: $285,000
Beginning: $275,000
- Sinking Funds - Cash and Securities: $71,670,000
Cash and Securities: $1,101,000
- State Intergovernmental - Education: $314,466,000
Education: $286,618,000
Other: $11,477,000
Other: $9,435,000
Highways: $2,356,000
Highways: $1,960,000
Transit Utilities: $1,452,000
Transit Utilities: $1,361,000
Health and Hospitals: $240,000
Housing and Community Development: $211,000
General Local Government Support: $168,000
General Local Government Support: $130,000
Housing and Community Development: $84,000
Health and Hospitals: $82,000
- Tax - Property: $431,163,000
Property: $384,563,000
Individual Income: $246,930,000
Individual Income: $217,211,000
Documentary and Stock Transfer: $43,675,000
Documentary and Stock Transfer: $37,477,000
Other License: $6,061,000
Other License: $5,250,000
Other Selective Sales: $2,784,000
Other Selective Sales: $2,137,000
Alcoholic Beverage License: $406,000
Alcoholic Beverage License: $334,000
Occupation and Business License - Other: $214,000
Occupation and Business License - Other: $169,000
- Total Salaries and Wages: $476,332,000
: $400,786,000
Supplemental Security Income (SSI) in 2006:
- Total number of recipients: 1,619
- Number of aged recipients: 210
- Number of blind and disabled recipients: 1,409
- Number of recipients under 18: 209
- Number of recipients between 18 and 64: 1,073
- Number of recipients older than 64: 337
- Number of recipients also receiving OASDI: 575
- Amount of payments (thousands of dollars): 693
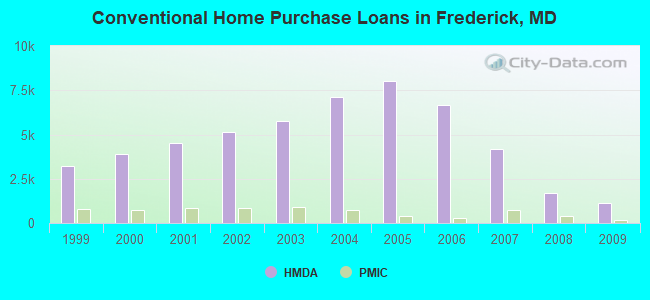
| Home Mortgage Disclosure Act Aggregated Statistics For Year 2009 (Based on 32 full tracts) | ||||||||||||||
| A) FHA, FSA/RHS & VA Home Purchase Loans | B) Conventional Home Purchase Loans | C) Refinancings | D) Home Improvement Loans | E) Loans on Dwellings For 5+ Families | F) Non-occupant Loans on < 5 Family Dwellings (A B C & D) | G) Loans On Manufactured Home Dwelling (A B C & D) | ||||||||
|---|---|---|---|---|---|---|---|---|---|---|---|---|---|---|
| Number | Average Value | Number | Average Value | Number | Average Value | Number | Average Value | Number | Average Value | Number | Average Value | Number | Average Value | |
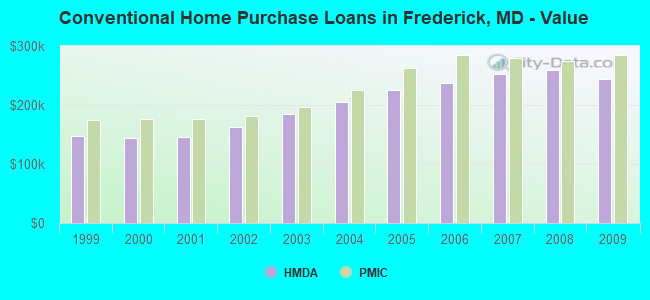
| LOANS ORIGINATED | 1,712 | $254,107 | 1,140 | $244,082 | 6,815 | $252,653 | 319 | $127,621 | 5 | $6,753,400 | 331 | $184,604 | 6 | $138,500 |
| APPLICATIONS APPROVED, NOT ACCEPTED | 71 | $256,197 | 76 | $301,487 | 537 | $261,574 | 45 | $58,889 | 0 | $0 | 34 | $219,000 | 4 | $152,500 |
| APPLICATIONS DENIED | 162 | $265,204 | 117 | $224,923 | 2,264 | $280,765 | 201 | $87,602 | 2 | $347,500 | 140 | $205,836 | 14 | $145,357 |
| APPLICATIONS WITHDRAWN | 211 | $255,052 | 148 | $246,480 | 1,594 | $275,199 | 61 | $160,328 | 2 | $645,000 | 65 | $209,138 | 1 | $179,000 |
| FILES CLOSED FOR INCOMPLETENESS | 29 | $254,931 | 23 | $230,913 | 365 | $272,644 | 9 | $77,778 | 0 | $0 | 27 | $239,889 | 0 | $0 |
| Private Mortgage Insurance Companies Aggregated Statistics For Year 2009 (Based on 31 full tracts) | ||||
| A) Conventional Home Purchase Loans | B) Refinancings | |||
|---|---|---|---|---|
| Number | Average Value | Number | Average Value | |
| LOANS ORIGINATED | 160 | $284,100 | 126 | $307,929 |
| APPLICATIONS APPROVED, NOT ACCEPTED | 56 | $343,643 | 49 | $343,061 |
| APPLICATIONS DENIED | 18 | $276,667 | 51 | $334,392 |
| APPLICATIONS WITHDRAWN | 5 | $334,800 | 15 | $335,600 |
| FILES CLOSED FOR INCOMPLETENESS | 8 | $420,375 | 2 | $526,000 |
| Most common first names in Frederick County, MD among deceased individuals | ||
| Name | Count | Lived (average) |
|---|---|---|
| Mary | 956 | 80.3 years |
| John | 809 | 74.2 years |
| Charles | 791 | 73.4 years |
| William | 630 | 74.2 years |
| Robert | 521 | 71.9 years |
| James | 505 | 70.6 years |
| Margaret | 435 | 80.2 years |
| George | 414 | 74.9 years |
| Helen | 401 | 80.3 years |
| Ruth | 355 | 80.0 years |
| Most common last names in Frederick County, MD among deceased individuals | ||
| Last name | Count | Lived (average) |
|---|---|---|
| Smith | 480 | 75.9 years |
| Miller | 244 | 75.1 years |
| Brown | 182 | 73.4 years |
| Baker | 135 | 73.8 years |
| Davis | 129 | 75.8 years |
| Eyler | 124 | 74.6 years |
| Myers | 121 | 73.8 years |
| Zimmerman | 118 | 79.1 years |
| Rice | 109 | 77.3 years |
| Fogle | 109 | 75.4 years |
| Businesses in Frederick County, MD | ||||
| Name | Count | Name | Count | |
|---|---|---|---|---|
| 7-Eleven | 13 | Kmart | 1 | |
| ALDI | 1 | Kohl's | 1 | |
| AT&T | 3 | Kroger | 1 | |
| Ace Hardware | 1 | La-Z-Boy | 2 | |
| Advance Auto Parts | 2 | Lane Bryant | 1 | |
| Aeropostale | 1 | Lane Furniture | 5 | |
| American Eagle Outfitters | 1 | LensCrafters | 1 | |
| Ann Taylor | 1 | Little Caesars Pizza | 1 | |
| Applebee's | 1 | Lowe's | 1 | |
| Arby's | 2 | Macy's | 1 | |
| Ashley Furniture | 1 | MainStay | 1 | |
| Audi | 1 | Marriott | 3 | |
| AutoZone | 1 | MasterBrand Cabinets | 18 | |
| Barnes & Noble | 1 | Mazda | 1 | |
| Baskin-Robbins | 2 | McDonald's | 16 | |
| Bath & Body Works | 1 | Men's Wearhouse | 2 | |
| Bed Bath & Beyond | 1 | Motel 6 | 1 | |
| Ben & Jerry's | 1 | Motherhood Maternity | 2 | |
| Best Western | 1 | New Balance | 2 | |
| Blockbuster | 1 | Nike | 5 | |
| Buffalo Wild Wings | 1 | Nissan | 1 | |
| Burger King | 8 | Office Depot | 1 | |
| CVS | 9 | Olive Garden | 1 | |
| Casual Male XL | 1 | Outback | 1 | |
| Charlotte Russe | 1 | Outback Steakhouse | 1 | |
| Chevrolet | 2 | Pac Sun | 1 | |
| Chick-Fil-A | 1 | Panda Express | 1 | |
| Chico's | 1 | Panera Bread | 2 | |
| Chipotle | 1 | Papa John's Pizza | 2 | |
| Chuck E. Cheese's | 1 | Payless | 2 | |
| Cold Stone Creamery | 1 | Penske | 2 | |
| Coldwater Creek | 1 | PetSmart | 1 | |
| Comfort Inn | 2 | Pier 1 Imports | 1 | |
| Costco | 1 | Pizza Hut | 7 | |
| Cracker Barrel | 1 | Plato's Closet | 1 | |
| Cricket Wireless | 7 | Popeyes | 2 | |
| Curves | 3 | Quiznos | 4 | |
| DHL | 1 | RadioShack | 3 | |
| Dairy Queen | 3 | Red Lobster | 1 | |
| Days Inn | 1 | Red Robin | 1 | |
| Deb | 1 | Rite Aid | 3 | |
| Decora Cabinetry | 14 | Ruby Tuesday | 2 | |
| Dennys | 1 | SAS Shoes | 2 | |
| Domino's Pizza | 3 | Safeway | 3 | |
| DressBarn | 1 | Sam's Club | 1 | |
| Dressbarn | 1 | Sears | 3 | |
| Dunkin Donuts | 4 | Sleep Inn | 2 | |
| Econo Lodge | 1 | Soma Intimates | 1 | |
| Express | 1 | Spencer Gifts | 1 | |
| Extended Stay America | 1 | Sprint Nextel | 4 | |
| FedEx | 31 | Staples | 2 | |
| Finish Line | 1 | Starbucks | 7 | |
| Foot Locker | 1 | Subaru | 1 | |
| Ford | 1 | Subway | 19 | |
| GNC | 4 | Super 8 | 1 | |
| GameStop | 2 | T-Mobile | 7 | |
| Gap | 1 | T.G.I. Driday's | 1 | |
| Giant | 3 | Taco Bell | 6 | |
| Goodwill | 5 | Target | 1 | |
| Gymboree | 1 | The Room Place | 1 | |
| H&R Block | 6 | Toyota | 1 | |
| Hilton | 2 | Toys"R"Us | 1 | |
| Holiday Inn | 2 | Travelodge | 1 | |
| Hollister Co. | 1 | True Value | 2 | |
| Home Depot | 2 | U-Haul | 11 | |
| Honda | 1 | UPS | 33 | |
| Hot Topic | 1 | Value City Furniture | 1 | |
| Hyundai | 1 | Vans | 2 | |
| IHOP | 1 | Verizon Wireless | 3 | |
| JCPenney | 1 | Victoria's Secret | 1 | |
| JoS. A. Bank | 1 | Volkswagen | 1 | |
| Jones New York | 7 | Vons | 3 | |
| Journeys | 1 | Waffle House | 3 | |
| Justice | 1 | Walmart | 2 | |
| KFC | 3 | Wendy's | 5 | |
| Kincaid | 1 | YMCA | 1 | |
Frederick County on our top lists:
- #48 on the list of "Top 101 counties with the best general health status score of residents (1-5), 3 years of data"
- #54 on the list of "Top 101 counties with the highest percentage of residents that visited a dentist within the past year"
- #67 on the list of "Top 101 counties with the largest number of children under 18 without health insurance coverage in 2000 (pop. 50,000+)"
- #80 on the list of "Top 101 counties with the highest percentage of residents that keep firearms around their homes"
- #80 on the list of "Top 101 counties with the largest decrease in the number of births per 1000 residents 2000-2006 to 2007-2013 (pop 50,000+)"
- #81 on the list of "Top 101 counties with the highest average weight of females"