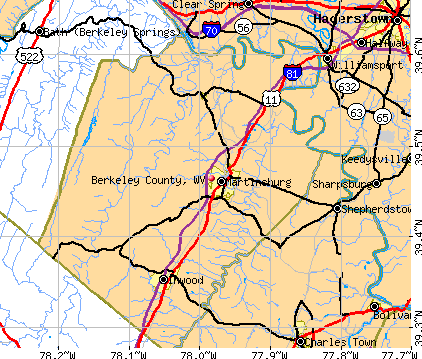
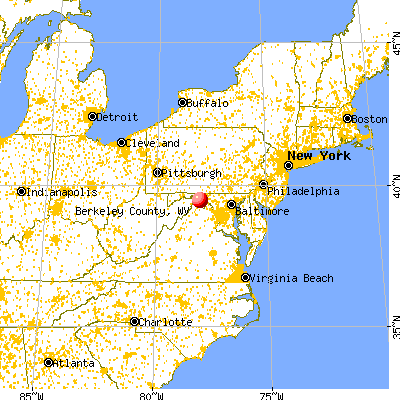
Berkeley County, West Virginia (WV)
County owner-occupied free and clear houses and condos in 2010: 7,890
County owner-occupied houses and condos in 2000: 21,921
Renter-occupied apartments: 10,091 (it was 7,648 in 2000)
| % of renters here: | 26% |
| State: | 27% |
Land area: 321 sq. mi.
Water area: 0.4 sq. mi.
Population density: 403 people per square mile (high).
Industries providing employment: Educational, health and social services (23.0%), Manufacturing (13.4%), Retail trade (13.4%).
Type of workers:
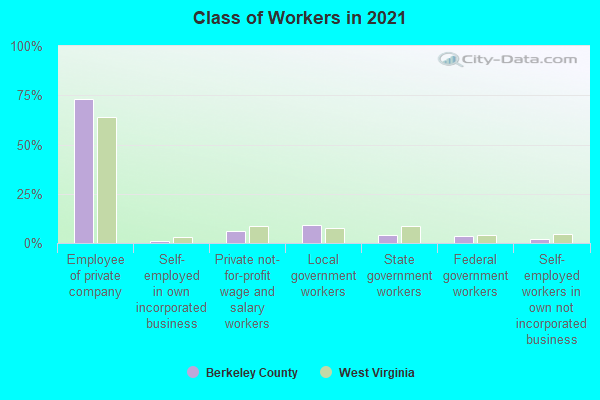
- Private wage or salary: 77%
- Government: 20%
- Self-employed, not incorporated: 4%
- Unpaid family work: 0%
- OSM Map
- General Map
- Google Map
- MSN Map

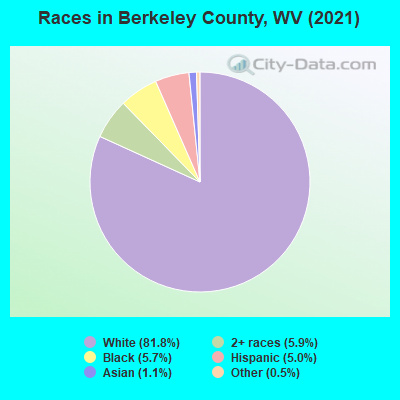
- 104,79580.9%White Non-Hispanic Alone
- 9,2327.1%Black Non-Hispanic Alone
- 7,7025.9%Hispanic or Latino
- 5,7784.5%Two or more races
- 1,2991.0%Asian alone
- 6690.5%Some other race alone
- 150.01%American Indian and Alaska Native alone
| Median resident age: | 39.8 years |
| West Virginia median age: | 42.9 years |
| Males: 64,794 | |
| Females: 64,696 |

 | Berkeley County WV business (65 replies) |
| Berkeley County WV Sprawl - From Where? (18 replies) |
| Is WV really as depressing as portrayed? (74 replies) |
| Anyone lived in Idaho and WV? (24 replies) |
| Weis Plaza/Mountaineer Blvd.- Martinsburg (260 replies) |
| Considering graduate school at WVU (29 replies) |
| Berkeley County: | 2.0 people |
| West Virginia: | 2 people |
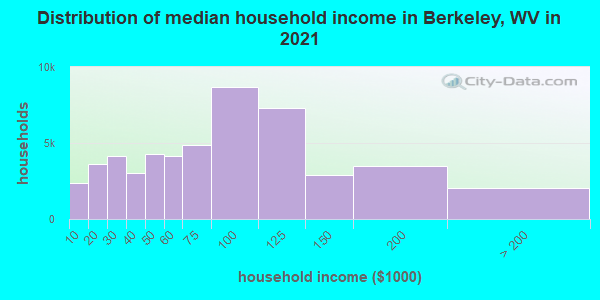
Estimated median household income in 2022: $69,558 ($38,763 in 1999)
| This county: | $69,558 |
| West Virginia: | $54,329 |
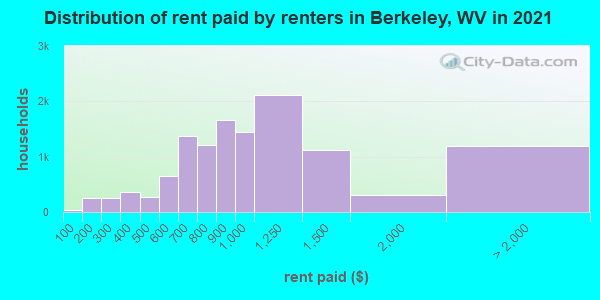
Median contract rent in 2022 for apartments: $950 (lower quartile is $652, upper quartile is $1,302)
| This county: | $950 |
| State: | $606 |
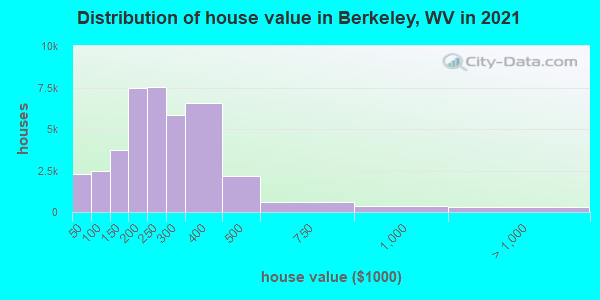
Estimated median house or condo value in 2022: $266,100 (it was $91,000 in 2000)
| Berkeley: | $266,100 |
| West Virginia: | $155,100 |
Median monthly housing costs for homes and condos with a mortgage: $1,413
Median monthly housing costs for units without a mortgage: $369
Institutionalized population: 649
Crime in 2021 (reported by the sheriff's office or county police, not the county total):
- Murders: 8
- Rapes: 21
- Robberies: 1
- Assaults: 65
- Burglaries: 11
- Thefts: 154
- Auto thefts: 9
Crime in 2020 (reported by the sheriff's office or county police, not the county total):
- Murders: 2
- Rapes: 13
- Robberies: 0
- Assaults: 62
- Burglaries: 0
- Thefts: 49
- Auto thefts: 0
Health of residents in Berkeley County based on CDC Behavioral Risk Factor Surveillance System Survey Questionnaires from 2013 to 2021:
General health status score of residents in this county from 1 (poor) to 5 (excellent) is 3.4. This is worse than average.68.5% of residents exercised in the past month. This is less than average.
46.9% of residents smoked 100+ cigarettes in their lives. This is about average.
42.5% of adult residents drank alcohol in the past 30 days. This is less than average.
65.4% of residents visited a dentist within the past year. This is less than average.
Average weight of males is 204 pounds. This is more than average.
Average weight of females is 168 pounds. This is more than average.
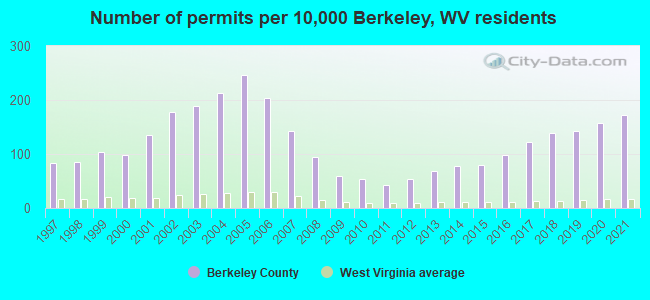
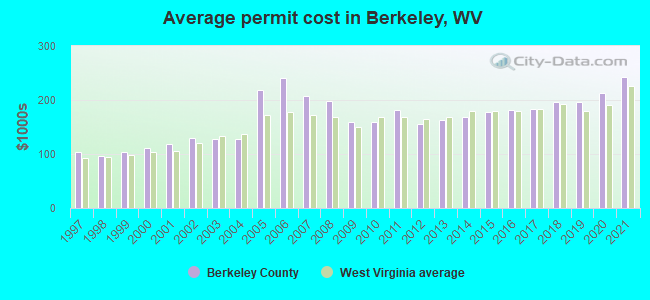
Single-family new house construction building permits:
- 2022: 1431 buildings, average cost: $246,900
- 2021: 1304 buildings, average cost: $242,400
- 2020: 1201 buildings, average cost: $213,100
- 2019: 1081 buildings, average cost: $196,000
- 2018: 1057 buildings, average cost: $195,800
- 2017: 925 buildings, average cost: $183,500
- 2016: 752 buildings, average cost: $181,100
- 2015: 610 buildings, average cost: $178,100
- 2014: 589 buildings, average cost: $168,200
- 2013: 524 buildings, average cost: $162,700
- 2012: 409 buildings, average cost: $156,400
- 2011: 324 buildings, average cost: $182,100
- 2010: 400 buildings, average cost: $159,800
- 2009: 445 buildings, average cost: $160,000
- 2008: 721 buildings, average cost: $197,500
- 2007: 1077 buildings, average cost: $207,300
- 2006: 1546 buildings, average cost: $240,500
- 2005: 1866 buildings, average cost: $217,700
- 2004: 1616 buildings, average cost: $127,500
- 2003: 1438 buildings, average cost: $127,500
- 2002: 1351 buildings, average cost: $129,200
- 2001: 1029 buildings, average cost: $118,700
- 2000: 753 buildings, average cost: $111,100
- 1999: 792 buildings, average cost: $103,000
- 1998: 645 buildings, average cost: $96,500
- 1997: 628 buildings, average cost: $103,300
Median real estate property taxes paid for housing units with mortgages in 2022: $1,392 (0.5%)
Median real estate property taxes paid for housing units with no mortgage in 2022: $1,133 (0.5%)
| Berkeley County: | 11.7% |
| West Virginia: | 17.9% |
Median age of residents in 2022: 39.8 years old
(Males: 38.5 years old, Females: 41.0 years old)
(Median age for: White residents: 41.2 years old, Black residents: 32.5 years old, American Indian residents: 25.8 years old, Asian residents: 54.1 years old, Hispanic or Latino residents: 34.1 years old, Other race residents: 41.6 years old)
Area name: Hagerstown-Martinsburg, MD-WV MSA
Fair market rent in 2006 for a 1-bedroom apartment in Berkeley County is $506 a month.
Fair market rent for a 2-bedroom apartment is $629 a month.
Fair market rent for a 3-bedroom apartment is $874 a month.
Cities in this county include: Martinsburg, Inwood, Falling Waters, Hedgesville.
2023 air pollution in Berkeley County:
Ozone (1-hour): 0.033 ppm (standard limit: 0.12 ppm). Near U.S. average.
Neighboring counties: Barbour County  , Arapahoe County, Colorado , Colusa County, California , Platte County, Missouri , Sangamon County, Illinois , Scott County, Illinois .
| Here: | 3.3% |
| West Virginia: | 4.0% |
Current college students: 2,424
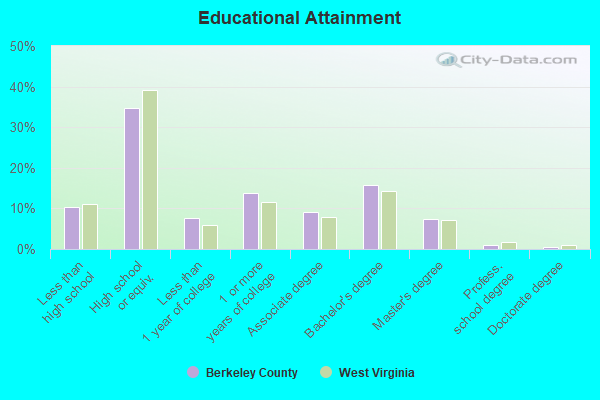
People 25 years of age or older with a high school degree or higher: 89.9%
People 25 years of age or older with a bachelor's degree or higher: 24.0%
Number of foreign born residents: 7,318 (76.4% naturalized citizens)
| Berkeley County: | 5.7% |
| Whole state: | 1.8% |
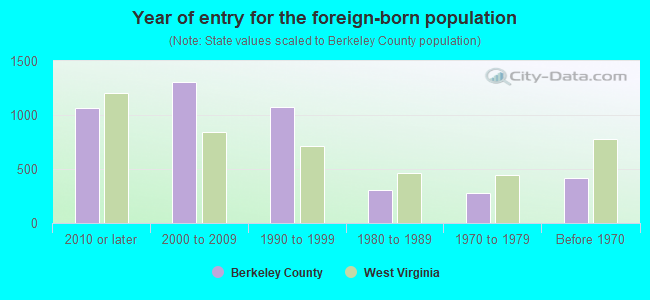
- Year of entry for the foreign-born population
- 1,4142010 or later
- 2,2342000 to 2009
- 1,2381990 to 1999
- 3071980 to 1989
- 2771970 to 1979
- 416Before 1970
Mean travel time to work (commute): minutes
Percentage of county residents living and working in this county: 66.1%
Housing units in structures:
- One, detached: 38,497
- One, attached: 5,981
- Two: 774
- 3 or 4: 504
- 5 to 9: 1,250
- 10 to 19: 924
- 20 to 49: 123
- 50 or more: 475
- Mobile homes: 5,098
- Boats, RVs, vans, etc.: 163
Housing units in Berkeley County with a mortgage: 28,504 (2,688 second mortgage, 89 home equity loan, 2,222 both second mortgage and home equity loan)
Houses without a mortgage: 305
| Here: | 8.4% with mortgage |
| State: | 97.1% with mortgage |
Religion statistics for Berkeley County
| Religion | Adherents | Congregations |
|---|---|---|
| Evangelical Protestant | 12,738 | 64 |
| Mainline Protestant | 10,228 | 43 |
| Catholic | 7,008 | 3 |
| Other | 1,888 | 7 |
| Black Protestant | 436 | 1 |
| None | 71,871 | - |
Source: Clifford Grammich, Kirk Hadaway, Richard Houseal, Dale E.Jones, Alexei Krindatch, Richie Stanley and Richard H.Taylor. 2012. 2010 U.S.Religion Census: Religious Congregations & Membership Study. Association of Statisticians of American Religious Bodies. Jones, Dale E., et al. 2002. Congregations and Membership in the United States 2000. Nashville, TN: Glenmary Research Center.
Food Environment Statistics:
| Berkeley County: | 1.00 / 10,000 pop. |
| State: | 2.41 / 10,000 pop. |
| Here: | 0.10 / 10,000 pop. |
| West Virginia: | 0.28 / 10,000 pop. |
| This county: | 0.90 / 10,000 pop. |
| West Virginia: | 1.09 / 10,000 pop. |
| Berkeley County: | 2.91 / 10,000 pop. |
| West Virginia: | 5.38 / 10,000 pop. |
| This county: | 4.72 / 10,000 pop. |
| State: | 6.22 / 10,000 pop. |
| Berkeley County: | 10.0% |
| West Virginia: | 12.2% |
| Berkeley County: | 32.8% |
| State: | 31.1% |
| Here: | 12.9% |
| State: | 13.1% |
Agriculture in Berkeley County:
Average size of farms: 113 acresAverage value of agricultural products sold per farm: $27,264
Average value of crops sold per acre for harvested cropland: $392.15
The value of nursery, greenhouse, floriculture, and sod as a percentage of the total market value of agricultural products sold: 4.97%
The value of livestock, poultry, and their products as a percentage of the total market value of agricultural products sold: 33.65%
Average total farm production expenses per farm: $26,366
Harvested cropland as a percentage of land in farms: 40.82%
Irrigated harvested cropland as a percentage of land in farms: 0.71%
Average market value of all machinery and equipment per farm: $30,779
The percentage of farms operated by a family or individual: 93.05%
Average age of principal farm operators: 56 years
Average number of cattle and calves per 100 acres of all land in farms: 15.95
Milk cows as a percentage of all cattle and calves: 9.19%
Corn for grain: 2759 harvested acres
All wheat for grain: 1041 harvested acres
Soybeans for beans: 1237 harvested acres
Vegetables: 226 harvested acres
Land in orchards: 5,328 acres
Earthquake activity:
Berkeley County-area historical earthquake activity is significantly above West Virginia state average. It is 53% smaller than the overall U.S. average.On 8/23/2011 at 17:51:04, a magnitude 5.8 (5.8 MW, Depth: 3.7 mi, Class: Moderate, Intensity: VI - VII) earthquake occurred 107.5 miles away from Berkeley County center
On 9/25/1998 at 19:52:52, a magnitude 5.2 (4.8 MB, 4.3 MS, 5.2 LG, 4.5 MW, Depth: 3.1 mi) earthquake occurred 189.1 miles away from the county center
On 1/16/1994 at 01:49:16, a magnitude 4.6 (4.6 MB, 4.6 LG, Depth: 3.1 mi, Class: Light, Intensity: IV - V) earthquake occurred 119.5 miles away from the county center
On 8/25/2011 at 05:07:52, a magnitude 4.5 (4.5 ML, Depth: 4.2 mi) earthquake occurred 104.9 miles away from the county center
On 12/9/2003 at 20:59:18, a magnitude 4.5 (4.5 ML, Depth: 6.2 mi) earthquake occurred 117.0 miles away from Berkeley County center
On 1/31/1986 at 16:46:43, a magnitude 5.0 (5.0 MB) earthquake occurred 223.1 miles away from the county center
Magnitude types: regional Lg-wave magnitude (LG), body-wave magnitude (MB), local magnitude (ML), surface-wave magnitude (MS), moment magnitude (MW)
Most recent natural disasters:
- West Virginia Covid-19 Pandemic, Incident Period: January 20, 2020, Major Disaster (Presidential) Declared DR-4517-WV: April 3, 2020, FEMA Id: 4517, Natural disaster type: Other
- West Virginia Hurricane Sandy, Incident Period: October 29, 2012 to November 08, 2012, Emergency Declared EM-3358: October 29, 2012, FEMA Id: 3358, Natural disaster type: Hurricane
- West Virginia Severe Storms, Incident Period: June 29, 2012 to July 10, 2012, Emergency Declared EM-3345: June 30, 2012, FEMA Id: 3345, Natural disaster type: Storm
- West Virginia Severe Storms and Straight-Line Winds, Incident Period: June 29, 2012 to July 08, 2012, Major Disaster (Presidential) Declared DR-4071: July 23, 2012, FEMA Id: 4071, Natural disaster type: Storm, Wind
- West Virginia Severe Winter Storms and Snowstorms, Incident Period: February 05, 2010 to February 11, 2010, Major Disaster (Presidential) Declared DR-1903: April 23, 2010, FEMA Id: 1903, Natural disaster type: Snowstorm, Winter Storm
- West Virginia Hurricane Katrina Evacuation, Incident Period: August 29, 2005 to October 01, 2005, Emergency Declared EM-3221: September 05, 2005, FEMA Id: 3221, Natural disaster type: Hurricane
- West Virginia Severe Storms, Flooding and Landslides, Incident Period: September 16, 2004 to September 27, 2004, Major Disaster (Presidential) Declared DR-1558: September 20, 2004, FEMA Id: 1558, Natural disaster type: Storm, Landslide, Flood
- West Virginia Hurricane Isabel, Incident Period: September 18, 2003 to September 30, 2003, Major Disaster (Presidential) Declared DR-1496: September 23, 2003, FEMA Id: 1496, Natural disaster type: Hurricane
- West Virginia Severe Storms, Flooding and Landslides, Incident Period: June 11, 2003 to July 15, 2003, Major Disaster (Presidential) Declared DR-1474: June 21, 2003, FEMA Id: 1474, Natural disaster type: Storm, Landslide, Flood
- West Virginia Hurricane Fran, Incident Period: September 05, 1996 to September 08, 1996, Major Disaster (Presidential) Declared DR-1137: September 11, 1996, FEMA Id: 1137, Natural disaster type: Hurricane
- 5 other natural disasters have been reported since 1953.
The number of natural disasters in Berkeley County (15) is near the US average (15).
Major Disasters (Presidential) Declared: 11
Emergencies Declared: 4
Causes of natural disasters: Storms: 5, Floods: 4, Hurricanes: 4, Landslides: 2, Winter Storms: 2, Blizzard: 1, Snowfall: 1, Snowstorm: 1, Tropical Storm: 1, Wind: 1, Other: 1 (Note: some incidents may be assigned to more than one category).
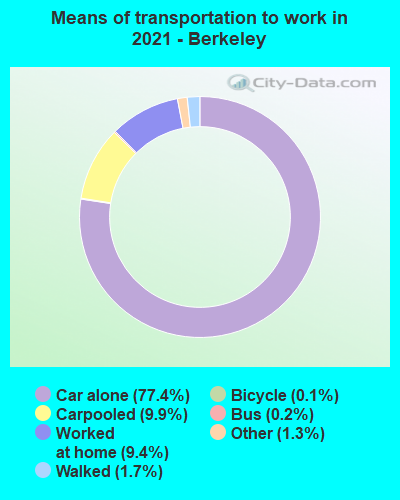
Means of transportation to work:
- Drove a car alone: 31,463 (72.9%)
- Carpooled: 4,699 (10.9%)
- Bus: 125 (0.3%)
- Taxicab, motorcycle, or other means: 497 (1.2%)
- Bicycle: 10 (0.0%)
- Walked: 510 (1.2%)
- Worked at home: 6,620 (15.3%)
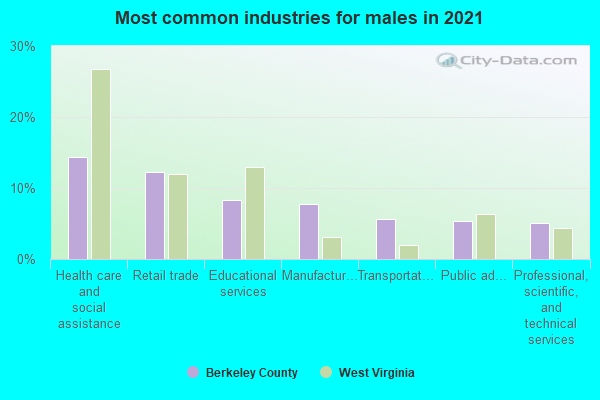
- Health care and social assistance (23%)
- Educational services (13%)
- Retail trade (12%)
- Manufacturing (8%)
- Accommodation and food services (6%)
- Public administration (6%)
- Transportation and warehousing (4%)
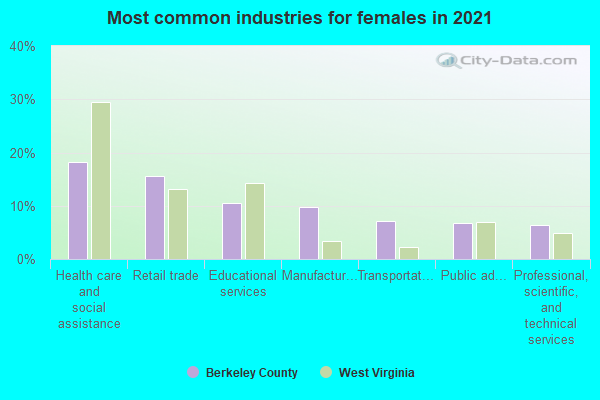
- Health care and social assistance (26%)
- Educational services (15%)
- Retail trade (13%)
- Manufacturing (9%)
- Accommodation and food services (7%)
- Public administration (6%)
- Transportation and warehousing (5%)
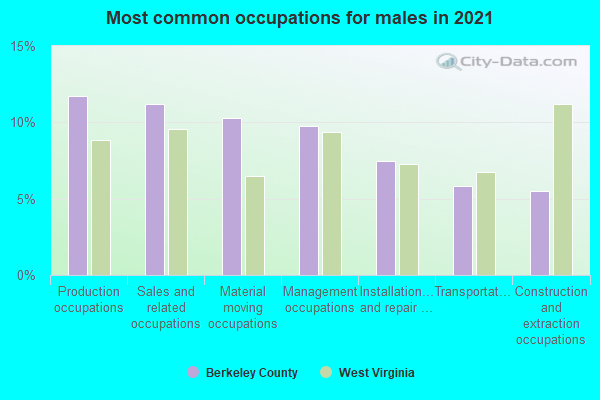
- Material moving occupations (13%)
- Transportation occupations (11%)
- Management occupations (10%)
- Production occupations (9%)
- Sales and related occupations (8%)
- Construction and extraction occupations (7%)
- Office and administrative support occupations (6%)
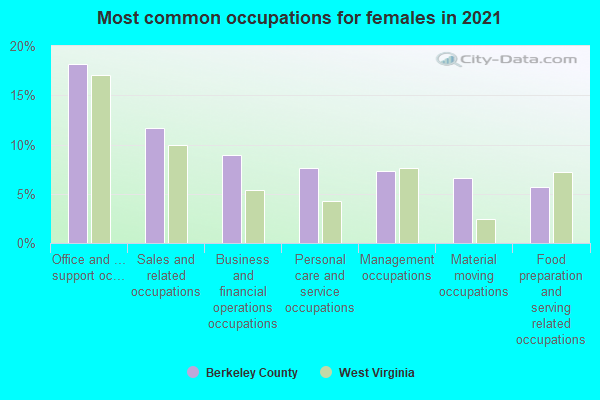
- Office and administrative support occupations (17%)
- Educational instruction, and library occupations (13%)
- Management occupations (11%)
- Sales and related occupations (11%)
- Healthcare support occupations (6%)
- Health diagnosing and treating practitioners and other technical occupations (6%)
- Business and financial operations occupations (5%)
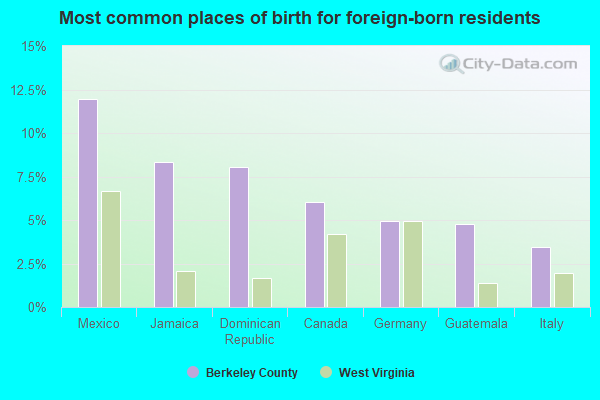
- Mexico (12%)
- Germany (7%)
- Canada (6%)
- Dominican Republic (6%)
- Guyana (5%)
- Guatemala (5%)
- Jamaica (5%)
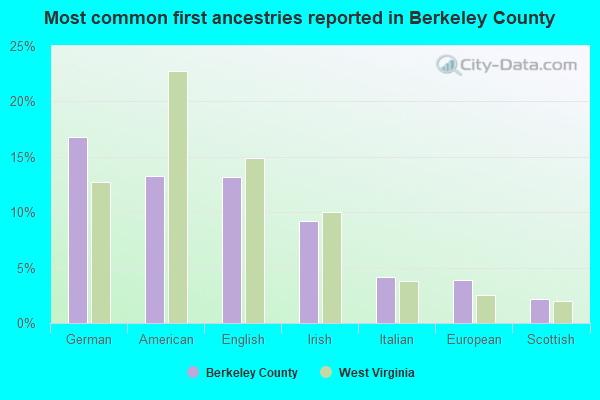
- German (15%)
- American (13%)
- English (13%)
- Irish (9%)
- Italian (5%)
- European (4%)
- Scottish (2%)
People in group quarters in Berkeley County, West Virginia in 2010:
- 290 people in mental (psychiatric) hospitals and psychiatric units in other hospitals
- 181 people in nursing facilities/skilled-nursing facilities
- 122 people in state prisons
- 99 people in other noninstitutional facilities
- 65 people in emergency and transitional shelters (with sleeping facilities) for people experiencing homelessness
- 49 people in residential treatment centers for juveniles (non-correctional)
- 47 people in residential treatment centers for adults
- 46 people in group homes intended for adults
- 7 people in group homes for juveniles (non-correctional)
- 4 people in college/university student housing
People in group quarters in Berkeley County, West Virginia in 2000:
- 355 people in nursing homes
- 315 people in hospitals or wards for drug/alcohol abuse
- 168 people in other types of correctional institutions
- 110 people in other group homes
- 93 people in local jails and other confinement facilities (including police lockups)
- 59 people in other noninstitutional group quarters
- 29 people in short-term care, detention or diagnostic centers for delinquent children
- 29 people in homes or halfway houses for drug/alcohol abuse
- 28 people in homes for the mentally retarded
- 15 people in homes for the mentally ill
- 9 people in homes for the physically handicapped
- 3 people in college dormitories (includes college quarters off campus)
- 3 people in religious group quarters
8.81% of this county's 2021 resident taxpayers lived in other counties in 2020 ($57,963 average adjusted gross income)
| Here: | 8.81% |
| West Virginia average: | 5.74% |
10 or fewer of this county's residents moved from foreign countries.
1.91% relocated from other counties in West Virginia ($10,574 average AGI)
6.90% relocated from other states ($47,389 average AGI)
Berkeley County: 6.90% West Virginia average: 3.02%
Top counties from which taxpayers relocated into this county between 2020 and 2021:
| from Jefferson County, WV | |
| from Washington County, MD | |
| from Frederick County, VA | |
| from Frederick County, MD | |
| from Loudoun County, VA | |
| from Winchester city, VA | |
| from Montgomery County, MD |
6.34% of this county's 2020 resident taxpayers moved to other counties in 2021 ($55,762 average adjusted gross income)
| Here: | 6.34% |
| West Virginia average: | 5.65% |
10 or fewer of this county's residents moved to foreign countries.
1.58% relocated to other counties in West Virginia ($12,232 average AGI)
4.76% relocated to other states ($43,531 average AGI)
Berkeley County: 4.76% West Virginia average: 2.93%
Top counties to which taxpayers relocated from this county between 2020 and 2021:
| to Jefferson County, WV | |
| to Washington County, MD | |
| to Frederick County, VA | |
| to Morgan County, WV | |
| to Franklin County, PA | |
| to Frederick County, MD | |
| to Winchester city, VA |
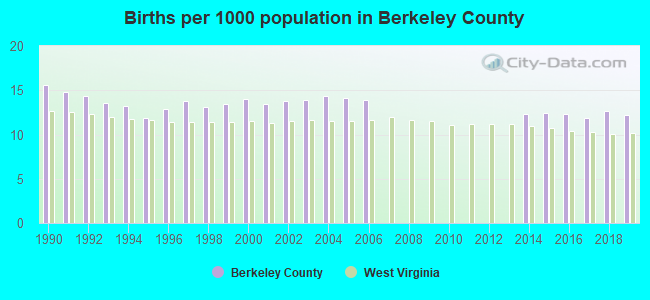
Births per 1000 population from 1990 to 1999: 13.7
Births per 1000 population from 2000 to 2009: 9.7
Births per 1000 population from 2010 to 2022: 6.6
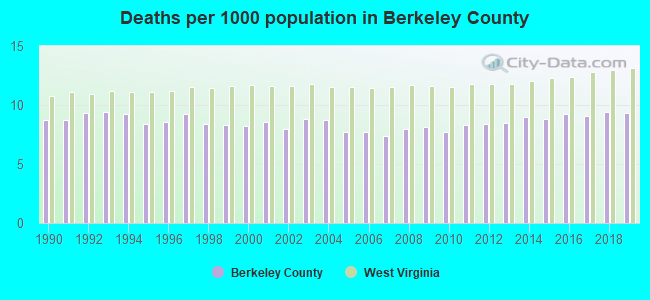
Deaths per 1000 population from 1990 to 1999: 8.8
Deaths per 1000 population from 2000 to 2009: 8.1
Deaths per 1000 population from 2010 to 2020: 9.0
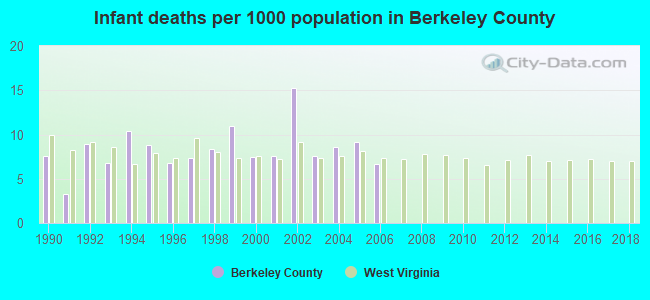
Infant deaths per 1000 live births from 1990 to 1999: 7.9
Infant deaths per 1000 live births from 2000 to 2006: 8.9
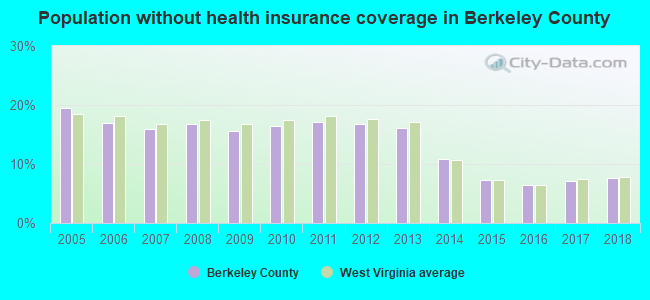
Persons under 19 years old without health insurance coverage in 2018: 3.2%

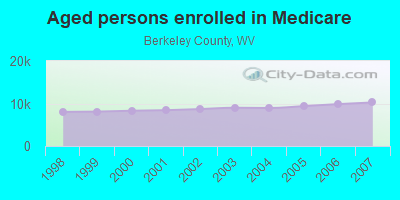
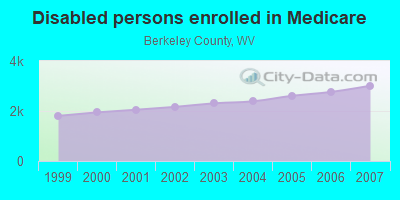
Persons enrolled in hospital insurance and/or supplemental medical insurance (Medicare) in July 1, 2007: 13,264 (10,252 aged, 3,012 disabled)
Children under 18 without health insurance coverage in 2007: 2,749 (10%)
Most common underlying causes of death in Berkeley County, West Virginia in 1999 - 2019:
- Bronchus or lung, unspecified - Malignant neoplasms (1,348)
- Atherosclerotic heart disease (1,047)
- Chronic obstructive pulmonary disease, unspecified (805)
- Acute myocardial infarction, unspecified (772)
- Stroke, not specified as haemorrhage or infarction (433)
- Congestive heart failure (432)
- Alzheimer disease, unspecified (417)
- Unspecified dementia (358)
- Colon, unspecified - Malignant neoplasms (341)
- Atherosclerotic cardiovascular disease, so described (285)
Population without health insurance coverage in 2000: 11%
Children under 18 without health insurance coverage in 2000: 8%
Short term general hospital admissions per 100,000 population in 2004: 16,432
Short term general hospital beds per 100,000 population in 2004: 786
Emergency room visits per 100,000 population in 2004: 52,305
General practice office based MDs per 100,000 population in 2005: 1,338
Medical specialist MDs per 100,000 population in 2005: 836
Dentists per 100,000 population in 1998: 1
Total births per 100,000 population, July 2005 - July 2006 : 38
Total deaths per 100,000 population, July 2005 - July 2006: 73
Limited-service eating places per 100,000 population in 2005 : 8
Beer, wine & liquor stores per 100,000 population in 2005: 1
Homicides per 1,000,000 population from 2000 to 2006: 45.1. This is less than state average.
Suicides per 1,000,000 population from 2000 to 2006: 143.7. This is less than state average.
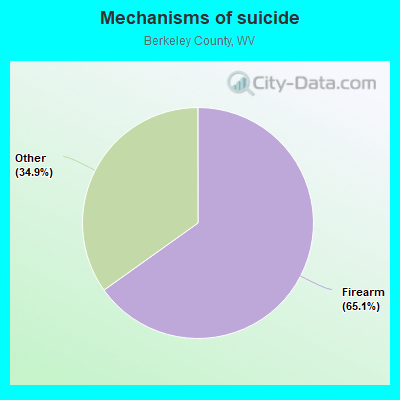
- Firearm - 93.6
- Other - 50.1
Household type by relationship:
Households: 129,490- Male householders: 26,046 (5,732 living alone), Female householders: 25,099 (5,930 living alone)
25,335 spouses (24,318 opposite-sex spouses), 5,370 unmarried partners, (5,242 opposite-sex unmarried partners), 35,481 children (33,049 natural, 813 adopted, 1,619 stepchildren), 2,393 grandchildren, 1,104 brothers or sisters, 1,940 parents, 102 foster children, 2,184 other relatives, 3,289 non-relatives
- In group quarters: 1,147
Size of family households: 14,790 2-persons, 8,188 3-persons, 7,183 4-persons, 3,015 5-persons, 822 6-persons, 1,253 7-or-more-persons.
Size of nonfamily households: 11,662 1-person, 3,758 2-persons, 371 3-persons, 103 4-persons.
17,879 married couples with children.
7,267 single-parent households (1,511 men, 5,756 women).
94.1% of residents of Berkeley speak English at home.
3.8% of residents speak Spanish at home (71% speak English very well, 15% speak English well, 9% speak English not well, 6% don't speak English at all).
0.7% of residents speak other Indo-European language at home (74% speak English very well, 26% speak English well).
0.8% of residents speak Asian or Pacific Island language at home (53% speak English very well, 31% speak English well, 16% speak English not well).
0.7% of residents speak other language at home (80% speak English very well, 8% speak English well, 12% speak English not well).
In fiscal year 2004:
Federal Government expenditure: $687,747,000 ($7,696 per capita)
Department of Defense expenditure: $51,034,000
Federal direct payments to individuals for retirement and disability: $233,346,000
Federal other direct payments to individuals: $64,451,000
Federal direct payments not to individuals: $854,000
Federal grants: $59,599,000
Federal procurement contracts: $159,310,000 ($24,758,000 Department of Defense)
Federal salaries and wages: $170,186,000 ($10,776,000 Department of Defense)
Federal Government direct loans: $3,095,000
Federal guaranteed/insured loans: $126,750,000
Federal Government insurance: $21,028,000
Population change from April 1, 2000 to July 1, 2005:
Births: 5,906| Here: | 63 per 1000 residents |
| State: | 60 per 1000 residents |
Deaths: 3,729
| Here: | 40 per 1000 residents |
| State: | 61 per 1000 residents |
Net international migration: +97
| Here: | +1 per 1000 residents |
| State: | +2 per 1000 residents |
Net internal migration: +15,394
| Here: | +165 per 1000 residents |
| State: | +6 per 1000 residents |
Total withdrawal of fresh water for public supply: 8.96 millions of gallons per day (60% from ground, 40% from surface)
| Here: | 6.5 |
| State: | 6.5 |
| Here: | 5.1 |
| State: | 4.7 |
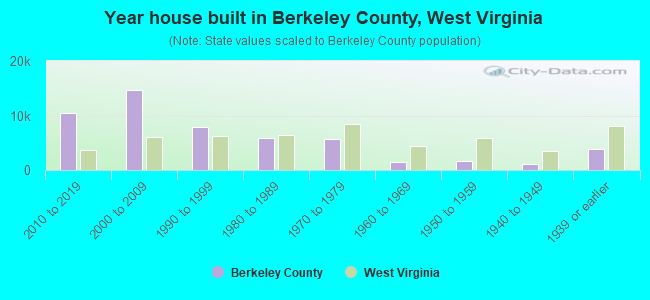
- Year house built in Berkeley County, West Virginia
- 1,7372020 or later
- 10,6212010 to 2019
- 16,1282000 to 2009
- 7,1251990 to 1999
- 4,9051980 to 1989
- 4,3181970 to 1979
- 1,3371960 to 1969
- 2,3871950 to 1959
- 1,4031940 to 1949
- 3,8281939 or earlier
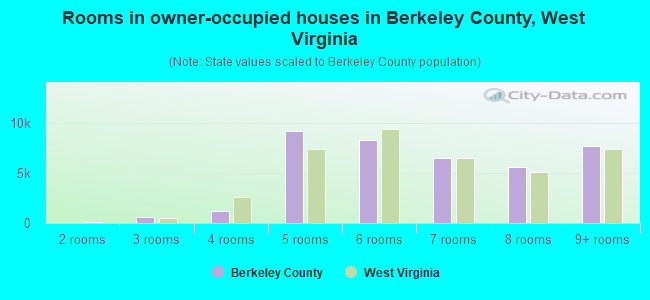
- Rooms in owner-occupied houses in Berkeley County, West Virginia
- 361 room
- 2032 rooms
- 1,3333 rooms
- 2,4274 rooms
- 7,8965 rooms
- 8,8056 rooms
- 6,6177 rooms
- 5,4738 rooms
- 8,3609+ rooms
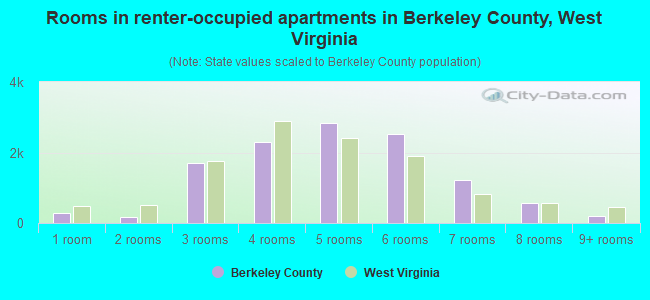
- Rooms in renter-occupied apartments in Berkeley County, West Virginia
- 3011 room
- 3252 rooms
- 7143 rooms
- 2,3194 rooms
- 2,4315 rooms
- 1,8656 rooms
- 1,7147 rooms
- 1898 rooms
- 1379+ rooms
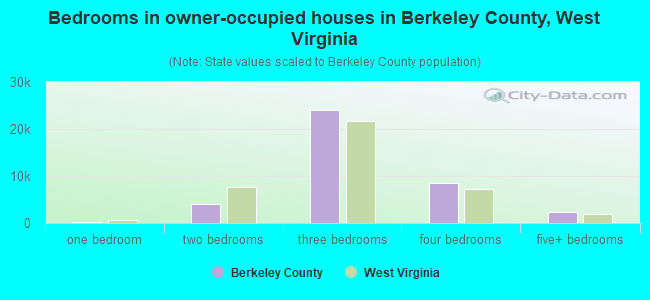
- Bedrooms in owner-occupied houses in Berkeley County, West Virginia
- 154no bedroom
- 7461 bedroom
- 4,4262 bedrooms
- 23,6853 bedrooms
- 9,7244 bedrooms
- 2,4155+ bedrooms
- Bedrooms in renter-occupied apartments in Berkeley County, West Virginia
- 407no bedroom
- 1,6431 bedroom
- 3,3012 bedrooms
- 2,6583 bedrooms
- 1,8974 bedrooms
- 895+ bedrooms
- Cars and other vehicles available in Berkeley County in owner-occupied houses/condos
- 499no vehicle
- 8,9821 vehicle
- 17,8002 vehicles
- 8,8453 vehicles
- 3,0104 vehicles
- 2,0145+ vehicles
- Cars and other vehicles available in Berkeley County in renter-occupied apartments
- 1,156no vehicle
- 4,7931 vehicle
- 3,2522 vehicles
- 6183 vehicles
- 414 vehicles
- 1355+ vehicles
86.9% of Berkeley County residents lived in the same house 1 years ago.
Out of people who lived in different houses, 29% lived in this county.
Out of people who lived in different counties, 18% lived in West Virginia.
| Berkeley County: | 86.9% |
| State average: | 89.6% |
Place of birth for U.S.-born residents:
- This state: 46,502
- Other state: 74,910
- Northeast: 13,167
- Midwest: 4,507
- South: 54,043
- West: 3,193
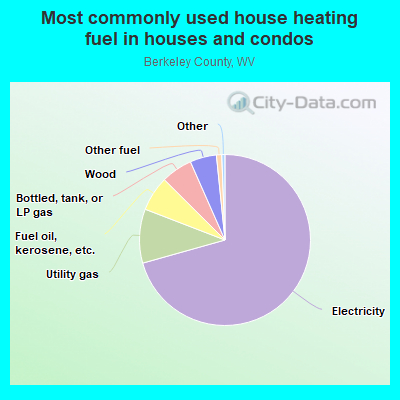
- 75.3%Electricity
- 11.5%Utility gas
- 4.8%Wood
- 4.2%Bottled, tank, or LP gas
- 3.0%Fuel oil, kerosene, etc.
- 0.6%No fuel used
- 0.5%Other fuel
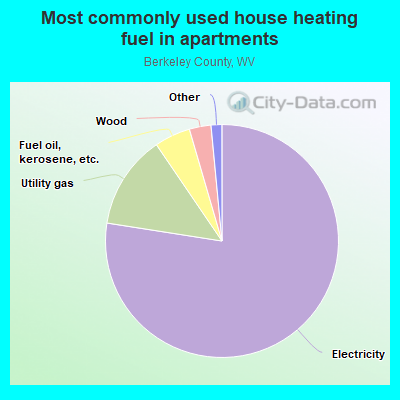
- 74.8%Electricity
- 11.9%Utility gas
- 6.5%Fuel oil, kerosene, etc.
- 2.9%Bottled, tank, or LP gas
- 1.4%Wood
- 1.3%Other fuel
- 1.2%No fuel used
Private vs. public school enrollment:
| Here: | 12.5% |
| West Virginia: | 12.2% |
| Here: | 6.1% |
| West Virginia: | 8.8% |
| Here: | 16.1% |
| West Virginia: | 17.3% |
Berkeley County government finances - Expenditure in 2018:
- Bond Funds - Cash and Securities: $104,000
- Charges - Other: $7,788,000
Other: $6,802,000
- Current Operations - Police Protection: $8,819,000
Police Protection: $7,977,000
General Public Buildings: $5,958,000
General Public Buildings: $5,783,000
Judicial and Legal Services: $4,124,000
Judicial and Legal Services: $3,585,000
Financial Administration: $2,913,000
Central Staff Services: $2,408,000
Central Staff Services: $2,330,000
Financial Administration: $2,273,000
General - Other: $2,135,000
Health - Other: $1,916,000
General - Other: $1,821,000
Local Fire Protection: $1,794,000
Parks and Recreation: $1,513,000
Parks and Recreation: $1,505,000
Health - Other: $1,309,000
Protective Inspection and Regulation - Other: $1,048,000
Local Fire Protection: $777,000
Protective Inspection and Regulation - Other: $704,000
- Federal Intergovernmental - Other: $3,169,000
Public Welfare: $721,000
Other: $320,000
Public Welfare: $93,000
- General - Interest on Debt: $941,000
Interest on Debt: $899,000
- Intergovernmental to Local - Other - Health - Other: $219,000
Other - Health - Other: $193,000
Other - Solid Waste Management: $73,000
Other - Solid Waste Management: $62,000
- Intergovernmental to State - Correctional Institutions: $2,708,000
Correctional Institutions: $2,302,000
- Local Intergovernmental - Health and Hospitals: $191,000
Health and Hospitals: $155,000
- Long Term Debt - Beginning Outstanding - Unspecified Public Purpose: $33,707,000
Outstanding Unspecified Public Purpose: $32,068,000
Beginning Outstanding - Unspecified Public Purpose: $30,441,000
Outstanding Unspecified Public Purpose: $28,790,000
Retired Unspecified Public Purpose: $1,650,000
Retired Unspecified Public Purpose: $1,639,000
Retired Nonguaranteed - Public Debt for Private Purpose: $860,000
Beginning Outstanding - Public Debt for Private Purpose: $860,000
- Miscellaneous - General Revenue - Other: $3,329,000
Rents: $2,661,000
General Revenue - Other: $1,890,000
Fines and Forfeits: $718,000
Fines and Forfeits: $604,000
Rents: $369,000
Interest Earnings: $130,000
Interest Earnings: $70,000
- Other Capital Outlay - General - Other: $1,686,000
General - Other: $428,000
Police Protection: $48,000
Police Protection: $43,000
- Other Funds - Cash and Securities: $15,882,000
Cash and Securities: $12,116,000
- Sinking Funds - Cash and Securities: $758,000
Cash and Securities: $717,000
- State Intergovernmental - Health and Hospitals: $883,000
Health and Hospitals: $723,000
General Local Government Support: $473,000
General Local Government Support: $426,000
Other: $353,000
Other: $329,000
- Tax - Property: $22,439,000
Property: $20,336,000
Other: $3,788,000
Other: $2,997,000
Other Selective Sales: $779,000
Other Selective Sales: $634,000
Alcoholic Beverage Sales: $482,000
Alcoholic Beverage Sales: $216,000
- Total Salaries and Wages: $21,302,000
: $13,934,000
Berkeley County government finances - Revenue in 2018:
- Bond Funds - Cash and Securities: $104,000
- Charges - Other: $7,788,000
Other: $6,802,000
- Current Operations - Police Protection: $8,819,000
Police Protection: $7,977,000
General Public Buildings: $5,958,000
General Public Buildings: $5,783,000
Judicial and Legal Services: $4,124,000
Judicial and Legal Services: $3,585,000
Financial Administration: $2,913,000
Central Staff Services: $2,408,000
Central Staff Services: $2,330,000
Financial Administration: $2,273,000
General - Other: $2,135,000
Health - Other: $1,916,000
General - Other: $1,821,000
Local Fire Protection: $1,794,000
Parks and Recreation: $1,513,000
Parks and Recreation: $1,505,000
Health - Other: $1,309,000
Protective Inspection and Regulation - Other: $1,048,000
Local Fire Protection: $777,000
Protective Inspection and Regulation - Other: $704,000
- Federal Intergovernmental - Other: $3,169,000
Public Welfare: $721,000
Other: $320,000
Public Welfare: $93,000
- General - Interest on Debt: $941,000
Interest on Debt: $899,000
- Intergovernmental to Local - Other - Health - Other: $219,000
Other - Health - Other: $193,000
Other - Solid Waste Management: $73,000
Other - Solid Waste Management: $62,000
- Intergovernmental to State - Correctional Institutions: $2,708,000
Correctional Institutions: $2,302,000
- Local Intergovernmental - Health and Hospitals: $191,000
Health and Hospitals: $155,000
- Long Term Debt - Beginning Outstanding - Unspecified Public Purpose: $33,707,000
Outstanding Unspecified Public Purpose: $32,068,000
Beginning Outstanding - Unspecified Public Purpose: $30,441,000
Outstanding Unspecified Public Purpose: $28,790,000
Retired Unspecified Public Purpose: $1,650,000
Retired Unspecified Public Purpose: $1,639,000
Retired Nonguaranteed - Public Debt for Private Purpose: $860,000
Beginning Outstanding - Public Debt for Private Purpose: $860,000
- Miscellaneous - General Revenue - Other: $3,329,000
Rents: $2,661,000
General Revenue - Other: $1,890,000
Fines and Forfeits: $718,000
Fines and Forfeits: $604,000
Rents: $369,000
Interest Earnings: $130,000
Interest Earnings: $70,000
- Other Capital Outlay - General - Other: $1,686,000
General - Other: $428,000
Police Protection: $48,000
Police Protection: $43,000
- Other Funds - Cash and Securities: $15,882,000
Cash and Securities: $12,116,000
- Sinking Funds - Cash and Securities: $758,000
Cash and Securities: $717,000
- State Intergovernmental - Health and Hospitals: $883,000
Health and Hospitals: $723,000
General Local Government Support: $473,000
General Local Government Support: $426,000
Other: $353,000
Other: $329,000
- Tax - Property: $22,439,000
Property: $20,336,000
Other: $3,788,000
Other: $2,997,000
Other Selective Sales: $779,000
Other Selective Sales: $634,000
Alcoholic Beverage Sales: $482,000
Alcoholic Beverage Sales: $216,000
- Total Salaries and Wages: $21,302,000
: $13,934,000
Berkeley County government finances - Debt in 2018:
- Bond Funds - Cash and Securities: $104,000
- Charges - Other: $7,788,000
Other: $6,802,000
- Current Operations - Police Protection: $8,819,000
Police Protection: $7,977,000
General Public Buildings: $5,958,000
General Public Buildings: $5,783,000
Judicial and Legal Services: $4,124,000
Judicial and Legal Services: $3,585,000
Financial Administration: $2,913,000
Central Staff Services: $2,408,000
Central Staff Services: $2,330,000
Financial Administration: $2,273,000
General - Other: $2,135,000
Health - Other: $1,916,000
General - Other: $1,821,000
Local Fire Protection: $1,794,000
Parks and Recreation: $1,513,000
Parks and Recreation: $1,505,000
Health - Other: $1,309,000
Protective Inspection and Regulation - Other: $1,048,000
Local Fire Protection: $777,000
Protective Inspection and Regulation - Other: $704,000
- Federal Intergovernmental - Other: $3,169,000
Public Welfare: $721,000
Other: $320,000
Public Welfare: $93,000
- General - Interest on Debt: $941,000
Interest on Debt: $899,000
- Intergovernmental to Local - Other - Health - Other: $219,000
Other - Health - Other: $193,000
Other - Solid Waste Management: $73,000
Other - Solid Waste Management: $62,000
- Intergovernmental to State - Correctional Institutions: $2,708,000
Correctional Institutions: $2,302,000
- Local Intergovernmental - Health and Hospitals: $191,000
Health and Hospitals: $155,000
- Long Term Debt - Beginning Outstanding - Unspecified Public Purpose: $33,707,000
Outstanding Unspecified Public Purpose: $32,068,000
Beginning Outstanding - Unspecified Public Purpose: $30,441,000
Outstanding Unspecified Public Purpose: $28,790,000
Retired Unspecified Public Purpose: $1,650,000
Retired Unspecified Public Purpose: $1,639,000
Retired Nonguaranteed - Public Debt for Private Purpose: $860,000
Beginning Outstanding - Public Debt for Private Purpose: $860,000
- Miscellaneous - General Revenue - Other: $3,329,000
Rents: $2,661,000
General Revenue - Other: $1,890,000
Fines and Forfeits: $718,000
Fines and Forfeits: $604,000
Rents: $369,000
Interest Earnings: $130,000
Interest Earnings: $70,000
- Other Capital Outlay - General - Other: $1,686,000
General - Other: $428,000
Police Protection: $48,000
Police Protection: $43,000
- Other Funds - Cash and Securities: $15,882,000
Cash and Securities: $12,116,000
- Sinking Funds - Cash and Securities: $758,000
Cash and Securities: $717,000
- State Intergovernmental - Health and Hospitals: $883,000
Health and Hospitals: $723,000
General Local Government Support: $473,000
General Local Government Support: $426,000
Other: $353,000
Other: $329,000
- Tax - Property: $22,439,000
Property: $20,336,000
Other: $3,788,000
Other: $2,997,000
Other Selective Sales: $779,000
Other Selective Sales: $634,000
Alcoholic Beverage Sales: $482,000
Alcoholic Beverage Sales: $216,000
- Total Salaries and Wages: $21,302,000
: $13,934,000
Berkeley County government finances - Cash and Securities in 2018:
- Bond Funds - Cash and Securities: $104,000
- Charges - Other: $7,788,000
Other: $6,802,000
- Current Operations - Police Protection: $8,819,000
Police Protection: $7,977,000
General Public Buildings: $5,958,000
General Public Buildings: $5,783,000
Judicial and Legal Services: $4,124,000
Judicial and Legal Services: $3,585,000
Financial Administration: $2,913,000
Central Staff Services: $2,408,000
Central Staff Services: $2,330,000
Financial Administration: $2,273,000
General - Other: $2,135,000
Health - Other: $1,916,000
General - Other: $1,821,000
Local Fire Protection: $1,794,000
Parks and Recreation: $1,513,000
Parks and Recreation: $1,505,000
Health - Other: $1,309,000
Protective Inspection and Regulation - Other: $1,048,000
Local Fire Protection: $777,000
Protective Inspection and Regulation - Other: $704,000
- Federal Intergovernmental - Other: $3,169,000
Public Welfare: $721,000
Other: $320,000
Public Welfare: $93,000
- General - Interest on Debt: $941,000
Interest on Debt: $899,000
- Intergovernmental to Local - Other - Health - Other: $219,000
Other - Health - Other: $193,000
Other - Solid Waste Management: $73,000
Other - Solid Waste Management: $62,000
- Intergovernmental to State - Correctional Institutions: $2,708,000
Correctional Institutions: $2,302,000
- Local Intergovernmental - Health and Hospitals: $191,000
Health and Hospitals: $155,000
- Long Term Debt - Beginning Outstanding - Unspecified Public Purpose: $33,707,000
Outstanding Unspecified Public Purpose: $32,068,000
Beginning Outstanding - Unspecified Public Purpose: $30,441,000
Outstanding Unspecified Public Purpose: $28,790,000
Retired Unspecified Public Purpose: $1,650,000
Retired Unspecified Public Purpose: $1,639,000
Retired Nonguaranteed - Public Debt for Private Purpose: $860,000
Beginning Outstanding - Public Debt for Private Purpose: $860,000
- Miscellaneous - General Revenue - Other: $3,329,000
Rents: $2,661,000
General Revenue - Other: $1,890,000
Fines and Forfeits: $718,000
Fines and Forfeits: $604,000
Rents: $369,000
Interest Earnings: $130,000
Interest Earnings: $70,000
- Other Capital Outlay - General - Other: $1,686,000
General - Other: $428,000
Police Protection: $48,000
Police Protection: $43,000
- Other Funds - Cash and Securities: $15,882,000
Cash and Securities: $12,116,000
- Sinking Funds - Cash and Securities: $758,000
Cash and Securities: $717,000
- State Intergovernmental - Health and Hospitals: $883,000
Health and Hospitals: $723,000
General Local Government Support: $473,000
General Local Government Support: $426,000
Other: $353,000
Other: $329,000
- Tax - Property: $22,439,000
Property: $20,336,000
Other: $3,788,000
Other: $2,997,000
Other Selective Sales: $779,000
Other Selective Sales: $634,000
Alcoholic Beverage Sales: $482,000
Alcoholic Beverage Sales: $216,000
- Total Salaries and Wages: $21,302,000
: $13,934,000
Supplemental Security Income (SSI) in 2006:
- Total number of recipients: 1,732
- Number of aged recipients: 116
- Number of blind and disabled recipients: 1,616
- Number of recipients under 18: 320
- Number of recipients between 18 and 64: 1,148
- Number of recipients older than 64: 264
- Number of recipients also receiving OASDI: 632
- Amount of payments (thousands of dollars): 749
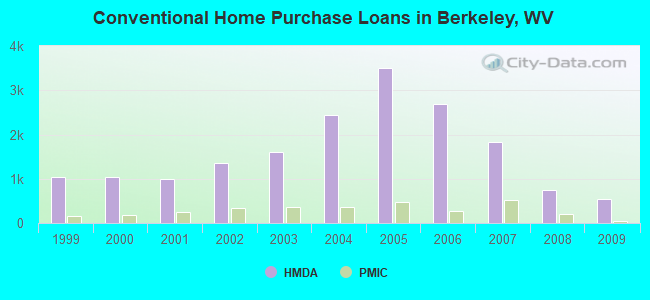
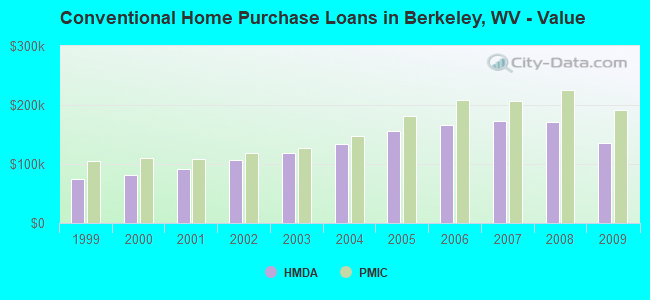
| Home Mortgage Disclosure Act Aggregated Statistics For Year 2009 (Based on 11 full tracts) | ||||||||||||||
| A) FHA, FSA/RHS & VA Home Purchase Loans | B) Conventional Home Purchase Loans | C) Refinancings | D) Home Improvement Loans | E) Loans on Dwellings For 5+ Families | F) Non-occupant Loans on < 5 Family Dwellings (A B C & D) | G) Loans On Manufactured Home Dwelling (A B C & D) | ||||||||
|---|---|---|---|---|---|---|---|---|---|---|---|---|---|---|
| Number | Average Value | Number | Average Value | Number | Average Value | Number | Average Value | Number | Average Value | Number | Average Value | Number | Average Value | |
| LOANS ORIGINATED | 968 | $161,925 | 546 | $134,910 | 2,101 | $173,307 | 232 | $59,823 | 6 | $757,833 | 282 | $126,989 | 106 | $74,189 |
| APPLICATIONS APPROVED, NOT ACCEPTED | 30 | $164,100 | 49 | $127,163 | 165 | $171,982 | 23 | $81,565 | 0 | $0 | 16 | $115,875 | 20 | $57,750 |
| APPLICATIONS DENIED | 144 | $160,826 | 177 | $111,350 | 1,050 | $180,899 | 159 | $68,138 | 4 | $411,250 | 84 | $128,381 | 132 | $62,856 |
| APPLICATIONS WITHDRAWN | 91 | $171,967 | 46 | $150,478 | 649 | $193,593 | 29 | $90,966 | 0 | $0 | 30 | $150,600 | 12 | $95,000 |
| FILES CLOSED FOR INCOMPLETENESS | 23 | $139,217 | 13 | $139,077 | 142 | $185,415 | 4 | $82,250 | 0 | $0 | 7 | $184,000 | 8 | $108,000 |
| Private Mortgage Insurance Companies Aggregated Statistics For Year 2009 (Based on 11 full tracts) | ||||||
| A) Conventional Home Purchase Loans | B) Refinancings | C) Non-occupant Loans on < 5 Family Dwellings (A & B) | ||||
|---|---|---|---|---|---|---|
| Number | Average Value | Number | Average Value | Number | Average Value | |
| LOANS ORIGINATED | 34 | $192,206 | 43 | $210,744 | 3 | $246,667 |
| APPLICATIONS APPROVED, NOT ACCEPTED | 27 | $248,111 | 18 | $220,222 | 1 | $127,000 |
| APPLICATIONS DENIED | 7 | $180,000 | 16 | $212,812 | 1 | $146,000 |
| APPLICATIONS WITHDRAWN | 5 | $137,000 | 6 | $120,833 | 1 | $190,000 |
| FILES CLOSED FOR INCOMPLETENESS | 1 | $291,000 | 0 | $0 | 0 | $0 |
| Most common first names in Berkeley County, WV among deceased individuals | ||
| Name | Count | Lived (average) |
|---|---|---|
| John | 449 | 72.4 years |
| Mary | 434 | 78.0 years |
| Charles | 432 | 71.5 years |
| William | 394 | 72.7 years |
| James | 361 | 69.7 years |
| Robert | 328 | 70.9 years |
| George | 220 | 73.6 years |
| Harry | 186 | 74.2 years |
| Margaret | 157 | 77.1 years |
| Paul | 154 | 70.2 years |
| Most common last names in Berkeley County, WV among deceased individuals | ||
| Last name | Count | Lived (average) |
|---|---|---|
| Miller | 242 | 74.3 years |
| Smith | 119 | 72.1 years |
| Myers | 117 | 73.4 years |
| Johnson | 115 | 70.5 years |
| Brown | 111 | 73.2 years |
| Butts | 94 | 73.8 years |
| Mason | 81 | 75.1 years |
| Davis | 71 | 73.2 years |
| Grove | 65 | 74.9 years |
| Jones | 62 | 71.1 years |
| Businesses in Berkeley County, WV | ||||
| Name | Count | Name | Count | |
|---|---|---|---|---|
| 7-Eleven | 8 | Little Caesars Pizza | 1 | |
| AT&T | 4 | Long John Silver's | 1 | |
| Advance Auto Parts | 4 | Lowe's | 1 | |
| Applebee's | 1 | MasterBrand Cabinets | 5 | |
| Arby's | 2 | McDonald's | 5 | |
| AutoZone | 2 | Motel 6 | 1 | |
| Bath & Body Works | 1 | Nike | 2 | |
| Bed Bath & Beyond | 1 | OfficeMax | 1 | |
| Blockbuster | 1 | Outback | 1 | |
| Burger King | 4 | Outback Steakhouse | 1 | |
| CVS | 2 | Papa John's Pizza | 1 | |
| Carson Pirie Scott | 1 | Payless | 1 | |
| Chevrolet | 1 | Penske | 1 | |
| Chick-Fil-A | 1 | PetSmart | 1 | |
| Comfort Inn | 1 | Pizza Hut | 3 | |
| Comfort Suites | 1 | Popeyes | 1 | |
| Cracker Barrel | 1 | RadioShack | 1 | |
| DHL | 1 | Rite Aid | 2 | |
| Dairy Queen | 3 | Rodeway Inn | 1 | |
| Days Inn | 1 | Ruby Tuesday | 1 | |
| Deb | 1 | Rue21 | 1 | |
| Domino's Pizza | 4 | Sears | 3 | |
| Dunkin Donuts | 1 | Sprint Nextel | 4 | |
| FedEx | 12 | Staples | 1 | |
| Finish Line | 1 | Starbucks | 1 | |
| Ford | 1 | Subway | 11 | |
| GNC | 3 | T-Mobile | 2 | |
| GameStop | 3 | T.J.Maxx | 1 | |
| Goodwill | 1 | Taco Bell | 1 | |
| H&R Block | 3 | Target | 1 | |
| Hilton | 2 | Toyota | 1 | |
| Holiday Inn | 2 | U-Haul | 7 | |
| JCPenney | 1 | U.S. Cellular | 4 | |
| Jones New York | 1 | UPS | 10 | |
| KFC | 2 | Waffle House | 3 | |
| Kmart | 1 | Walgreens | 1 | |
| La-Z-Boy | 2 | Walmart | 2 | |
| Lane Furniture | 2 | Wendy's | 1 | |
Berkeley County on our top lists:
- #47 on the list of "Top 101 counties with the highest Particulate Matter (PM2.5) Annual air pollution readings in 2012 (µg/m3)"
- #48 on the list of "Top 101 counties with the largest number of people moving in compared to moving out (pop. 50,000+)"