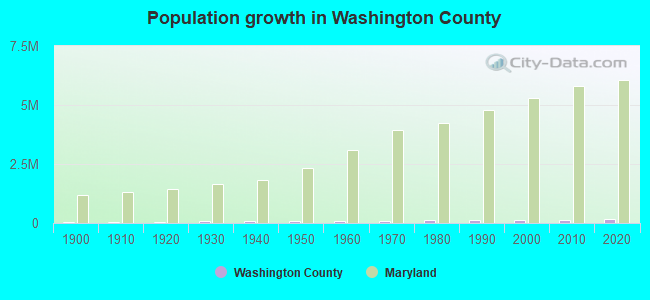
Washington County, Maryland (MD)
County owner-occupied free and clear houses and condos in 2010: 10,985
County owner-occupied houses and condos in 2000: 32,630
Renter-occupied apartments: 19,239 (it was 17,096 in 2000)
| % of renters here: | 34% |
| State: | 32% |
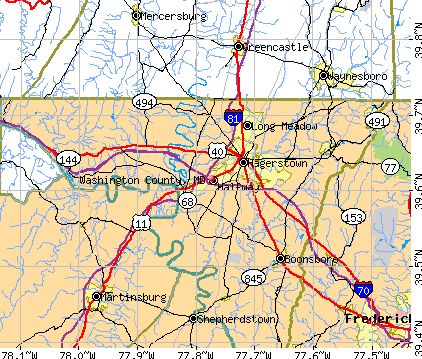
Land area: 458 sq. mi.
Water area: 9.4 sq. mi.
Population density: 340 people per square mile (high).
Industries providing employment: Educational, health and social services (22.1%), Professional, scientific, management, administrative, and waste management services (12.5%), Retail trade (11.9%).
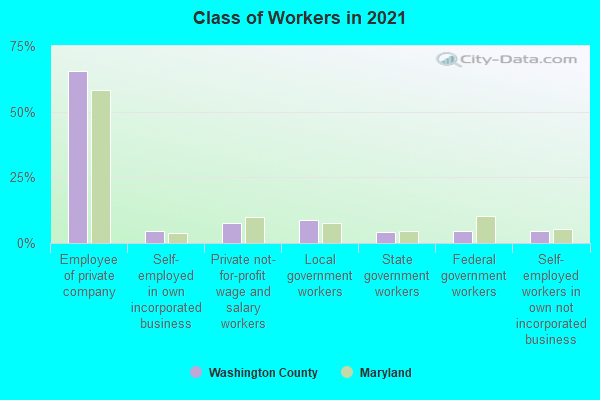
Type of workers:
- Private wage or salary: 76%
- Government: 19%
- Self-employed, not incorporated: 5%
- Unpaid family work: 0%
- OSM Map
- General Map
- Google Map
- MSN Map

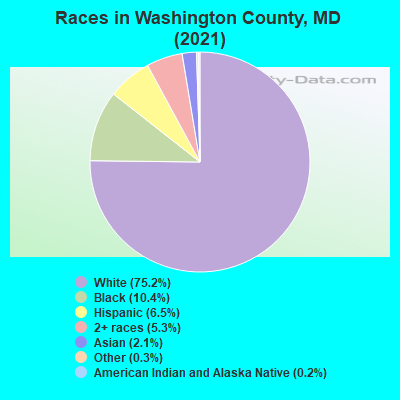
- 114,50273.6%White Non-Hispanic Alone
- 18,12411.6%Black Non-Hispanic Alone
- 11,2287.2%Hispanic or Latino
- 8,3075.3%Two or more races
- 2,5741.7%Asian alone
- 8250.5%Some other race alone
- 300.02%American Indian and Alaska Native alone
| Median resident age: | 41.5 years |
| Maryland median age: | 39.7 years |
| Males: 78,522 | |
| Females: 77,068 |


| Washington County: | 2.0 people |
| Maryland: | 3 people |
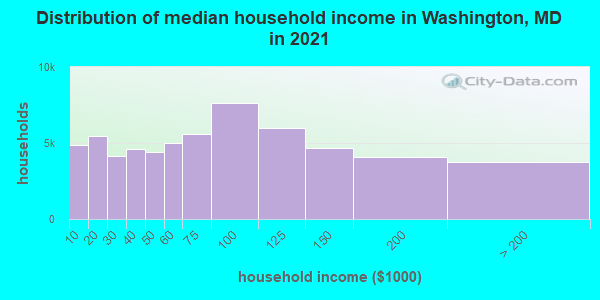
Estimated median household income in 2022: $69,244 ($40,617 in 1999)
| This county: | $69,244 |
| Maryland: | $94,991 |
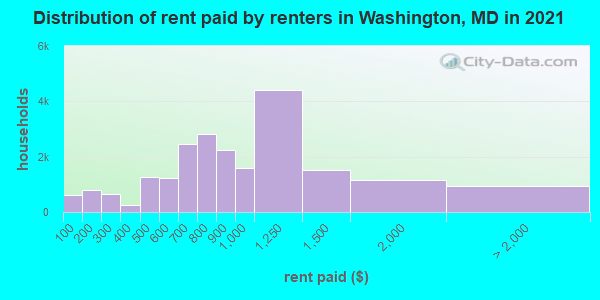
Median contract rent in 2022 for apartments: $824 (lower quartile is $604, upper quartile is $1,073)
| This county: | $824 |
| State: | $1388 |
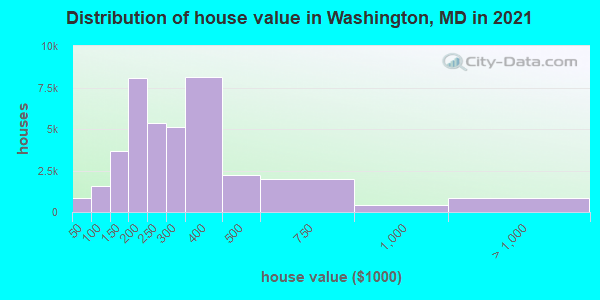
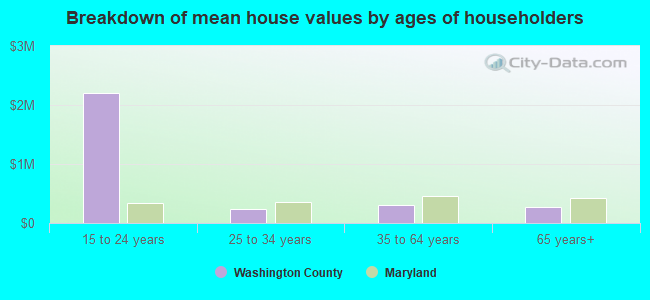
Estimated median house or condo value in 2022: $283,600 (it was $113,500 in 2000)
| Washington: | $283,600 |
| Maryland: | $398,100 |
Mean price in 2022:
Median monthly housing costs for homes and condos with a mortgage: $1,430Detached houses: $319,990
Here: $319,990 State: $526,819 Townhouses or other attached units: $236,260
Here: $236,260 State: $328,305 In 2-unit structures: $528,214
Here: $528,214 State: $346,599 In 3-to-4-unit structures: $218,469
Here: $218,469 State: $295,378 In 5-or-more-unit structures: $125,300
Here: $125,300 State: $350,378 Mobile homes: $118,381
Here: $118,381 State: $89,353
Median monthly housing costs for units without a mortgage: $492
Institutionalized population: 7,731
Crime in 2020 (reported by the sheriff's office or county police, not the county total):
- Murders: 4
- Rapes: 7
- Robberies: 6
- Assaults: 94
- Burglaries: 71
- Thefts: 201
- Auto thefts: 8
Crime in 2019 (reported by the sheriff's office or county police, not the county total):
- Murders: 0
- Rapes: 19
- Robberies: 30
- Assaults: 205
- Burglaries: 261
- Thefts: 787
- Auto thefts: 33
Health of residents in Washington County based on CDC Behavioral Risk Factor Surveillance System Survey Questionnaires from 2013 to 2021:
General health status score of residents in this county from 1 (poor) to 5 (excellent) is 3.4. This is worse than average.68.5% of residents exercised in the past month. This is less than average.
46.9% of residents smoked 100+ cigarettes in their lives. This is about average.
42.5% of adult residents drank alcohol in the past 30 days. This is less than average.
65.4% of residents visited a dentist within the past year. This is less than average.
Average weight of males is 204 pounds. This is more than average.
Average weight of females is 168 pounds. This is more than average.
Health of residents in Washington County based on CDC Behavioral Risk Factor Surveillance System Survey Questionnaires from 2003 to 2012:
General health status score of residents in this county from 1 (poor) to 5 (excellent) is 3.5. This is about average.70.0% of residents exercised in the past month. This is less than average.
45.4% of residents smoked 100+ cigarettes in their lives. This is about average.
77.9% of adult residents drank alcohol in the past 30 days. This is about average.
71.6% of residents visited a dentist within the past year. This is about average.
Average weight of males is 198 pounds. This is about average.
Average weight of females is 161 pounds. This is about average.
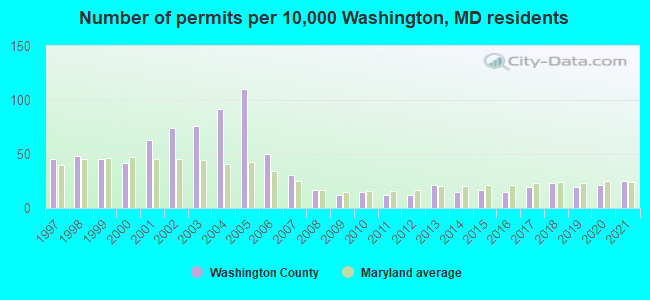
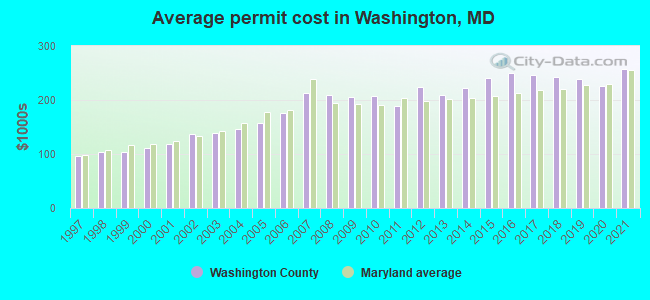
Single-family new house construction building permits:
- 2022: 311 buildings, average cost: $263,200
- 2021: 330 buildings, average cost: $257,200
- 2020: 282 buildings, average cost: $224,800
- 2019: 245 buildings, average cost: $238,900
- 2018: 306 buildings, average cost: $242,200
- 2017: 246 buildings, average cost: $246,200
- 2016: 194 buildings, average cost: $249,900
- 2015: 218 buildings, average cost: $241,400
- 2014: 194 buildings, average cost: $222,400
- 2013: 277 buildings, average cost: $208,700
- 2012: 163 buildings, average cost: $224,300
- 2011: 160 buildings, average cost: $189,300
- 2010: 194 buildings, average cost: $207,100
- 2009: 163 buildings, average cost: $205,300
- 2008: 225 buildings, average cost: $210,200
- 2007: 407 buildings, average cost: $213,100
- 2006: 661 buildings, average cost: $175,600
- 2005: 1447 buildings, average cost: $157,400
- 2004: 1211 buildings, average cost: $145,600
- 2003: 1001 buildings, average cost: $138,100
- 2002: 978 buildings, average cost: $137,100
- 2001: 834 buildings, average cost: $119,100
- 2000: 559 buildings, average cost: $110,700
- 1999: 594 buildings, average cost: $102,500
- 1998: 638 buildings, average cost: $104,000
- 1997: 589 buildings, average cost: $96,000
Median real estate property taxes paid for housing units with mortgages in 2022: $2,182 (0.8%)
Median real estate property taxes paid for housing units with no mortgage in 2022: $2,271 (0.8%)
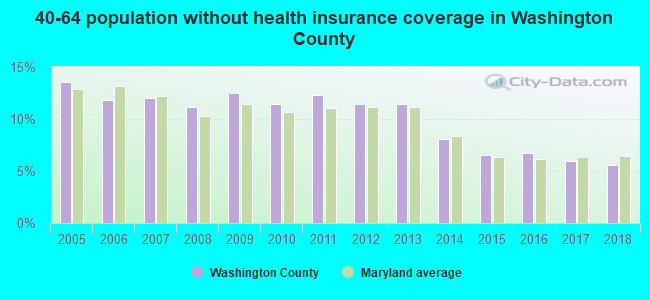
| Washington County: | 11.6% |
| Maryland: | 9.6% |
Median age of residents in 2022: 41.5 years old
(Males: 39.8 years old, Females: 42.3 years old)
(Median age for: White residents: 46.4 years old, Black residents: 33.5 years old, American Indian residents: 32.7 years old, Asian residents: 43.5 years old, Hispanic or Latino residents: 23.0 years old, Other race residents: 32.0 years old)
Area name: Hagerstown-Martinsburg, MD-WV MSA
Fair market rent in 2006 for a 1-bedroom apartment in Washington County is $506 a month.
Fair market rent for a 2-bedroom apartment is $629 a month.
Fair market rent for a 3-bedroom apartment is $874 a month.
Cities in this county include: Hagerstown, District 10, Funkstown, Halfway, District 3, Hagerstown, District 25, Hagerstown, District 17, Hagerstown, District 21, Hagerstown, District 22, Hagerstown, Robinwood, Fountainhead-Orchard Hills.
2023 air pollution in Washington County:
Ozone (1-hour): 0.034 ppm (standard limit: 0.12 ppm). Near U.S. average.
Notable locations in this county outside city limits:
Notable locations in Washington County: Cecil County Dragway (A), Camp Rodney (B), Cassidy Wharf (C), Cecil County Central Landfill (D), College Green (E), Conowingo Station (F), Kincaid Farm (G), Meadows Farm (H), Chestnut Lane Farms (I), Rumbleway Farm (J), Tosh Farms (K), Spring Fed Farm (L), Orrs Acres (M), Ford Farms (N), England Farms (O), Pleasant View Farms (P), Albeck Farms (Q), Long Green Farms (R), Wil-O-Mar Farms (S), Quiet Acres Farm (T). Display/hide their locations on the map
Shopping Center: Northeast Plaza Shopping Center (1). Display/hide its location on the map
Churches in Washington County include: Asbury United Methodist Church (A), Bethel United Methodist Church (B), Big Elk Chapel (C), Baptist Bible Church (D), Bethel Lutheran Church (E), Boulden Chapel (F), Brick Meeting House (G), Calvary Missionary Baptist Church (H), Charlestown Baptist Church (I). Display/hide their locations on the map
Cemeteries: Rosebank Cemetery (1), Boot Hill Cemetery (2), Immaculate Conception Cemetery (3), Leeds Cemetery (4), Veazey Cemetery (5), Krauss Cemetery (6), Sharpes Cemetery (7). Display/hide their locations on the map
Lakes and reservoirs: Mill Pond (A), Metton Pond (B), Perryville Reservoir (C), Plum Creek Pond (D), Rising Sun Community Pond (E), Mason-Dixon Sand and Gravel Reservoir (F), Stancill Incorporated Reservoir (G), Rising Sun Reservoir (H). Display/hide their locations on the map
Streams, rivers, and creeks: Great Bohemia Creek (A), Perch Creek (B), Hen Island Creek (C), Bohemia River (D), Muddy Creek (E), Octoraro Creek (F), Basin Run (G), Cabin John Creek (H), Pearce Creek (I). Display/hide their locations on the map
Parks in Washington County include: Grove Point Wildlife Sanctuary (1), Plumpton Park Zoological Gardens (2), Courthouse Point Managed Hunting Area (3), Earleville Wildlife Management Area (4), Elk Forest Wildlife Management Area (5), Spot Rock Park (6), Stubbs Hill Regional Park (7), Fair Hill Natural Resource Management Area (8), Susquehanna State Park (9). Display/hide their locations on the map
Neighboring counties: Chester County, Pennsylvania  , Monongalia County, West Virginia
  , Ritchie County, West Virginia , Logan County, Illinois , Lewis County, Missouri .
| Here: | 2.2% |
| Maryland: | 2.0% |
Current college students: 4,852
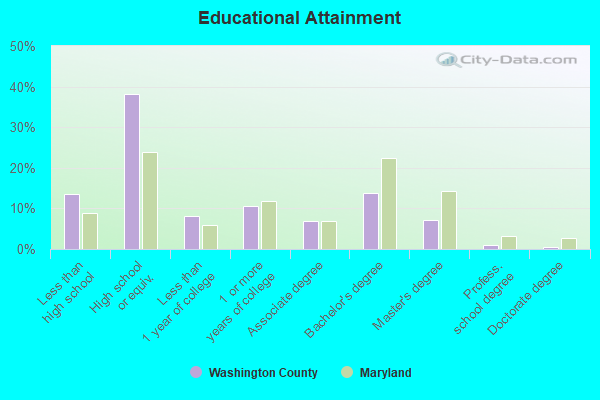
People 25 years of age or older with a high school degree or higher: 89.0%
People 25 years of age or older with a bachelor's degree or higher: 25.0%
Number of foreign born residents: 8,663 (50.2% naturalized citizens)
| Washington County: | 5.6% |
| Whole state: | 16.7% |
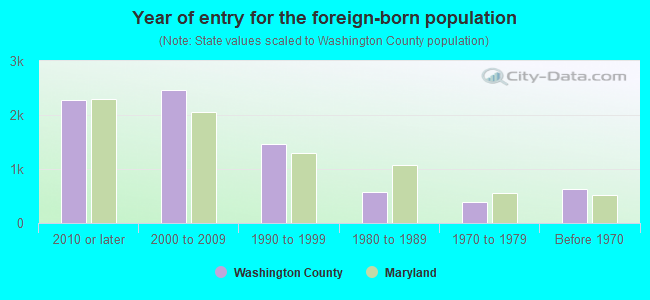
- Year of entry for the foreign-born population
- 3,0792010 or later
- 2,3502000 to 2009
- 1,5851990 to 1999
- 5731980 to 1989
- 3921970 to 1979
- 626Before 1970
Mean travel time to work (commute): minutes
Percentage of county residents living and working in this county: 86.0%
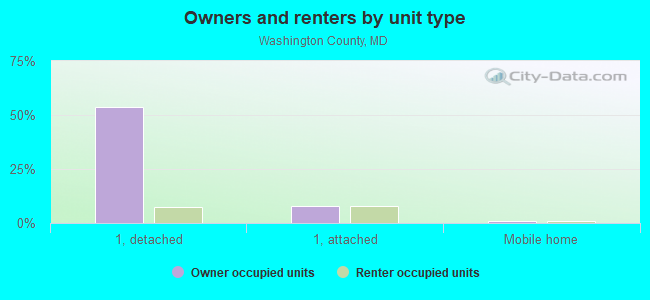
Housing units in structures:
- One, detached: 38,905
- One, attached: 9,968
- Two: 2,614
- 3 or 4: 2,894
- 5 to 9: 3,842
- 10 to 19: 2,278
- 20 to 49: 851
- 50 or more: 1,284
- Mobile homes: 1,476
Housing units in Washington County with a mortgage: 23,071 (1,932 second mortgage, 0 home equity loan, 1,816 both second mortgage and home equity loan)
Houses without a mortgage: 1,291
| Here: | 95.8% with mortgage |
| State: | 97.5% with mortgage |
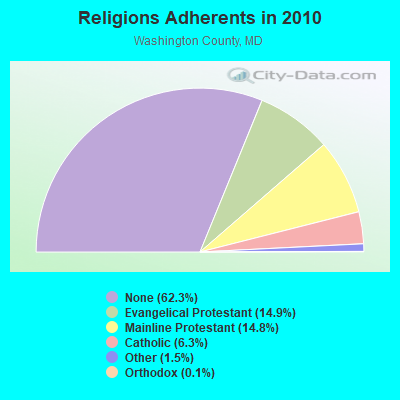
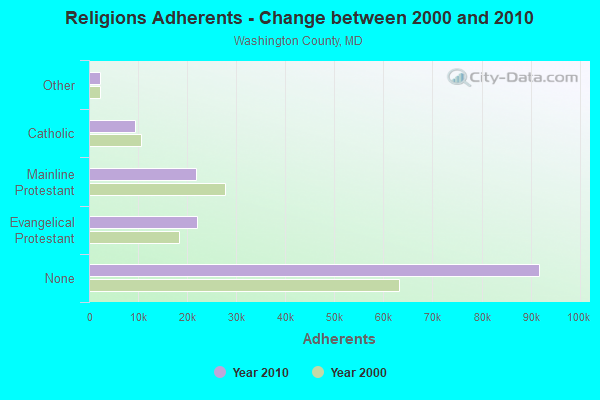
Religion statistics for Washington County
| Religion | Adherents | Congregations |
|---|---|---|
| Evangelical Protestant | 21,941 | 117 |
| Mainline Protestant | 21,837 | 79 |
| Catholic | 9,350 | 8 |
| Other | 2,244 | 11 |
| Orthodox | 163 | 2 |
| Black Protestant | 97 | 2 |
| None | 91,798 | - |
Source: Clifford Grammich, Kirk Hadaway, Richard Houseal, Dale E.Jones, Alexei Krindatch, Richie Stanley and Richard H.Taylor. 2012. 2010 U.S.Religion Census: Religious Congregations & Membership Study. Association of Statisticians of American Religious Bodies. Jones, Dale E., et al. 2002. Congregations and Membership in the United States 2000. Nashville, TN: Glenmary Research Center.
Food Environment Statistics:
| Washington County: | 1.73 / 10,000 pop. |
| State: | 1.96 / 10,000 pop. |
| Here: | 0.14 / 10,000 pop. |
| Maryland: | 0.07 / 10,000 pop. |
| This county: | 1.04 / 10,000 pop. |
| Maryland: | 1.22 / 10,000 pop. |
| Washington County: | 2.83 / 10,000 pop. |
| Maryland: | 2.05 / 10,000 pop. |
| This county: | 6.43 / 10,000 pop. |
| State: | 5.40 / 10,000 pop. |
| Washington County: | 10.2% |
| Maryland: | 9.1% |
| Washington County: | 28.8% |
| State: | 26.7% |
| Here: | 12.9% |
| State: | 15.5% |
Agriculture in Washington County:
Average size of farms: 161 acresAverage value of agricultural products sold per farm: $76,874
Average value of crops sold per acre for harvested cropland: $151.02
The value of nursery, greenhouse, floriculture, and sod as a percentage of the total market value of agricultural products sold: 2.32%
The value of livestock, poultry, and their products as a percentage of the total market value of agricultural products sold: 81.42%
Average total farm production expenses per farm: $65,928
Harvested cropland as a percentage of land in farms: 58.57%
Average market value of all machinery and equipment per farm: $69,730
The percentage of farms operated by a family or individual: 89.42%
Average age of principal farm operators: 54 years
Average number of cattle and calves per 100 acres of all land in farms: 34.10
Milk cows as a percentage of all cattle and calves: 37.96%
Corn for grain: 14014 harvested acres
All wheat for grain: 5044 harvested acres
Soybeans for beans: 9932 harvested acres
Vegetables: 504 harvested acres
Land in orchards: 1,849 acres
Tornado activity:
Washington County historical area-adjusted tornado activity is significantly below Maryland state average. It is 3307450.0 times below overall U.S. average.Tornadoes in this county have caused 2 injuries recorded between 1950 and 2004.
On 5/15/1981, a category 2 (max. wind speeds 113-157 mph) tornado injured 2 people and caused between $500,000 and $5,000,000 in damages.
Earthquake activity:
Washington County-area historical earthquake activity is significantly above Maryland state average. It is 55% smaller than the overall U.S. average.On 8/23/2011 at 17:51:04, a magnitude 5.8 (5.8 MW, Depth: 3.7 mi, Class: Moderate, Intensity: VI - VII) earthquake occurred 118.3 miles away from Washington County center
On 9/25/1998 at 19:52:52, a magnitude 5.2 (4.8 MB, 4.3 MS, 5.2 LG, 4.5 MW, Depth: 3.1 mi) earthquake occurred 189.3 miles away from the county center
On 1/16/1994 at 01:49:16, a magnitude 4.6 (4.6 MB, 4.6 LG, Depth: 3.1 mi, Class: Light, Intensity: IV - V) earthquake occurred 104.5 miles away from the county center
On 8/25/2011 at 05:07:52, a magnitude 4.5 (4.5 ML, Depth: 4.2 mi) earthquake occurred 115.8 miles away from the county center
On 1/31/1986 at 16:46:43, a magnitude 5.0 (5.0 MB) earthquake occurred 224.7 miles away from Washington County center
On 12/9/2003 at 20:59:18, a magnitude 4.5 (4.5 ML, Depth: 6.2 mi) earthquake occurred 128.5 miles away from the county center
Magnitude types: regional Lg-wave magnitude (LG), body-wave magnitude (MB), local magnitude (ML), surface-wave magnitude (MS), moment magnitude (MW)
Most recent natural disasters:
- Maryland Covid-19 Pandemic, Incident Period: January 20, 2020, Major Disaster (Presidential) Declared DR-4491-MD: March 26, 2020, FEMA Id: 4491, Natural disaster type: Other
- Maryland Severe Storms And Flooding, Incident Period: May 15, 2018 - May 19, 2018, FEMA Id: 4374, Natural disaster type: Storm, Flood
- Maryland Severe Winter Storm and Snowstorm, Incident Period: January 22, 2016 to January 23, 2016, Major Disaster (Presidential) Declared DR-4261: March 04, 2016, FEMA Id: 4261, Natural disaster type: Snowstorm, Winter Storm
- Maryland Hurricane Sandy, Incident Period: October 26, 2012 to November 08, 2012, Emergency Declared EM-3349: October 28, 2012, FEMA Id: 3349, Natural disaster type: Hurricane
- Maryland Hurricane Sandy, Incident Period: October 26, 2012 to November 04, 2012, Major Disaster (Presidential) Declared DR-4091: November 20, 2012, FEMA Id: 4091, Natural disaster type: Hurricane
- Maryland Hurricane Irene, Incident Period: August 26, 2011 to September 05, 2011, Emergency Declared EM-3335: August 27, 2011, FEMA Id: 3335, Natural disaster type: Hurricane
- Maryland Severe Winter Storms and Snowstorms, Incident Period: February 05, 2010 to February 11, 2010, Major Disaster (Presidential) Declared DR-1910: May 06, 2010, FEMA Id: 1910, Natural disaster type: Snowstorm, Winter Storm
- Maryland Hurricane Katrina Evacuation, Incident Period: August 29, 2005 to October 01, 2005, Emergency Declared EM-3251: September 13, 2005, FEMA Id: 3251, Natural disaster type: Hurricane
- Maryland Hurricane Isabel, Incident Period: September 18, 2003 to September 29, 2003, Major Disaster (Presidential) Declared DR-1492: September 19, 2003, FEMA Id: 1492, Natural disaster type: Hurricane
- Maryland Snowstorm, Incident Period: February 14, 2003 to February 23, 2003, Emergency Declared EM-3179: March 14, 2003, FEMA Id: 3179, Natural disaster type: Snowstorm
- 5 other natural disasters have been reported since 1953.
The number of natural disasters in Washington County (15) is near the US average (15).
Major Disasters (Presidential) Declared: 9
Emergencies Declared: 5
Causes of natural disasters: Hurricanes: 5, Floods: 3, Snowstorms: 3, Winter Storms: 3, Blizzard: 1, Heavy Rain: 1, Snowfall: 1, Storm: 1, Tropical Storm: 1, Other: 1 (Note: some incidents may be assigned to more than one category).
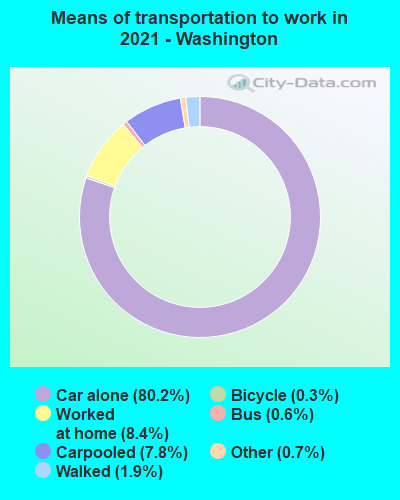
Means of transportation to work:
- Drove a car alone: 54,342 (74.7%)
- Carpooled: 5,682 (7.8%)
- Bus: 434 (0.6%)
- Long-distance train or commuter rail: 19 (0.0%)
- Ferryboat: 27 (0.0%)
- Taxicab, motorcycle, or other means: 698 (1.0%)
- Bicycle: 228 (0.3%)
- Walked: 964 (1.3%)
- Worked at home: 9,188 (12.6%)
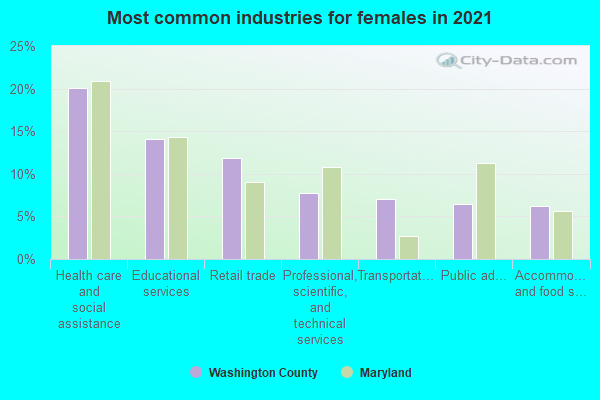
- Health care and social assistance (25%)
- Educational services (11%)
- Retail trade (10%)
- Professional, scientific, and technical services (7%)
- Public administration (7%)
- Finance and insurance (5%)
- Accommodation and food services (5%)
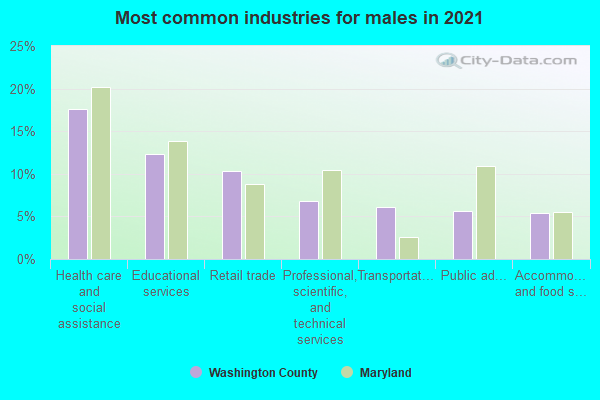
- Health care and social assistance (28%)
- Educational services (12%)
- Retail trade (11%)
- Professional, scientific, and technical services (8%)
- Public administration (8%)
- Finance and insurance (6%)
- Accommodation and food services (5%)
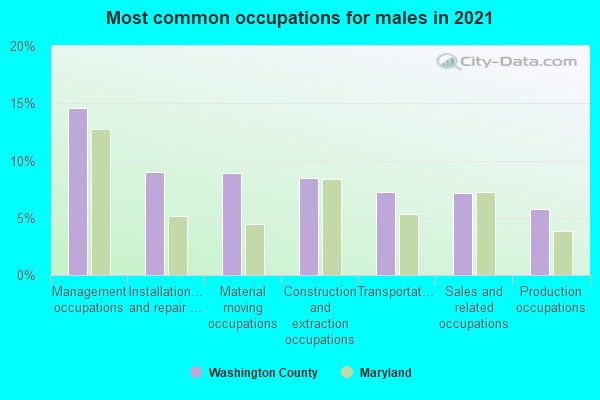
- Management occupations (10%)
- Material moving occupations (9%)
- Construction and extraction occupations (9%)
- Sales and related occupations (8%)
- Installation, maintenance, and repair occupations (6%)
- Computer and mathematical occupations (6%)
- Production occupations (6%)
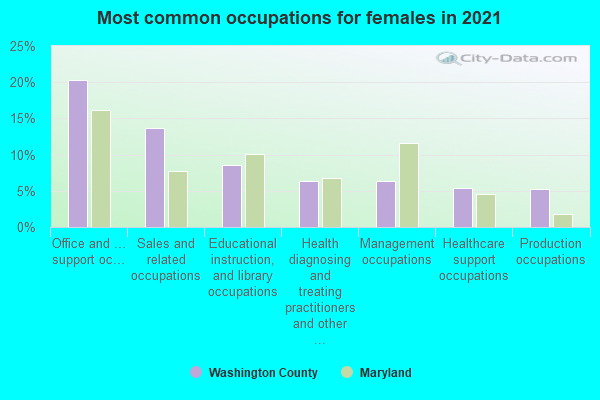
- Office and administrative support occupations (18%)
- Sales and related occupations (10%)
- Educational instruction, and library occupations (10%)
- Management occupations (9%)
- Food preparation and serving related occupations (8%)
- Health diagnosing and treating practitioners and other technical occupations (7%)
- Healthcare support occupations (7%)
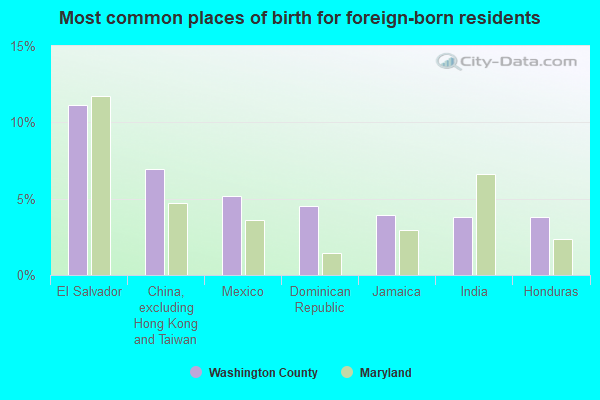
- El Salvador (11%)
- China, excluding Hong Kong and Taiwan (6%)
- Mexico (6%)
- Dominican Republic (5%)
- Jamaica (4%)
- Africa, n.e.c. (4%)
- Honduras (3%)
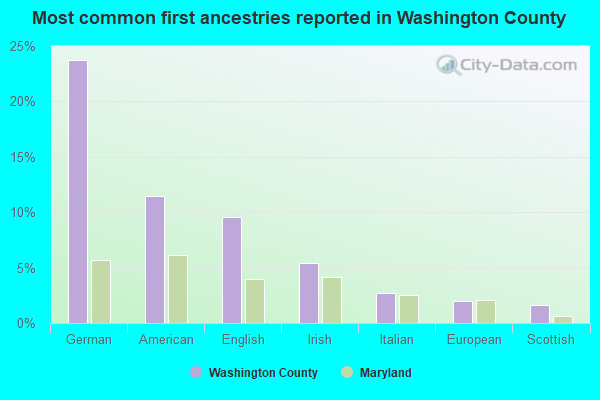
- German (22%)
- American (11%)
- English (10%)
- Irish (6%)
- Italian (3%)
- European (2%)
- Scottish (2%)
People in group quarters in Washington County, Maryland in 2010:
- 6,138 people in state prisons
- 1,005 people in nursing facilities/skilled-nursing facilities
- 434 people in local jails and other municipal confinement facilities
- 335 people in group homes intended for adults
- 142 people in emergency and transitional shelters (with sleeping facilities) for people experiencing homelessness
- 122 people in college/university student housing
- 97 people in group homes for juveniles (non-correctional)
- 57 people in residential treatment centers for adults
- 26 people in correctional facilities intended for juveniles
- 21 people in other noninstitutional facilities
- 18 people in residential treatment centers for juveniles (non-correctional)
- 17 people in workers' group living quarters and job corps centers
- 13 people in hospitals with patients who have no usual home elsewhere
People in group quarters in Washington County, Maryland in 2000:
- 6,938 people in state prisons
- 1,131 people in nursing homes
- 333 people in local jails and other confinement facilities (including police lockups)
- 288 people in homes for the mentally retarded
- 237 people in other noninstitutional group quarters
- 114 people in other group homes
- 110 people in wards in general hospitals for patients who have no usual home elsewhere
- 86 people in other nonhousehold living situations
- 41 people in schools, hospitals, or wards for the intellectually disabled
- 36 people in training schools for juvenile delinquents
- 30 people in homes or halfway houses for drug/alcohol abuse
- 24 people in college dormitories (includes college quarters off campus)
- 20 people in hospitals/wards and hospices for chronically ill
- 20 people in other hospitals or wards for chronically ill
- 19 people in homes for the mentally ill
- 5 people in religious group quarters
- 5 people in agriculture workers' dormitories on farms
- 3 people in other workers' dormitories
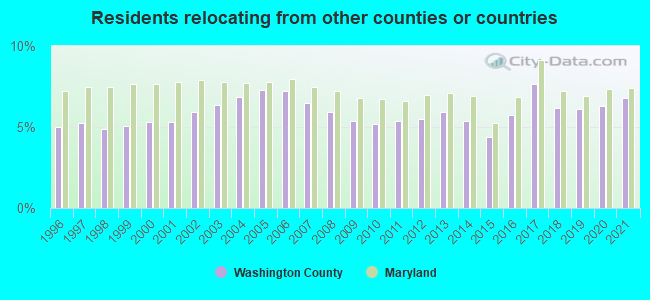
6.77% of this county's 2021 resident taxpayers lived in other counties in 2020 ($53,136 average adjusted gross income)
| Here: | 6.77% |
| Maryland average: | 7.42% |
10 or fewer of this county's residents moved from foreign countries.
3.51% relocated from other counties in Maryland ($28,223 average AGI)
3.26% relocated from other states ($24,913 average AGI)
Washington County: 3.26% Maryland average: 3.41%
Top counties from which taxpayers relocated into this county between 2020 and 2021:
| from Frederick County, MD | |
| from Montgomery County, MD | |
| from Franklin County, PA | |
| from Berkeley County, WV | |
| from Prince George's County, MD | |
| from Anne Arundel County, MD | |
| from Baltimore County, MD |
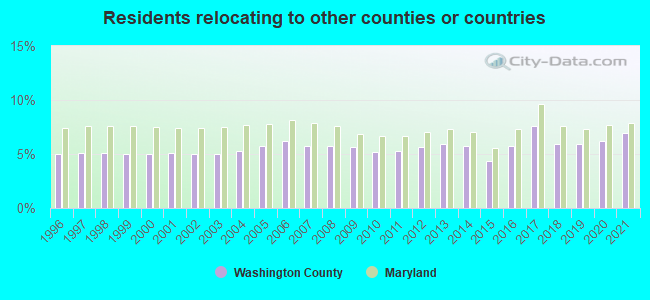
6.90% of this county's 2020 resident taxpayers moved to other counties in 2021 ($51,491 average adjusted gross income)
| Here: | 6.90% |
| Maryland average: | 7.91% |
10 or fewer of this county's residents moved to foreign countries.
2.39% relocated to other counties in Maryland ($15,377 average AGI)
4.51% relocated to other states ($36,114 average AGI)
Washington County: 4.51% Maryland average: 3.93%
Top counties to which taxpayers relocated from this county between 2020 and 2021:
| to Frederick County, MD | |
| to Berkeley County, WV | |
| to Franklin County, PA | |
| to Baltimore city, MD | |
| to Montgomery County, MD | |
| to Baltimore County, MD | |
| to Prince George's County, MD |
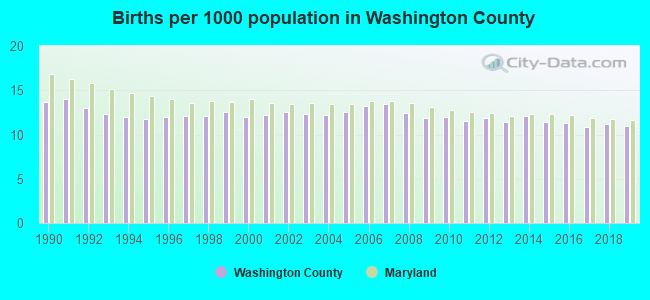
Births per 1000 population from 1990 to 1999: 12.6
Births per 1000 population from 2000 to 2009: 12.5
Births per 1000 population from 2010 to 2022: 9.7
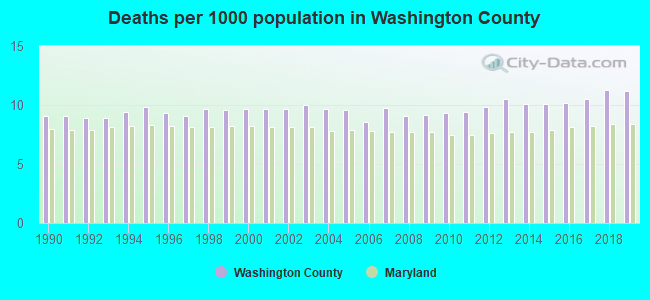
Deaths per 1000 population from 1990 to 1999: 9.3
Deaths per 1000 population from 2000 to 2009: 9.5
Deaths per 1000 population from 2010 to 2020: 10.5
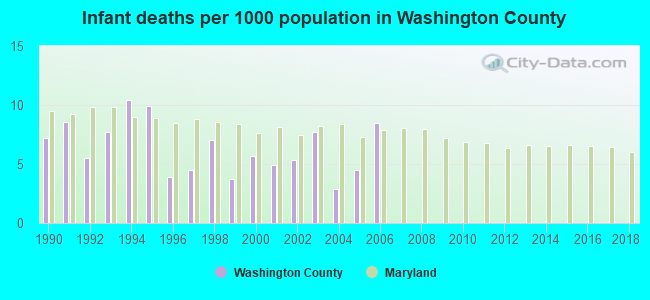
Infant deaths per 1000 live births from 1990 to 1999: 6.8
Infant deaths per 1000 live births from 2000 to 2006: 5.6
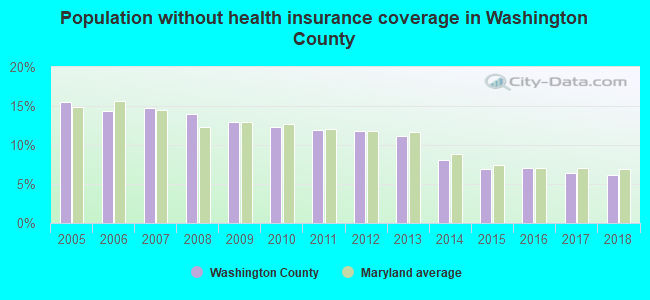
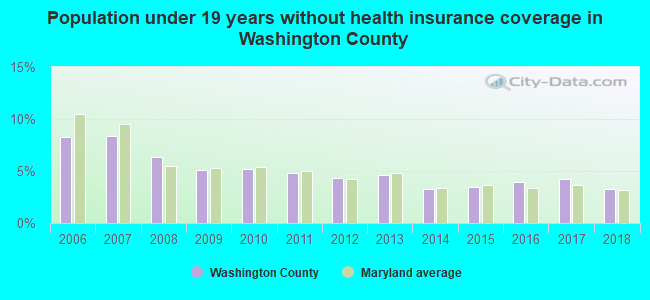
Persons under 19 years old without health insurance coverage in 2018: 3.3%

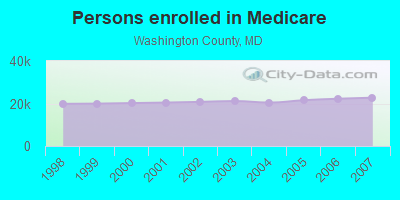
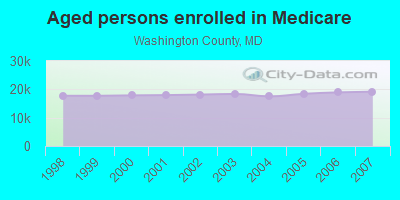
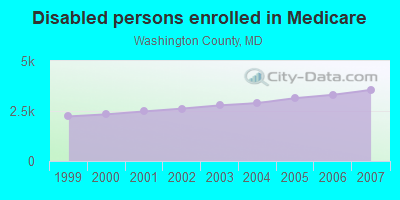
Persons enrolled in hospital insurance and/or supplemental medical insurance (Medicare) in July 1, 2007: 22,740 (19,180 aged, 3,560 disabled)
Children under 18 without health insurance coverage in 2007: 3,465 (10%)
Most common underlying causes of death in Washington County, Maryland in 1999 - 2019:
- Atherosclerotic heart disease (1,886)
- Bronchus or lung, unspecified - Malignant neoplasms (1,866)
- Acute myocardial infarction, unspecified (1,703)
- Atherosclerotic cardiovascular disease, so described (1,381)
- Chronic obstructive pulmonary disease, unspecified (1,365)
- Unspecified dementia (1,151)
- Stroke, not specified as haemorrhage or infarction (799)
- Unspecified diabetes mellitus, without complications (691)
- Alzheimer disease, unspecified (642)
- Hypertensive heart disease without (congestive) heart failure (579)
Population without health insurance coverage in 2000: 10%
Children under 18 without health insurance coverage in 2000: 8%
Short term general hospital admissions per 100,000 population in 2004: 11,414
Short term general hospital beds per 100,000 population in 2004: 244
Emergency room visits per 100,000 population in 2004: 47,866
General practice office based MDs per 100,000 population in 2005: 1,211
Medical specialist MDs per 100,000 population in 2005: 973
Dentists per 100,000 population in 1998: 26
Total births per 100,000 population, July 2005 - July 2006 : 41
Total deaths per 100,000 population, July 2005 - July 2006: 82
Limited-service eating places per 100,000 population in 2005 : 14
Beer, wine & liquor stores per 100,000 population in 2005: 1
Homicides per 1,000,000 population from 2000 to 2006: 25.0. This is less than state average.
Suicides per 1,000,000 population from 2000 to 2006: 119.9. This is more than state average.
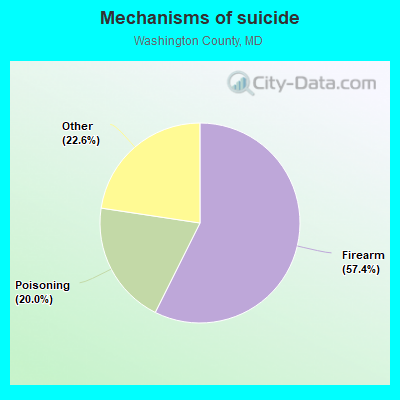
- Firearm - 68.8
- Poisoning - 24.0
- Other - 27.1
Household type by relationship:
Households: 155,590- Male householders: 28,771 (7,237 living alone), Female householders: 30,759 (9,797 living alone)
27,566 spouses (27,509 opposite-sex spouses), 4,911 unmarried partners, (4,528 opposite-sex unmarried partners), 40,569 children (37,880 natural, 875 adopted, 1,814 stepchildren), 5,304 grandchildren, 1,319 brothers or sisters, 2,558 parents, 0 foster children, 1,554 other relatives, 5,289 non-relatives
- In group quarters: 6,990
Size of family households: 17,913 2-persons, 8,933 3-persons, 6,826 4-persons, 3,006 5-persons, 1,157 6-persons, 517 7-or-more-persons.
Size of nonfamily households: 17,034 1-person, 3,605 2-persons, 176 3-persons, 312 4-persons, 51 6-persons.
17,688 married couples with children.
9,371 single-parent households (1,331 men, 8,040 women).
90.8% of residents of Washington speak English at home.
4.9% of residents speak Spanish at home (60% speak English very well, 21% speak English well, 15% speak English not well, 4% don't speak English at all).
1.8% of residents speak other Indo-European language at home (82% speak English very well, 11% speak English well, 7% speak English not well, 1% don't speak English at all).
0.9% of residents speak Asian or Pacific Island language at home (57% speak English very well, 32% speak English well, 11% speak English not well).
0.9% of residents speak other language at home (86% speak English very well, 11% speak English well, 3% speak English not well).
In fiscal year 2004:
Federal Government expenditure: $721,736,000 ($5,169 per capita)
Department of Defense expenditure: $47,770,000
Federal direct payments to individuals for retirement and disability: $344,343,000
Federal other direct payments to individuals: $148,048,000
Federal direct payments not to individuals: $4,573,000
Federal grants: $134,076,000
Federal procurement contracts: $54,987,000 ($26,293,000 Department of Defense)
Federal salaries and wages: $35,709,000 ($4,677,000 Department of Defense)
Federal Government direct loans: $8,370,000
Federal guaranteed/insured loans: $132,005,000
Federal Government insurance: $41,814,000
Population change from April 1, 2000 to July 1, 2005:
Births: 8,653| Here: | 61 per 1000 residents |
| State: | 71 per 1000 residents |
Deaths: 6,865
| Here: | 48 per 1000 residents |
| State: | 41 per 1000 residents |
Net international migration: +419
| Here: | +3 per 1000 residents |
| State: | +19 per 1000 residents |
Net internal migration: +7,944
| Here: | +56 per 1000 residents |
| State: | +2 per 1000 residents |
Total withdrawal of fresh water for public supply: 13.88 millions of gallons per day (9% from ground, 91% from surface)
| Here: | 6.7 |
| State: | 7.3 |
| Here: | 4.8 |
| State: | 4.2 |
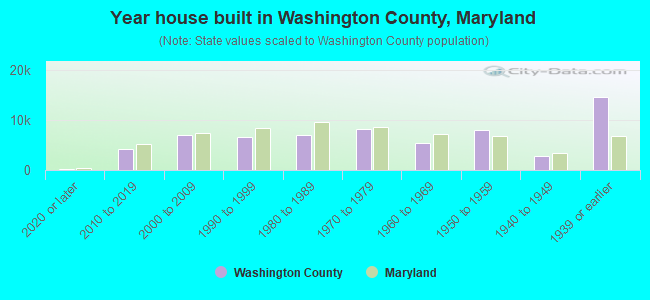
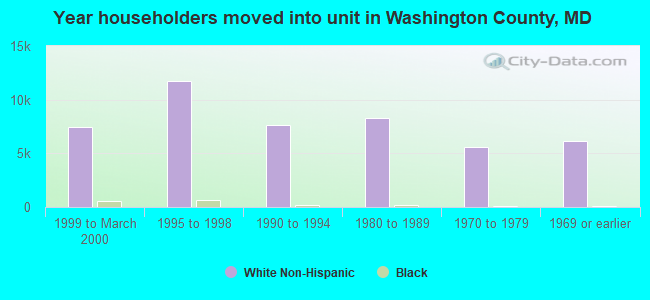
- Year house built in Washington County, Maryland
- 4592020 or later
- 3,4222010 to 2019
- 8,9582000 to 2009
- 6,5221990 to 1999
- 6,9261980 to 1989
- 7,8521970 to 1979
- 6,6651960 to 1969
- 5,8061950 to 1959
- 3,6191940 to 1949
- 13,8831939 or earlier
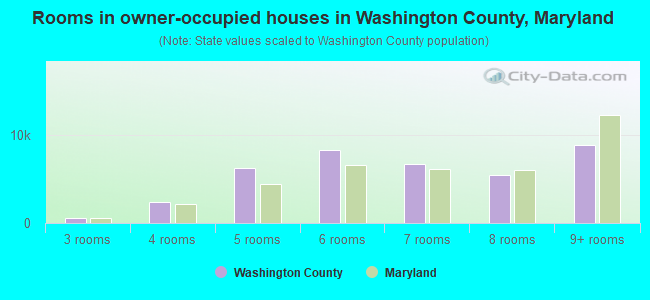
- Rooms in owner-occupied houses in Washington County, Maryland
- 531 room
- 472 rooms
- 3413 rooms
- 1,8934 rooms
- 6,5075 rooms
- 9,0276 rooms
- 5,1297 rooms
- 4,6428 rooms
- 10,1859+ rooms
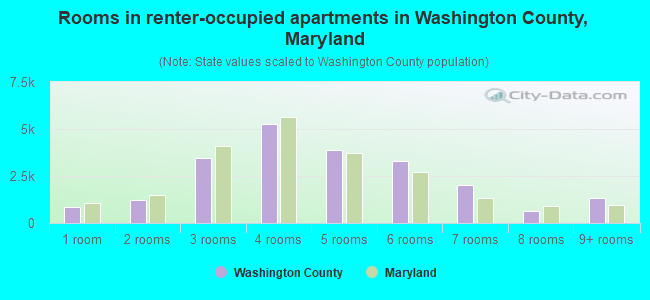
- Rooms in renter-occupied apartments in Washington County, Maryland
- 2791 room
- 4362 rooms
- 3,4253 rooms
- 4,6874 rooms
- 5,9435 rooms
- 3,4676 rooms
- 1,2617 rooms
- 1,0658 rooms
- 1,1439+ rooms
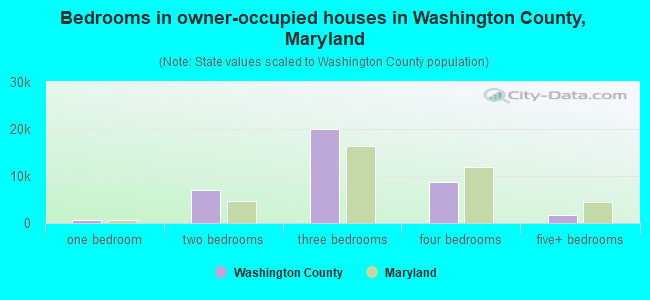
- Bedrooms in owner-occupied houses in Washington County, Maryland
- 53no bedroom
- 3971 bedroom
- 6,4192 bedrooms
- 20,0713 bedrooms
- 8,0194 bedrooms
- 2,8655+ bedrooms
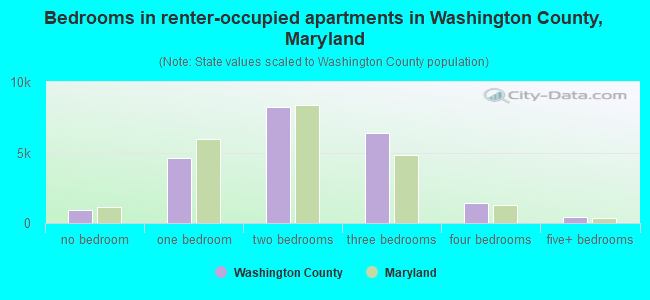
- Bedrooms in renter-occupied apartments in Washington County, Maryland
- 634no bedroom
- 3,7201 bedroom
- 8,9662 bedrooms
- 6,2403 bedrooms
- 1,3824 bedrooms
- 7645+ bedrooms
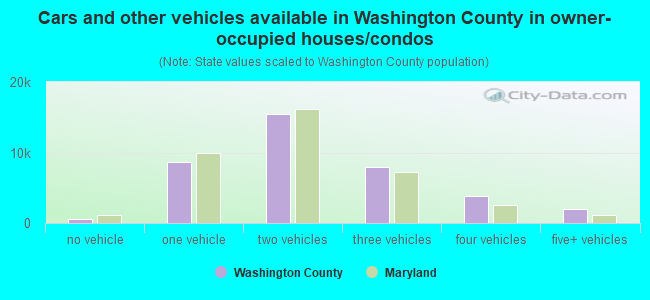
- Cars and other vehicles available in Washington County in owner-occupied houses/condos
- 732no vehicle
- 7,9271 vehicle
- 16,8152 vehicles
- 8,0933 vehicles
- 2,8554 vehicles
- 1,4025+ vehicles
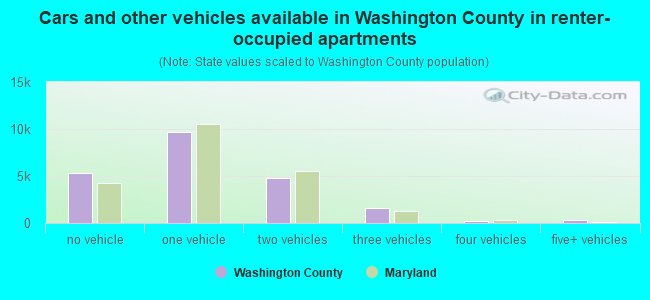
- Cars and other vehicles available in Washington County in renter-occupied apartments
- 4,814no vehicle
- 9,3691 vehicle
- 5,5712 vehicles
- 1,7493 vehicles
- 844 vehicles
- 1195+ vehicles
91.5% of Washington County residents lived in the same house 1 years ago.
Out of people who lived in different houses, 36% lived in this county.
Out of people who lived in different counties, 67% lived in Maryland.
| Washington County: | 91.5% |
| State average: | 88.5% |
Place of birth for U.S.-born residents:
- This state: 97,481
- Other state: 47,185
- Northeast: 18,808
- Midwest: 3,889
- South: 20,476
- West: 4,012
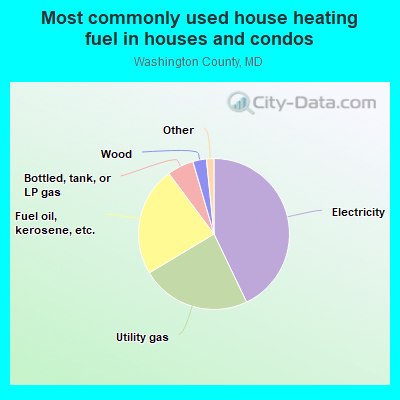
- 45.5%Electricity
- 21.6%Utility gas
- 20.7%Fuel oil, kerosene, etc.
- 5.6%Bottled, tank, or LP gas
- 5.3%Wood
- 0.7%Solar energy
- 0.5%No fuel used
- 0.2%Coal or coke
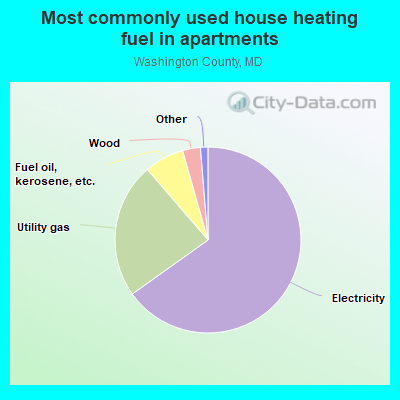
- 67.1%Electricity
- 15.1%Utility gas
- 13.0%Fuel oil, kerosene, etc.
- 3.0%Bottled, tank, or LP gas
- 1.2%No fuel used
- 0.5%Wood
- 0.1%Other fuel
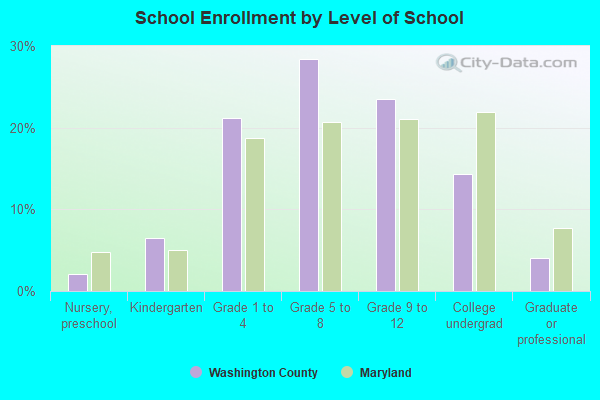
Private vs. public school enrollment:
| Here: | 9.4% |
| Maryland: | 15.2% |
| Here: | 12.2% |
| Maryland: | 14.4% |
| Here: | 25.5% |
| Maryland: | 20.2% |
Washington County government finances - Expenditure in 2020:
- Bond Funds - Cash and Securities: $42,085,000
Cash and Securities: $10,038,000
- Charges - Higher Education - Other: $11,615,000
Higher Education - Other: $11,000,000
Sewerage: $10,745,000
Sewerage: $10,262,000
Solid Waste Management: $7,714,000
Solid Waste Management: $6,159,000
Other: $3,976,000
Elementary and Secondary Education School Lunch: $3,033,000
Other: $3,023,000
Higher Education Auxiliary Enterprises: $2,549,000
Air Transportation: $2,514,000
Air Transportation: $2,510,000
Elementary and Secondary Education School Lunch: $2,273,000
Higher Education Auxiliary Enterprises: $2,105,000
Parks and Recreation: $1,192,000
Parks and Recreation: $1,009,000
Regular Highways: $314,000
Elementary and Secondary Education School Tuition and Transportation: $164,000
Elementary and Secondary Education School Tuition and Transportation: $145,000
Elementary and Secondary Education - Other: $100,000
- Construction - Elementary and Secondary Education: $31,160,000
Elementary and Secondary Education: $5,895,000
Other Higher Education: $1,246,000
Other Higher Education: $1,013,000
Judicial and Legal Services: $47,000
- Current Operations - Elementary and Secondary Education: $315,246,000
Elementary and Secondary Education: $292,848,000
General - Other: $32,173,000
Other Higher Education: $31,019,000
Other Higher Education: $30,465,000
Regular Highways: $23,835,000
Regular Highways: $23,290,000
General - Other: $20,299,000
Correctional Institutions: $17,025,000
Correctional Institutions: $15,806,000
Police Protection: $15,739,000
Local Fire Protection: $13,576,000
Police Protection: $12,611,000
Judicial and Legal Services: $9,529,000
Judicial and Legal Services: $8,807,000
Air Transportation: $8,448,000
Air Transportation: $8,438,000
Sewerage: $8,159,000
Sewerage: $7,786,000
Solid Waste Management: $7,728,000
Solid Waste Management: $7,181,000
Protective Inspection and Regulation - Other: $7,030,000
Water Utilities: $5,698,000
Water Utilities: $5,544,000
Parks and Recreation: $5,261,000
Financial Administration: $5,063,000
Financial Administration: $4,671,000
Parks and Recreation: $4,582,000
Higher Education Auxiliary Enterprises: $3,439,000
Local Fire Protection: $3,439,000
Transit Utilities: $3,197,000
Transit Utilities: $3,009,000
Protective Inspection and Regulation - Other: $2,955,000
Housing and Community Development: $2,585,000
Higher Education Auxiliary Enterprises: $2,437,000
Central Staff Services: $2,428,000
Central Staff Services: $2,380,000
Housing and Community Development: $2,299,000
Natural Resources - Other: $2,075,000
Natural Resources - Other: $1,636,000
Health - Other: $1,591,000
Health - Other: $1,580,000
General Public Buildings: $1,543,000
General Public Buildings: $1,514,000
- Federal Intergovernmental - Other: $7,209,000
Education: $4,775,000
Education: $4,163,000
Air Transportation: $4,083,000
Other: $2,043,000
Highways: $1,934,000
Transit Utilities: $1,370,000
Transit Utilities: $1,346,000
Air Transportation: $914,000
General Local Government Support: $23,000
General Local Government Support: $22,000
Housing and Community Development: $20,000
- General - Interest on Debt: $14,508,000
Interest on Debt: $7,768,000
- Intergovernmental to Local - Other - Elementary and Secondary Education: $4,358,000
Other - Libraries: $3,182,000
Other - Libraries: $3,089,000
Other - Health - Other: $2,339,000
Other - Health - Other: $2,339,000
Other - Elementary and Secondary Education: $323,000
- Local Intergovernmental - Education: $10,354,000
Education: $10,256,000
Other: $6,813,000
- Long Term Debt - Outstanding Unspecified Public Purpose: $384,395,000
Beginning Outstanding - Unspecified Public Purpose: $381,556,000
Beginning Outstanding - Unspecified Public Purpose: $190,948,000
Outstanding Unspecified Public Purpose: $188,403,000
Beginning Outstanding - Public Debt for Private Purpose: $50,594,000
Outstanding Nonguaranteed - Industrial Revenue: $48,995,000
Beginning Outstanding - Public Debt for Private Purpose: $47,396,000
Outstanding Nonguaranteed - Industrial Revenue: $45,797,000
Issue, Unspecified Public Purpose: $32,279,000
Retired Unspecified Public Purpose: $29,440,000
Retired Unspecified Public Purpose: $25,725,000
Issue, Unspecified Public Purpose: $23,180,000
Retired Nonguaranteed - Public Debt for Private Purpose: $1,599,000
Retired Nonguaranteed - Public Debt for Private Purpose: $1,599,000
- Miscellaneous - General Revenue - Other: $3,957,000
General Revenue - Other: $3,250,000
Interest Earnings: $3,179,000
Interest Earnings: $2,022,000
Fines and Forfeits: $1,985,000
Fines and Forfeits: $1,562,000
Sale of Property: $606,000
Sale of Property: $98,000
Rents: $78,000
Rents: $70,000
- Other Capital Outlay - Elementary and Secondary Education: $4,782,000
Elementary and Secondary Education: $4,274,000
Other Higher Education: $1,089,000
Other Higher Education: $666,000
Regular Highways: $224,000
Local Fire Protection: $146,000
Police Protection: $141,000
Police Protection: $134,000
Local Fire Protection: $107,000
General - Other: $92,000
Judicial and Legal Services: $84,000
Financial Administration: $83,000
Correctional Institutions: $75,000
Parks and Recreation: $74,000
General - Other: $68,000
Protective Inspection and Regulation - Other: $67,000
Regular Highways: $64,000
Central Staff Services: $56,000
Corrections - Other: $48,000
Natural Resources - Other: $38,000
Correctional Institutions: $27,000
Protective Inspection and Regulation - Other: $24,000
Natural Resources - Other: $23,000
Financial Administration: $21,000
Parks and Recreation: $4,000
General Public Building: $4,000
Central Staff Services: $3,000
General Public Building: $2,000
Corrections - Other: $2,000
- Other Funds - Cash and Securities: $155,503,000
Cash and Securities: $140,646,000
- Revenue - Water Utilities: $956,000
Water Utilities: $955,000
Transit Utilities: $544,000
Transit Utilities: $400,000
- Sinking Funds - Cash and Securities: $48,995,000
Cash and Securities: $45,797,000
- State Intergovernmental - Education: $244,859,000
Education: $209,595,000
Sewerage: $6,846,000
Other: $5,805,000
Other: $4,098,000
Highways: $2,303,000
Highways: $1,645,000
Housing and Community Development: $1,133,000
Transit Utilities: $616,000
Transit Utilities: $369,000
Sewerage: $308,000
- Tax - Property: $129,807,000
Property: $125,090,000
Individual Income: $92,155,000
Individual Income: $77,920,000
Documentary and Stock Transfer: $7,418,000
Documentary and Stock Transfer: $6,699,000
Other Selective Sales: $4,689,000
Death and Gift: $4,437,000
Other License: $3,256,000
Other License: $2,795,000
Other Selective Sales: $2,457,000
Death and Gift: $2,171,000
Occupation and Business License - Other: $325,000
Amusements Sales: $263,000
Occupation and Business License - Other: $205,000
Amusements Sales: $187,000
- Total Salaries and Wages: $201,902,000
: $193,616,000
Washington County government finances - Revenue in 2020:
- Bond Funds - Cash and Securities: $42,085,000
Cash and Securities: $10,038,000
- Charges - Higher Education - Other: $11,615,000
Higher Education - Other: $11,000,000
Sewerage: $10,745,000
Sewerage: $10,262,000
Solid Waste Management: $7,714,000
Solid Waste Management: $6,159,000
Other: $3,976,000
Elementary and Secondary Education School Lunch: $3,033,000
Other: $3,023,000
Higher Education Auxiliary Enterprises: $2,549,000
Air Transportation: $2,514,000
Air Transportation: $2,510,000
Elementary and Secondary Education School Lunch: $2,273,000
Higher Education Auxiliary Enterprises: $2,105,000
Parks and Recreation: $1,192,000
Parks and Recreation: $1,009,000
Regular Highways: $314,000
Elementary and Secondary Education School Tuition and Transportation: $164,000
Elementary and Secondary Education School Tuition and Transportation: $145,000
Elementary and Secondary Education - Other: $100,000
- Construction - Elementary and Secondary Education: $31,160,000
Elementary and Secondary Education: $5,895,000
Other Higher Education: $1,246,000
Other Higher Education: $1,013,000
Judicial and Legal Services: $47,000
- Current Operations - Elementary and Secondary Education: $315,246,000
Elementary and Secondary Education: $292,848,000
General - Other: $32,173,000
Other Higher Education: $31,019,000
Other Higher Education: $30,465,000
Regular Highways: $23,835,000
Regular Highways: $23,290,000
General - Other: $20,299,000
Correctional Institutions: $17,025,000
Correctional Institutions: $15,806,000
Police Protection: $15,739,000
Local Fire Protection: $13,576,000
Police Protection: $12,611,000
Judicial and Legal Services: $9,529,000
Judicial and Legal Services: $8,807,000
Air Transportation: $8,448,000
Air Transportation: $8,438,000
Sewerage: $8,159,000
Sewerage: $7,786,000
Solid Waste Management: $7,728,000
Solid Waste Management: $7,181,000
Protective Inspection and Regulation - Other: $7,030,000
Water Utilities: $5,698,000
Water Utilities: $5,544,000
Parks and Recreation: $5,261,000
Financial Administration: $5,063,000
Financial Administration: $4,671,000
Parks and Recreation: $4,582,000
Higher Education Auxiliary Enterprises: $3,439,000
Local Fire Protection: $3,439,000
Transit Utilities: $3,197,000
Transit Utilities: $3,009,000
Protective Inspection and Regulation - Other: $2,955,000
Housing and Community Development: $2,585,000
Higher Education Auxiliary Enterprises: $2,437,000
Central Staff Services: $2,428,000
Central Staff Services: $2,380,000
Housing and Community Development: $2,299,000
Natural Resources - Other: $2,075,000
Natural Resources - Other: $1,636,000
Health - Other: $1,591,000
Health - Other: $1,580,000
General Public Buildings: $1,543,000
General Public Buildings: $1,514,000
- Federal Intergovernmental - Other: $7,209,000
Education: $4,775,000
Education: $4,163,000
Air Transportation: $4,083,000
Other: $2,043,000
Highways: $1,934,000
Transit Utilities: $1,370,000
Transit Utilities: $1,346,000
Air Transportation: $914,000
General Local Government Support: $23,000
General Local Government Support: $22,000
Housing and Community Development: $20,000
- General - Interest on Debt: $14,508,000
Interest on Debt: $7,768,000
- Intergovernmental to Local - Other - Elementary and Secondary Education: $4,358,000
Other - Libraries: $3,182,000
Other - Libraries: $3,089,000
Other - Health - Other: $2,339,000
Other - Health - Other: $2,339,000
Other - Elementary and Secondary Education: $323,000
- Local Intergovernmental - Education: $10,354,000
Education: $10,256,000
Other: $6,813,000
- Long Term Debt - Outstanding Unspecified Public Purpose: $384,395,000
Beginning Outstanding - Unspecified Public Purpose: $381,556,000
Beginning Outstanding - Unspecified Public Purpose: $190,948,000
Outstanding Unspecified Public Purpose: $188,403,000
Beginning Outstanding - Public Debt for Private Purpose: $50,594,000
Outstanding Nonguaranteed - Industrial Revenue: $48,995,000
Beginning Outstanding - Public Debt for Private Purpose: $47,396,000
Outstanding Nonguaranteed - Industrial Revenue: $45,797,000
Issue, Unspecified Public Purpose: $32,279,000
Retired Unspecified Public Purpose: $29,440,000
Retired Unspecified Public Purpose: $25,725,000
Issue, Unspecified Public Purpose: $23,180,000
Retired Nonguaranteed - Public Debt for Private Purpose: $1,599,000
Retired Nonguaranteed - Public Debt for Private Purpose: $1,599,000
- Miscellaneous - General Revenue - Other: $3,957,000
General Revenue - Other: $3,250,000
Interest Earnings: $3,179,000
Interest Earnings: $2,022,000
Fines and Forfeits: $1,985,000
Fines and Forfeits: $1,562,000
Sale of Property: $606,000
Sale of Property: $98,000
Rents: $78,000
Rents: $70,000
- Other Capital Outlay - Elementary and Secondary Education: $4,782,000
Elementary and Secondary Education: $4,274,000
Other Higher Education: $1,089,000
Other Higher Education: $666,000
Regular Highways: $224,000
Local Fire Protection: $146,000
Police Protection: $141,000
Police Protection: $134,000
Local Fire Protection: $107,000
General - Other: $92,000
Judicial and Legal Services: $84,000
Financial Administration: $83,000
Correctional Institutions: $75,000
Parks and Recreation: $74,000
General - Other: $68,000
Protective Inspection and Regulation - Other: $67,000
Regular Highways: $64,000
Central Staff Services: $56,000
Corrections - Other: $48,000
Natural Resources - Other: $38,000
Correctional Institutions: $27,000
Protective Inspection and Regulation - Other: $24,000
Natural Resources - Other: $23,000
Financial Administration: $21,000
Parks and Recreation: $4,000
General Public Building: $4,000
Central Staff Services: $3,000
General Public Building: $2,000
Corrections - Other: $2,000
- Other Funds - Cash and Securities: $155,503,000
Cash and Securities: $140,646,000
- Revenue - Water Utilities: $956,000
Water Utilities: $955,000
Transit Utilities: $544,000
Transit Utilities: $400,000
- Sinking Funds - Cash and Securities: $48,995,000
Cash and Securities: $45,797,000
- State Intergovernmental - Education: $244,859,000
Education: $209,595,000
Sewerage: $6,846,000
Other: $5,805,000
Other: $4,098,000
Highways: $2,303,000
Highways: $1,645,000
Housing and Community Development: $1,133,000
Transit Utilities: $616,000
Transit Utilities: $369,000
Sewerage: $308,000
- Tax - Property: $129,807,000
Property: $125,090,000
Individual Income: $92,155,000
Individual Income: $77,920,000
Documentary and Stock Transfer: $7,418,000
Documentary and Stock Transfer: $6,699,000
Other Selective Sales: $4,689,000
Death and Gift: $4,437,000
Other License: $3,256,000
Other License: $2,795,000
Other Selective Sales: $2,457,000
Death and Gift: $2,171,000
Occupation and Business License - Other: $325,000
Amusements Sales: $263,000
Occupation and Business License - Other: $205,000
Amusements Sales: $187,000
- Total Salaries and Wages: $201,902,000
: $193,616,000
Washington County government finances - Debt in 2020:
- Bond Funds - Cash and Securities: $42,085,000
Cash and Securities: $10,038,000
- Charges - Higher Education - Other: $11,615,000
Higher Education - Other: $11,000,000
Sewerage: $10,745,000
Sewerage: $10,262,000
Solid Waste Management: $7,714,000
Solid Waste Management: $6,159,000
Other: $3,976,000
Elementary and Secondary Education School Lunch: $3,033,000
Other: $3,023,000
Higher Education Auxiliary Enterprises: $2,549,000
Air Transportation: $2,514,000
Air Transportation: $2,510,000
Elementary and Secondary Education School Lunch: $2,273,000
Higher Education Auxiliary Enterprises: $2,105,000
Parks and Recreation: $1,192,000
Parks and Recreation: $1,009,000
Regular Highways: $314,000
Elementary and Secondary Education School Tuition and Transportation: $164,000
Elementary and Secondary Education School Tuition and Transportation: $145,000
Elementary and Secondary Education - Other: $100,000
- Construction - Elementary and Secondary Education: $31,160,000
Elementary and Secondary Education: $5,895,000
Other Higher Education: $1,246,000
Other Higher Education: $1,013,000
Judicial and Legal Services: $47,000
- Current Operations - Elementary and Secondary Education: $315,246,000
Elementary and Secondary Education: $292,848,000
General - Other: $32,173,000
Other Higher Education: $31,019,000
Other Higher Education: $30,465,000
Regular Highways: $23,835,000
Regular Highways: $23,290,000
General - Other: $20,299,000
Correctional Institutions: $17,025,000
Correctional Institutions: $15,806,000
Police Protection: $15,739,000
Local Fire Protection: $13,576,000
Police Protection: $12,611,000
Judicial and Legal Services: $9,529,000
Judicial and Legal Services: $8,807,000
Air Transportation: $8,448,000
Air Transportation: $8,438,000
Sewerage: $8,159,000
Sewerage: $7,786,000
Solid Waste Management: $7,728,000
Solid Waste Management: $7,181,000
Protective Inspection and Regulation - Other: $7,030,000
Water Utilities: $5,698,000
Water Utilities: $5,544,000
Parks and Recreation: $5,261,000
Financial Administration: $5,063,000
Financial Administration: $4,671,000
Parks and Recreation: $4,582,000
Higher Education Auxiliary Enterprises: $3,439,000
Local Fire Protection: $3,439,000
Transit Utilities: $3,197,000
Transit Utilities: $3,009,000
Protective Inspection and Regulation - Other: $2,955,000
Housing and Community Development: $2,585,000
Higher Education Auxiliary Enterprises: $2,437,000
Central Staff Services: $2,428,000
Central Staff Services: $2,380,000
Housing and Community Development: $2,299,000
Natural Resources - Other: $2,075,000
Natural Resources - Other: $1,636,000
Health - Other: $1,591,000
Health - Other: $1,580,000
General Public Buildings: $1,543,000
General Public Buildings: $1,514,000
- Federal Intergovernmental - Other: $7,209,000
Education: $4,775,000
Education: $4,163,000
Air Transportation: $4,083,000
Other: $2,043,000
Highways: $1,934,000
Transit Utilities: $1,370,000
Transit Utilities: $1,346,000
Air Transportation: $914,000
General Local Government Support: $23,000
General Local Government Support: $22,000
Housing and Community Development: $20,000
- General - Interest on Debt: $14,508,000
Interest on Debt: $7,768,000
- Intergovernmental to Local - Other - Elementary and Secondary Education: $4,358,000
Other - Libraries: $3,182,000
Other - Libraries: $3,089,000
Other - Health - Other: $2,339,000
Other - Health - Other: $2,339,000
Other - Elementary and Secondary Education: $323,000
- Local Intergovernmental - Education: $10,354,000
Education: $10,256,000
Other: $6,813,000
- Long Term Debt - Outstanding Unspecified Public Purpose: $384,395,000
Beginning Outstanding - Unspecified Public Purpose: $381,556,000
Beginning Outstanding - Unspecified Public Purpose: $190,948,000
Outstanding Unspecified Public Purpose: $188,403,000
Beginning Outstanding - Public Debt for Private Purpose: $50,594,000
Outstanding Nonguaranteed - Industrial Revenue: $48,995,000
Beginning Outstanding - Public Debt for Private Purpose: $47,396,000
Outstanding Nonguaranteed - Industrial Revenue: $45,797,000
Issue, Unspecified Public Purpose: $32,279,000
Retired Unspecified Public Purpose: $29,440,000
Retired Unspecified Public Purpose: $25,725,000
Issue, Unspecified Public Purpose: $23,180,000
Retired Nonguaranteed - Public Debt for Private Purpose: $1,599,000
Retired Nonguaranteed - Public Debt for Private Purpose: $1,599,000
- Miscellaneous - General Revenue - Other: $3,957,000
General Revenue - Other: $3,250,000
Interest Earnings: $3,179,000
Interest Earnings: $2,022,000
Fines and Forfeits: $1,985,000
Fines and Forfeits: $1,562,000
Sale of Property: $606,000
Sale of Property: $98,000
Rents: $78,000
Rents: $70,000
- Other Capital Outlay - Elementary and Secondary Education: $4,782,000
Elementary and Secondary Education: $4,274,000
Other Higher Education: $1,089,000
Other Higher Education: $666,000
Regular Highways: $224,000
Local Fire Protection: $146,000
Police Protection: $141,000
Police Protection: $134,000
Local Fire Protection: $107,000
General - Other: $92,000
Judicial and Legal Services: $84,000
Financial Administration: $83,000
Correctional Institutions: $75,000
Parks and Recreation: $74,000
General - Other: $68,000
Protective Inspection and Regulation - Other: $67,000
Regular Highways: $64,000
Central Staff Services: $56,000
Corrections - Other: $48,000
Natural Resources - Other: $38,000
Correctional Institutions: $27,000
Protective Inspection and Regulation - Other: $24,000
Natural Resources - Other: $23,000
Financial Administration: $21,000
Parks and Recreation: $4,000
General Public Building: $4,000
Central Staff Services: $3,000
General Public Building: $2,000
Corrections - Other: $2,000
- Other Funds - Cash and Securities: $155,503,000
Cash and Securities: $140,646,000
- Revenue - Water Utilities: $956,000
Water Utilities: $955,000
Transit Utilities: $544,000
Transit Utilities: $400,000
- Sinking Funds - Cash and Securities: $48,995,000
Cash and Securities: $45,797,000
- State Intergovernmental - Education: $244,859,000
Education: $209,595,000
Sewerage: $6,846,000
Other: $5,805,000
Other: $4,098,000
Highways: $2,303,000
Highways: $1,645,000
Housing and Community Development: $1,133,000
Transit Utilities: $616,000
Transit Utilities: $369,000
Sewerage: $308,000
- Tax - Property: $129,807,000
Property: $125,090,000
Individual Income: $92,155,000
Individual Income: $77,920,000
Documentary and Stock Transfer: $7,418,000
Documentary and Stock Transfer: $6,699,000
Other Selective Sales: $4,689,000
Death and Gift: $4,437,000
Other License: $3,256,000
Other License: $2,795,000
Other Selective Sales: $2,457,000
Death and Gift: $2,171,000
Occupation and Business License - Other: $325,000
Amusements Sales: $263,000
Occupation and Business License - Other: $205,000
Amusements Sales: $187,000
- Total Salaries and Wages: $201,902,000
: $193,616,000
Washington County government finances - Cash and Securities in 2020:
- Bond Funds - Cash and Securities: $42,085,000
Cash and Securities: $10,038,000
- Charges - Higher Education - Other: $11,615,000
Higher Education - Other: $11,000,000
Sewerage: $10,745,000
Sewerage: $10,262,000
Solid Waste Management: $7,714,000
Solid Waste Management: $6,159,000
Other: $3,976,000
Elementary and Secondary Education School Lunch: $3,033,000
Other: $3,023,000
Higher Education Auxiliary Enterprises: $2,549,000
Air Transportation: $2,514,000
Air Transportation: $2,510,000
Elementary and Secondary Education School Lunch: $2,273,000
Higher Education Auxiliary Enterprises: $2,105,000
Parks and Recreation: $1,192,000
Parks and Recreation: $1,009,000
Regular Highways: $314,000
Elementary and Secondary Education School Tuition and Transportation: $164,000
Elementary and Secondary Education School Tuition and Transportation: $145,000
Elementary and Secondary Education - Other: $100,000
- Construction - Elementary and Secondary Education: $31,160,000
Elementary and Secondary Education: $5,895,000
Other Higher Education: $1,246,000
Other Higher Education: $1,013,000
Judicial and Legal Services: $47,000
- Current Operations - Elementary and Secondary Education: $315,246,000
Elementary and Secondary Education: $292,848,000
General - Other: $32,173,000
Other Higher Education: $31,019,000
Other Higher Education: $30,465,000
Regular Highways: $23,835,000
Regular Highways: $23,290,000
General - Other: $20,299,000
Correctional Institutions: $17,025,000
Correctional Institutions: $15,806,000
Police Protection: $15,739,000
Local Fire Protection: $13,576,000
Police Protection: $12,611,000
Judicial and Legal Services: $9,529,000
Judicial and Legal Services: $8,807,000
Air Transportation: $8,448,000
Air Transportation: $8,438,000
Sewerage: $8,159,000
Sewerage: $7,786,000
Solid Waste Management: $7,728,000
Solid Waste Management: $7,181,000
Protective Inspection and Regulation - Other: $7,030,000
Water Utilities: $5,698,000
Water Utilities: $5,544,000
Parks and Recreation: $5,261,000
Financial Administration: $5,063,000
Financial Administration: $4,671,000
Parks and Recreation: $4,582,000
Higher Education Auxiliary Enterprises: $3,439,000
Local Fire Protection: $3,439,000
Transit Utilities: $3,197,000
Transit Utilities: $3,009,000
Protective Inspection and Regulation - Other: $2,955,000
Housing and Community Development: $2,585,000
Higher Education Auxiliary Enterprises: $2,437,000
Central Staff Services: $2,428,000
Central Staff Services: $2,380,000
Housing and Community Development: $2,299,000
Natural Resources - Other: $2,075,000
Natural Resources - Other: $1,636,000
Health - Other: $1,591,000
Health - Other: $1,580,000
General Public Buildings: $1,543,000
General Public Buildings: $1,514,000
- Federal Intergovernmental - Other: $7,209,000
Education: $4,775,000
Education: $4,163,000
Air Transportation: $4,083,000
Other: $2,043,000
Highways: $1,934,000
Transit Utilities: $1,370,000
Transit Utilities: $1,346,000
Air Transportation: $914,000
General Local Government Support: $23,000
General Local Government Support: $22,000
Housing and Community Development: $20,000
- General - Interest on Debt: $14,508,000
Interest on Debt: $7,768,000
- Intergovernmental to Local - Other - Elementary and Secondary Education: $4,358,000
Other - Libraries: $3,182,000
Other - Libraries: $3,089,000
Other - Health - Other: $2,339,000
Other - Health - Other: $2,339,000
Other - Elementary and Secondary Education: $323,000
- Local Intergovernmental - Education: $10,354,000
Education: $10,256,000
Other: $6,813,000
- Long Term Debt - Outstanding Unspecified Public Purpose: $384,395,000
Beginning Outstanding - Unspecified Public Purpose: $381,556,000
Beginning Outstanding - Unspecified Public Purpose: $190,948,000
Outstanding Unspecified Public Purpose: $188,403,000
Beginning Outstanding - Public Debt for Private Purpose: $50,594,000
Outstanding Nonguaranteed - Industrial Revenue: $48,995,000
Beginning Outstanding - Public Debt for Private Purpose: $47,396,000
Outstanding Nonguaranteed - Industrial Revenue: $45,797,000
Issue, Unspecified Public Purpose: $32,279,000
Retired Unspecified Public Purpose: $29,440,000
Retired Unspecified Public Purpose: $25,725,000
Issue, Unspecified Public Purpose: $23,180,000
Retired Nonguaranteed - Public Debt for Private Purpose: $1,599,000
Retired Nonguaranteed - Public Debt for Private Purpose: $1,599,000
- Miscellaneous - General Revenue - Other: $3,957,000
General Revenue - Other: $3,250,000
Interest Earnings: $3,179,000
Interest Earnings: $2,022,000
Fines and Forfeits: $1,985,000
Fines and Forfeits: $1,562,000
Sale of Property: $606,000
Sale of Property: $98,000
Rents: $78,000
Rents: $70,000
- Other Capital Outlay - Elementary and Secondary Education: $4,782,000
Elementary and Secondary Education: $4,274,000
Other Higher Education: $1,089,000
Other Higher Education: $666,000
Regular Highways: $224,000
Local Fire Protection: $146,000
Police Protection: $141,000
Police Protection: $134,000
Local Fire Protection: $107,000
General - Other: $92,000
Judicial and Legal Services: $84,000
Financial Administration: $83,000
Correctional Institutions: $75,000
Parks and Recreation: $74,000
General - Other: $68,000
Protective Inspection and Regulation - Other: $67,000
Regular Highways: $64,000
Central Staff Services: $56,000
Corrections - Other: $48,000
Natural Resources - Other: $38,000
Correctional Institutions: $27,000
Protective Inspection and Regulation - Other: $24,000
Natural Resources - Other: $23,000
Financial Administration: $21,000
Parks and Recreation: $4,000
General Public Building: $4,000
Central Staff Services: $3,000
General Public Building: $2,000
Corrections - Other: $2,000
- Other Funds - Cash and Securities: $155,503,000
Cash and Securities: $140,646,000
- Revenue - Water Utilities: $956,000
Water Utilities: $955,000
Transit Utilities: $544,000
Transit Utilities: $400,000
- Sinking Funds - Cash and Securities: $48,995,000
Cash and Securities: $45,797,000
- State Intergovernmental - Education: $244,859,000
Education: $209,595,000
Sewerage: $6,846,000
Other: $5,805,000
Other: $4,098,000
Highways: $2,303,000
Highways: $1,645,000
Housing and Community Development: $1,133,000
Transit Utilities: $616,000
Transit Utilities: $369,000
Sewerage: $308,000
- Tax - Property: $129,807,000
Property: $125,090,000
Individual Income: $92,155,000
Individual Income: $77,920,000
Documentary and Stock Transfer: $7,418,000
Documentary and Stock Transfer: $6,699,000
Other Selective Sales: $4,689,000
Death and Gift: $4,437,000
Other License: $3,256,000
Other License: $2,795,000
Other Selective Sales: $2,457,000
Death and Gift: $2,171,000
Occupation and Business License - Other: $325,000
Amusements Sales: $263,000
Occupation and Business License - Other: $205,000
Amusements Sales: $187,000
- Total Salaries and Wages: $201,902,000
: $193,616,000
Supplemental Security Income (SSI) in 2006:
- Total number of recipients: 2,378
- Number of aged recipients: 219
- Number of blind and disabled recipients: 2,159
- Number of recipients under 18: 419
- Number of recipients between 18 and 64: 1,531
- Number of recipients older than 64: 428
- Number of recipients also receiving OASDI: 880
- Amount of payments (thousands of dollars): 1,085
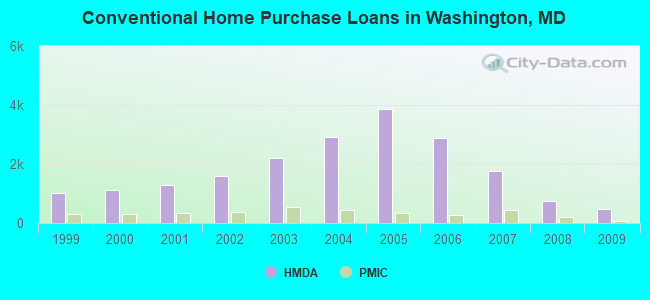
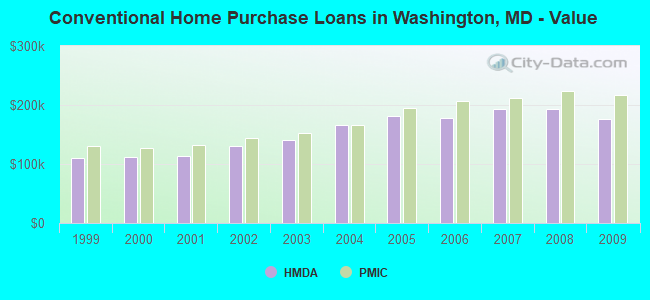
| Home Mortgage Disclosure Act Aggregated Statistics For Year 2009 (Based on 32 full tracts) | ||||||||||||||
| A) FHA, FSA/RHS & VA Home Purchase Loans | B) Conventional Home Purchase Loans | C) Refinancings | D) Home Improvement Loans | E) Loans on Dwellings For 5+ Families | F) Non-occupant Loans on < 5 Family Dwellings (A B C & D) | G) Loans On Manufactured Home Dwelling (A B C & D) | ||||||||
|---|---|---|---|---|---|---|---|---|---|---|---|---|---|---|
| Number | Average Value | Number | Average Value | Number | Average Value | Number | Average Value | Number | Average Value | Number | Average Value | Number | Average Value | |
| LOANS ORIGINATED | 686 | $182,589 | 480 | $177,117 | 2,732 | $196,056 | 221 | $87,448 | 13 | $645,923 | 222 | $163,905 | 33 | $79,697 |
| APPLICATIONS APPROVED, NOT ACCEPTED | 38 | $178,842 | 45 | $211,178 | 264 | $184,799 | 23 | $53,957 | 1 | $900,000 | 20 | $141,350 | 7 | $54,143 |
| APPLICATIONS DENIED | 89 | $183,034 | 93 | $130,570 | 1,203 | $212,082 | 154 | $49,844 | 4 | $255,250 | 72 | $145,847 | 51 | $78,980 |
| APPLICATIONS WITHDRAWN | 70 | $183,386 | 67 | $172,328 | 738 | $208,218 | 44 | $122,864 | 0 | $0 | 54 | $123,519 | 5 | $162,000 |
| FILES CLOSED FOR INCOMPLETENESS | 7 | $205,000 | 11 | $220,909 | 149 | $208,852 | 4 | $140,750 | 0 | $0 | 16 | $237,375 | 5 | $77,200 |
| Private Mortgage Insurance Companies Aggregated Statistics For Year 2009 (Based on 25 full tracts) | ||||||
| A) Conventional Home Purchase Loans | B) Refinancings | C) Non-occupant Loans on < 5 Family Dwellings (A & B) | ||||
|---|---|---|---|---|---|---|
| Number | Average Value | Number | Average Value | Number | Average Value | |
| LOANS ORIGINATED | 54 | $217,667 | 51 | $244,000 | 3 | $166,667 |
| APPLICATIONS APPROVED, NOT ACCEPTED | 18 | $234,167 | 18 | $268,944 | 3 | $124,000 |
| APPLICATIONS DENIED | 7 | $173,714 | 16 | $247,312 | 0 | $0 |
| APPLICATIONS WITHDRAWN | 2 | $220,000 | 6 | $251,333 | 0 | $0 |
| FILES CLOSED FOR INCOMPLETENESS | 4 | $222,000 | 1 | $204,000 | 1 | $67,000 |
| Most common first names in Washington County, MD among deceased individuals | ||
| Name | Count | Lived (average) |
|---|---|---|
| Mary | 1,348 | 80.7 years |
| John | 1,002 | 74.5 years |
| Charles | 997 | 73.9 years |
| William | 893 | 73.8 years |
| Robert | 742 | 70.1 years |
| James | 574 | 72.2 years |
| George | 502 | 75.1 years |
| Helen | 492 | 79.5 years |
| Margaret | 460 | 79.7 years |
| Ruth | 417 | 80.3 years |
| Most common last names in Washington County, MD among deceased individuals | ||
| Last name | Count | Lived (average) |
|---|---|---|
| Smith | 621 | 75.7 years |
| Miller | 412 | 76.6 years |
| Martin | 254 | 76.5 years |
| Myers | 230 | 75.5 years |
| Baker | 212 | 73.7 years |
| Snyder | 190 | 75.9 years |
| Jones | 181 | 73.5 years |
| Shank | 175 | 79.1 years |
| Davis | 169 | 74.6 years |
| Brown | 167 | 76.5 years |
| Businesses in Washington County, MD | ||||
| Name | Count | Name | Count | |
|---|---|---|---|---|
| 7-Eleven | 3 | Kroger | 1 | |
| ALDI | 1 | La-Z-Boy | 2 | |
| ALDO | 2 | Lane Bryant | 1 | |
| AT&T | 6 | Lane Furniture | 4 | |
| Advance Auto Parts | 2 | Levi Strauss & Co. | 1 | |
| Aeropostale | 2 | Little Caesars Pizza | 1 | |
| American Eagle Outfitters | 1 | Long John Silver's | 1 | |
| Ann Taylor | 1 | Lowe's | 2 | |
| Arby's | 1 | Macy's | 1 | |
| Ashley Furniture | 1 | Marriott | 2 | |
| AutoZone | 2 | Marshalls | 1 | |
| Banana Republic | 1 | Martin's | 2 | |
| Baskin-Robbins | 2 | MasterBrand Cabinets | 14 | |
| Bath & Body Works | 2 | Mazda | 1 | |
| Bed Bath & Beyond | 1 | McDonald's | 12 | |
| Best Western | 1 | Men's Wearhouse | 1 | |
| Brooks Brothers | 1 | Microtel | 1 | |
| Budget Car Rental | 1 | Motel 6 | 1 | |
| Buffalo Wild Wings | 1 | Motherhood Maternity | 2 | |
| Burger King | 5 | New York & Co | 1 | |
| CVS | 6 | Nike | 8 | |
| Carson Pirie Scott | 1 | Nissan | 1 | |
| Casual Male XL | 1 | OfficeMax | 1 | |
| Catherines | 1 | Old Navy | 1 | |
| Charlotte Russe | 1 | Olive Garden | 1 | |
| Chevrolet | 2 | Outback | 1 | |
| Chick-Fil-A | 1 | Outback Steakhouse | 1 | |
| Chico's | 1 | Pac Sun | 2 | |
| Chipotle | 1 | Panera Bread | 1 | |
| Chuck E. Cheese's | 1 | Papa John's Pizza | 2 | |
| Clarion | 1 | Payless | 2 | |
| Clarks | 1 | Penske | 1 | |
| Cold Stone Creamery | 1 | PetSmart | 1 | |
| Coldwater Creek | 1 | Pier 1 Imports | 1 | |
| Comfort Suites | 1 | Pizza Hut | 5 | |
| Cracker Barrel | 1 | Popeyes | 2 | |
| Curves | 3 | Quiznos | 3 | |
| Dairy Queen | 3 | RadioShack | 2 | |
| Days Inn | 1 | Ramada | 1 | |
| Deb | 1 | Red Lobster | 1 | |
| Decora Cabinetry | 6 | Red Roof Inn | 1 | |
| Dennys | 1 | Rite Aid | 2 | |
| Domino's Pizza | 3 | Ruby Tuesday | 1 | |
| DressBarn | 2 | Rue21 | 1 | |
| Dressbarn | 2 | Ryan's Grill | 1 | |
| Dunkin Donuts | 3 | Ryder Rental & Truck Leasing | 1 | |
| Econo Lodge | 1 | SAS Shoes | 1 | |
| Eddie Bauer | 1 | Sam's Club | 1 | |
| Famous Footwear | 1 | Sears | 3 | |
| FedEx | 19 | Skechers USA | 1 | |
| Finish Line | 1 | Sleep Inn | 2 | |
| Firestone Complete Auto Care | 1 | Soma Intimates | 1 | |
| Foot Locker | 1 | Spencer Gifts | 1 | |
| Ford | 1 | Sprint Nextel | 5 | |
| GNC | 1 | Staples | 1 | |
| GameStop | 1 | Starbucks | 1 | |
| Gap | 3 | Subaru | 1 | |
| Goodwill | 1 | Subway | 9 | |
| Gymboree | 1 | Super 8 | 3 | |
| H&R Block | 4 | T-Mobile | 4 | |
| Hardee's | 1 | T.G.I. Driday's | 1 | |
| Hilton | 2 | Taco Bell | 3 | |
| Holiday Inn | 1 | Talbots | 1 | |
| Home Depot | 1 | Target | 1 | |
| Honda | 1 | The Room Place | 1 | |
| Hot Topic | 1 | Toyota | 1 | |
| Hyundai | 1 | Toys"R"Us | 2 | |
| IHOP | 1 | U-Haul | 3 | |
| IZOD | 1 | U.S. Cellular | 2 | |
| J.Crew | 1 | UPS | 19 | |
| JCPenney | 1 | Value City Furniture | 1 | |
| Jones New York | 5 | Vans | 1 | |
| Journeys | 1 | Victoria's Secret | 1 | |
| Justice | 1 | Volkswagen | 1 | |
| KFC | 2 | Waffle House | 3 | |
| Kincaid | 1 | Walmart | 1 | |
| Kmart | 1 | Wendy's | 3 | |
| Knights Inn | 2 | YMCA | 1 | |
| Kohl's | 1 | |||
Washington County on our top lists:
- #25 on the list of "Top 101 counties with the lowest percentage of residents relocating to foreign countries in 2011 (pop. 50,000+)"
- #67 on the list of "Top 101 counties with the lowest percentage of residents relocating to foreign countries in 2011"
- #77 on the list of "Top 101 counties with the lowest percentage of residents that exercised in the past month"