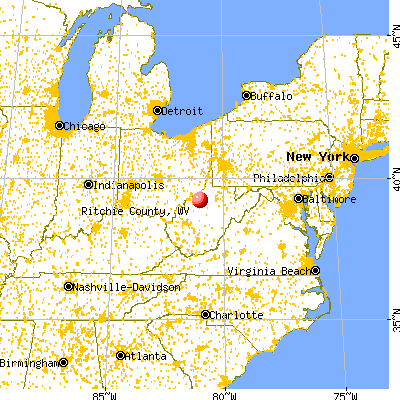
Ritchie County, West Virginia (WV)
County owner-occupied free and clear houses and condos in 2010: 1,913
County owner-occupied houses and condos in 2000: 3,418
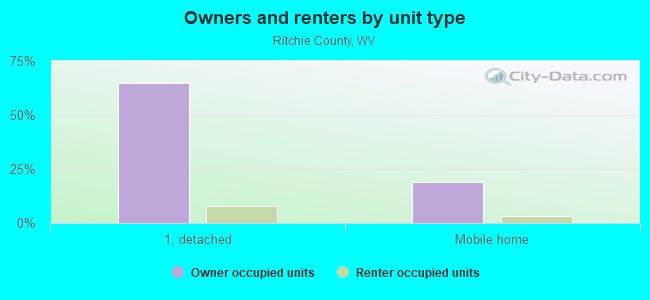
Renter-occupied apartments: 904 (it was 766 in 2000)
| % of renters here: | 18% |
| State: | 27% |
Land area: 454 sq. mi.
Water area: 0.1 sq. mi.
Population density: 19 people per square mile (low).
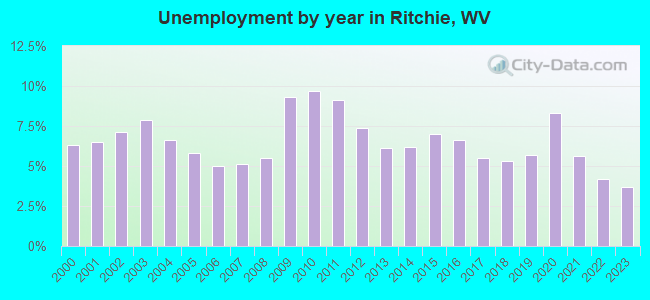
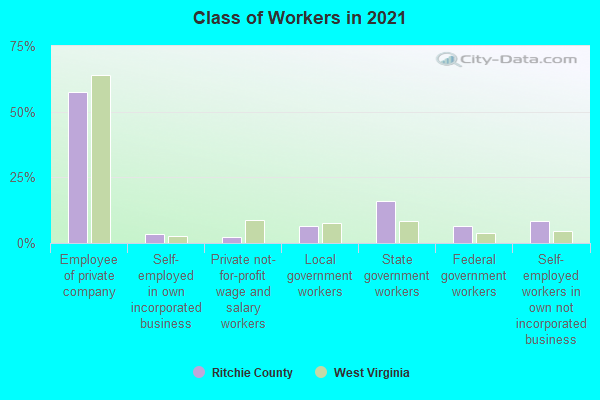
Industries providing employment: Public administration (13.7%), Educational, health and social services (13.6%), Retail trade (12.3%), Manufacturing (12.1%), Construction (11.2%).
Type of workers:
- Private wage or salary: 62%
- Government: 29%
- Self-employed, not incorporated: 8%
- Unpaid family work: 0%
- OSM Map
- General Map
- Google Map
- MSN Map

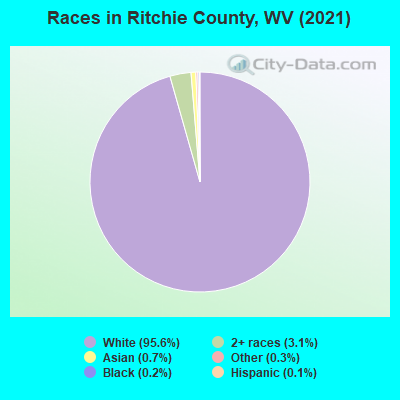
- 8,06796.2%White Non-Hispanic Alone
- 2022.4%Two or more races
- 540.6%Asian alone
- 310.4%Black Non-Hispanic Alone
- 270.3%Hispanic or Latino
- 10.01%Some other race alone
| Median resident age: | 46.9 years |
| West Virginia median age: | 42.9 years |
| Males: 4,227 | |
| Females: 4,195 |

 | Reckless Driving Citation in Ritchie County (25 replies) |
| Drilling for minerals in Ritchie County (3 replies) |
| US 50 P-burg to Bridgeport (6 replies) |
| County Consolidation (4 replies) |
| Swine Flu Message Board (111 replies) |
| Confederate Flag (83 replies) |
| Ritchie County: | 2.0 people |
| West Virginia: | 2 people |
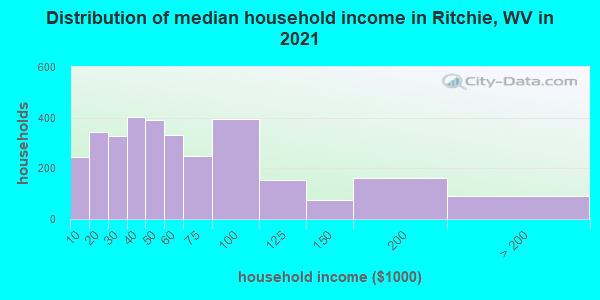
Estimated median household income in 2022: $48,185 ($27,332 in 1999)
| This county: | $48,185 |
| West Virginia: | $54,329 |
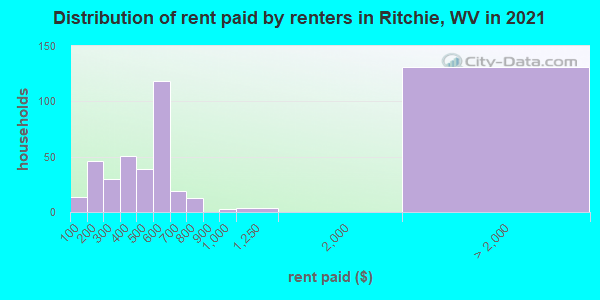
Median contract rent in 2022 for apartments: $422 (lower quartile is $250, upper quartile is $553)
| This county: | $422 |
| State: | $606 |
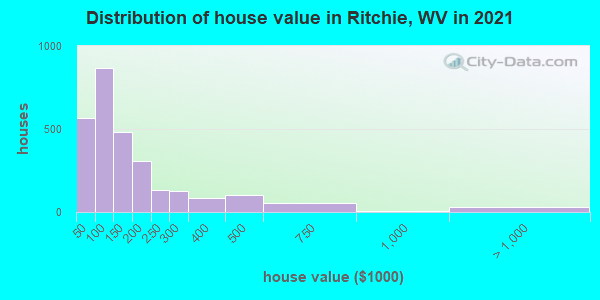
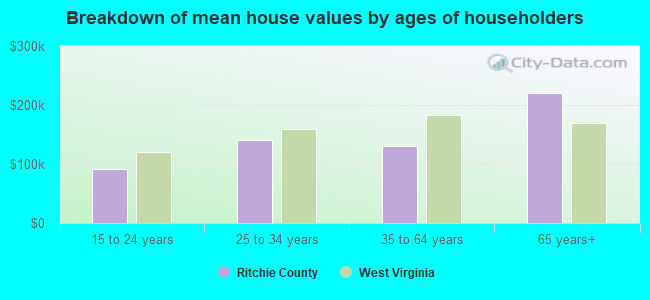
Estimated median house or condo value in 2022: $111,910 (it was $50,800 in 2000)
| Ritchie: | $111,910 |
| West Virginia: | $155,100 |
Median monthly housing costs for homes and condos with a mortgage: $882
Median monthly housing costs for units without a mortgage: $255
Institutionalized population: 106
Crime in 2021 (reported by the sheriff's office or county police, not the county total):
- Murders: 0
- Rapes: 2
- Robberies: 0
- Assaults: 4
- Burglaries: 6
- Thefts: 21
- Auto thefts: 0
Crime in 2019 (reported by the sheriff's office or county police, not the county total):
- Murders: 0
- Rapes: 0
- Robberies: 0
- Assaults: 0
- Burglaries: 0
- Thefts: 2
- Auto thefts: 0
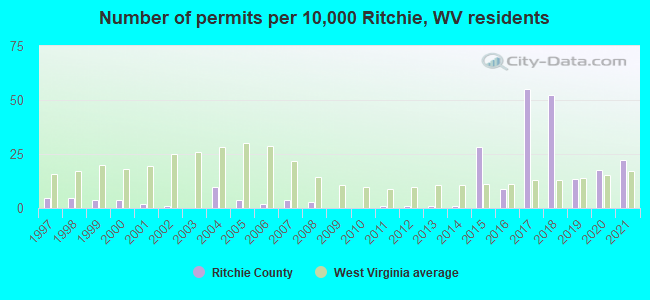
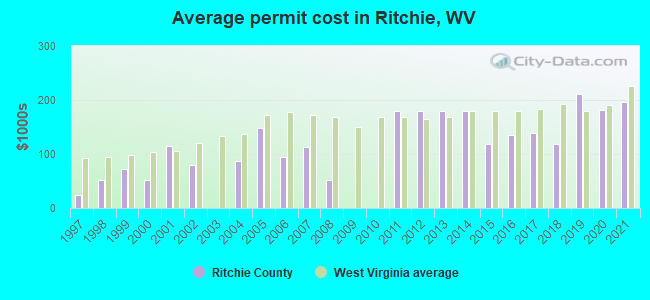
Single-family new house construction building permits:
- 2022: 16 buildings, average cost: $237,500
- 2021: 23 buildings, average cost: $196,700
- 2020: 18 buildings, average cost: $182,100
- 2019: 14 buildings, average cost: $210,700
- 2018: 54 buildings, average cost: $119,000
- 2017: 57 buildings, average cost: $137,900
- 2016: 9 buildings, average cost: $134,900
- 2015: 29 buildings, average cost: $117,700
- 2014: 1 building, cost: $179,400
- 2013: 1 building, cost: $179,400
- 2012: 1 building, cost: $179,400
- 2011: 1 building, cost: $179,400
- 2010: 0 buildings
- 2009: 0 buildings
- 2008: 3 buildings, average cost: $51,000
- 2007: 4 buildings, average cost: $113,000
- 2006: 2 buildings, average cost: $95,000
- 2005: 4 buildings, average cost: $148,800
- 2004: 10 buildings, average cost: $87,100
- 2003: 0 buildings
- 2002: 1 building, cost: $80,000
- 2001: 2 buildings, average cost: $115,000
- 2000: 4 buildings, average cost: $50,800
- 1999: 4 buildings, average cost: $71,500
- 1998: 5 buildings, average cost: $50,600
- 1997: 5 buildings, average cost: $25,000
Median real estate property taxes paid for housing units with mortgages in 2022: $801 (0.6%)
Median real estate property taxes paid for housing units with no mortgage in 2022: $571 (0.6%)
| Ritchie County: | 21.7% |
| West Virginia: | 17.9% |
Median age of residents in 2022: 46.9 years old
(Males: 46.7 years old, Females: 47.0 years old)
(Median age for: White residents: 47.4 years old, Black residents: 11.0 years old, Asian residents: 12.4 years old)
Fair market rent in 2006 for a 1-bedroom apartment in Ritchie County is $400 a month.
Fair market rent for a 2-bedroom apartment is $485 a month.
Fair market rent for a 3-bedroom apartment is $630 a month.
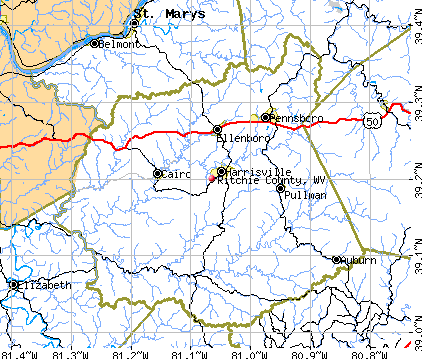
Cities in this county include: Harrisville, Pennsboro, Ellenboro, Cairo, Pullman, Auburn.
Neighboring counties: Chester County, Pennsylvania  , Washington County, Maryland , Jersey County, Illinois
  , Pitkin County, Colorado .
| Here: | 4.9% |
| West Virginia: | 4.0% |
Current college students: 294
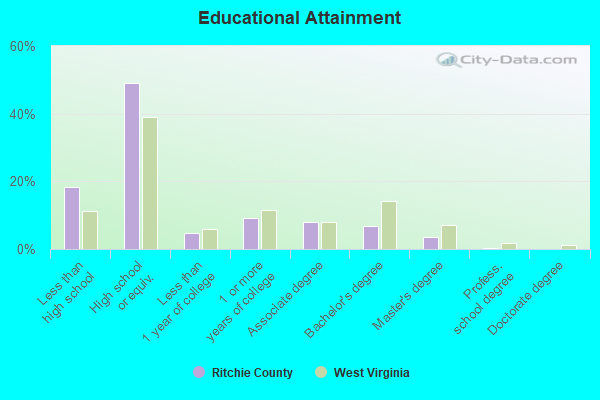
People 25 years of age or older with a high school degree or higher: 83.5%
People 25 years of age or older with a bachelor's degree or higher: 12.3%
Number of foreign born residents: 101 (48.5% naturalized citizens)
| Ritchie County: | 1.2% |
| Whole state: | 1.8% |
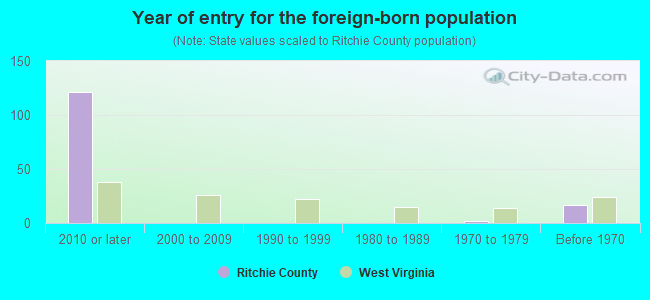
- Year of entry for the foreign-born population
- 592010 or later
- 02000 to 2009
- 01990 to 1999
- 01980 to 1989
- 21970 to 1979
- 17Before 1970
Mean travel time to work (commute): minutes
Percentage of county residents living and working in this county: 96.3%
Housing units in structures:
- One, detached: 3,147
- One, attached: 36
- Two: 25
- 3 or 4: 23
- 5 to 9: 65
- 10 to 19: 3
- 20 or more: 11
- Mobile homes: 912
- Boats, RVs, vans, etc.: 14
Housing units in Ritchie County with a mortgage: 922 (75 second mortgage, 6 home equity loan, 40 both second mortgage and home equity loan)
Houses without a mortgage: 51
| Here: | 94.8% with mortgage |
| State: | 97.1% with mortgage |
Religion statistics for Ritchie County
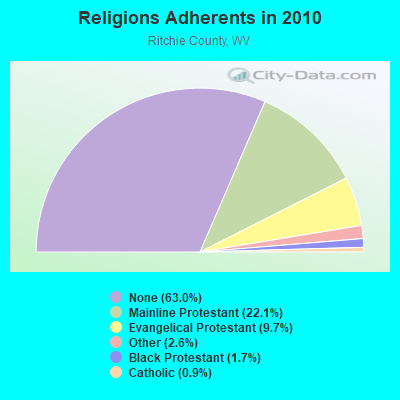
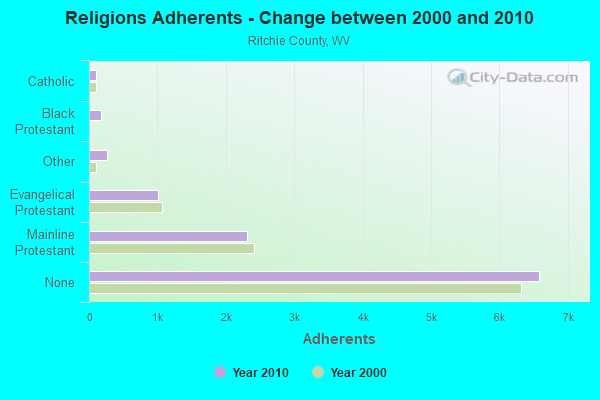
| Religion | Adherents | Congregations |
|---|---|---|
| Mainline Protestant | 2,309 | 27 |
| Evangelical Protestant | 1,013 | 17 |
| Other | 268 | 3 |
| Black Protestant | 178 | 1 |
| Catholic | 97 | 1 |
| None | 6,584 | - |
Source: Clifford Grammich, Kirk Hadaway, Richard Houseal, Dale E.Jones, Alexei Krindatch, Richie Stanley and Richard H.Taylor. 2012. 2010 U.S.Religion Census: Religious Congregations & Membership Study. Association of Statisticians of American Religious Bodies. Jones, Dale E., et al. 2002. Congregations and Membership in the United States 2000. Nashville, TN: Glenmary Research Center.
Food Environment Statistics:
| Ritchie County: | 3.87 / 10,000 pop. |
| State: | 2.41 / 10,000 pop. |
| This county: | 1.94 / 10,000 pop. |
| West Virginia: | 1.09 / 10,000 pop. |
| Ritchie County: | 3.87 / 10,000 pop. |
| West Virginia: | 5.38 / 10,000 pop. |
| This county: | 6.78 / 10,000 pop. |
| State: | 6.22 / 10,000 pop. |
| Ritchie County: | 13.0% |
| West Virginia: | 12.2% |
| Ritchie County: | 30.4% |
| State: | 31.1% |
| Here: | 11.1% |
| State: | 13.1% |
Agriculture in Ritchie County:
Average size of farms: 223 acresAverage value of agricultural products sold per farm: $7,377
Average value of crops sold per acre for harvested cropland: $36.09
The value of livestock, poultry, and their products as a percentage of the total market value of agricultural products sold: 80.96%
Average total farm production expenses per farm: $8,510
Harvested cropland as a percentage of land in farms: 17.46%
Average market value of all machinery and equipment per farm: $23,790
The percentage of farms operated by a family or individual: 96.97%
Average age of principal farm operators: 57 years
Average number of cattle and calves per 100 acres of all land in farms: 8.84
Milk cows as a percentage of all cattle and calves: 0.10%
Land in orchards: 26 acres
Earthquake activity:
Ritchie County-area historical earthquake activity is significantly above West Virginia state average. It is 26% smaller than the overall U.S. average.On 8/23/2011 at 17:51:04, a magnitude 5.8 (5.8 MW, Depth: 3.7 mi, Class: Moderate, Intensity: VI - VII) earthquake occurred 191.4 miles away from Ritchie County center
On 9/25/1998 at 19:52:52, a magnitude 5.2 (4.8 MB, 4.3 MS, 5.2 LG, 4.5 MW, Depth: 3.1 mi) earthquake occurred 162.4 miles away from the county center
On 7/27/1980 at 18:52:21, a magnitude 5.2 (5.1 MB, 4.7 MS, 5.0 UK, 5.2 UK) earthquake occurred 169.8 miles away from the county center
On 1/31/1986 at 16:46:43, a magnitude 5.0 (5.0 MB) earthquake occurred 166.2 miles away from the county center
On 8/9/2020 at 12:07:37, a magnitude 5.1 (5.1 MW, Depth: 4.7 mi) earthquake occurred 188.4 miles away from Ritchie County center
On 9/7/1988 at 02:28:09, a magnitude 4.6 (4.5 MB, 4.6 LG, Class: Light, Intensity: IV - V) earthquake occurred 168.5 miles away from the county center
Magnitude types: regional Lg-wave magnitude (LG), body-wave magnitude (MB), surface-wave magnitude (MS), moment magnitude (MW)
Most recent natural disasters:
- West Virginia Covid-19 Pandemic, Incident Period: January 20, 2020, Major Disaster (Presidential) Declared DR-4517-WV: April 3, 2020, FEMA Id: 4517, Natural disaster type: Other
- West Virginia Severe Storms, Flooding, Landslides, And Mudslides, Incident Period: February 14, 2018 - February 20, 2018, FEMA Id: 4359, Natural disaster type: Storm, Mudslide, Landslide, Flood
- West Virginia Severe Storms, Flooding, Landslides, and Mudslides, Incident Period: April 08, 2015 to April 11, 2015, Major Disaster (Presidential) Declared DR-4220: May 18, 2015, FEMA Id: 4220, Natural disaster type: Storm, Mudslide, Landslide, Flood
- West Virginia Severe Winter Storm, Flooding, Landslides, and Mudslides, Incident Period: March 03, 2015 to March 15, 2015, Major Disaster (Presidential) Declared DR-4210: March 31, 2015, FEMA Id: 4210, Natural disaster type: Winter Storm, Mudslide, Landslide, Flood
- West Virginia Hurricane Sandy, Incident Period: October 29, 2012 to November 08, 2012, Emergency Declared EM-3358: October 29, 2012, FEMA Id: 3358, Natural disaster type: Hurricane
- West Virginia Severe Storms, Incident Period: June 29, 2012 to July 10, 2012, Emergency Declared EM-3345: June 30, 2012, FEMA Id: 3345, Natural disaster type: Storm
- West Virginia Severe Storms and Straight-Line Winds, Incident Period: June 29, 2012 to July 08, 2012, Major Disaster (Presidential) Declared DR-4071: July 23, 2012, FEMA Id: 4071, Natural disaster type: Storm, Wind
- West Virginia Severe Storms, Tornadoes, Flooding, Mudslides, and Landslides, Incident Period: February 29, 2012 to March 05, 2012, Major Disaster (Presidential) Declared DR-4059: March 16, 2012, FEMA Id: 4059, Natural disaster type: Storm, Tornado, Mudslide, Landslide, Flood
- West Virginia Severe Winter Storms and Snowstorms, Incident Period: February 05, 2010 to February 11, 2010, Major Disaster (Presidential) Declared DR-1903: April 23, 2010, FEMA Id: 1903, Natural disaster type: Snowstorm, Winter Storm
- West Virginia Severe Winter Storm and Snowstorm, Incident Period: December 18, 2009 to December 20, 2009, Major Disaster (Presidential) Declared DR-1881: March 02, 2010, FEMA Id: 1881, Natural disaster type: Snowstorm, Winter Storm
- 8 other natural disasters have been reported since 1953.
The number of natural disasters in Ritchie County (18) is near the US average (15).
Major Disasters (Presidential) Declared: 13
Emergencies Declared: 4
Causes of natural disasters: Storms: 9, Floods: 8, Landslides: 7, Mudslides: 5, Winter Storms: 5, Tornadoes: 3, Hurricanes: 2, Snowstorms: 2, Blizzard: 1, Snowfall: 1, Wind: 1, Other: 1 (Note: some incidents may be assigned to more than one category).
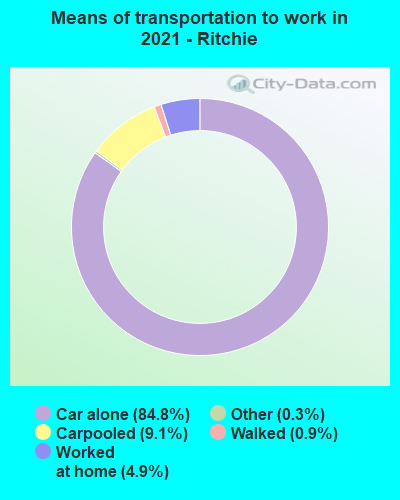
Means of transportation to work:
- Drove a car alone: 3,025 (81.3%)
- Carpooled: 343 (9.2%)
- Taxicab, motorcycle, or other means: 21 (0.6%)
- Walked: 37 (1.0%)
- Worked at home: 285 (7.7%)
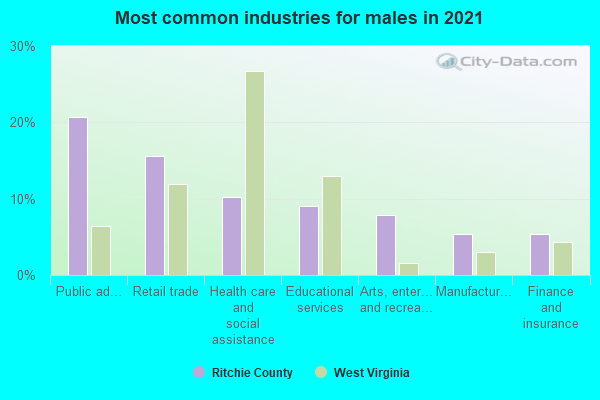
- Public administration (20%)
- Retail trade (13%)
- Educational services (10%)
- Health care and social assistance (9%)
- Arts, entertainment, and recreation (7%)
- Accommodation and food services (5%)
- Other services, except public administration (4%)
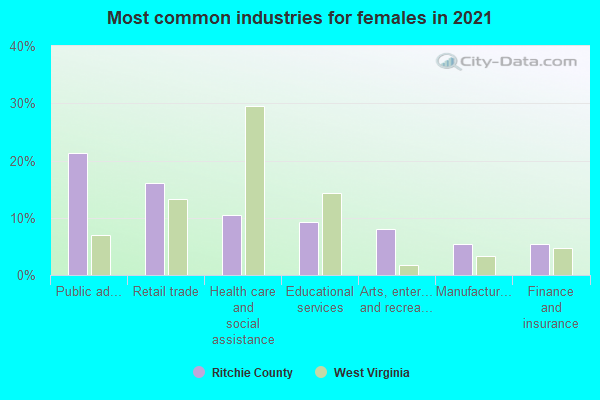
- Public administration (22%)
- Retail trade (14%)
- Educational services (11%)
- Health care and social assistance (10%)
- Arts, entertainment, and recreation (7%)
- Accommodation and food services (5%)
- Other services, except public administration (5%)
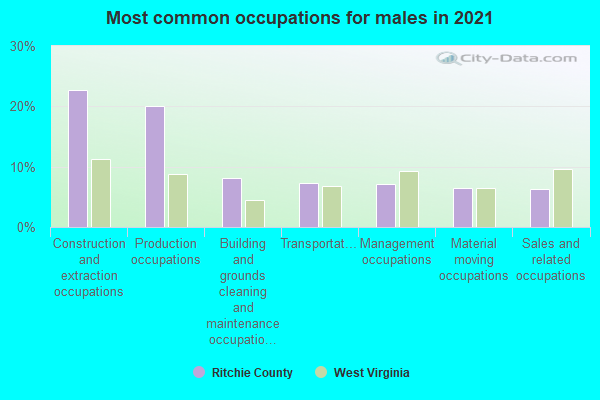
- Construction and extraction occupations (21%)
- Production occupations (20%)
- Transportation occupations (9%)
- Building and grounds cleaning and maintenance occupations (7%)
- Material moving occupations (7%)
- Management occupations (7%)
- Sales and related occupations (7%)
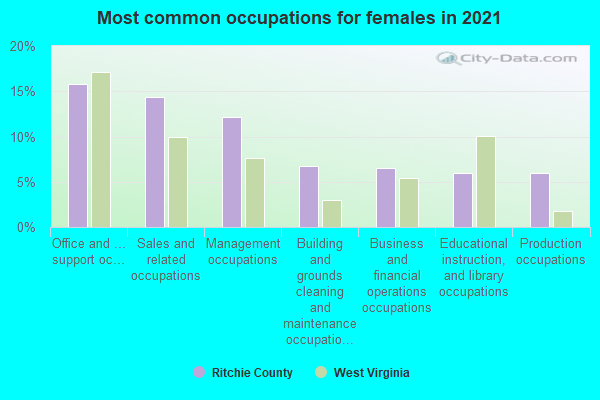
- Sales and related occupations (17%)
- Office and administrative support occupations (17%)
- Educational instruction, and library occupations (9%)
- Production occupations (9%)
- Management occupations (8%)
- Building and grounds cleaning and maintenance occupations (7%)
- Business and financial operations occupations (7%)
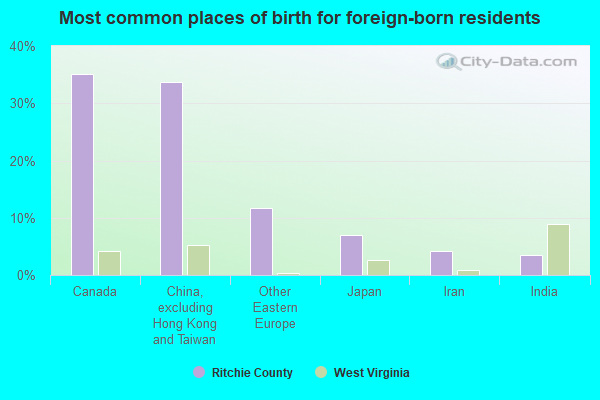
- China, excluding Hong Kong and Taiwan (54%)
- Other Eastern Europe (12%)
- Iran (9%)
- United Kingdom, excluding England and Scotland (9%)
- India (8%)
- Canada (5%)
- Ireland (0%)
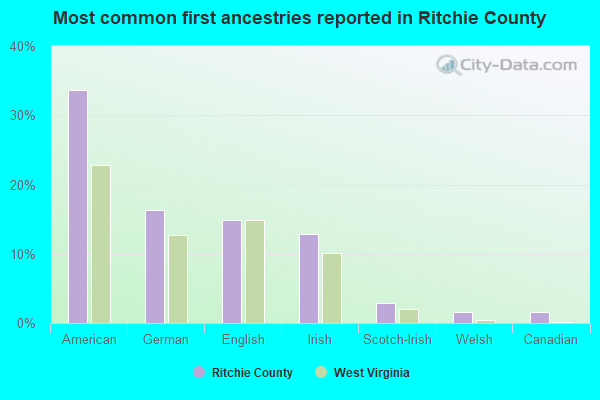
- American (35%)
- German (16%)
- English (15%)
- Irish (11%)
- Scotch-Irish (3%)
- Dutch (1%)
- Welsh (1%)
54 people in nursing homes
22 people in local jails and other confinement facilities (including police lockups)
5.21% of this county's 2021 resident taxpayers lived in other counties in 2020 ($50,605 average adjusted gross income)
| Here: | 5.21% |
| West Virginia average: | 5.74% |
10 or fewer of this county's residents moved from foreign countries.
3.45% relocated from other counties in West Virginia ($27,520 average AGI)
1.77% relocated from other states ($23,085 average AGI)
Ritchie County: 1.77% West Virginia average: 3.02%
Top counties from which taxpayers relocated into this county between 2020 and 2021:
| from Wood County, WV |
5.07% of this county's 2020 resident taxpayers moved to other counties in 2021 ($38,267 average adjusted gross income)
| Here: | 5.07% |
| West Virginia average: | 5.65% |
10 or fewer of this county's residents moved to foreign countries.
3.63% relocated to other counties in West Virginia ($27,669 average AGI)
1.45% relocated to other states ($10,599 average AGI)
Ritchie County: 1.45% West Virginia average: 2.93%
Top counties to which taxpayers relocated from this county between 2020 and 2021:
| to Wood County, WV |
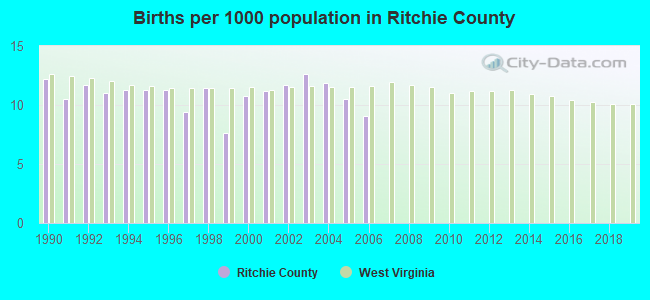
Births per 1000 population from 1990 to 1999: 10.8
Births per 1000 population from 2000 to 2006: 11.1
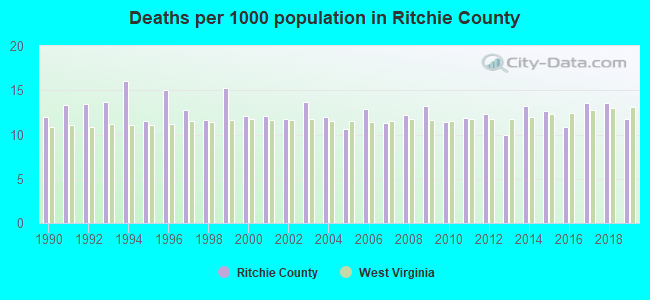
Deaths per 1000 population from 1990 to 1999: 13.4
Deaths per 1000 population from 2000 to 2009: 12.2
Deaths per 1000 population from 2010 to 2020: 12.3
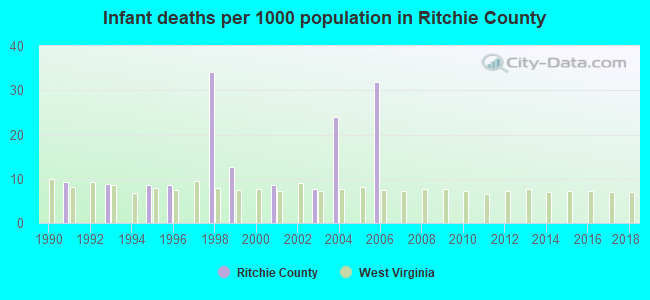
Infant deaths per 1000 live births from 1990 to 1999: 8.2
Infant deaths per 1000 live births from 2000 to 2006: 10.3
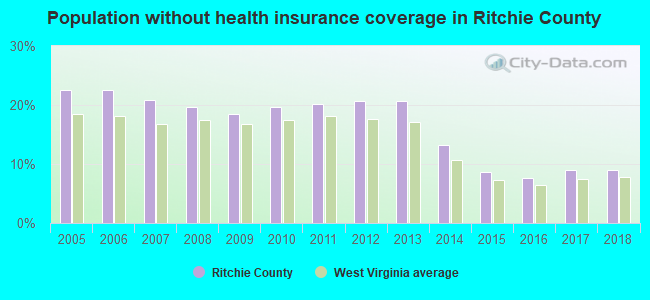
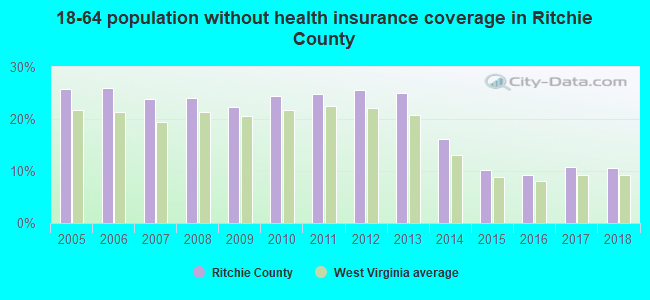
Persons under 19 years old without health insurance coverage in 2018: 4.1%
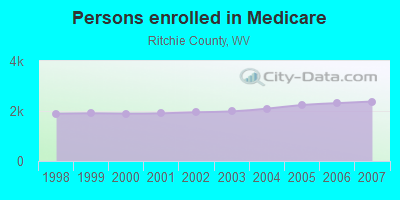
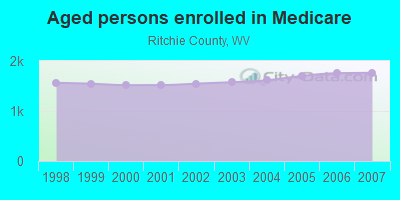
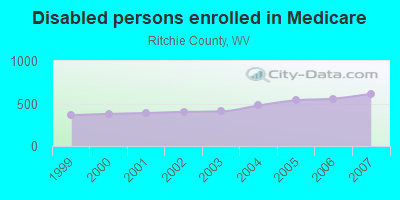
Persons enrolled in hospital insurance and/or supplemental medical insurance (Medicare) in July 1, 2007: 2,380 (1,765 aged, 615 disabled)
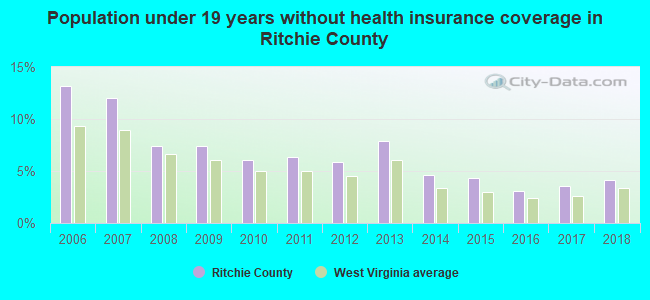
Children under 18 without health insurance coverage in 2007: 247 (11%)
Most common underlying causes of death in Ritchie County, West Virginia in 1999 - 2019:
- Acute myocardial infarction, unspecified (100)
- Atherosclerotic heart disease (99)
- Bronchus or lung, unspecified - Malignant neoplasms (93)
- Chronic obstructive pulmonary disease, unspecified (53)
- Atherosclerotic cardiovascular disease, so described (35)
- Stroke, not specified as haemorrhage or infarction (11)
Population without health insurance coverage in 2000: 14%
Children under 18 without health insurance coverage in 2000: 9%
Medical specialist MDs per 100,000 population in 2005: 1,290
Total births per 100,000 population, July 2005 - July 2006 : 19
Total deaths per 100,000 population, July 2005 - July 2006: 38
Limited-service eating places per 100,000 population in 2005 : 9
Household type by relationship:
Households: 8,422- Male householders: 1,810 (461 living alone), Female householders: 1,534 (363 living alone)
1,895 spouses (1,895 opposite-sex spouses), 226 unmarried partners, (221 opposite-sex unmarried partners), 2,121 children (1,887 natural, 88 adopted, 145 stepchildren), 230 grandchildren, 92 brothers or sisters, 97 parents, 109 foster children, 43 other relatives, 200 non-relatives
- In group quarters: 45
Size of family households: 1,184 2-persons, 617 3-persons, 394 4-persons, 172 5-persons, 4 6-persons, 10 7-or-more-persons.
Size of nonfamily households: 823 1-person, 128 2-persons, 16 3-persons, 1 6-persons.
946 married couples with children.
405 single-parent households (58 men, 347 women).
97.5% of residents of Ritchie speak English at home.
1.4% of residents speak Spanish at home (94% speak English very well, 6% speak English well).
0.3% of residents speak other Indo-European language at home (41% speak English very well, 37% speak English well, 4% speak English not well, 19% don't speak English at all).
0.7% of residents speak Asian or Pacific Island language at home (6% speak English very well, 72% speak English well, 21% speak English not well, 2% don't speak English at all).
In fiscal year 2004:
Federal Government expenditure: $64,465,000 ($6,148 per capita)
Department of Defense expenditure: $985,000
Federal direct payments to individuals for retirement and disability: $30,832,000
Federal other direct payments to individuals: $13,246,000
Federal direct payments not to individuals: $25,000
Federal grants: $17,082,000
Federal procurement contracts: $530,000 ($0,000 Department of Defense)
Federal salaries and wages: $2,749,000 ($0,000 Department of Defense)
Federal Government direct loans: $1,108,000
Federal guaranteed/insured loans: $262,000
Federal Government insurance: $3,456,000
Population change from April 1, 2000 to July 1, 2005:
Births: 639| Here: | 61 per 1000 residents |
| State: | 60 per 1000 residents |
Deaths: 690
| Here: | 65 per 1000 residents |
| State: | 61 per 1000 residents |
Net international migration: 0
| Here: | 0 per 1000 residents |
| State: | +2 per 1000 residents |
Net internal migration: +263
| Here: | +25 per 1000 residents |
| State: | +6 per 1000 residents |
Total withdrawal of fresh water for public supply: 0.52 millions of gallons per day (all from surface)
| Here: | 6.2 |
| State: | 6.5 |
| Here: | 5.4 |
| State: | 4.7 |
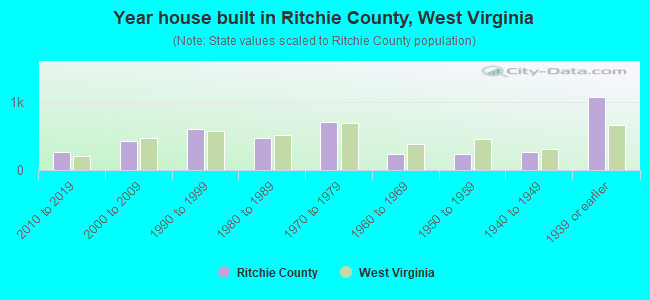
- Year house built in Ritchie County, West Virginia
- 02020 or later
- 3162010 to 2019
- 5612000 to 2009
- 6221990 to 1999
- 3771980 to 1989
- 5701970 to 1979
- 2681960 to 1969
- 2021950 to 1959
- 2771940 to 1949
- 1,0071939 or earlier
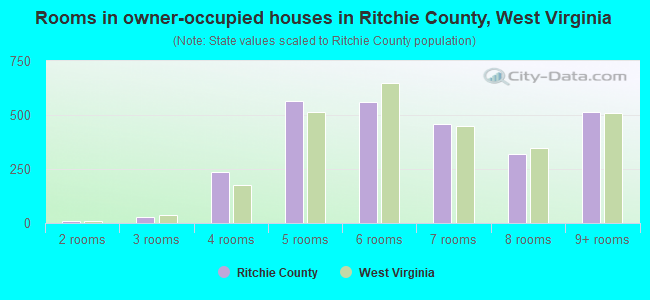
- Rooms in owner-occupied houses in Ritchie County, West Virginia
- 91 room
- 202 rooms
- 303 rooms
- 3864 rooms
- 5855 rooms
- 5816 rooms
- 4777 rooms
- 2618 rooms
- 4699+ rooms
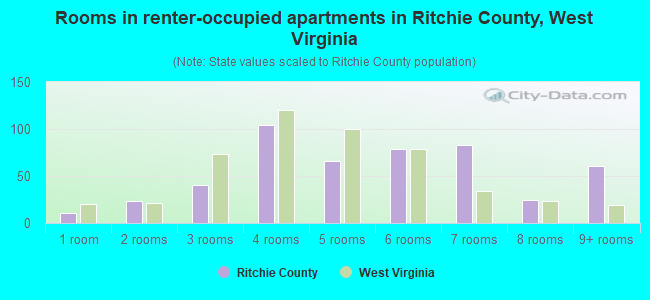
- Rooms in renter-occupied apartments in Ritchie County, West Virginia
- 71 room
- 192 rooms
- 353 rooms
- 804 rooms
- 1315 rooms
- 896 rooms
- 1197 rooms
- 188 rooms
- 539+ rooms
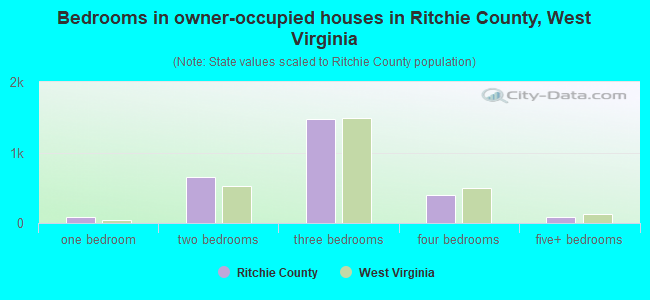
- Bedrooms in owner-occupied houses in Ritchie County, West Virginia
- 10no bedroom
- 1391 bedroom
- 6892 bedrooms
- 1,5323 bedrooms
- 3774 bedrooms
- 675+ bedrooms
- Bedrooms in renter-occupied apartments in Ritchie County, West Virginia
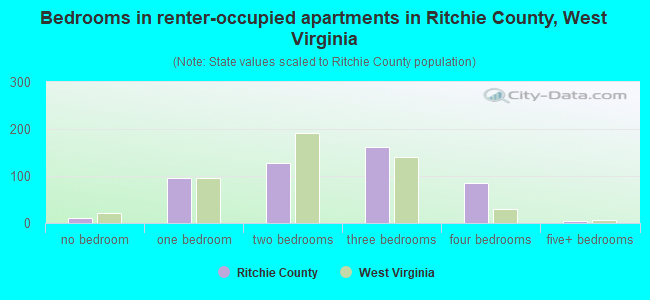
- 7no bedroom
- 931 bedroom
- 1162 bedrooms
- 2143 bedrooms
- 1174 bedrooms
- 35+ bedrooms
- Cars and other vehicles available in Ritchie County in owner-occupied houses/condos
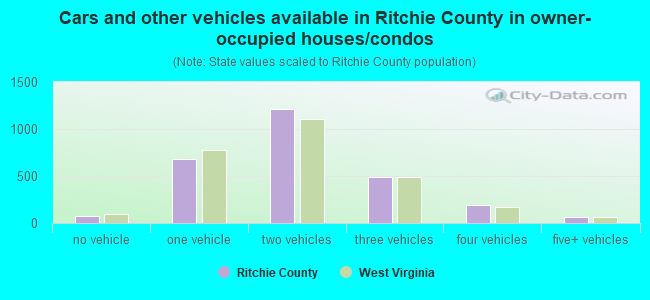
- 101no vehicle
- 7421 vehicle
- 1,3062 vehicles
- 4783 vehicles
- 1174 vehicles
- 815+ vehicles
- Cars and other vehicles available in Ritchie County in renter-occupied apartments
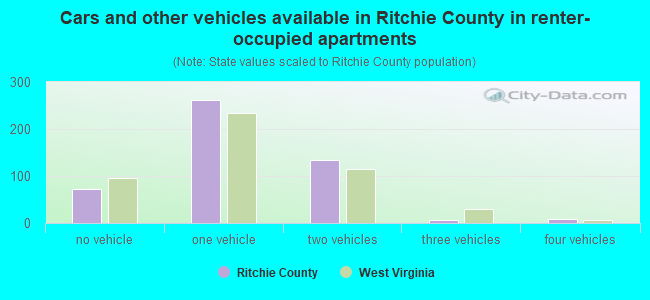
- 52no vehicle
- 3381 vehicle
- 1302 vehicles
- 53 vehicles
- 84 vehicles
- 05+ vehicles
91.7% of Ritchie County residents lived in the same house 1 years ago.
Out of people who lived in different houses, 19% lived in this county.
Out of people who lived in different counties, 77% lived in West Virginia.
| Ritchie County: | 91.7% |
| State average: | 89.6% |
Place of birth for U.S.-born residents:
- This state: 6,605
- Other state: 1,634
- Northeast: 270
- Midwest: 771
- South: 549
- West: 39
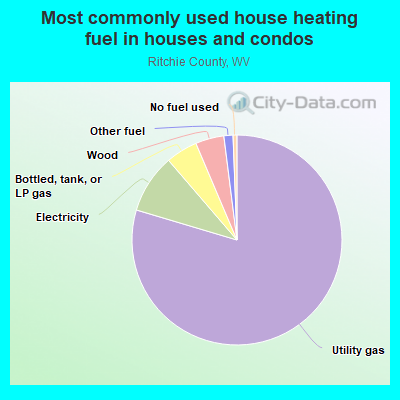
- 79.7%Utility gas
- 10.1%Electricity
- 4.3%Wood
- 4.2%Bottled, tank, or LP gas
- 1.1%Other fuel
- 0.7%No fuel used
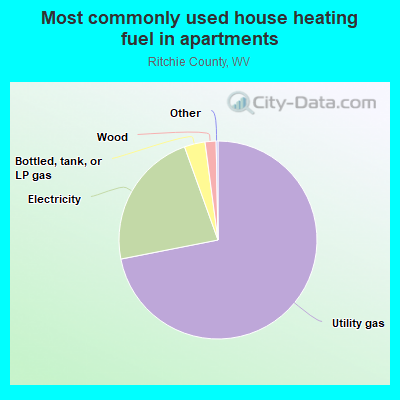
- 74.8%Utility gas
- 21.4%Electricity
- 3.4%Bottled, tank, or LP gas
- 0.4%Wood
Private vs. public school enrollment:
| Here: | 9.9% |
| West Virginia: | 12.2% |
| Here: | 16.7% |
| West Virginia: | 8.8% |
| Here: | 43.8% |
| West Virginia: | 17.3% |

Ritchie County government finances - Expenditure in 2020:
- Bond Funds - Cash and Securities: $1,326,000
Cash and Securities: $1,194,000
- Charges - Other: $1,469,000
Other: $1,392,000
- Current Operations - Health - Other: $3,008,000
Health - Other: $2,999,000
Central Staff Services: $1,173,000
Central Staff Services: $1,170,000
Police Protection: $966,000
Police Protection: $963,000
Financial Administration: $871,000
Financial Administration: $868,000
Libraries: $737,000
Libraries: $735,000
General - Other: $610,000
General - Other: $609,000
Judicial and Legal Services: $272,000
Judicial and Legal Services: $272,000
General Public Buildings: $173,000
General Public Buildings: $173,000
Parks and Recreation: $147,000
Parks and Recreation: $146,000
Corrections - Other: $39,000
Corrections - Other: $39,000
Public Welfare - Other: $12,000
Solid Waste Management: $12,000
Public Welfare - Other: $12,000
Solid Waste Management: $12,000
Local Fire Protection: $7,000
Local Fire Protection: $7,000
- Miscellaneous - General Revenue - Other: $171,000
General Revenue - Other: $167,000
Fines and Forfeits: $88,000
Fines and Forfeits: $86,000
Sale of Property: $25,000
Sale of Property: $24,000
Interest Earnings: $10,000
Interest Earnings: $10,000
- Other Capital Outlay - General - Other: $454,000
General - Other: $454,000
- Other Funds - Cash and Securities: $3,221,000
Cash and Securities: $2,903,000
- State Intergovernmental - General Local Government Support: $623,000
General Local Government Support: $565,000
Health and Hospitals: $505,000
Health and Hospitals: $458,000
Other: $189,000
Other: $172,000
- Tax - Property: $4,688,000
Property: $4,604,000
Other: $261,000
Other: $256,000
Other Selective Sales: $144,000
Other Selective Sales: $141,000
Other License: $17,000
Other License: $17,000
Alcoholic Beverage Sales: $1,000
Alcoholic Beverage Sales: $1,000
Ritchie County government finances - Revenue in 2020:
- Bond Funds - Cash and Securities: $1,326,000
Cash and Securities: $1,194,000
- Charges - Other: $1,469,000
Other: $1,392,000
- Current Operations - Health - Other: $3,008,000
Health - Other: $2,999,000
Central Staff Services: $1,173,000
Central Staff Services: $1,170,000
Police Protection: $966,000
Police Protection: $963,000
Financial Administration: $871,000
Financial Administration: $868,000
Libraries: $737,000
Libraries: $735,000
General - Other: $610,000
General - Other: $609,000
Judicial and Legal Services: $272,000
Judicial and Legal Services: $272,000
General Public Buildings: $173,000
General Public Buildings: $173,000
Parks and Recreation: $147,000
Parks and Recreation: $146,000
Corrections - Other: $39,000
Corrections - Other: $39,000
Public Welfare - Other: $12,000
Solid Waste Management: $12,000
Public Welfare - Other: $12,000
Solid Waste Management: $12,000
Local Fire Protection: $7,000
Local Fire Protection: $7,000
- Miscellaneous - General Revenue - Other: $171,000
General Revenue - Other: $167,000
Fines and Forfeits: $88,000
Fines and Forfeits: $86,000
Sale of Property: $25,000
Sale of Property: $24,000
Interest Earnings: $10,000
Interest Earnings: $10,000
- Other Capital Outlay - General - Other: $454,000
General - Other: $454,000
- Other Funds - Cash and Securities: $3,221,000
Cash and Securities: $2,903,000
- State Intergovernmental - General Local Government Support: $623,000
General Local Government Support: $565,000
Health and Hospitals: $505,000
Health and Hospitals: $458,000
Other: $189,000
Other: $172,000
- Tax - Property: $4,688,000
Property: $4,604,000
Other: $261,000
Other: $256,000
Other Selective Sales: $144,000
Other Selective Sales: $141,000
Other License: $17,000
Other License: $17,000
Alcoholic Beverage Sales: $1,000
Alcoholic Beverage Sales: $1,000
Ritchie County government finances - Debt in 2020:
- Bond Funds - Cash and Securities: $1,326,000
Cash and Securities: $1,194,000
- Charges - Other: $1,469,000
Other: $1,392,000
- Current Operations - Health - Other: $3,008,000
Health - Other: $2,999,000
Central Staff Services: $1,173,000
Central Staff Services: $1,170,000
Police Protection: $966,000
Police Protection: $963,000
Financial Administration: $871,000
Financial Administration: $868,000
Libraries: $737,000
Libraries: $735,000
General - Other: $610,000
General - Other: $609,000
Judicial and Legal Services: $272,000
Judicial and Legal Services: $272,000
General Public Buildings: $173,000
General Public Buildings: $173,000
Parks and Recreation: $147,000
Parks and Recreation: $146,000
Corrections - Other: $39,000
Corrections - Other: $39,000
Public Welfare - Other: $12,000
Solid Waste Management: $12,000
Public Welfare - Other: $12,000
Solid Waste Management: $12,000
Local Fire Protection: $7,000
Local Fire Protection: $7,000
- Miscellaneous - General Revenue - Other: $171,000
General Revenue - Other: $167,000
Fines and Forfeits: $88,000
Fines and Forfeits: $86,000
Sale of Property: $25,000
Sale of Property: $24,000
Interest Earnings: $10,000
Interest Earnings: $10,000
- Other Capital Outlay - General - Other: $454,000
General - Other: $454,000
- Other Funds - Cash and Securities: $3,221,000
Cash and Securities: $2,903,000
- State Intergovernmental - General Local Government Support: $623,000
General Local Government Support: $565,000
Health and Hospitals: $505,000
Health and Hospitals: $458,000
Other: $189,000
Other: $172,000
- Tax - Property: $4,688,000
Property: $4,604,000
Other: $261,000
Other: $256,000
Other Selective Sales: $144,000
Other Selective Sales: $141,000
Other License: $17,000
Other License: $17,000
Alcoholic Beverage Sales: $1,000
Alcoholic Beverage Sales: $1,000
Ritchie County government finances - Cash and Securities in 2020:
- Bond Funds - Cash and Securities: $1,326,000
Cash and Securities: $1,194,000
- Charges - Other: $1,469,000
Other: $1,392,000
- Current Operations - Health - Other: $3,008,000
Health - Other: $2,999,000
Central Staff Services: $1,173,000
Central Staff Services: $1,170,000
Police Protection: $966,000
Police Protection: $963,000
Financial Administration: $871,000
Financial Administration: $868,000
Libraries: $737,000
Libraries: $735,000
General - Other: $610,000
General - Other: $609,000
Judicial and Legal Services: $272,000
Judicial and Legal Services: $272,000
General Public Buildings: $173,000
General Public Buildings: $173,000
Parks and Recreation: $147,000
Parks and Recreation: $146,000
Corrections - Other: $39,000
Corrections - Other: $39,000
Public Welfare - Other: $12,000
Solid Waste Management: $12,000
Public Welfare - Other: $12,000
Solid Waste Management: $12,000
Local Fire Protection: $7,000
Local Fire Protection: $7,000
- Miscellaneous - General Revenue - Other: $171,000
General Revenue - Other: $167,000
Fines and Forfeits: $88,000
Fines and Forfeits: $86,000
Sale of Property: $25,000
Sale of Property: $24,000
Interest Earnings: $10,000
Interest Earnings: $10,000
- Other Capital Outlay - General - Other: $454,000
General - Other: $454,000
- Other Funds - Cash and Securities: $3,221,000
Cash and Securities: $2,903,000
- State Intergovernmental - General Local Government Support: $623,000
General Local Government Support: $565,000
Health and Hospitals: $505,000
Health and Hospitals: $458,000
Other: $189,000
Other: $172,000
- Tax - Property: $4,688,000
Property: $4,604,000
Other: $261,000
Other: $256,000
Other Selective Sales: $144,000
Other Selective Sales: $141,000
Other License: $17,000
Other License: $17,000
Alcoholic Beverage Sales: $1,000
Alcoholic Beverage Sales: $1,000
Supplemental Security Income (SSI) in 2006:
- Total number of recipients: 597
- Number of aged recipients: 50
- Number of blind and disabled recipients: 547
- Number of recipients under 18: 76
- Number of recipients between 18 and 64: 404
- Number of recipients older than 64: 117
- Number of recipients also receiving OASDI: 220
- Amount of payments (thousands of dollars): 271
| Most common first names in Ritchie County, WV among deceased individuals | ||
| Name | Count | Lived (average) |
|---|---|---|
| Mary | 92 | 79.7 years |
| John | 80 | 76.1 years |
| William | 78 | 74.5 years |
| James | 76 | 74.6 years |
| Charles | 61 | 77.0 years |
| George | 38 | 78.3 years |
| Robert | 38 | 67.9 years |
| Harry | 30 | 73.2 years |
| Carl | 28 | 72.2 years |
| Virginia | 27 | 81.1 years |
| Most common last names in Ritchie County, WV among deceased individuals | ||
| Last name | Count | Lived (average) |
|---|---|---|
| Jones | 68 | 73.2 years |
| Wilson | 53 | 80.8 years |
| Smith | 47 | 81.4 years |
| Davis | 39 | 78.3 years |
| Collins | 39 | 78.8 years |
| Richards | 32 | 75.9 years |
| Goff | 29 | 77.3 years |
| Layfield | 27 | 79.3 years |
| Cunningham | 26 | 75.2 years |
| Reed | 26 | 75.2 years |
| Businesses in Ritchie County, WV | ||||
| Name | Count | Name | Count | |
|---|---|---|---|---|
| 7-Eleven | 2 | McDonald's | 1 | |
| Ace Hardware | 1 | Rite Aid | 1 | |
| Dairy Queen | 1 | Subway | 1 | |
| H&R Block | 1 | |||