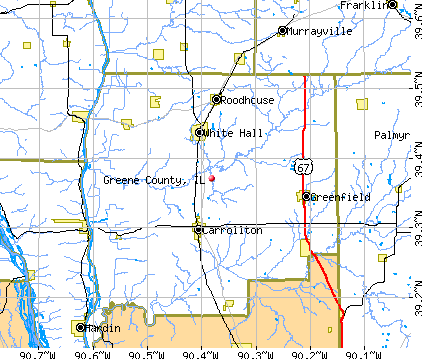
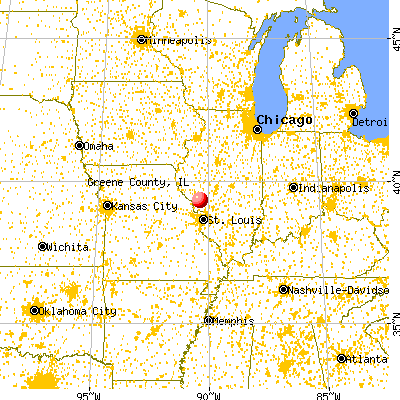
Greene County, Illinois (IL)
County owner-occupied free and clear houses and condos in 2010: 1,987
County owner-occupied houses and condos in 2000: 4,398
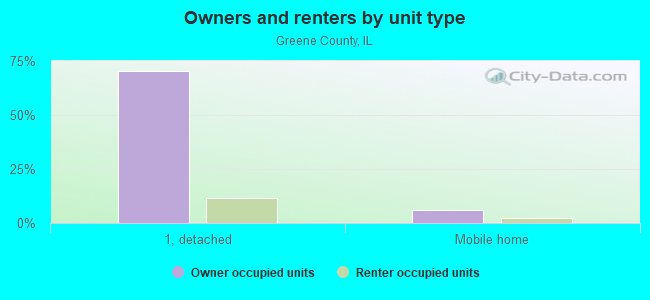
Renter-occupied apartments: 1,311 (it was 1,359 in 2000)
| % of renters here: | 24% |
| State: | 33% |
Land area: 543 sq. mi.
Water area: 3.3 sq. mi.
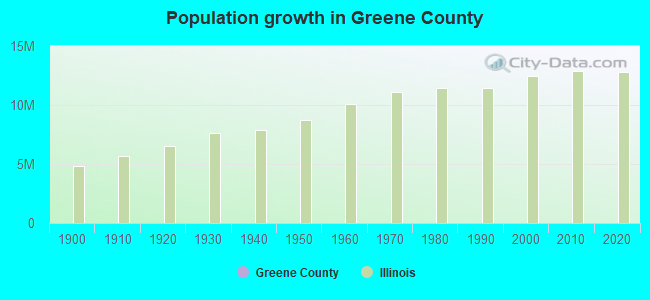
Population density: 22 people per square mile (low).
Industries providing employment: Educational, health and social services (23.0%), Retail trade (12.0%), Manufacturing (10.7%).
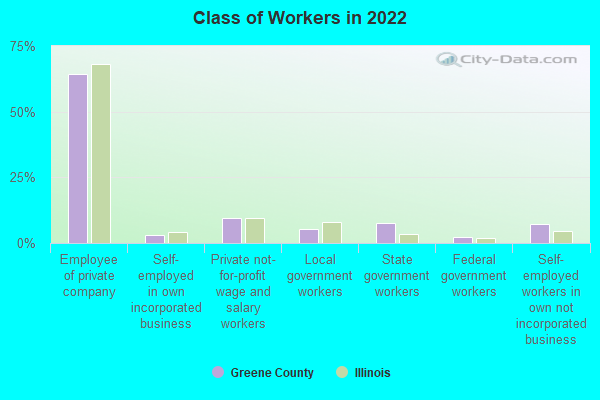
Type of workers:
- Private wage or salary: 77%
- Government: 15%
- Self-employed, not incorporated: 7%
- Unpaid family work: 0%
- OSM Map
- General Map
- Google Map
- MSN Map

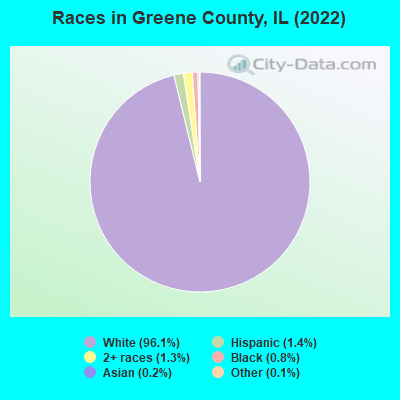
- 11,21596.1%White Non-Hispanic Alone
- 1591.4%Hispanic or Latino
- 1481.3%Two or more races
- 980.8%Black Non-Hispanic Alone
- 250.2%Asian alone
- 160.1%Some other race alone
- 100.09%American Indian and Alaska Native alone
- 10.01%Native Hawaiian and Other
Pacific Islander alone
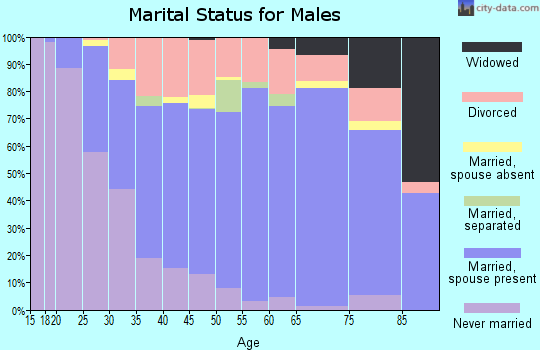
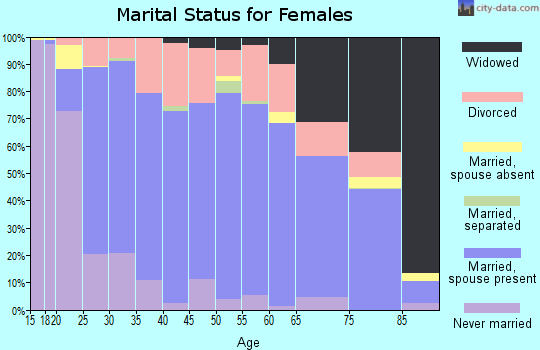
| Median resident age: | 43.1 years |
| Illinois median age: | 39.1 years |
| Males: 5,969 | |
| Females: 5,880 |

| Greene County: | 2.0 people |
| Illinois: | 3 people |
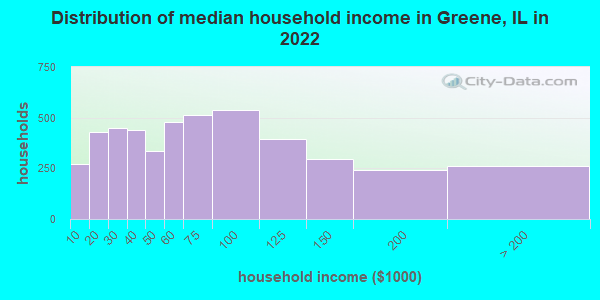
Estimated median household income in 2022: $57,604 ($31,754 in 1999)
| This county: | $57,604 |
| Illinois: | $76,708 |
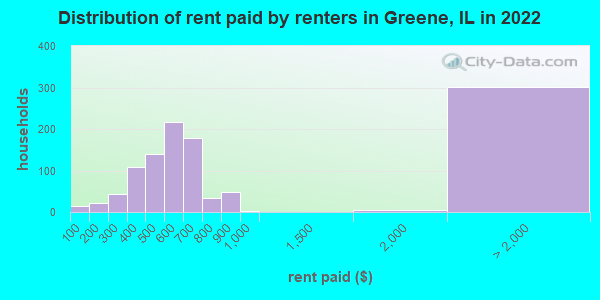
Median contract rent in 2022 for apartments: $515 (lower quartile is $396, upper quartile is $621)
| This county: | $515 |
| State: | $1008 |
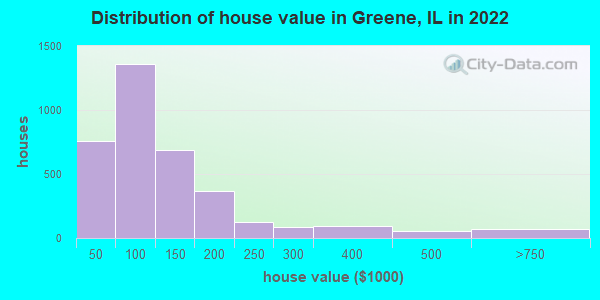
Estimated median house or condo value in 2022: $97,231 (it was $49,200 in 2000)
| Greene: | $97,231 |
| Illinois: | $251,600 |
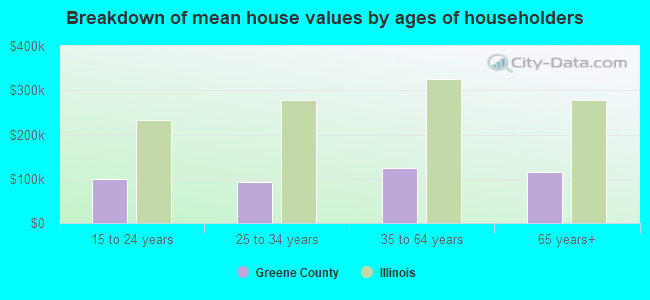
Mean price in 2022:
Median monthly housing costs for homes and condos with a mortgage: $984Detached houses: $135,888
Here: $135,888 State: $310,164 Townhouses or other attached units: $106,138
Here: $106,138 State: $286,230 Mobile homes: $92,090
Here: $92,090 State: $78,855
Median monthly housing costs for units without a mortgage: $463
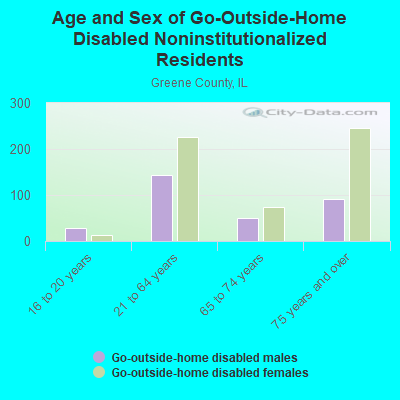
Institutionalized population: 284
Crime in 2020 (reported by the sheriff's office or county police, not the county total):
- Murders: 0
- Rapes: 0
- Robberies: 0
- Assaults: 3
- Burglaries: 4
- Thefts: 2
- Auto thefts: 0
Crime in 2019 (reported by the sheriff's office or county police, not the county total):
- Murders: 0
- Rapes: 0
- Robberies: 0
- Assaults: 9
- Burglaries: 4
- Thefts: 15
- Auto thefts: 1
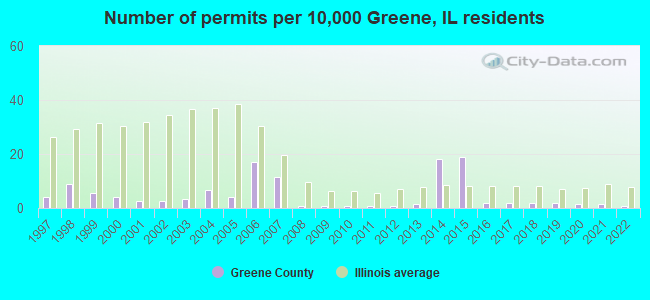
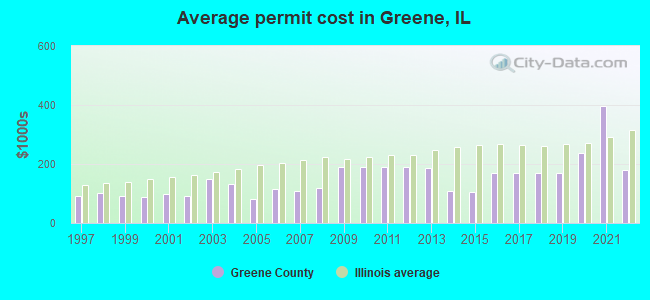
Single-family new house construction building permits:
- 2022: 1 building, cost: $180,000
- 2021: 2 buildings, average cost: $395,500
- 2020: 2 buildings, average cost: $237,700
- 2019: 3 buildings, average cost: $170,300
- 2018: 3 buildings, average cost: $170,300
- 2017: 3 buildings, average cost: $170,300
- 2016: 3 buildings, average cost: $170,300
- 2015: 28 buildings, average cost: $105,000
- 2014: 27 buildings, average cost: $107,000
- 2013: 2 buildings, average cost: $186,700
- 2012: 1 building, cost: $190,000
- 2011: 1 building, cost: $190,000
- 2010: 1 building, cost: $190,000
- 2009: 1 building, cost: $190,000
- 2008: 1 building, cost: $120,000
- 2007: 17 buildings, average cost: $110,300
- 2006: 25 buildings, average cost: $113,500
- 2005: 6 buildings, average cost: $83,300
- 2004: 10 buildings, average cost: $133,400
- 2003: 5 buildings, average cost: $148,800
- 2002: 4 buildings, average cost: $90,000
- 2001: 4 buildings, average cost: $98,900
- 2000: 6 buildings, average cost: $89,300
- 1999: 8 buildings, average cost: $92,100
- 1998: 13 buildings, average cost: $102,100
- 1997: 6 buildings, average cost: $91,100
Median real estate property taxes paid for housing units with mortgages in 2022: $1,772 (1.7%)
Median real estate property taxes paid for housing units with no mortgage in 2022: $1,205 (1.3%)
| Greene County: | 13.9% |
| Illinois: | 11.9% |
Median age of residents in 2022: 43.1 years old
(Males: 42.3 years old, Females: 45.7 years old)
(Median age for: White residents: 43.9 years old, Black residents: 29.2 years old, American Indian residents: 59.6 years old, Asian residents: 19.1 years old, Hispanic or Latino residents: 26.1 years old, Other race residents: 47.9 years old)
Fair market rent in 2006 for a 1-bedroom apartment in Greene County is $377 a month.
Fair market rent for a 2-bedroom apartment is $495 a month.
Fair market rent for a 3-bedroom apartment is $627 a month.
Cities in this county include: White Hall, Carrollton, Roodhouse, Greenfield, Kane, Eldred, Rockbridge, Hillview.
Neighboring counties: Carbon County, Utah  , Calhoun County
  , Frederick County, Maryland
  , Cumberland County , Monroe County, Missouri , Wabaunsee County, Kansas , Wyandotte County, Kansas .
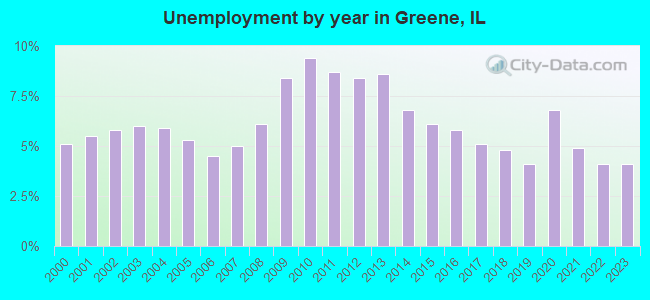
| Here: | 4.1% |
| Illinois: | 4.2% |
Current college students: 436
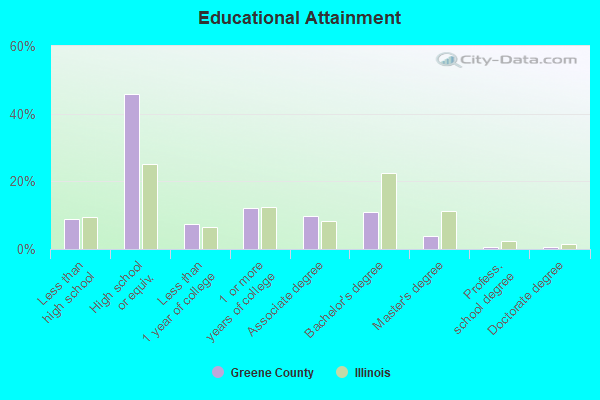
People 25 years of age or older with a high school degree or higher: 90.4%
People 25 years of age or older with a bachelor's degree or higher: 15.4%
Number of foreign born residents: 39 (33.5% naturalized citizens)
| Greene County: | 0.3% |
| Whole state: | 14.4% |
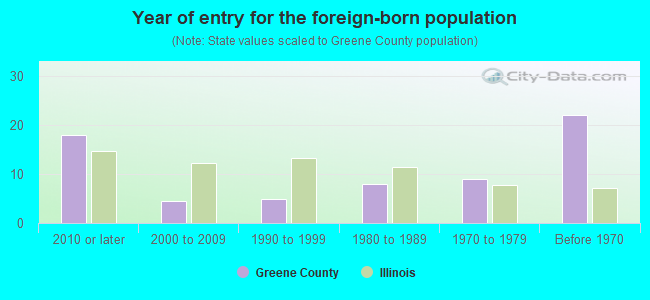
- Year of entry for the foreign-born population
- 182010 or later
- 52000 to 2009
- 51990 to 1999
- 81980 to 1989
- 91970 to 1979
- 22Before 1970
Mean travel time to work (commute): minutes
Percentage of county residents living and working in this county: 97.1%
Housing units in structures:
- One, detached: 4,845
- One, attached: 18
- Two: 142
- 3 or 4: 114
- 5 to 9: 93
- 20 or more: 4
- Mobile homes: 564
Housing units in Greene County with a mortgage: 1,450 (107 second mortgage, 1 home equity loan, 95 both second mortgage and home equity loan)
Houses without a mortgage: 16
| Here: | 5.9% with mortgage |
| State: | 97.4% with mortgage |
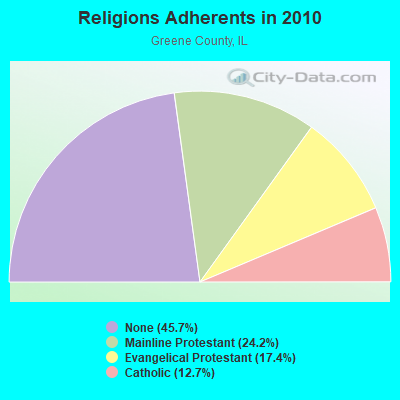
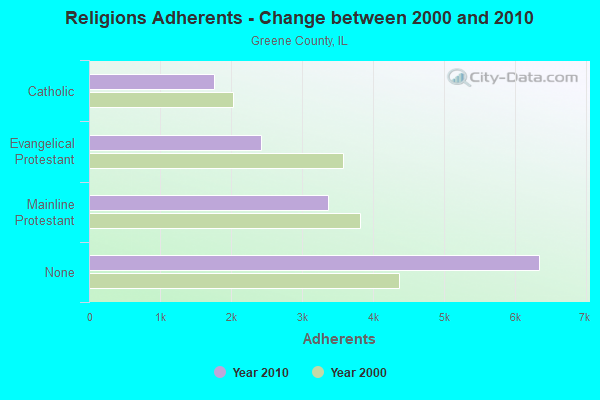
Religion statistics for Greene County
| Religion | Adherents | Congregations |
|---|---|---|
| Mainline Protestant | 3,359 | 18 |
| Evangelical Protestant | 2,420 | 19 |
| Catholic | 1,764 | 3 |
| Other | 1 | - |
| None | 6,342 | - |
Source: Clifford Grammich, Kirk Hadaway, Richard Houseal, Dale E.Jones, Alexei Krindatch, Richie Stanley and Richard H.Taylor. 2012. 2010 U.S.Religion Census: Religious Congregations & Membership Study. Association of Statisticians of American Religious Bodies. Jones, Dale E., et al. 2002. Congregations and Membership in the United States 2000. Nashville, TN: Glenmary Research Center.
Food Environment Statistics:
| Greene County: | 4.37 / 10,000 pop. |
| State: | 2.24 / 10,000 pop. |
| Greene County: | 6.56 / 10,000 pop. |
| Illinois: | 2.61 / 10,000 pop. |
| This county: | 5.83 / 10,000 pop. |
| State: | 6.86 / 10,000 pop. |
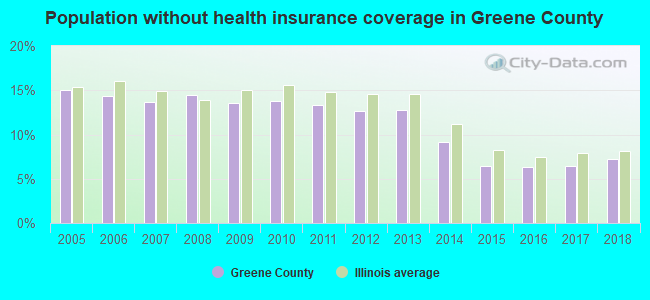
| Greene County: | 9.1% |
| Illinois: | 8.3% |
| Greene County: | 27.5% |
| State: | 25.2% |
| Here: | 11.5% |
| State: | 14.5% |
Agriculture in Greene County:
Average size of farms: 464 acresAverage value of agricultural products sold per farm: $129,162
Average value of crops sold per acre for harvested cropland: $234.53
The value of livestock, poultry, and their products as a percentage of the total market value of agricultural products sold: 38.10%
Average total farm production expenses per farm: $106,377
Harvested cropland as a percentage of land in farms: 73.43%
Irrigated harvested cropland as a percentage of land in farms: 3.34%
Average market value of all machinery and equipment per farm: $116,361
The percentage of farms operated by a family or individual: 82.74%
Average age of principal farm operators: 55 years
Average number of cattle and calves per 100 acres of all land in farms: 5.20
Corn for grain: 119753 harvested acres
All wheat for grain: 5409 harvested acres
Soybeans for beans: 101047 harvested acres
Land in orchards: 138 acres
Earthquake activity:
Greene County-area historical earthquake activity is significantly above Illinois state average. It is 271% greater than the overall U.S. average.On 4/18/2008 at 09:36:59, a magnitude 5.4 (5.1 MB, 4.8 MS, 5.4 MW, 5.2 MW, Class: Moderate, Intensity: VI - VII) earthquake occurred 148.6 miles away from Greene County center
On 4/18/2008 at 09:36:59, a magnitude 5.2 (5.2 MW, Depth: 8.9 mi) earthquake occurred 148.6 miles away from the county center
On 6/10/1987 at 23:48:54, a magnitude 5.1 (4.9 MB, 4.4 MS, 4.6 MS, 5.1 LG) earthquake occurred 139.4 miles away from the county center
On 9/26/1990 at 13:18:51, a magnitude 5.0 (4.7 MB, 4.8 LG, 5.0 LG, Depth: 7.7 mi) earthquake occurred 159.1 miles away from the county center
On 6/18/2002 at 17:37:15, a magnitude 5.0 (4.3 MB, 4.6 MW, 5.0 LG) earthquake occurred 170.0 miles away from Greene County center
On 4/18/2008 at 15:14:16, a magnitude 4.8 (4.5 MB, 4.8 MW, 4.6 MW, Class: Light, Intensity: IV - V) earthquake occurred 149.8 miles away from the county center
Magnitude types: regional Lg-wave magnitude (LG), body-wave magnitude (MB), surface-wave magnitude (MS), moment magnitude (MW)
Most recent natural disasters:
- Illinois Covid-19 Pandemic, Incident Period: January 20, 2020, FEMA Id: 4489, Natural disaster type: Other
- Illinois Severe Storms And Flooding, Incident Period: February 24, 2019 - July 3, 2019, FEMA Id: 4461, Natural disaster type: Storm, Flood
- Illinois Severe Storms, Straight-Line Winds and Flooding, Incident Period: April 16, 2013 to May 05, 2013, Major Disaster (Presidential) Declared DR-4116: May 10, 2013, FEMA Id: 4116, Natural disaster type: Storm, Flood, Wind
- Illinois Severe Storms and Flooding, Incident Period: September 13, 2008 to October 05, 2008, Major Disaster (Presidential) Declared DR-1800: October 03, 2008, FEMA Id: 1800, Natural disaster type: Storm, Flood
- Illinois Severe Storms and Flooding, Incident Period: June 01, 2008 to July 22, 2008, Major Disaster (Presidential) Declared DR-1771: June 24, 2008, FEMA Id: 1771, Natural disaster type: Storm, Flood
- Illinois Tornadoes and Severe Storms, Incident Period: March 11, 2006 to March 13, 2006, Major Disaster (Presidential) Declared DR-1633: March 28, 2006, FEMA Id: 1633, Natural disaster type: Storm, Tornado
- Illinois Hurricane Katrina Evacuation, Incident Period: August 29, 2005 to October 01, 2005, Emergency Declared EM-3230: September 07, 2005, FEMA Id: 3230, Natural disaster type: Hurricane
- Illinois Severe Storms, Tornadoes, and Flooding, Incident Period: May 06, 2003 to May 11, 2003, Major Disaster (Presidential) Declared DR-1469: May 15, 2003, FEMA Id: 1469, Natural disaster type: Storm, Tornado, Flood
- Illinois Severe Storms, Tornadoes, and Flooding, Incident Period: April 21, 2002 to May 23, 2002, Major Disaster (Presidential) Declared DR-1416: May 21, 2002, FEMA Id: 1416, Natural disaster type: Storm, Tornado, Flood
- Illinois Winter Snow Storm, Incident Period: January 01, 1999 to January 15, 1999, Emergency Declared EM-3134: January 08, 1999, FEMA Id: 3134, Natural disaster type: Storm, Snow
- 8 other natural disasters have been reported since 1953.
The number of natural disasters in Greene County (18) is near the US average (15).
Major Disasters (Presidential) Declared: 14
Emergencies Declared: 2
Causes of natural disasters: Storms: 16, Floods: 14, Tornadoes: 5, Hurricane: 1, Snow: 1, Wind: 1, Other: 1 (Note: some incidents may be assigned to more than one category).
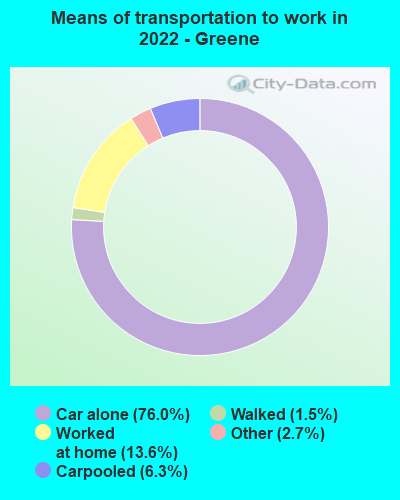
Means of transportation to work:
- Drove a car alone: 2,337 (73.2%)
- Carpooled: 206 (6.4%)
- Taxicab, motorcycle, or other means: 90 (2.8%)
- Walked: 47 (1.5%)
- Worked at home: 566 (17.7%)
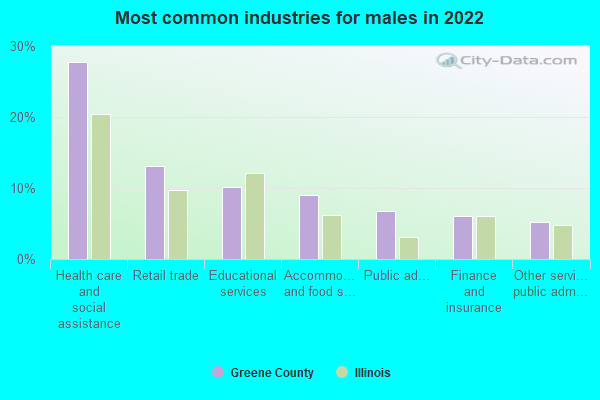
- Health care and social assistance (28%)
- Retail trade (13%)
- Educational services (10%)
- Accommodation and food services (9%)
- Public administration (7%)
- Finance and insurance (6%)
- Other services, except public administration (5%)
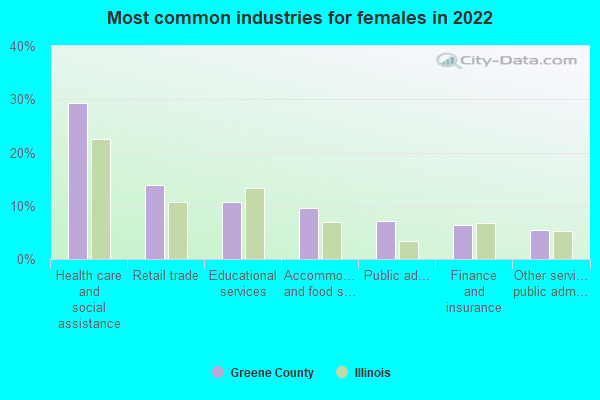
- Health care and social assistance (29%)
- Retail trade (14%)
- Educational services (11%)
- Accommodation and food services (10%)
- Public administration (7%)
- Finance and insurance (6%)
- Other services, except public administration (6%)
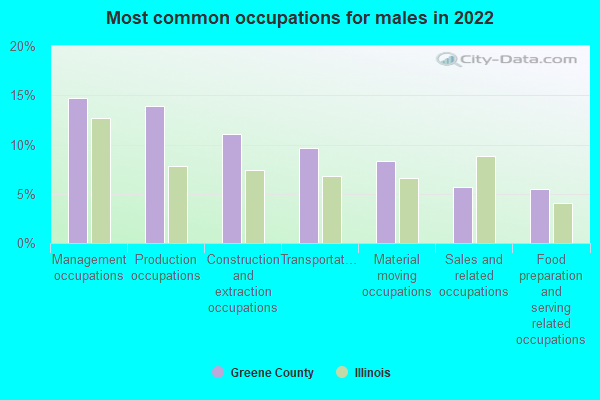
- Management occupations (15%)
- Production occupations (14%)
- Construction and extraction occupations (11%)
- Transportation occupations (10%)
- Material moving occupations (8%)
- Sales and related occupations (6%)
- Food preparation and serving related occupations (5%)
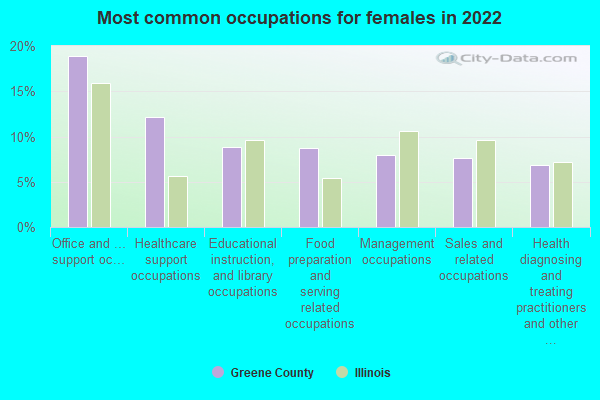
- Office and administrative support occupations (19%)
- Healthcare support occupations (12%)
- Educational instruction, and library occupations (9%)
- Food preparation and serving related occupations (9%)
- Management occupations (8%)
- Sales and related occupations (8%)
- Health diagnosing and treating practitioners and other technical occupations (7%)
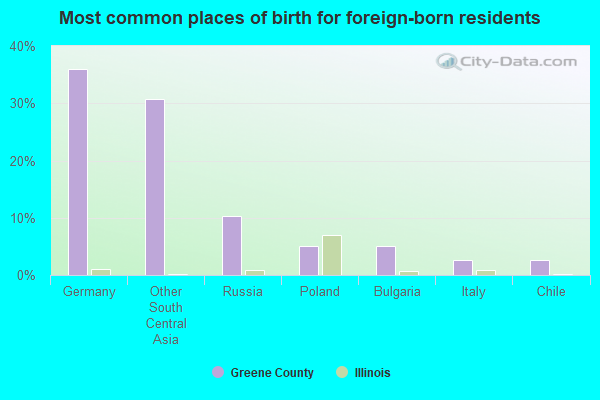
- Germany (36%)
- Other South Central Asia (31%)
- Russia (10%)
- Poland (5%)
- Bulgaria (5%)
- Italy (3%)
- Chile (3%)
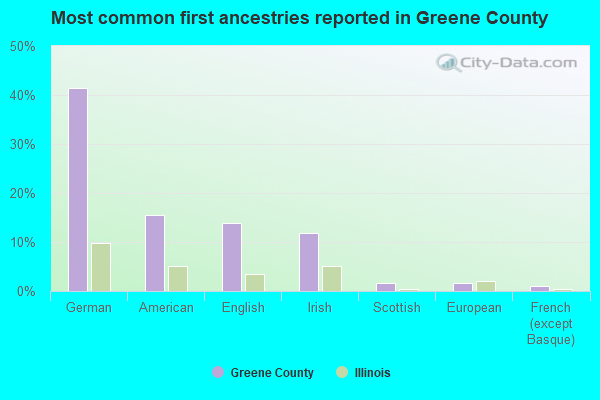
- German (41%)
- American (15%)
- English (14%)
- Irish (12%)
- Scottish (2%)
- European (2%)
- French (except Basque) (1%)
People in group quarters in Greene County, Illinois in 2010:
- 193 people in state prisons
- 81 people in nursing facilities/skilled-nursing facilities
- 10 people in local jails and other municipal confinement facilities
157 people in local jails and other confinement facilities (including police lockups)
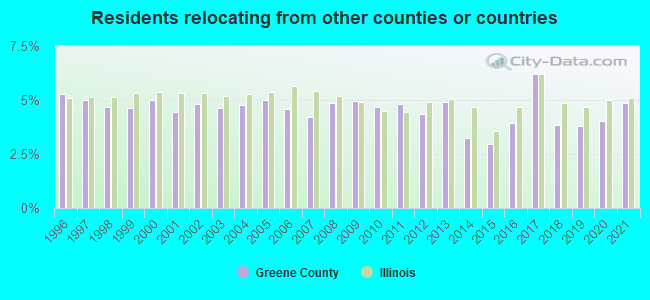
4.86% of this county's 2021 resident taxpayers lived in other counties in 2020 ($44,978 average adjusted gross income)
| Here: | 4.86% |
| Illinois average: | 5.09% |
10 or fewer of this county's residents moved from foreign countries.
4.40% relocated from other counties in Illinois ($41,253 average AGI)
0.47% relocated from other states ($3,721 average AGI)
Greene County: 0.47% Illinois average: 2.01%
Top counties from which taxpayers relocated into this county between 2020 and 2021:
| from Jersey County, IL | |
| from Morgan County, IL | |
| from Macoupin County, IL | |
| from Madison County, IL |
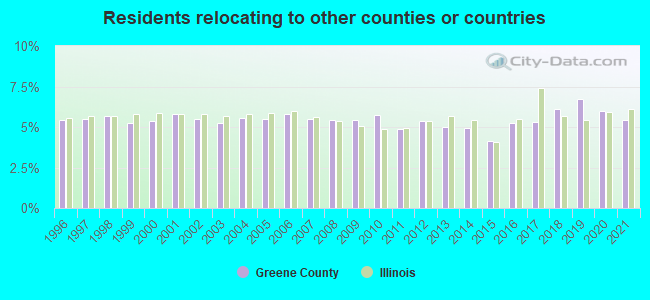
5.41% of this county's 2020 resident taxpayers moved to other counties in 2021 ($35,801 average adjusted gross income)
| Here: | 5.41% |
| Illinois average: | 6.10% |
10 or fewer of this county's residents moved to foreign countries.
4.39% relocated to other counties in Illinois ($29,094 average AGI)
1.01% relocated to other states ($6,707 average AGI)
Greene County: 1.01% Illinois average: 3.06%
Top counties to which taxpayers relocated from this county between 2020 and 2021:
| to Jersey County, IL | |
| to Morgan County, IL | |
| to Madison County, IL |
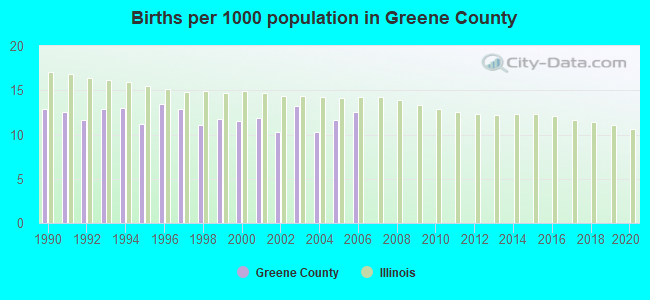
Births per 1000 population from 1990 to 1999: 12.3
Births per 1000 population from 2000 to 2006: 11.6
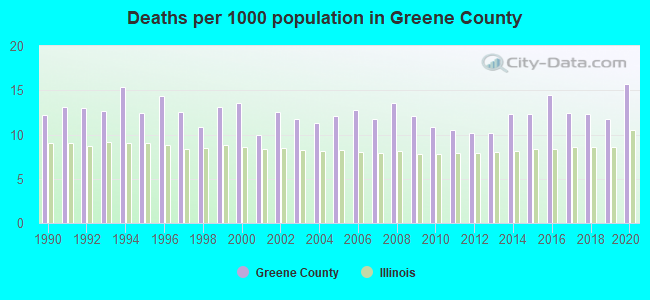
Deaths per 1000 population from 1990 to 1999: 13.0
Deaths per 1000 population from 2000 to 2009: 12.1
Deaths per 1000 population from 2010 to 2020: 12.1
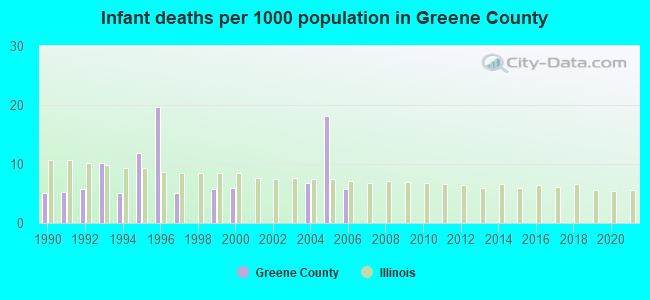
Infant deaths per 1000 live births from 1990 to 1999: 7.4
Infant deaths per 1000 live births from 2000 to 2006: 5.2
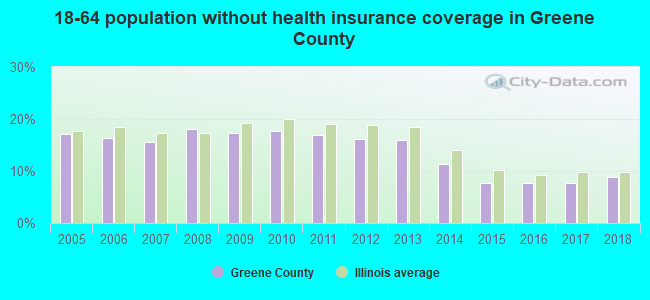
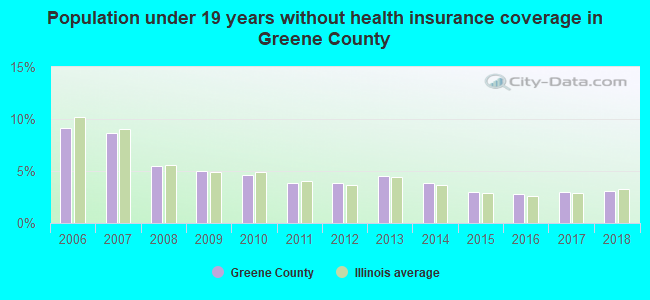
Persons under 19 years old without health insurance coverage in 2018: 3.1%
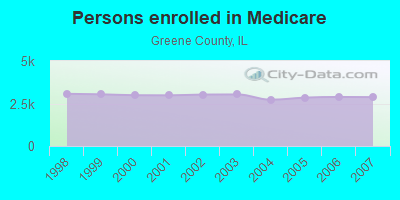
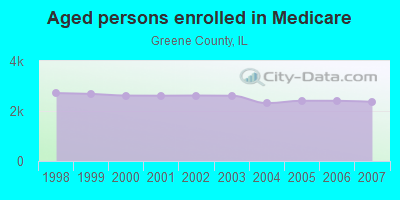
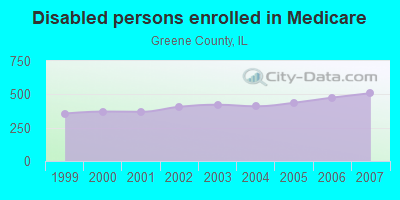
Persons enrolled in hospital insurance and/or supplemental medical insurance (Medicare) in July 1, 2007: 2,875 (2,366 aged, 509 disabled)
Children under 18 without health insurance coverage in 2007: 265 (8%)
Most common underlying causes of death in Greene County, Illinois in 1999 - 2019:
- Atherosclerotic heart disease (252)
- Acute myocardial infarction, unspecified (220)
- Bronchus or lung, unspecified - Malignant neoplasms (174)
- Chronic obstructive pulmonary disease, unspecified (38)
- Unspecified dementia (11)
- Alzheimer disease, unspecified (10)
- Pneumonia, unspecified (10)
- Stroke, not specified as haemorrhage or infarction (10)
Population without health insurance coverage in 2000: 12%
Children under 18 without health insurance coverage in 2000: 10%
Short term general hospital admissions per 100,000 population in 2004: 5,567
Short term general hospital beds per 100,000 population in 2004: 447
Emergency room visits per 100,000 population in 2004: 10,769
General practice office based MDs per 100,000 population in 2005: 1,104
Medical specialist MDs per 100,000 population in 2005: 1,036
Total births per 100,000 population, July 2005 - July 2006 : 39
Total deaths per 100,000 population, July 2005 - July 2006: 48
Limited-service eating places per 100,000 population in 2005 : 14
Household type by relationship:
Households: 11,849- Male householders: 2,117 (674 living alone), Female householders: 2,510 (770 living alone)
2,218 spouses (2,203 opposite-sex spouses), 342 unmarried partners, (330 opposite-sex unmarried partners), 3,464 children (3,137 natural, 180 adopted, 148 stepchildren), 217 grandchildren, 102 brothers or sisters, 140 parents, 21 foster children, 132 other relatives, 326 non-relatives
- In group quarters: 249
Size of family households: 1,588 2-persons, 585 3-persons, 557 4-persons, 168 5-persons, 42 6-persons, 23 7-or-more-persons.
Size of nonfamily households: 1,445 1-person, 212 2-persons, 3 3-persons.
1,388 married couples with children.
845 single-parent households (243 men, 602 women).
98.3% of residents of Greene speak English at home.
0.9% of residents speak Spanish at home (99% speak English very well, 1% don't speak English at all).
0.4% of residents speak other Indo-European language at home (98% speak English very well, 2% speak English well).
In fiscal year 2004:
Federal Government expenditure: $93,473,000 ($6,432 per capita)
Department of Defense expenditure: $1,193,000
Federal direct payments to individuals for retirement and disability: $41,766,000
Federal other direct payments to individuals: $22,272,000
Federal direct payments not to individuals: $8,414,000
Federal grants: $16,690,000
Federal procurement contracts: $845,000 ($0,000 Department of Defense)
Federal salaries and wages: $3,487,000 ($0,000 Department of Defense)
Federal Government direct loans: $48,000
Federal guaranteed/insured loans: $4,241,000
Federal Government insurance: $42,855,000
Population change from April 1, 2000 to July 1, 2005:
Births: 949| Here: | 65 per 1000 residents |
| State: | 75 per 1000 residents |
Deaths: 894
| Here: | 61 per 1000 residents |
| State: | 43 per 1000 residents |
Net international migration: 0
| Here: | 0 per 1000 residents |
| State: | +26 per 1000 residents |
Net internal migration: -215
| Here: | |
| State: |
Total withdrawal of fresh water for public supply: 1.02 millions of gallons per day (all from ground)
| Here: | 6.2 |
| State: | 6.4 |
| Here: | 5.1 |
| State: | 4.1 |
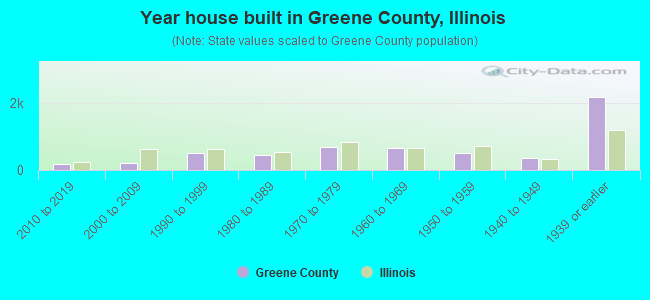
- Year house built in Greene County, Illinois
- 182020 or later
- 1732010 to 2019
- 2232000 to 2009
- 5131990 to 1999
- 4601980 to 1989
- 6821970 to 1979
- 6591960 to 1969
- 5011950 to 1959
- 3581940 to 1949
- 2,1651939 or earlier
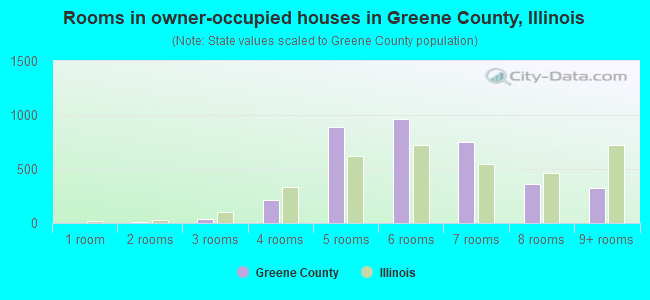
- Rooms in owner-occupied houses in Greene County, Illinois
- 01 room
- 102 rooms
- 403 rooms
- 2134 rooms
- 8885 rooms
- 9626 rooms
- 7487 rooms
- 3598 rooms
- 3249+ rooms
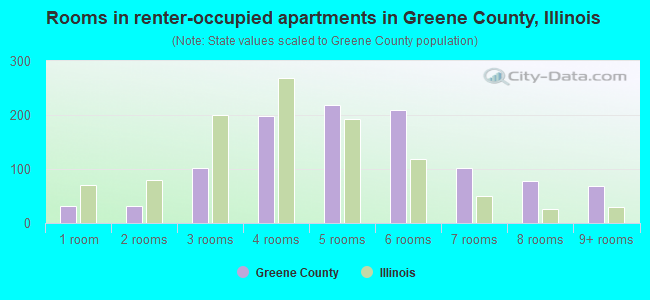
- Rooms in renter-occupied apartments in Greene County, Illinois
- 311 room
- 312 rooms
- 1023 rooms
- 1994 rooms
- 2195 rooms
- 2096 rooms
- 1017 rooms
- 778 rooms
- 689+ rooms
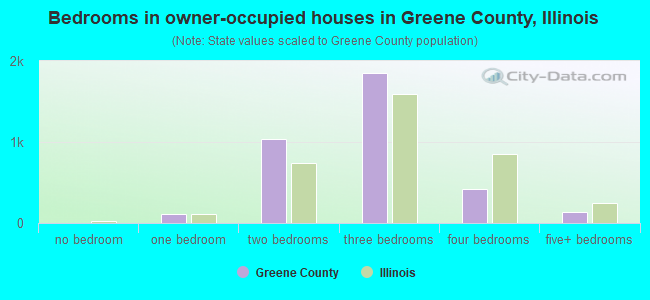
- Bedrooms in owner-occupied houses in Greene County, Illinois
- 0no bedroom
- 1131 bedroom
- 1,0402 bedrooms
- 1,8543 bedrooms
- 4254 bedrooms
- 1335+ bedrooms
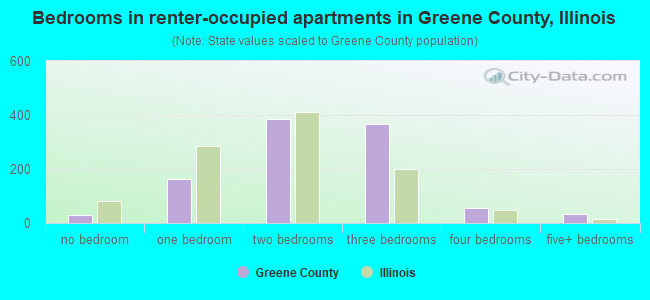
- Bedrooms in renter-occupied apartments in Greene County, Illinois
- 31no bedroom
- 1631 bedroom
- 3852 bedrooms
- 3683 bedrooms
- 564 bedrooms
- 345+ bedrooms
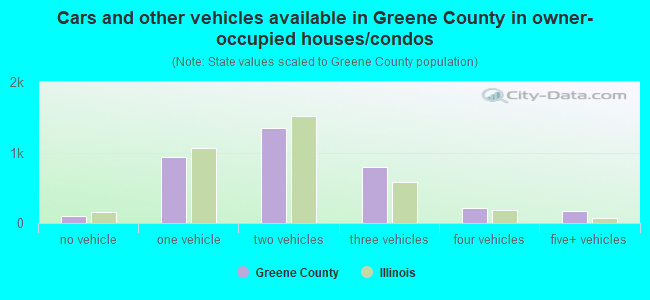
- Cars and other vehicles available in Greene County in owner-occupied houses/condos
- 96no vehicle
- 9381 vehicle
- 1,3512 vehicles
- 7883 vehicles
- 2154 vehicles
- 1705+ vehicles
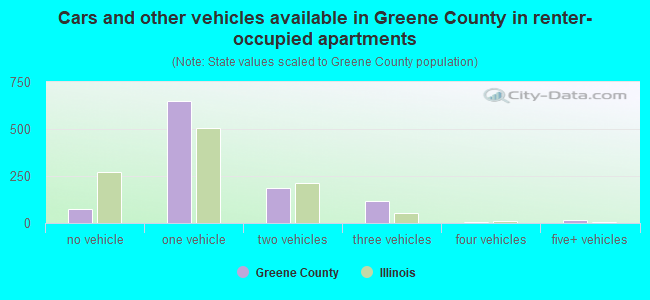
- Cars and other vehicles available in Greene County in renter-occupied apartments
- 77no vehicle
- 6481 vehicle
- 1882 vehicles
- 1163 vehicles
- 74 vehicles
- 145+ vehicles
91.4% of Greene County residents lived in the same house 1 years ago.
Out of people who lived in different houses, 36% lived in this county.
Out of people who lived in different counties, 81% lived in Illinois.
| Greene County: | 91.4% |
| State average: | 88.3% |
Place of birth for U.S.-born residents:
- This state: 10,230
- Other state: 1,466
- Northeast: 33
- Midwest: 911
- South: 297
- West: 228
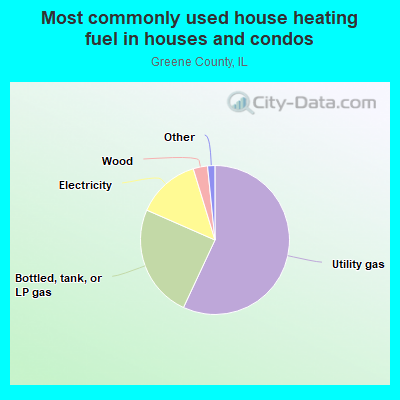
- 56.9%Utility gas
- 24.6%Bottled, tank, or LP gas
- 13.7%Electricity
- 3.1%Wood
- 0.9%Other fuel
- 0.6%No fuel used
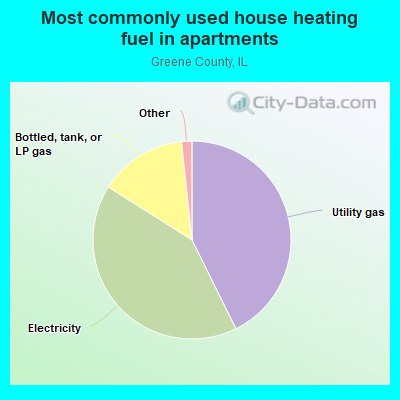
- 42.7%Utility gas
- 41.3%Electricity
- 14.3%Bottled, tank, or LP gas
- 0.9%Wood
- 0.5%Fuel oil, kerosene, etc.
- 0.3%No fuel used
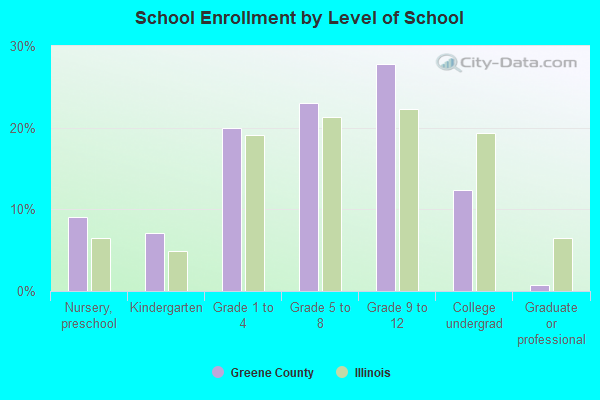
Private vs. public school enrollment:
| Here: | 11.5% |
| Illinois: | 13.3% |
| Here: | 4.4% |
| Illinois: | 9.9% |
| Here: | 32.2% |
| Illinois: | 27.4% |
Greene County government finances - Expenditure in 2017:
- Charges - Other: $1,906,000
- Current Operations - Regular Highways: $1,872,000
Health - Other: $1,499,000
Central Staff Services: $1,073,000
Police Protection: $787,000
General - Other: $757,000
Judicial and Legal Services: $702,000
Public Welfare - Other: $76,000
- Federal Intergovernmental - Highways: $580,000
Public Welfare: $154,000
- General - Interest on Debt: $1,000
- Local Intergovernmental - Other: $176,000
- Miscellaneous - General Revenue - Other: $293,000
Fines and Forfeits: $113,000
Interest Earnings: $53,000
- Other Capital Outlay - Regular Highways: $212,000
Central Staff Services: $101,000
Police Protection: $49,000
- Other Funds - Cash and Securities: $6,262,000
- State Intergovernmental - General Local Government Support: $1,124,000
Highways: $407,000
Public Welfare: $99,000
- Tax - Property: $2,102,000
Other License: $3,000
- Total Salaries and Wages: $2,416,000
Greene County government finances - Revenue in 2017:
- Charges - Other: $1,906,000
- Current Operations - Regular Highways: $1,872,000
Health - Other: $1,499,000
Central Staff Services: $1,073,000
Police Protection: $787,000
General - Other: $757,000
Judicial and Legal Services: $702,000
Public Welfare - Other: $76,000
- Federal Intergovernmental - Highways: $580,000
Public Welfare: $154,000
- General - Interest on Debt: $1,000
- Local Intergovernmental - Other: $176,000
- Miscellaneous - General Revenue - Other: $293,000
Fines and Forfeits: $113,000
Interest Earnings: $53,000
- Other Capital Outlay - Regular Highways: $212,000
Central Staff Services: $101,000
Police Protection: $49,000
- Other Funds - Cash and Securities: $6,262,000
- State Intergovernmental - General Local Government Support: $1,124,000
Highways: $407,000
Public Welfare: $99,000
- Tax - Property: $2,102,000
Other License: $3,000
- Total Salaries and Wages: $2,416,000
Greene County government finances - Debt in 2017:
- Charges - Other: $1,906,000
- Current Operations - Regular Highways: $1,872,000
Health - Other: $1,499,000
Central Staff Services: $1,073,000
Police Protection: $787,000
General - Other: $757,000
Judicial and Legal Services: $702,000
Public Welfare - Other: $76,000
- Federal Intergovernmental - Highways: $580,000
Public Welfare: $154,000
- General - Interest on Debt: $1,000
- Local Intergovernmental - Other: $176,000
- Miscellaneous - General Revenue - Other: $293,000
Fines and Forfeits: $113,000
Interest Earnings: $53,000
- Other Capital Outlay - Regular Highways: $212,000
Central Staff Services: $101,000
Police Protection: $49,000
- Other Funds - Cash and Securities: $6,262,000
- State Intergovernmental - General Local Government Support: $1,124,000
Highways: $407,000
Public Welfare: $99,000
- Tax - Property: $2,102,000
Other License: $3,000
- Total Salaries and Wages: $2,416,000
Greene County government finances - Cash and Securities in 2017:
- Charges - Other: $1,906,000
- Current Operations - Regular Highways: $1,872,000
Health - Other: $1,499,000
Central Staff Services: $1,073,000
Police Protection: $787,000
General - Other: $757,000
Judicial and Legal Services: $702,000
Public Welfare - Other: $76,000
- Federal Intergovernmental - Highways: $580,000
Public Welfare: $154,000
- General - Interest on Debt: $1,000
- Local Intergovernmental - Other: $176,000
- Miscellaneous - General Revenue - Other: $293,000
Fines and Forfeits: $113,000
Interest Earnings: $53,000
- Other Capital Outlay - Regular Highways: $212,000
Central Staff Services: $101,000
Police Protection: $49,000
- Other Funds - Cash and Securities: $6,262,000
- State Intergovernmental - General Local Government Support: $1,124,000
Highways: $407,000
Public Welfare: $99,000
- Tax - Property: $2,102,000
Other License: $3,000
- Total Salaries and Wages: $2,416,000
Supplemental Security Income (SSI) in 2006:
- Total number of recipients: 346
- Number of aged recipients: 26
- Number of blind and disabled recipients: 320
- Number of recipients under 18: 60
- Number of recipients between 18 and 64: 223
- Number of recipients older than 64: 63
- Number of recipients also receiving OASDI: 145
- Amount of payments (thousands of dollars): 148
| Most common first names in Greene County, IL among deceased individuals | ||
| Name | Count | Lived (average) |
|---|---|---|
| William | 165 | 76.1 years |
| Charles | 146 | 77.5 years |
| Mary | 144 | 80.6 years |
| John | 143 | 78.4 years |
| James | 115 | 74.5 years |
| George | 112 | 77.0 years |
| Helen | 92 | 81.7 years |
| Robert | 91 | 70.0 years |
| Ruth | 57 | 80.8 years |
| Mildred | 56 | 81.6 years |
| Most common last names in Greene County, IL among deceased individuals | ||
| Last name | Count | Lived (average) |
|---|---|---|
| Smith | 80 | 78.2 years |
| Edwards | 41 | 77.7 years |
| Ford | 41 | 80.8 years |
| Cox | 39 | 77.1 years |
| Martin | 39 | 82.7 years |
| Williams | 36 | 75.4 years |
| Allen | 33 | 76.4 years |
| Taylor | 32 | 80.4 years |
| Hardwick | 30 | 75.7 years |
| Jones | 30 | 78.9 years |
| Businesses in Greene County, IL | ||||
| Name | Count | Name | Count | |
|---|---|---|---|---|
| AT&T | 1 | H&R Block | 1 | |
| Alco Stores | 1 | Kroger | 2 | |
| Dairy Queen | 1 | Subway | 1 | |
| Ford | 2 | U.S. Cellular | 1 | |