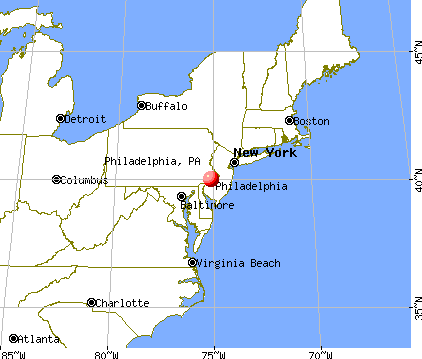
Philadelphia, Pennsylvania
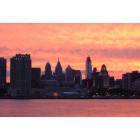
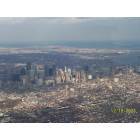
Philadelphia: Looking at Philly from the other side of the river.

Philadelphia: The art museum by night

Philadelphia: Ben Franklin over looking the delaware off columbus blvd

Philadelphia: Love Statue-Philadelphia
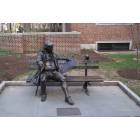
Philadelphia: Franklin on the Park Bench-Statue at Penn

Philadelphia: 30th Street Station from the 4th floor of 30th Street Post Office
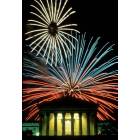
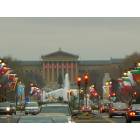
Philadelphia: 4th of July in Philadelphia
Philadelphia: View of the Skyline with Franklin Institute in foreground and City Hall to the left

Philadelphia: Philly's finest cheesesteak
Philadelphia: benjamin franklin pkwy
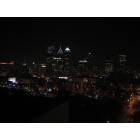
Philadelphia: Philly Downtown
- see
152
more - add
your
Submit your own pictures of this city and show them to the world
- OSM Map
- General Map
- Google Map
- MSN Map
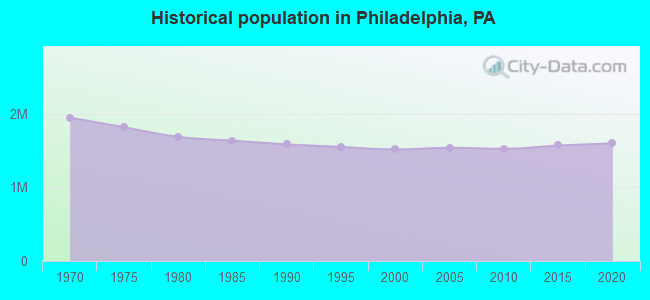
Population change since 2000: +3.3%
 |
| Males: 743,296 | |
| Females: 823,962 |
| Median resident age: | 35.1 years |
| Pennsylvania median age: | 40.9 years |
Zip codes: 19102, 19103, 19104, 19106, 19107, 19109, 19111, 19112, 19114, 19115, 19116, 19118, 19119, 19120, 19121, 19122, 19123, 19124, 19125, 19126, 19127, 19128, 19129, 19130, 19131, 19132, 19133, 19134, 19135, 19136, 19137, 19138, 19139, 19140, 19141, 19142, 19143, 19144, 19145, 19146, 19147, 19148, 19149, 19150, 19151, 19152, 19153, 19154.
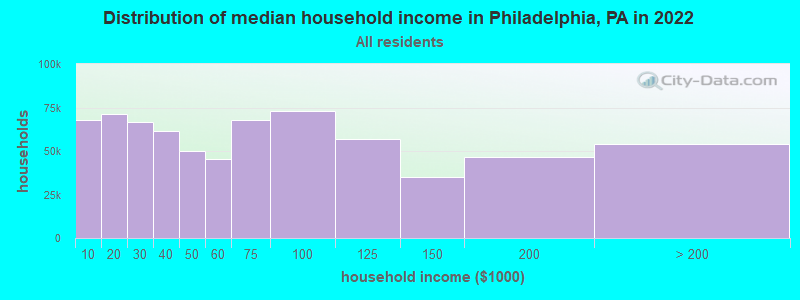
Philadelphia Zip Code Map| Philadelphia: | $56,517 |
| PA: | $71,798 |
Estimated per capita income in 2022: $36,077 (it was $16,509 in 2000)
Philadelphia city income, earnings, and wages data
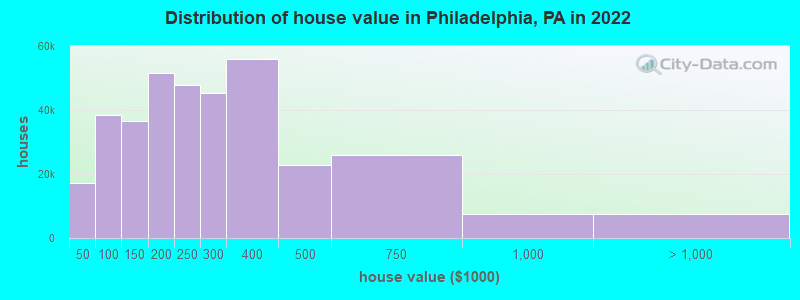
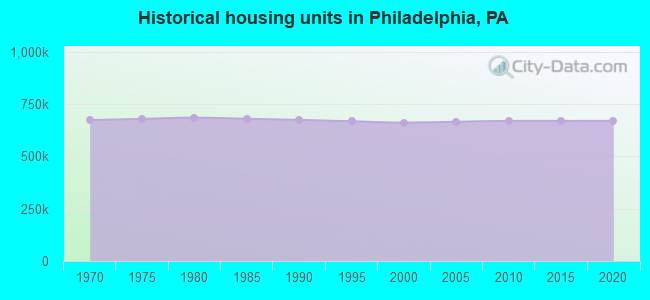
Estimated median house or condo value in 2022: $237,900 (it was $61,000 in 2000)
| Philadelphia: | $237,900 |
| PA: | $245,500 |
Mean prices in 2022: all housing units: $285,682; detached houses: $382,521; townhouses or other attached units: $260,733; in 2-unit structures: $270,436; in 3-to-4-unit structures: $324,453; in 5-or-more-unit structures: $444,254; mobile homes: $57,703; occupied boats, rvs, vans, etc.: $424,146
Median gross rent in 2022: $1,281.
(12.7% for White Non-Hispanic residents, 25.0% for Black residents, 33.3% for Hispanic or Latino residents, 27.6% for American Indian residents, 23.4% for Native Hawaiian and other Pacific Islander residents, 29.4% for other race residents, 30.9% for two or more races residents)
Detailed information about poverty and poor residents in Philadelphia, PA


Compare current foreclosures in Philadelphia, PA:
| Photo | Address | Area | Beds / Baths | Price | Details |
|---|---|---|---|---|---|

|
#1
Harmer St
Philadelphia, PA 19131
|
1,134 sq. feet
|
1 baths 3 beds |
$70,000
|
show details |

|
#2
N 5th St
Philadelphia, PA 19126
|
1,420 sq. feet
|
2 baths 3 beds |
$313,900
|
show details |

|
#3
N Front St Apt B
Philadelphia, PA 19123
|
2,491 sq. feet
|
2 baths 3 beds |
$677,500
|
show details |

|
#4
Freeland Ave
Philadelphia, PA 19128
|
1,114 sq. feet
|
1 baths 3 beds |
$355,000
|
show details |

|
#5
Christian St
Philadelphia, PA 19146
|
1,612 sq. feet
|
2 baths 5 beds |
$474,050
|
show details |

|
#6
Kershaw St
Philadelphia, PA 19131
|
1,284 sq. feet
|
1 baths 3 beds |
$139,900
|
show details |

|
#7
N Philip St
Philadelphia, PA 19140
|
894 sq. feet
|
1 baths 3 beds |
$42,500
|
show details |

|
#8
Princeton Ave
Philadelphia, PA 19149
|
1,224 sq. feet
|
1 baths 3 beds |
$215,000
|
show details |

|
#9
Benjamin Ct # 141
Philadelphia, PA 19114
|
1,553 sq. feet
|
3 baths 2 beds |
$251,000
|
show details |

|
#10
N 10th St
Philadelphia, PA 19141
|
1,154 sq. feet
|
2 baths 2 beds |
$78,000
|
show details |
| Photo | Address | Area | Beds / Baths | Price | Details |
|---|---|---|---|---|---|

|
#11
Cottage St
Philadelphia, PA 19135
|
1,536 sq. feet
|
1 baths 4 beds |
$82,339
|
show details |

|
#12
Montrose St
Philadelphia, PA 19146
|
784 sq. feet
|
1 baths 3 beds |
$421,296
|
show details |

|
#13
Limekiln Pike
Philadelphia, PA 19150
|
1,260 sq. feet
|
2 baths 3 beds |
$111,807
|
show details |

|
#14
Magnolia St
Philadelphia, PA 19144
|
1,152 sq. feet
|
1 baths 3 beds |
$151,516
|
show details |

|
#15
E Cosgrove St
Philadelphia, PA 19144
|
1,178 sq. feet
|
1 baths 3 beds |
$93,332
|
show details |

|
#16
S 7th St
Philadelphia, PA 19148
|
950 sq. feet
|
1 baths 3 beds |
$72,238
|
show details |

|
#17
Medford Rd
Philadelphia, PA 19154
|
1,360 sq. feet
|
1 baths 3 beds |
$161,441
|
show details |

|
#18
Conlyn St
Philadelphia, PA 19141
|
1,722 sq. feet
|
2 baths 3 beds |
$132,419
|
show details |

|
#19
Magnolia St
Philadelphia, PA 19144
|
1,200 sq. feet
|
1 baths 3 beds |
$20,792
|
show details |

|
#20
E Cornwall St
Philadelphia, PA 19134
|
1,140 sq. feet
|
1 baths 3 beds |
$65,832
|
show details |
| Photo | Address | Area | Beds / Baths | Price | Details |
|---|---|---|---|---|---|

|
#21
N Bambrey St
Philadelphia, PA 19121
|
964 sq. feet
|
1 baths 3 beds |
$107,333
|
show details |

|
#22
Saint Vincent St
Philadelphia, PA 19111
|
1,216 sq. feet
|
1 baths 3 beds |
$147,340
|
show details |

|
#23
Church Rd
Philadelphia, PA 19131
|
1,280 sq. feet
|
1 baths 3 beds |
$201,955
|
show details |

|
#24
S Ruby St
Philadelphia, PA 19139
|
1,280 sq. feet
|
1 baths 3 beds |
$57,735
|
show details |

|
#25
S Melville St
Philadelphia, PA 19143
|
1,720 sq. feet
|
1 baths 4 beds |
$315,682
|
show details |

|
#26
N 19th St
Philadelphia, PA 19132
|
1,332 sq. feet
|
1 baths 3 beds |
$98,676
|
show details |

|
#27
N Newkirk St
Philadelphia, PA 19121
|
650 sq. feet
|
1 baths 2 beds |
$193,345
|
show details |

|
#28
E Eleanor St
Philadelphia, PA 19120
|
1,260 sq. feet
|
1 baths 3 beds |
$76,972
|
show details |

|
#29
E Haines St
Philadelphia, PA 19138
|
6,817 sq. feet
|
2 baths 5 beds |
$335,289
|
show details |

|
#30
S 54th St
Philadelphia, PA 19143
|
1,934 sq. feet
|
1 baths 4 beds |
$129,665
|
show details |
| Photo | Address | Area | Beds / Baths | Price | Details |
|---|---|---|---|---|---|

|
#31
Malvern Ave
Philadelphia, PA 19151
|
1,120 sq. feet
|
1 baths 3 beds |
$49,935
|
show details |

|
#32
N 10th St
Philadelphia, PA 19141
|
1,664 sq. feet
|
1 baths 4 beds |
$232,227
|
show details |

|
#33
N Myrtlewood St
Philadelphia, PA 19121
|
1,344 sq. feet
|
1 baths 3 beds |
$258,593
|
show details |

|
#34
S 20th St
Philadelphia, PA 19145
|
1,288 sq. feet
|
1 baths 3 beds |
$197,755
|
show details |

|
#35
N Willington St
Philadelphia, PA 19121
|
960 sq. feet
|
1 baths 3 beds |
$69,647
|
show details |

|
#36
Bonaffon St
Philadelphia, PA 19142
|
1,008 sq. feet
|
1 baths 3 beds |
$188,921
|
show details |

|
#37
Redner St
Philadelphia, PA 19121
|
1,014 sq. feet
|
1 baths 3 beds |
$275,826
|
show details |

|
#38
Emerald St
Philadelphia, PA 19134
|
1,184 sq. feet
|
1 baths 3 beds |
$74,262
|
show details |

|
#39
N Corlies St
Philadelphia, PA 19121
|
1,080 sq. feet
|
1 baths 3 beds |
$267,082
|
show details |

|
#40
N Rosewood St
Philadelphia, PA 19132
|
1,164 sq. feet
|
1 baths 3 beds |
$128,092
|
show details |
| Photo | Address | Area | Beds / Baths | Price | Details |
|---|---|---|---|---|---|

|
#41
N 20th St
Philadelphia, PA 19140
|
1,324 sq. feet
|
1 baths 4 beds |
$3,600
|
show details |

|
#42
Redner St
Philadelphia, PA 19121
|
1,014 sq. feet
|
1 baths 3 beds |
$195,200
|
show details |

|
#43
N Corlies St
Philadelphia, PA 19121
|
926 sq. feet
|
1 baths 3 beds |
$241,506
|
show details |

|
#44
W Oxford St
Philadelphia, PA 19121
|
830 sq. feet
|
1 baths 3 beds |
$320,169
|
show details |

|
#45
Dell St
Philadelphia, PA 19140
|
1,110 sq. feet
|
1 baths 3 beds |
$4,000
|
show details |

|
#46
Chestnut St
Philadelphia, PA 19139
|
1,232 sq. feet
|
1 baths 3 beds |
$226,509
|
show details |

|
#47
Temple Rd
Philadelphia, PA 19150
|
990 sq. feet
|
1 baths 3 beds |
$99,233
|
show details |

|
#48
N Lindenwood St
Philadelphia, PA 19131
|
1,060 sq. feet
|
1 baths 3 beds |
$20,571
|
show details |

|
#49
Atwood Rd
Philadelphia, PA 19151
|
1,256 sq. feet
|
1 baths 3 beds |
$32,040
|
show details |

|
Check over 1 million property listings on Foreclosure.com!
|
browse all offers | |||


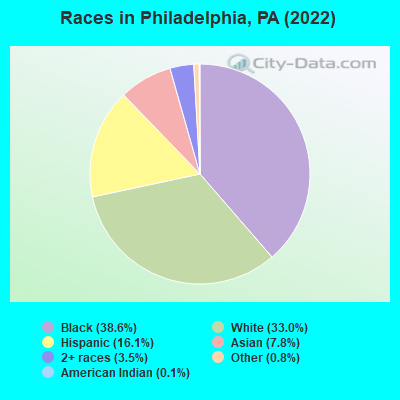
- 605,16038.6%Black alone
- 516,64733.0%White alone
- 252,37416.1%Hispanic
- 122,4437.8%Asian alone
- 55,1583.5%Two or more races
- 13,1220.8%Other race alone
- 1,9230.1%American Indian alone
- 4310.03%Native Hawaiian and Other
Pacific Islander alone
Races in Philadelphia detailed stats: ancestries, foreign born residents, place of birth
According to our research of Pennsylvania and other state lists, there were 3,323 registered sex offenders living in Philadelphia, Pennsylvania as of April 26, 2024.
The ratio of all residents to sex offenders in Philadelphia is 472 to 1.
The ratio of registered sex offenders to all residents in this city is near the state average.
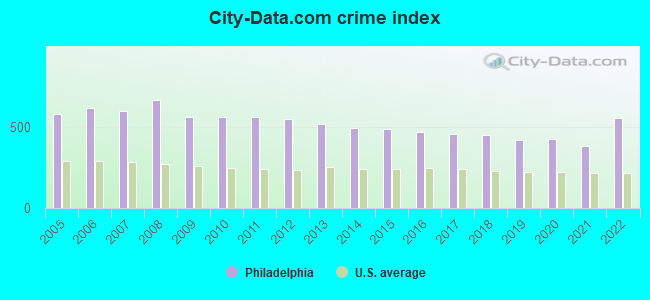
The City-Data.com crime index weighs serious crimes and violent crimes more heavily. Higher means more crime, U.S. average is 246.1. It adjusts for the number of visitors and daily workers commuting into cities.
- means the value is smaller than the state average.- means the value is about the same as the state average.
- means the value is bigger than the state average.
- means the value is much bigger than the state average.
Crime rate in Philadelphia detailed stats: murders, rapes, robberies, assaults, burglaries, thefts, arson
Full-time law enforcement employees in 2020, including police officers: 7,140 (6,359 officers - 4,987 male; 1,372 female).
| Officers per 1,000 residents here: | 4.01 |
| Pennsylvania average: | 2.70 |
 Recent articles from our blog. Our writers, many of them Ph.D. graduates or candidates, create easy-to-read articles on a wide variety of topics.


Latest news from Philadelphia, PA collected exclusively by city-data.com from local newspapers, TV, and radio stations
Ancestries: Irish (4.4%), Italian (4.0%), American (2.6%), German (2.1%), African (1.8%), Polish (1.2%).
Current Local Time: EST time zone
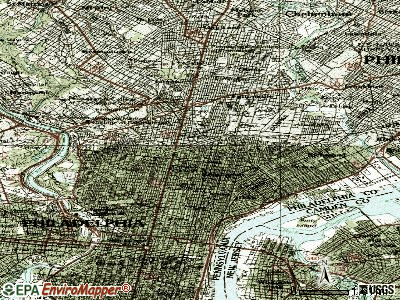
Elevation: 40 feet
Land area: 135.1 square miles.
Population density: 11,602 people per square mile (high).
241,795 residents are foreign born (5.6% Asia, 5.1% Latin America, 2.1% Europe, 1.6% Africa).
| This city: | 15.4% |
| Pennsylvania: | 7.3% |
Median real estate property taxes paid for housing units with mortgages in 2022: $1,967 (0.8%)
Median real estate property taxes paid for housing units with no mortgage in 2022: $1,469 (0.7%)
Nearest cities:
 ), ), )
Latitude: 40.00 N, Longitude: 75.14 W
Daytime population change due to commuting: +61,977 (+4.0%)
Workers who live and work in this city: 585,374 (79.2%)
Area codes: 215, 267, 610
Property values in Philadelphia, PA
Detailed articles:
- Philadelphia: Introduction
- Philadelphia Basic Facts
- Philadelphia: Communications
- Philadelphia: Convention Facilities
- Philadelphia: Economy
- Philadelphia: Education and Research
- Philadelphia: Geography and Climate
- Philadelphia: Health Care
- Philadelphia: History
- Philadelphia: Municipal Government
- Philadelphia: Population Profile
- Philadelphia: Recreation
- Philadelphia: Transportation
Philadelphia tourist attractions:
- Academy of Natural Science creates useful learning of science
- Sheraton Philadelphia City Center Hotel is a Downtown Favorite
- The Four Seasons Hotel in Philadelphia is an Excellent Luxury Choice
- Rittenhouse 1715, a Boutique Hotel, is a Unique Philadelphia Lodging Choice
- The Ritz-Carlton Philadelphia is a Piece of Philadelphia History
- The Rittenhouse Hotel in Philadelphia is a Five-Star Choice
- Philadelphia Marriott Downtown is an Excellent Lodging Option
- Park Hyatt Philadelphia at the Bellevue is Classic but Chic
- Westin Philadelphia Provides Easy Access to the City's Best Attractions
- Loews Philadelphia Hotel Puts Visitors in the Middle of History
- The Radisson Plaza Warwick Hotel in Philadelphia is a City Landmark
- Hyatt Regency Philadelphia at Penn's Landing a Great Waterfront Choice
- Hilton Inn at Penn Provides Lodging in Philly's University City Neighborhood
- The Morris House Hotel in Philadelphia is a Historic Gem
- Sheraton Philadelphia University City Hotel puts Visitors Amidst the Action
- Courtyard Philadelphia Downtown a Majestic Philadelphia Landmark Hotel
- Sofitel Philadelphia Hotel is a Sensible Upscale Lodging Choice
- Omni Hotel at Independence Park Puts Guests Close to History
- Residence Inn Philadelphia Center City is a Quality Marriott Hotel
- Holiday Inn Philadelphia Historic District is in the Heart of the City
- The Club Quarters in Philadelphia is Designed for Business Travelers
- Windsor Suites in Philadelphia are Suitable for a Short or Long Stay
- The Latham Hotel in Philadelphia is a Boutique Hotel Option
- Sheraton Suites Philadelphia Airport has been recently renovated
- Christ Church is a Must-See Philadelphia Historic Landmark
- Cliveden in Philadelphia is a Notable Revolutionary War Attraction
- The Liberty Bell Center is a Philadelphia Must-Do for All Visitors
- Elfreth's Alley in Philadelphia is a Walk through History
- City Hall in Philadelphia is a Second Empire Masterpiece
- Best Western Independence Park Hotel a 19th Century Historic Gem
- Franklin Court in Philadelphia Educates Visitors on the Life of Ben Franklin
- The Mutter Museum in Philadelphia is one of the U.S.'s Strangest Museums
- Helium Comedy Club Provides Philadelphians with a Good Laugh
- The Manayunk Neighborhood of Philadelphia has a Rich Immigrant History
- The Italian Market in Philadelphia is a Unique Cultural Experience
- Franklin Mills Mall is a Shopper's Paradise
- The Old City Arts District of Philadelphia is Bucolic Example of Urban Renewal
- Chestnut Street in Philadelphia Provides Great Shopping and More
- South Street in Philadelphia is a Quirky Entertainment Area
- Sheraton Society Hill offers Modern yet Cozy Philadelphia Accommodations
- Crowne Plaza Philadelphia Downtown Offers a Central Location
- Holiday Inn Express Philadelphia Midtown is Close to History and Culture
- The Penn's View Hotel in Philadelphia is an Alternative to Chain Hotels
- The Independent Hotel in Philadelphia is a Boutique Choice
- Embassy Suites Hotel Philadelphia Center City an All-Suite Choice
- Lincoln Financial Field - Philadelphia, Pennsylvania - Home to the NFL's Philadelphia Eagles
- Embassy Suites Hotel Philadelphia Airport
- Hilton Philadelphia City Avenue
- Hotel Palomar Philadelphia - a Kimpton Hotel
- Homewood Suites Philadelphia - City Ave
- Edgar Allan Poe National Historic Site
- Morris Arboretum
- Crowne Plaza Philadelphia City Avenue
- Philadelphia Zoo - Philadelphia, Pennsylvania - oldest zoo in the United States
- Philadelphia International Airport - Philadelphia PA Philadelphia Airport Flights
- Philadelphia Park Casino - Bensalem, PA - Slots, Blackjack, Roulette, and Racing Available
- Ringing Rocks Park, a Great Philadelphia Day Trip
- The Liberty Bell And Independence Hall In Philadelphia, Pennsylvania
- University of Pennsylvania Museum of Archaeology and Anthropology, Philadelphia, PA
- Wachovia Center, Philadelphia, Pennsylvania
- Wachovia Spectrum, Philadelphia, Pennsylvania
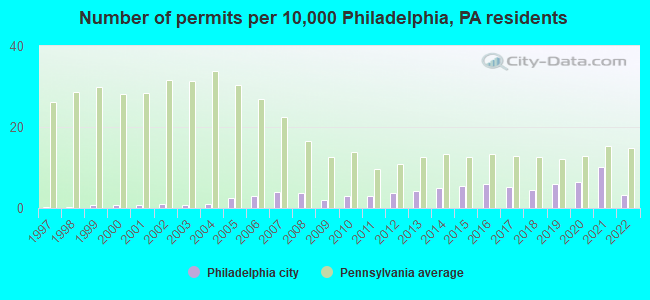
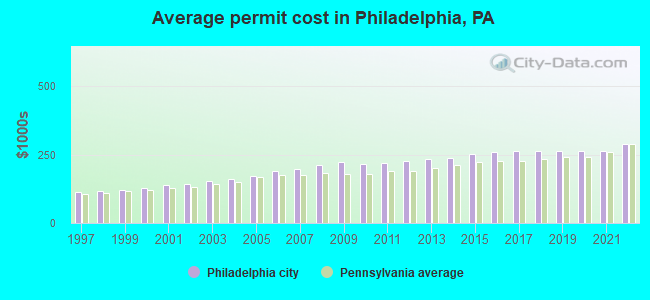
Single-family new house construction building permits:
- 2022: 478 buildings, average cost: $288,300
- 2021: 1553 buildings, average cost: $263,000
- 2020: 983 buildings, average cost: $264,500
- 2019: 894 buildings, average cost: $263,800
- 2018: 683 buildings, average cost: $265,200
- 2017: 783 buildings, average cost: $265,300
- 2016: 904 buildings, average cost: $261,200
- 2015: 822 buildings, average cost: $253,800
- 2014: 756 buildings, average cost: $238,100
- 2013: 632 buildings, average cost: $234,600
- 2012: 566 buildings, average cost: $226,600
- 2011: 445 buildings, average cost: $217,900
- 2010: 447 buildings, average cost: $214,900
- 2009: 291 buildings, average cost: $224,200
- 2008: 545 buildings, average cost: $212,900
- 2007: 591 buildings, average cost: $199,000
- 2006: 448 buildings, average cost: $191,100
- 2005: 383 buildings, average cost: $171,800
- 2004: 134 buildings, average cost: $161,400
- 2003: 128 buildings, average cost: $152,000
- 2002: 147 buildings, average cost: $144,000
- 2001: 104 buildings, average cost: $138,200
- 2000: 95 buildings, average cost: $128,600
- 1999: 97 buildings, average cost: $121,000
- 1998: 40 buildings, average cost: $115,800
- 1997: 50 buildings, average cost: $112,400
| Here: | 3.7% |
| Pennsylvania: | 2.9% |
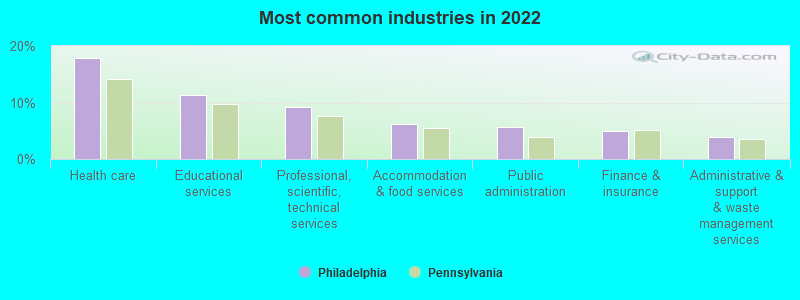
- Health care (17.9%)
- Educational services (11.3%)
- Professional, scientific, technical services (9.2%)
- Accommodation & food services (6.2%)
- Public administration (5.6%)
- Finance & insurance (5.0%)
- Administrative & support & waste management services (3.8%)
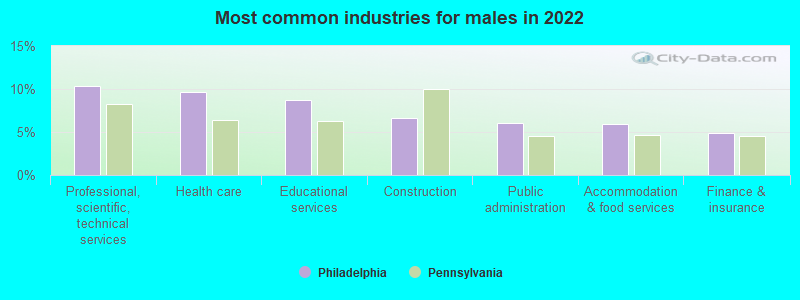
- Professional, scientific, technical services (10.3%)
- Health care (9.6%)
- Educational services (8.7%)
- Construction (6.6%)
- Public administration (6.1%)
- Accommodation & food services (5.9%)
- Finance & insurance (4.9%)
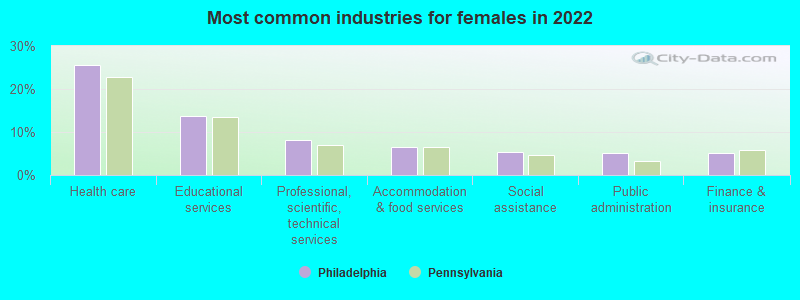
- Health care (25.5%)
- Educational services (13.7%)
- Professional, scientific, technical services (8.1%)
- Accommodation & food services (6.5%)
- Social assistance (5.4%)
- Public administration (5.2%)
- Finance & insurance (5.2%)
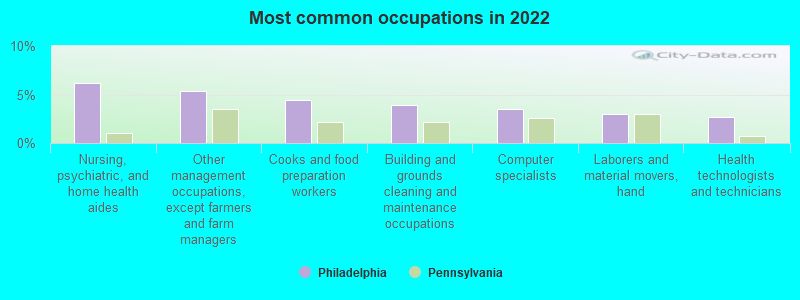
- Nursing, psychiatric, and home health aides (6.2%)
- Other management occupations, except farmers and farm managers (5.4%)
- Cooks and food preparation workers (4.4%)
- Building and grounds cleaning and maintenance occupations (3.9%)
- Computer specialists (3.5%)
- Laborers and material movers, hand (3.0%)
- Health technologists and technicians (2.7%)
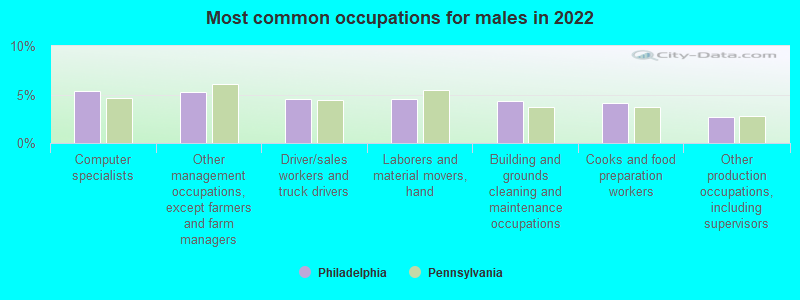
- Computer specialists (5.3%)
- Other management occupations, except farmers and farm managers (5.3%)
- Driver/sales workers and truck drivers (4.6%)
- Laborers and material movers, hand (4.5%)
- Building and grounds cleaning and maintenance occupations (4.3%)
- Cooks and food preparation workers (4.2%)
- Other production occupations, including supervisors (2.7%)
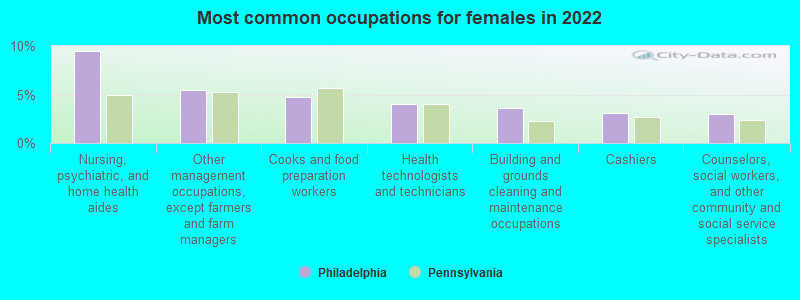
- Nursing, psychiatric, and home health aides (9.5%)
- Other management occupations, except farmers and farm managers (5.5%)
- Cooks and food preparation workers (4.7%)
- Health technologists and technicians (4.0%)
- Building and grounds cleaning and maintenance occupations (3.6%)
- Cashiers (3.1%)
- Counselors, social workers, and other community and social service specialists (3.0%)
Average climate in Philadelphia, Pennsylvania
Based on data reported by over 4,000 weather stations


|
|


(lower is better)
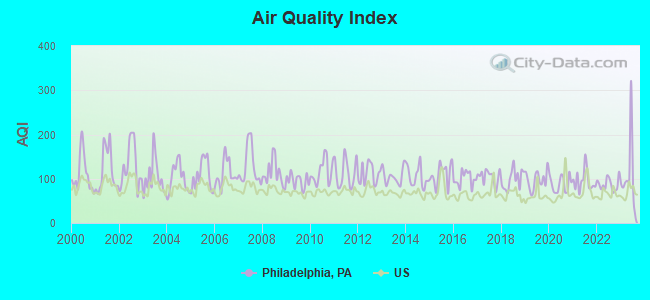
Air Quality Index (AQI) level in 2023 was 109. This is significantly worse than average.
| City: | 109 |
| U.S.: | 73 |
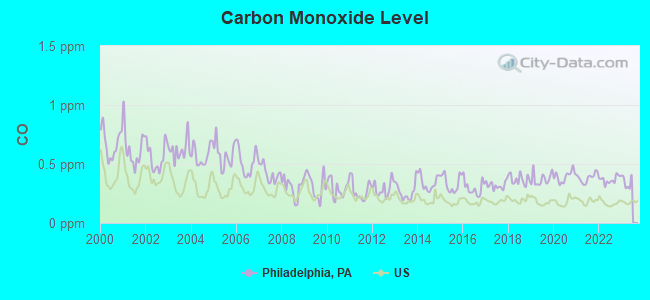
Carbon Monoxide (CO) [ppm] level in 2022 was 0.367. This is significantly worse than average. Closest monitor was 0.5 miles away from the city center.
| City: | 0.367 |
| U.S.: | 0.251 |
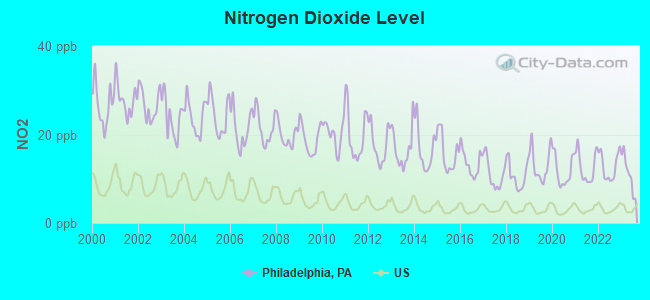
Nitrogen Dioxide (NO2) [ppb] level in 2023 was 11.3. This is significantly worse than average. Closest monitor was 0.5 miles away from the city center.
| City: | 11.3 |
| U.S.: | 5.1 |
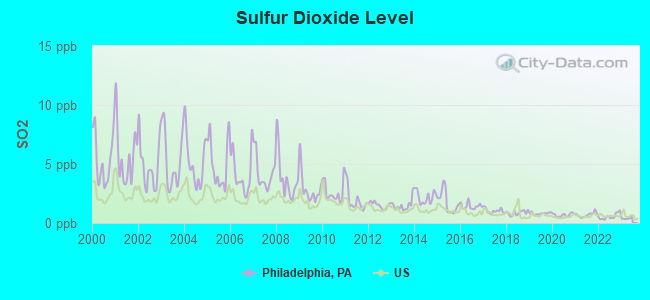
Sulfur Dioxide (SO2) [ppb] level in 2022 was 0.555. This is significantly better than average. Closest monitor was 0.5 miles away from the city center.
| City: | 0.555 |
| U.S.: | 1.515 |
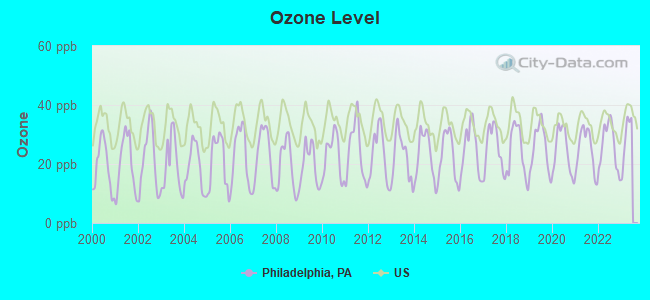
Ozone [ppb] level in 2022 was 26.2. This is better than average. Closest monitor was 0.9 miles away from the city center.
| City: | 26.2 |
| U.S.: | 33.3 |
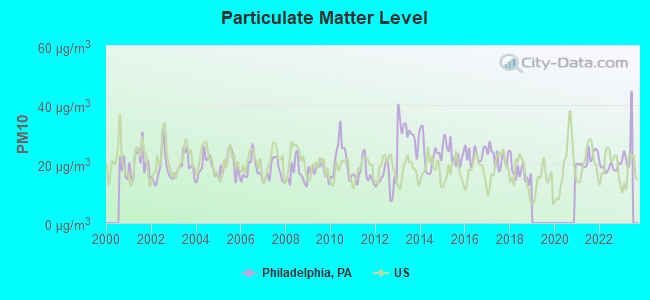
Particulate Matter (PM10) [µg/m3] level in 2022 was 18.9. This is about average. Closest monitor was 1.4 miles away from the city center.
| City: | 18.9 |
| U.S.: | 19.2 |
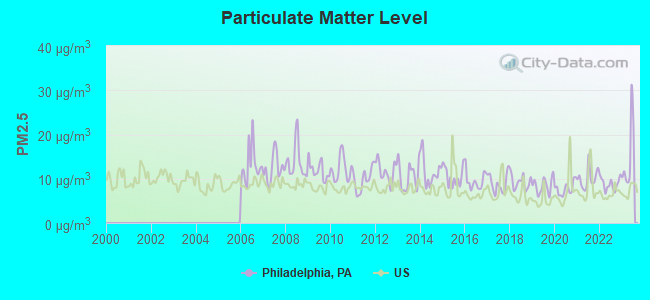
Particulate Matter (PM2.5) [µg/m3] level in 2023 was 15.0. This is significantly worse than average. Closest monitor was 0.9 miles away from the city center.
| City: | 15.0 |
| U.S.: | 8.1 |
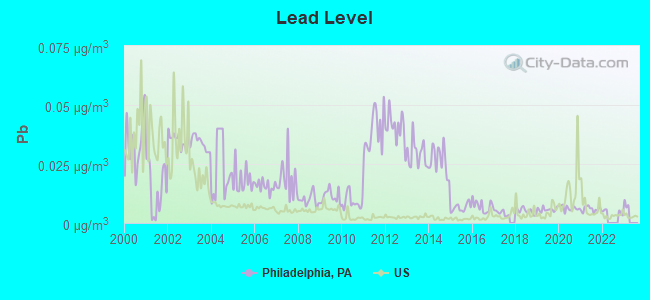
Lead (Pb) [µg/m3] level in 2021 was 0.00590. This is significantly better than average. Closest monitor was 0.9 miles away from the city center.
| City: | 0.00590 |
| U.S.: | 0.00931 |
Tornado activity:
Philadelphia-area historical tornado activity is slightly above Pennsylvania state average. It is 3% smaller than the overall U.S. average.
On 3/22/1955, a category F3 (max. wind speeds 158-206 mph) tornado 17.6 miles away from the Philadelphia city center killed one person and caused between $50,000 and $500,000 in damages.
On 7/27/1994, a category F3 tornado 25.5 miles away from the city center killed 3 people and injured 25 people and caused between $5,000,000 and $50,000,000 in damages.
Earthquake activity:
Philadelphia-area historical earthquake activity is significantly above Pennsylvania state average. It is 66% smaller than the overall U.S. average.On 8/23/2011 at 17:51:04, a magnitude 5.8 (5.8 MW, Depth: 3.7 mi, Class: Moderate, Intensity: VI - VII) earthquake occurred 208.3 miles away from the city center
On 1/16/1994 at 01:49:16, a magnitude 4.6 (4.6 MB, 4.6 LG, Depth: 3.1 mi, Class: Light, Intensity: IV - V) earthquake occurred 52.5 miles away from Philadelphia center
On 1/16/1994 at 00:42:43, a magnitude 4.2 (4.2 MB, 4.0 LG, Depth: 3.1 mi) earthquake occurred 50.9 miles away from Philadelphia center
On 10/7/1983 at 10:18:46, a magnitude 5.3 (5.1 MB, 5.3 LG, 5.1 ML) earthquake occurred 276.6 miles away from the city center
On 11/30/2017 at 21:47:31, a magnitude 4.1 (4.1 MW, Depth: 6.1 mi) earthquake occurred 57.4 miles away from the city center
On 9/25/1998 at 19:52:52, a magnitude 5.2 (4.8 MB, 4.3 MS, 5.2 LG, 4.5 MW, Depth: 3.1 mi) earthquake occurred 293.9 miles away from Philadelphia center
Magnitude types: regional Lg-wave magnitude (LG), body-wave magnitude (MB), local magnitude (ML), surface-wave magnitude (MS), moment magnitude (MW)
Natural disasters:
The number of natural disasters in Philadelphia County (22) is greater than the US average (15).Major Disasters (Presidential) Declared: 16
Emergencies Declared: 6
Causes of natural disasters: Hurricanes: 6, Winter Storms: 5, Floods: 3, Snowstorms: 3, Tropical Storms: 3, Storms: 2, Blizzard: 1, Snowfall: 1, Tropical Depression: 1, Water Shortage: 1, Other: 1 (Note: some incidents may be assigned to more than one category).
Main business address for: MARITRANS INC /DE/ (WATER TRANSPORTATION), FMC CORP (CHEMICALS & ALLIED PRODUCTS), CDI CORP (SERVICES-HELP SUPPLY SERVICES), CIGNA CORP (HOSPITAL & MEDICAL SERVICE PLANS), CONSTAR INTERNATIONAL INC (MISCELLANEOUS PLASTIC PRODUCTS), SUNOCO INC (PETROLEUM REFINING), LINCOLN NATIONAL CORP (LIFE INSURANCE), ROHM & HAAS CO (PLASTICS, MATERIALS, SYNTH RESINS & NONVULCAN ELASTOMERS) and 39 other public companies.
Hospitals in Philadelphia:
- ALBERT EINSTEIN MEDICAL CENTER (Voluntary non-profit - Other, provides emergency services, 5501 OLD YORK ROAD)
- ALLEGHENY VALLEY SCH/W GIRARD (519 W GIRARD AVE)
- BELMONT CENTER FOR COMPREHENSIVE TREAT (4200 MONUMENT AVENUE)
- DR GERTRUDE A BARBER CENTER DELANCEY (5801 DELANCEY ST)
- FAIRMOUNT BEHAVIORAL HEALTH SYSTEM (561 FAIRTHORNE AVENUE)
- HOSPITAL OF THE HOME FOR JEWISH AGED (5301 OLD YORK ROAD)
- JOHN F KENNEDY MEMORIAL HOSPITAL (provides emergency services, LANGDON ST AND CHELTENHAM AVE)
- NHS OF PHILADELPHIA/GERMANTOWN (6915 GERMANTOWN AVENUE)
- PHILADELPHIA STATE HOSP (ROOSEVELT BLVD + SOUTHAMPTON RD)
- TEMPLE EAST INC (2301 E. ALLEGHENY AVENUE)
- WOODHAVEN CENTER,THE (2900 SOUTHAMPTON RD)
Airports and heliports located in Philadelphia:
- Philadelphia International Airport (PHL) (Runways: 4, Commercial Ops: 239,776, Air Taxi Ops: 165,081, Itinerant Ops: 13,996, Military Ops: 400)
- Northeast Philadelphia Airport (PNE) (Runways: 2, Air Taxi Ops: 5,278, Itinerant Ops: 30,436, Local Ops: 40,086)
- Heliports: 24
Amtrak stations:
- PHILADELPHIA (30TH & MARKET STS.) . Services: ticket office, fully wheelchair accessible, enclosed waiting area, public restrooms, public payphones, snack bar, ATM, paid short-term parking, paid long-term parking, car rental agency, taxi stand, public transit connection.
- NORTH PHILADELPHIA (2900 N. BROAD ST.) . Services: ticket office, fully wheelchair accessible, enclosed waiting area, public restrooms, public payphones, paid short-term parking, paid long-term parking, call for taxi service, public transit connection.
Biggest Colleges/Universities in Philadelphia:
- Temple University (Full-time enrollment: 30,016; Location: 1801 North Broad Street; Public; Website: www.temple.edu; Offers Doctor's degree)
- University of Pennsylvania (Full-time enrollment: 25,693; Location: 34th & Spruce Street; Private, not-for-profit; Website: www.upenn.edu; Offers Doctor's degree)
- Drexel University (Full-time enrollment: 22,969; Location: 3141 Chestnut St; Private, not-for-profit; Website: www.drexel.edu; Offers Doctor's degree)
- Community College of Philadelphia (Full-time enrollment: 15,116; Location: 1700 Spring Garden St; Public; Website: www.ccp.edu)
- Saint Joseph's University (Full-time enrollment: 7,329; Location: 5600 City Avenue; Private, not-for-profit; Website: www.sju.edu; Offers Doctor's degree)
- La Salle University (Full-time enrollment: 5,318; Location: 1900 W Olney Ave; Private, not-for-profit; Website: www.lasalle.edu; Offers Doctor's degree)
- Philadelphia University (Full-time enrollment: 3,629; Location: 4201 Henry Avenue; Private, not-for-profit; Website: www.philau.edu; Offers Doctor's degree)
- University of the Sciences (Full-time enrollment: 2,464; Location: 600 S 43rd Street; Private, not-for-profit; Website: www.usciences.edu; Offers Doctor's degree)
- The Art Institute of Philadelphia (Full-time enrollment: 2,432; Location: 1622 Chestnut Street; Private, for-profit; Website: www.artinstitutes.edu/philadelphia/)
- Holy Family University (Full-time enrollment: 2,305; Location: 9801 Frankford Avenue; Private, not-for-profit; Website: www.holyfamily.edu; Offers Doctor's degree)
- The University of the Arts (Full-time enrollment: 2,198; Location: 320 South Broad St; Private, not-for-profit; Website: www.uarts.edu; Offers Master's degree)
- Thomas Jefferson University (Full-time enrollment: 2,139; Location: 1020 Walnut Street; Private, not-for-profit; Website: www.jefferson.edu; Offers Doctor's degree)
- Chestnut Hill College (Full-time enrollment: 1,834; Location: 9601 Germantown Ave; Private, not-for-profit; Website: www.chc.edu; Offers Doctor's degree)
- Peirce College (Full-time enrollment: 1,362; Location: 1420 Pine Street; Private, not-for-profit; Website: www.peirce.edu; Offers Master's degree)
- Kaplan Career Institute-Philadelphia (Full-time enrollment: 1,315; Location: 3010 Market Street; Private, for-profit; Website: www.kaplancareerinstitute.com/philadelphia-pa/)
- Kaplan Career Institute-Franklin Mills (Full-time enrollment: 1,268; Location: 177 Franklin Mills Blvd.; Private, for-profit; Website: www.kaplancareerinstitute.com/franklin-mills-pa/)
- Star Career Academy-Philadelphia (Full-time enrollment: 1,033; Location: 2371 Welsh Road; Private, for-profit; Website: www.starcareeracademy.com)
- Philadelphia College of Osteopathic Medicine (Full-time enrollment: 986; Location: 4170 City Ave; Private, not-for-profit; Website: www.pcom.edu; Offers Doctor's degree)
- Orleans Technical Institute (Full-time enrollment: 660; Location: 2770 Red Lion Road; Private, not-for-profit; Website: www.orleanstech.edu)
- Lincoln Technical Institute-Center City Philadelphia (Full-time enrollment: 575; Location: 3600 Market St; Private, for-profit; Website: www.lincolntech.com)
Biggest public high schools in Philadelphia:
- NORTHEAST HS (Students: 3,519, Location: 1601 COTTMAN AVE, Grades: 9-12)
- EDISON HS/FAREIRA SKILLS (Students: 2,488, Location: 151 WEST LUZERNE STREET, Grades: 9-12)
- WEST PHILADELPHIA HS (Students: 2,277, Location: 4901 CHESTNUT ST, Grades: 9-12)
- LINCOLN HS (Students: 1,970, Location: 3201 RYAN AVE, Grades: PK-12)
- FRANKFORD HS (Students: 1,945, Location: 5000 OXFORD AVE, Grades: 9-12)
- OVERBROOK HS (Students: 1,809, Location: 5898 LANCASTER AVE, Grades: 9-12)
- BARTRAM JOHN - MAIN (Students: 1,713, Location: 2401 S 67TH ST, Grades: 9-12)
- KING MARTIN LUTHER HS (Students: 1,659, Location: 6100 STENTON AVE, Grades: 9-12)
- FELS SAMUEL HS (Students: 1,547, Location: 5500 LANGDON STREET, Grades: 9-12)
- SOUTH PHILADELPHIA HS (Students: 1,316, Location: 2101 S BROAD ST, Grades: PK-12)
Biggest private high schools in Philadelphia:
- ARCHBISHOP RYAN HIGH SCHOOL (Students: 1,615, Location: 11201 ACADEMY RD, Grades: 9-12)
- FATHER JUDGE HIGH SCHOOL (Students: 1,136, Location: 3301 SOLLY AVE, Grades: 9-12, Boys only)
- SPRINGSIDE CHESTNUT HILL ACADEMY (Students: 1,129, Location: 500 W WIIL ABROOK AVE, Grades: PK-12)
- ROMAN CATHOLIC HIGH SCHOOL (Students: 1,065, Location: 301 N BROAD ST, Grades: 9-12, Boys only)
- ST JOSEPH'S PREPARATORY SCHOOL (Students: 994, Location: 1733 W GIRARD AVE, Grades: 9-12, Boys only)
- CALVARY CHRISTIAN ACADEMY (Students: 958, Location: 13500 PHILMONT AVE, Grades: PK-12)
- GERMANTOWN FRIENDS SCHOOL (Students: 855, Location: 31 W COULTER ST, Grades: KG-12)
- LITTLE FLOWER CATHOLIC HIGH SCHOOL (Students: 747, Location: 1000 W LYCOMING ST, Grades: 9-12, Girls only)
- STS JOHN NEUMANN & MARIA GARETTI CATH HIGH SCHOOL (Students: 690, Location: 1736 S 10TH ST, Grades: 9-12)
- ST HUBERT CATHOLIC HIGH SCHOOL FOR GIRLS (Students: 680, Location: 7320 TORRESDALE AVE, Grades: 9-12, Girls only)
Biggest public elementary/middle schools in Philadelphia:
- SPRUANCE GILBERT SCH (Students: 1,321, Location: 6401 HORROCKS ST, Grades: PK-8)
- CARNELL LAURA H SCH (Students: 1,313, Location: 1100 DEVEREAUX ST, Grades: KG-5)
- BALDI C C A MS (Students: 1,209, Location: 8801 VERREE RD, Grades: 6-8)
- WILSON WOODROW MS (Students: 1,190, Location: 1800 COTTMAN AVE, Grades: 6-8)
- HOPKINSON FRANCIS SCH (Students: 1,130, Location: 4001 L ST, Grades: KG-8)
- HARDING WARREN G MS (Students: 1,103, Location: 2000 WAKELING ST, Grades: 6-8)
- WASHINGTON GROVER JR SCH (Students: 1,084, Location: 201 E OLNEY AVENUE, Grades: 5-8)
- ELKIN LEWIS SCH (Students: 1,077, Location: 3199 D ST, Grades: KG-4)
- CLEMENTE ROBERTO MS (Students: 1,069, Location: 122 W ERIE AVE, Grades: 6-8)
- SOLIS-COHEN SOLOMON SCH (Students: 1,054, Location: 7001 HORROCKS ST, Grades: PK-6)
Biggest private elementary/middle schools in Philadelphia:
- OUR LADY OF CALVARY SCHOOL (Students: 860, Location: 11023 KIPLING LN, Grades: PK-8)
- ST MATTHEW SCHOOL (Students: 825, Location: 3040 COTTMAN AVE, Grades: KG-8)
- ST CECILIA ELEMENTARY SCHOOL (Students: 669, Location: 525 RHAWN ST, Grades: KG-8)
- ST MONICA SCHOOL (Students: 565, Location: 16TH AND PORTER ST SENIOR BU, Grades: PK-8)
- ST CHRISTOPHER SCHOOL (Students: 562, Location: 13305 PROCTOR RD, Grades: PK-8)
- ST KATHERINE OF SIENA SCHOOL (Students: 547, Location: 9738 FRANKFORD AVE, Grades: KG-8)
- ST JEROME SCHOOL (Students: 546, Location: 3031 STAMFORD ST, Grades: PK-8)
- MATERNITY BVM SCHOOL (Students: 530, Location: 9322 OLD BUSTLETON AVE, Grades: PK-8)
- ST FRANCIS DE SALES SCHOOL (Students: 512, Location: 917 S 47TH ST, Grades: KG-8)
- VISITATION SCHOOL (Students: 464, Location: 300 E LEHIGH AVE, Grades: PK-8)
Library in Philadelphia:
- FREE LIBRARY OF PHILADELPHIA (Operating income: $84,384,785; Location: 1901 VINE ST; 4,790,585 books; 3,209 e-books; 1,068,370 audio materials; 230,930 video materials; 109 local licensed databases; 41 state licensed databases; 14 other licensed databases; 7,805 print serial subscriptions; 669 electronic serial subscriptions)
User-submitted facts and corrections:
- Saint Joseph's University ENROLLMENT: 2005-2006 7700 total in all programs (estimated average 2005-06) * 4150 traditional full time undergraduates o 2,150 in College of Arts and Sciences o 2,000 in Erivan K. Haub School of Business o 51% female, 49% male o 61% of traditional full time students reside on campus * 780 University College and Bridge Program students * 2,770 graduate students o 1,820 in arts and sciences programs o 900 in business programs o 50 doctoral stud
- will smith and rocky where born in philly
Points of interest:
Notable locations in Philadelphia: Fort Mifflin (A), Academy Gardens (B), Rising Sun (C), Coopersville (D), Hestonville (E), North Penn (F), Mount Vernon (G), Rockdale (H), Whitehall (I), Rocky Hill (J), Five Points (K), Spectrum Sports Arena (L), F D Roosevelt Golf Course (M), Bala Golf Course (N), John F Byrne Golf Course (O), Liberty Bell Racetrack (P), Philadelphia Industrial Park (Q), Riverside Industrial Park (R), Juniata Park Golf Course (S), Academy Gardens Golf Course (T). Display/hide their locations on the map
Shopping Centers: Blue Grass Shopping Center (1), Roosevelt Mall (2), Northeast Village Shopping Center (3), Bustleton Cottman Shopping Center (4), Bells Corner Shopping Center (5), Somerton Shopping Center (6), Red Lion Shopping Center (7), Leo Mall (8), Andorra Shopping Center (9). Display/hide their locations on the map
Main business address in Philadelphia include: MARITRANS INC /DE/ (A), FMC CORP (B), CDI CORP (C), CIGNA CORP (D), CONSTAR INTERNATIONAL INC (E), SUNOCO INC (F), ROHM & HAAS CO (G). Display/hide their locations on the map
Churches in Philadelphia include: Alleyne Church (A), Andorra Church (B), Saint Pauls Church (C), Greater Northeast Congregation (D), Grace Chapel (E), Good Shepherd Church (F), Acts of the Apostles Church in Jesus Christ (G), Saint Johns Church (H), Cooper Church (I). Display/hide their locations on the map
Cemeteries: Belvue Cemetery (1), Woodlands Cemetery (2), Adath Jeshurun (3), Byberry Cemetery (4), Saint Mary of the Assumption Cemetery (5), Laurel Hill Cemetery (6), Magnolia Cemetery (7). Display/hide their locations on the map
Lakes and reservoirs: Gustine Lake (A), Concourse Lake (B), Devils Pool (C), Meadow Lake (D), Centennial Lake (E), Oak Lane Reservoir (F), East Park Reservoir (G), Queen Lane Reservoir (H). Display/hide their locations on the map
Streams, rivers, and creeks: Walton Run (A), Schuylkill River (B), Pennypack Creek (C), Byberry Creek (D), Frankford Creek (E), Tacony Creek (F), Indian Creek (G), Glanraffan Creek (H), Mill Creek (I). Display/hide their locations on the map
Parks in Philadelphia include: Frankford Playground (1), Fox Chase Playground (2), Northwood Park (3), Pleasant Playground (4), Simons Recreation Center (5), Stringer Park (6), Elmwood Park (7), Independence Mall State Park (8), Independence National Historical Park (9). Display/hide their locations on the map
Tourist attractions: Penna Academy of The Fine Arts (Museums; Broad & Cherry Street) (1), College of Physicians of Philadelphia (Museums; 19 S. 22 Street) (2), Benjamin Franklin Tercentenary (Museums; 1530 Locust Street) (3), Academy Of Natural Sciences (Museums; 19 & Benjamin Franklin Prkwy) (4), Balch Institute for Ethnic Studies (Museums; 18 South 7th Street) (5), Boulton-Stroud Marion (Museums; 1315 Cherry Street Floor 5) (6), American Interfaith Institute (Museums; 321 Chestnut Street) (7), Marian Anderson Residence Museum (Art Museums; 762 S Marian Anderson Way) (8), Fabric Workshop and Museum (Cultural Attractions- Events- & Facilities; 1315 Cherry Street Floor 5) (9). Display/hide their approximate locations on the map
Hotels: Comfort Inn (100 North Colombus blvd.) (1), Concordia Worldwide Hotel Reservations (3751 Island Avenue Suite: 101) (2), Embassy Suites (9000 Bartram Ave) (3), Adam's Mark Hotel (E City Ave At Monument Rd) (4), Courtyard Philadelphia Downtown (21 N Juniper St) (5), Adam's Mark Philadelphia (4000 Monument Road) (6), Extended Stay America - Philadelphia (9000 Tinicum Blvd) (7), Clarion Suites (1010 Race Street) (8), Carlyle Hotel (1425 Poplar Street) (9). Display/hide their approximate locations on the map
Courts: Supreme Court Of Pennsylvania (900 Race Street) (1), Pennsylvania Commonwealth - Supreme Court- Pennsylvania Client Security (3 Penn Centre) (2), United States Government - Courts- District Court- Judge C R Weiner (USCourthouse) (3), Philadelphia City & County - Family Court Division- Courts and Legal Information- Orphan's C (City Hall) (4), Executive Office For Immigration Review - General Information (1600 Callowhill Street) (5), Small Claims Court (City Hall) (6), Pennsylvania Commonwealth - Supreme Court- Disciplinary Board (121 Broad Street Street) (7), Philadelphia City & County - Common Pleas Court- Criminal Listings (City Hall) (8), Philadelphia City & County - Courts and Legal Information- Office of the Court Administr (City Hall) (9). Display/hide their approximate locations on the map
Birthplace of: Cecilia Beaux - Artist, Joseph Wharton - Businessman, Sarah Chang - Violinist, John de Lancie - Film actor, Santigold - Female singer, Blythe Danner - (born 1943), actor, Sabian (wrestler) - Professional wrestler, Charles Brockden Brown - Novelist, Steve Veltman - Bicycle motocross rider, Robert Crumb - (born 1943), underground cartoonist.
Drinking water stations with addresses in Philadelphia and their reported violations in the past:
SUNOCO STORE 7607 (Population served: 1,100, Groundwater):Past health violations:SUNOCO FOOD MART # 2342 (Population served: 500, Groundwater):Past monitoring violations:
- MCL, Monthly (TCR) - In JUL-2013, Contaminant: Coliform. Follow-up actions: St Public Notif received (JAN-06-2014), St Compliance achieved (JAN-06-2014), St Violation/Reminder Notice (JAN-06-2014)
- MCL, Monthly (TCR) - In JUL-2005, Contaminant: Coliform. Follow-up actions: St Public Notif requested (AUG-31-2005), St Public Notif received (AUG-31-2005), St Compliance achieved (AUG-31-2005), St Formal NOV issued (AUG-31-2005)
- 7 routine major monitoring violations
- 2 minor monitoring violations
- 7 regular monitoring violations
Past monitoring violations:PINE FOREST CAMP (Population served: 450, Groundwater):
- 4 regular monitoring violations
Past health violations:SUNOCO STORE 7240 (Population served: 410, Groundwater):Past monitoring violations:
- MCL, Monthly (TCR) - Between JUL-2013 and SEP-2013, Contaminant: Coliform. Follow-up actions: St Public Notif requested (SEP-19-2013), St Public Notif received (SEP-19-2013), St Compliance achieved (SEP-19-2013), St Site Visit (enforcement) (SEP-19-2013), St Violation/Reminder Notice (SEP-19-2013)
- Monitoring, Source Water (GWR) - Between JUN-10-2012 and JUL-10-2012, Contaminant: E. COLI. Follow-up actions: St Public Notif requested (AUG-22-2012), St Violation/Reminder Notice (AUG-22-2012), St Public Notif received (AUG-22-2012), St Site Visit (enforcement) (AUG-22-2012), St Compliance achieved (OCT-18-2012)
- 6 regular monitoring violations
Past health violations:I V E RETREAT CENTER (Address: St. Hugh of Cluny R.C. Church , Serves NY, Population served: 210, Groundwater):Past monitoring violations:
- MCL, Monthly (TCR) - Between JUL-2007 and SEP-2007, Contaminant: Coliform. Follow-up actions: St Site Visit (enforcement) (NOV-28-2007), St AO (w/o penalty) issued (2 times from NOV-28-2007 to NOV-28-2007), St Site Visit (enforcement) (NOV-28-2007), St Compliance achieved (2 times from MAY-19-2008 to MAY-19-2008)
- 4 routine major monitoring violations
- 2 regular monitoring violations
Past monitoring violations:LAKE OWEGO CAMP (Population served: 200, Groundwater):
- One routine major monitoring violation
Past health violations:SUNOCO STORE #7244 (Population served: 150, Groundwater):
- MCL, Monthly (TCR) - Between JUL-2009 and SEP-2009, Contaminant: Coliform. Follow-up actions: St Public Notif requested (AUG-21-2009), St Violation/Reminder Notice (AUG-21-2009), St Public Notif received (AUG-21-2009), St Site Visit (enforcement) (AUG-21-2009), St Compliance achieved (SEP-16-2009)
Past monitoring violations:WILLIAMSTOWN PAVILLION (Serves NJ, Population served: 100, Groundwater):
- 6 routine major monitoring violations
- 4 regular monitoring violations
Past monitoring violations:
- One routine major monitoring violation
- One regular monitoring violation
Drinking water stations with addresses in Philadelphia that have no violations reported:
- SCHUYLKILL CENTER FOR ENV EDU (Population served: 100, Primary Water Source Type: Groundwater)
| This city: | 2.5 people |
| Pennsylvania: | 2.5 people |
| This city: | 56.8% |
| Whole state: | 65.0% |
| This city: | 8.0% |
| Whole state: | 6.6% |
Likely homosexual households (counted as self-reported same-sex unmarried-partner households)
- Lesbian couples: 0.5% of all households
- Gay men: 0.5% of all households
People in group quarters in Philadelphia in 2010:
- 25,462 people in college/university student housing
- 8,828 people in local jails and other municipal confinement facilities
- 7,877 people in nursing facilities/skilled-nursing facilities
- 3,750 people in emergency and transitional shelters (with sleeping facilities) for people experiencing homelessness
- 3,732 people in group homes intended for adults
- 2,983 people in other noninstitutional facilities
- 1,616 people in residential treatment centers for adults
- 998 people in federal detention centers
- 526 people in correctional residential facilities
- 426 people in workers' group living quarters and job corps centers
- 263 people in correctional facilities intended for juveniles
- 241 people in mental (psychiatric) hospitals and psychiatric units in other hospitals
- 175 people in group homes for juveniles (non-correctional)
- 173 people in residential treatment centers for juveniles (non-correctional)
- 155 people in hospitals with patients who have no usual home elsewhere
- 57 people in residential schools for people with disabilities
- 42 people in in-patient hospice facilities
- 41 people in state prisons
- 24 people in maritime/merchant vessels
- 14 people in military barracks and dormitories (nondisciplinary)
People in group quarters in Philadelphia in 2000:
- 21,123 people in college dormitories (includes college quarters off campus)
- 10,164 people in nursing homes
- 4,510 people in other noninstitutional group quarters
- 3,887 people in local jails and other confinement facilities (including police lockups)
- 2,674 people in state prisons
- 2,189 people in homes or halfway houses for drug/alcohol abuse
- 1,679 people in religious group quarters
- 1,296 people in homes for the mentally retarded
- 1,234 people in other group homes
- 1,103 people in homes for the mentally ill
- 1,014 people in mental (psychiatric) hospitals or wards
- 527 people in military barracks, etc.
- 526 people in other nonhousehold living situations
- 463 people in hospitals/wards and hospices for chronically ill
- 432 people in wards in general hospitals for patients who have no usual home elsewhere
- 396 people in halfway houses
- 373 people in schools, hospitals, or wards for the intellectually disabled
- 313 people in other hospitals or wards for chronically ill
- 257 people in hospitals or wards for drug/alcohol abuse
- 197 people in orthopedic wards and institutions for the physically handicapped
- 169 people in homes for abused, dependent, and neglected children
- 160 people in short-term care, detention or diagnostic centers for delinquent children
- 112 people in military hospitals or wards for chronically ill
- 86 people in homes for the physically handicapped
- 84 people in federal prisons and detention centers
- 61 people in other types of correctional institutions
- 47 people in unknown juvenile institutions
- 38 people in hospices or homes for chronically ill
- 28 people in institutions for the blind
- 26 people in job corps and vocational training facilities
- 10 people in agriculture workers' dormitories on farms
- 6 people in other workers' dormitories
- 5 people in residential treatment centers for emotionally disturbed children
- 4 people in military ships
Arenas or stadiums:
- Lincoln Financial Field. Capacity: 68,532. Philadelphia Eagles, Temple Owls football.
- Franklin Field. Capacity: 52,593. Penn Quakers football.
- Citizens Bank Park. Capacity: 43,500. Philadelphia Phillies.
- Wachovia Center. Philadelphia Flyers (NHL), Philadelphia 76ers (NBA), Philadelphia Soul (AFL), Philadelphia Wings (NLL).
- Wachovia Spectrum. Philadelphia KiXX (MISL}.
- Liacouras Center. Temple University.
- Palestra. University of Pennsylvania.
Banks with most branches in Philadelphia (2011 data):
- Citizens Bank of Pennsylvania: 60 branches. Info updated 2010/09/24: Bank assets: $32,316.9 mil, Deposits: $25,297.1 mil, local headquarters, positive income, 396 total offices, Holding Company: Uk Financial Investments Limited
- Wells Fargo Bank, National Association: 43 branches. Info updated 2011/04/05: Bank assets: $1,161,490.0 mil, Deposits: $905,653.0 mil, headquarters in Sioux Falls, SD, positive income, 6395 total offices, Holding Company: Wells Fargo & Company
- PNC Bank, National Association: 40 branches. Info updated 2012/03/20: Bank assets: $263,309.6 mil, Deposits: $197,343.0 mil, headquarters in Wilmington, DE, positive income, Commercial Lending Specialization, 3085 total offices, Holding Company: Pnc Financial Services Group, Inc., The
- TD Bank, National Association: 21 branches. Info updated 2010/10/04: Bank assets: $188,912.6 mil, Deposits: $153,149.8 mil, headquarters in Wilmington, DE, positive income, 1314 total offices, Holding Company: Toronto-Dominion Bank, The
- Bank of America, National Association: 19 branches. Info updated 2009/11/18: Bank assets: $1,451,969.3 mil, Deposits: $1,077,176.8 mil, headquarters in Charlotte, NC, positive income, 5782 total offices, Holding Company: Bank Of America Corporation
- Sovereign Bank, National Association: 17 branches. Info updated 2012/01/31: Bank assets: $78,146.9 mil, Deposits: $48,042.9 mil, headquarters in Wilmington, DE, positive income, Commercial Lending Specialization, 718 total offices, Holding Company: Banco Santander, S.A.
- Beneficial Mutual Savings Bank: 14 branches. Info updated 2011/07/08: Bank assets: $4,590.2 mil, Deposits: $3,659.5 mil, local headquarters, positive income, 60 total offices
- Conestoga Bank: 8 branches. Info updated 2007/05/31: Bank assets: $600.2 mil, Deposits: $478.9 mil, headquarters in Chester Springs, PA, positive income, Commercial Lending Specialization, 14 total offices, Holding Company: Conestoga Bancorp, Inc
- Firstrust Savings Bank: 8 branches. Info updated 2008/10/10: Bank assets: $2,487.2 mil, Deposits: $1,995.0 mil, headquarters in Conshohocken, PA, positive income, Commercial Lending Specialization, 24 total offices
- 37 other banks with 99 local branches
For population 15 years and over in Philadelphia:
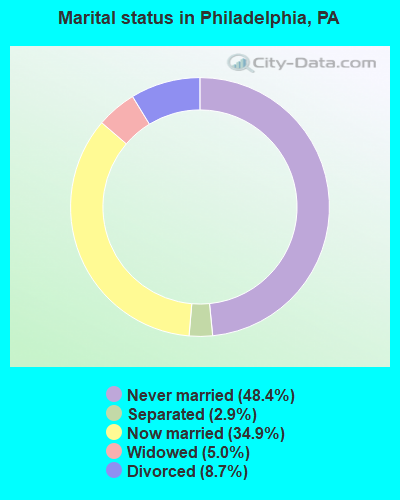
- Never married: 48.4%
- Now married: 34.9%
- Separated: 2.9%
- Widowed: 5.0%
- Divorced: 8.7%
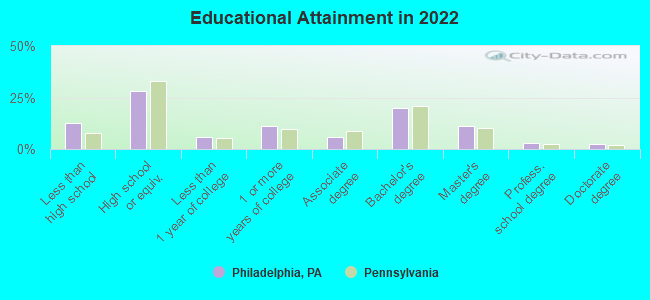
For population 25 years and over in Philadelphia:
- High school or higher: 87.3%
- Bachelor's degree or higher: 36.3%
- Graduate or professional degree: 16.5%
- Unemployed: 5.7%
- Mean travel time to work (commute): 25.4 minutes
| Here: | 13.6 |
| Pennsylvania average: | 11.4 |


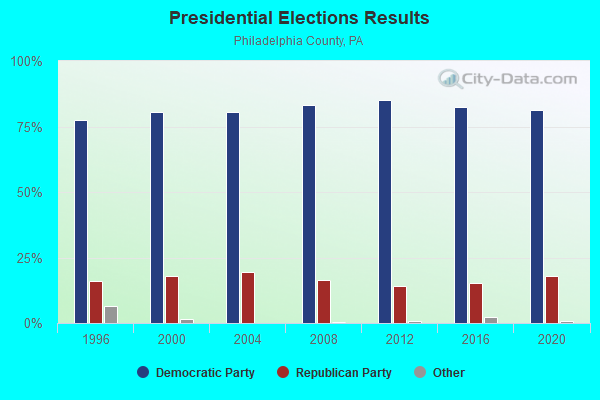
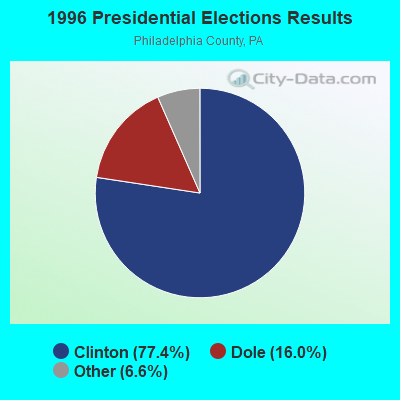
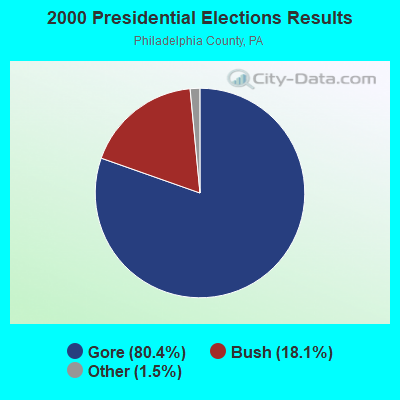

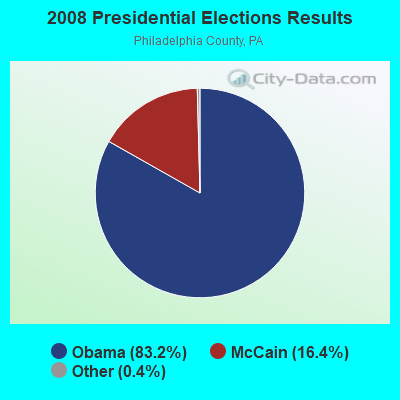
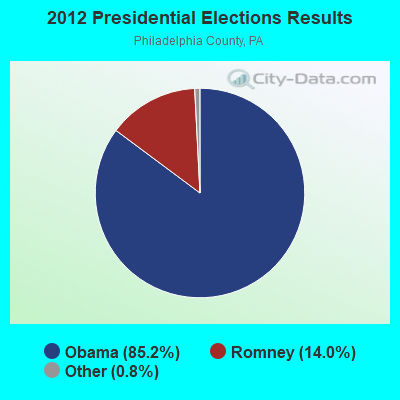
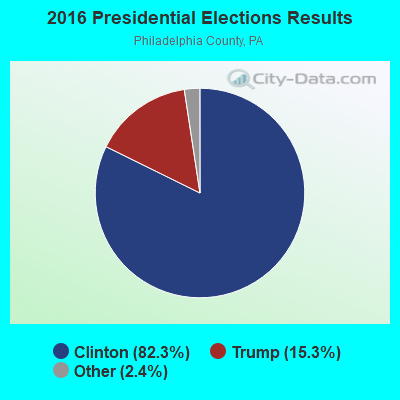
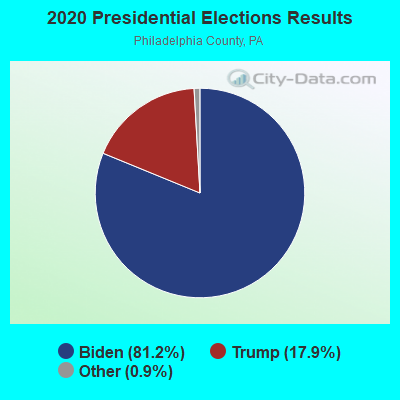
Graphs represent county-level data. Detailed 2008 Election Results
Neighborhoods in Philadelphia:
(Philadelphia, Pennsylvania Neighborhood Map)- 3rd St Fabric Row neighborhood
- 4th St Tattoo Alley neighborhood
- 52nd St Discount Shopping neighborhood
- 63rd St Discount Shopping neighborhood
- Abbotsford neighborhood
- Academy Gardens neighborhood
- Allegheny West neighborhood
- Andorra neighborhood
- Antique Row neighborhood
- Ashton Woodenbridge neighborhood
- Aston (Astonville) neighborhood
- Avenue Of The Arts - North neighborhood
- Avenue Of The Arts - South neighborhood
- Bainbridge St Booksellers Row neighborhood
- Bainbridge Street neighborhood
- Baring neighborhood
- Bartram Gardens (Bartram's Gardens) neighborhood
- Belfield neighborhood
- Bell's Corners neighborhood
- Bella Vista neighborhood
- Belmont neighborhood
- Ben Franklin Parkway - Kelly Drive neighborhood
- Big Hotels neighborhood
- Brewerytown neighborhood
- Bridesburg neighborhood
- Burholme neighborhood
- Bustleton neighborhood
- Byberry neighborhood
- Callowhill neighborhood
- Carroll Park neighborhood
- Castor (Castor Garden) neighborhood
- Cedar Park neighborhood
- Cedarbrook neighborhood
- Center City neighborhood
- Center City East neighborhood
- Center City West neighborhood
- Chestnut Hill neighborhood
- Chestnut Street neighborhood
- Chinatown neighborhood
- City Hall neighborhood
- Club District neighborhood
- Cobbs Creek neighborhood
- Crestmont Farms neighborhood
- Dearnley Park neighborhood
- Devil's Pocket neighborhood
- Dickinson Narrows neighborhood
- Dunlap neighborhood
- East Falls neighborhood
- East Germantown neighborhood
- East Mount Airy neighborhood
- East Oak Lane neighborhood
- East Passyunk Crossing neighborhood
- Eastwick neighborhood
- Elfreth's Alley neighborhood
- Elmwood neighborhood
- Fairhill neighborhood
- Fairmount neighborhood
- Fairmount District neighborhood
- Far Northeasat neighborhood
- Feltonville neighborhood
- Fern Rock neighborhood
- Fernhill neighborhood
- Financial District neighborhood
- Fishtown neighborhood
- Fitler Square neighborhood
- Food Distribution Warehouses neighborhood
- Fox Chase neighborhood
- Francisville neighborhood
- Frankford neighborhood
- Franklin Mills neighborhood
- Franklintown neighborhood
- Garden Court neighborhood
- Gayborhood neighborhood
- Germantown neighborhood
- Germany Hill neighborhood
- Girard Estate neighborhood
- Girard Estates neighborhood
- Glenwood neighborhood
- Govt. Administration neighborhood
- Grays Ferry neighborhood
- Haddington neighborhood
- Harrowgate neighborhood
- Hartranft neighborhood
- Hawthorne neighborhood
- Holmesburg neighborhood
- Hunting Park neighborhood
- Hunting Park (Franklinville) neighborhood
- Independence Mall Historic Area neighborhood
- Italian Market neighborhood
- Juniata Park (Juniata) neighborhood
- Kensington neighborhood
- Kingsessing neighborhood
- Lawncrest neighborhood
- Lexington Park neighborhood
- Logan neighborhood
- Logan Circle neighborhood
- Logan Square neighborhood
- Manayunk neighborhood
- Mantua neighborhood
- Marconi Plaza neighborhood
- Market East neighborhood
- Market Street Department Stores neighborhood
- Mayfair neighborhood
- Mill Creek neighborhood
- Morrell Park neighborhood
- Mount Airy neighborhood
- Ne Philly - Discount Shopping neighborhood
- Newbold neighborhood
- Nicetown-Tioga neighborhood
- North Central neighborhood
- North Del Ave Club District neighborhood
- Northern Liberties neighborhood
- Ogontz neighborhood
- Old City Lounge District neighborhood
- Olde City neighborhood
- Olde Kensington neighborhood
- Olney neighborhood
- Oregon Avenue Discount Shopping neighborhood
- Overbrook neighborhood
- Overbrook Farms neighborhood
- Oxford Circle neighborhood
- Packer Park neighborhood
- Parkway Museums neighborhood
- Passyunk neighborhood
- Passyunk Discount Shopping neighborhood
- Passyunk Square neighborhood
- Penn Campus Shopping / West Philly neighborhood
- Penn Center neighborhood
- Penn's Landing neighborhood
- Pennsport neighborhood
- Pennypack neighborhood
- Pennypack Park neighborhood
- Point Breeze neighborhood
- Poplar neighborhood
- Port Richmond neighborhood
- Powelton neighborhood
- Powelton Village neighborhood
- Queen Village neighborhood
- Restaurant Row neighborhood
- Rhawnhurst neighborhood
- Richmond neighborhood
- Rising Sun neighborhood
- Rittenhouse neighborhood
- Riverfront neighborhood
- Roosevelt Park neighborhood
- Roxborough neighborhood
- Ryers neighborhood
- Saunder's Park neighborhood
- Schuylkill neighborhood
- Schuylkill River Park neighborhood
- Sharswood neighborhood
- Society Hill neighborhood
- Somerton neighborhood
- South Philadelphia neighborhood
- South Philly Discount Shopping neighborhood
- South Street neighborhood
- Southwest Center City (Graduate Hospital) neighborhood
- Spring Garden neighborhood
- Spruce Hill neighborhood
- Squirrel Hill neighborhood
- Stadiums neighborhood
- Strawberry Mansion neighborhood
- Tacony neighborhood
- Tank Farms and Refineries neighborhood
- Temple Campus neighborhood
- Temple University neighborhood
- The Badlands neighborhood
- Tioga neighborhood
- US Navy Yard neighborhood
- University City neighborhood
- Upper Roxborough neighborhood
- Walnut Hill neighborhood
- Washington Avenue neighborhood
- Washington Square neighborhood
- West Kensington neighborhood
- West Mount Airy neighborhood
- West Oak Lane neighborhood
- West Philly neighborhood
- West Powelton neighborhood
- West Torresdale neighborhood
- Wharton neighborhood
- Wissahickon Park neighborhood
- Wissinoming neighborhood
- Woodland Terrace neighborhood
- Wynnefield neighborhood
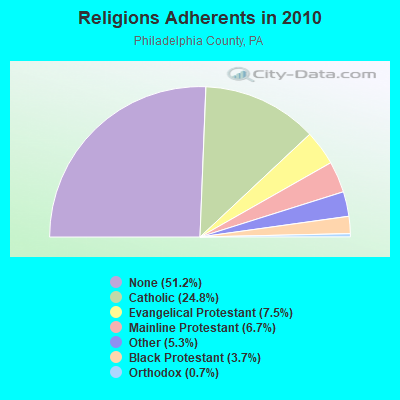
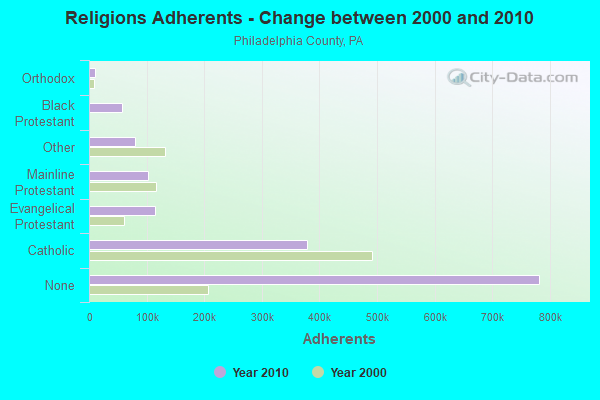
Religion statistics for Philadelphia, PA (based on Philadelphia County data)
| Religion | Adherents | Congregations |
|---|---|---|
| Catholic | 378,561 | 115 |
| Evangelical Protestant | 114,439 | 523 |
| Mainline Protestant | 102,627 | 319 |
| Other | 80,599 | 147 |
| Black Protestant | 56,766 | 164 |
| Orthodox | 11,276 | 24 |
| None | 781,738 | - |
Food Environment Statistics:
| Here: | 3.15 / 10,000 pop. |
| Pennsylvania: | 2.04 / 10,000 pop. |
| Philadelphia County: | 0.02 / 10,000 pop. |
| Pennsylvania: | 0.09 / 10,000 pop. |
| Here: | 1.18 / 10,000 pop. |
| Pennsylvania: | 0.88 / 10,000 pop. |
| Here: | 1.16 / 10,000 pop. |
| Pennsylvania: | 2.52 / 10,000 pop. |
| Here: | 6.85 / 10,000 pop. |
| Pennsylvania: | 7.12 / 10,000 pop. |
| Philadelphia County: | 10.4% |
| State: | 9.1% |
| Philadelphia County: | 29.1% |
| Pennsylvania: | 27.2% |
| Here: | 8.4% |
| Pennsylvania: | 11.5% |
Health and Nutrition:
| Philadelphia: | 48.9% |
| State: | 50.2% |
| Philadelphia: | 46.2% |
| Pennsylvania: | 47.1% |
| Philadelphia: | 29.1 |
| State: | 28.7 |
| Philadelphia: | 19.4% |
| Pennsylvania: | 20.8% |
| Here: | 13.0% |
| State: | 10.9% |
| Philadelphia: | 6.7 |
| Pennsylvania: | 6.8 |
| This city: | 33.7% |
| Pennsylvania: | 34.3% |
| This city: | 54.8% |
| Pennsylvania: | 56.2% |
| This city: | 80.8% |
| Pennsylvania: | 78.3% |
More about Health and Nutrition of Philadelphia, PA Residents
| Local government employment and payroll (March 2022) | |||||
| Function | Full-time employees | Monthly full-time payroll | Average yearly full-time wage | Part-time employees | Monthly part-time payroll |
|---|---|---|---|---|---|
| Police Protection - Officers | 6,049 | $50,992,781 | $101,159 | 0 | $0 |
| Judicial and Legal | 3,015 | $9,903,366 | $39,416 | 4 | $14,605 |
| Firefighters | 2,652 | $27,233,462 | $123,228 | 0 | $0 |
| Correction | 1,772 | $10,761,143 | $72,875 | 0 | $0 |
| Health | 1,685 | $14,066,485 | $100,177 | 3 | $3,992 |
| Welfare | 1,612 | $6,765,801 | $50,366 | 0 | $0 |
| Financial Administration | 1,544 | $9,234,238 | $71,769 | 0 | $0 |
| Gas Supply | 1,471 | $10,882,284 | $88,775 | 19 | $87,363 |
| Solid Waste Management | 1,470 | $5,458,108 | $44,556 | 0 | $0 |
| Water Supply | 1,436 | $7,603,594 | $63,540 | 0 | $0 |
| Other Government Administration | 1,358 | $7,451,973 | $65,850 | 16 | $56,743 |
| Police - Other | 832 | $4,237,961 | $61,124 | 655 | $925,126 |
| Sewerage | 675 | $3,614,556 | $64,259 | 0 | $0 |
| Parks and Recreation | 631 | $3,232,045 | $61,465 | 85 | $241,854 |
| Local Libraries | 630 | $3,026,477 | $57,647 | 54 | $154,626 |
| Streets and Highways | 609 | $2,587,143 | $50,978 | 0 | $0 |
| Airports | 605 | $3,401,597 | $67,470 | 0 | $0 |
| Other and Unallocable | 579 | $3,136,848 | $65,012 | 4 | $2,442 |
| Housing and Community Development (Local) | 289 | $1,952,669 | $81,080 | 39 | $64,898 |
| Fire - Other | 111 | $734,321 | $79,386 | 0 | $0 |
| Natural Resources | 8 | $70,446 | $105,669 | 0 | $0 |
| Totals for Government | 29,033 | $186,347,297 | $77,022 | 879 | $1,551,650 |
Philadelphia government finances - Expenditure in 2021 (per resident):
- Construction - Libraries: $156,194,000 ($99.66)
Water Utilities: $148,324,000 ($94.64)
Air Transportation: $124,161,000 ($79.22)
Sewerage: $121,664,000 ($77.63)
General Public Buildings: $70,524,000 ($45.00)
Solid Waste Management: $56,362,000 ($35.96)
Regular Highways: $19,244,000 ($12.28)
Parks and Recreation: $12,000,000 ($7.66)
Police Protection: $7,249,000 ($4.63)
Transit Utilities: $5,464,000 ($3.49)
Local Fire Protection: $1,840,000 ($1.17)
General - Other: $570,000 ($0.36)
Health - Other: $73,000 ($0.05)
- Current Operations - Health - Other: $2,062,800,000 ($1316.18)
General - Other: $1,053,826,000 ($672.40)
Police Protection: $786,674,000 ($501.94)
Housing and Community Development: $499,031,000 ($318.41)
Gas Utilities: $384,675,000 ($245.44)
Judicial and Legal Services: $343,635,000 ($219.26)
Local Fire Protection: $330,093,000 ($210.62)
Sewerage: $277,596,000 ($177.12)
Central Staff Services: $237,538,000 ($151.56)
Regular Highways: $237,218,000 ($151.36)
Air Transportation: $221,396,000 ($141.26)
General Public Buildings: $215,387,000 ($137.43)
Correctional Institutions: $215,027,000 ($137.20)
Public Welfare - Other: $174,304,000 ($111.22)
Solid Waste Management: $159,614,000 ($101.84)
Water Utilities: $133,468,000 ($85.16)
Parks and Recreation: $93,657,000 ($59.76)
Corrections - Other: $90,569,000 ($57.79)
Financial Administration: $79,625,000 ($50.81)
Public Welfare, Vendor Payments for Other Purposes: $61,825,000 ($39.45)
Protective Inspection and Regulation - Other: $57,363,000 ($36.60)
Libraries: $54,410,000 ($34.72)
Electric Utilities: $2,542,000 ($1.62)
- Gas Utilities - Interest on Debt: $43,552,000 ($27.79)
- General - Interest on Debt: $233,154,000 ($148.77)
- Intergovernmental to Local - Other - Elementary and Secondary Education: $294,195,000 ($187.71)
Other - Transit Utilities: $283,000 ($0.18)
- Other Capital Outlay - Police Protection: $2,828,000 ($1.80)
General - Other: $1,697,000 ($1.08)
Parks and Recreation: $400,000 ($0.26)
- Total Salaries and Wages: $2,306,295,000 ($1471.55)
- Water Utilities - Interest on Debt: $70,560,000 ($45.02)
Philadelphia government finances - Revenue in 2021 (per resident):
- Charges - Sewerage: $307,994,000 ($196.52)
Other: $306,072,000 ($195.29)
Air Transportation: $288,424,000 ($184.03)
Housing and Community Development: $2,807,000 ($1.79)
Parks and Recreation: $1,679,000 ($1.07)
Solid Waste Management: $1,218,000 ($0.78)
- Federal Intergovernmental - Other: $774,639,000 ($494.26)
Air Transportation: $64,398,000 ($41.09)
Housing and Community Development: $35,285,000 ($22.51)
Highways: $1,630,000 ($1.04)
Electric Utilities: $367,000 ($0.23)
- Local Intergovernmental - Other: $1,144,303,000 ($730.13)
Electric Utilities: $518,000 ($0.33)
- Miscellaneous - Interest Earnings: $125,703,000 ($80.21)
Donations From Private Sources: $37,430,000 ($23.88)
Fines and Forfeits: $34,258,000 ($21.86)
Special Assessments: $26,303,000 ($16.78)
General Revenue - Other: $22,797,000 ($14.55)
Rents: $482,000 ($0.31)
- Revenue - Gas Utilities: $584,937,000 ($373.22)
Water Utilities: $429,747,000 ($274.20)
- State Intergovernmental - Health and Hospitals: $1,215,730,000 ($775.71)
Other: $481,121,000 ($306.98)
Public Welfare: $345,535,000 ($220.47)
Highways: $45,856,000 ($29.26)
General Local Government Support: $4,768,000 ($3.04)
- Tax - Individual Income: $2,128,145,000 ($1357.88)
Property: $699,050,000 ($446.03)
Corporation Net Income: $589,751,000 ($376.29)
General Sales and Gross Receipts: $452,469,000 ($288.70)
Documentary and Stock Transfer: $319,794,000 ($204.05)
Other Selective Sales: $204,590,000 ($130.54)
Other License: $65,734,000 ($41.94)
Amusements Sales: $18,446,000 ($11.77)
Philadelphia government finances - Debt in 2021 (per resident):
- Long Term Debt - Outstanding Unspecified Public Purpose: $5,682,364,000 ($3625.67)
Beginning Outstanding - Unspecified Public Purpose: $5,347,452,000 ($3411.98)
Issue, Unspecified Public Purpose: $662,050,000 ($422.43)
Retired Unspecified Public Purpose: $327,137,000 ($208.73)
Philadelphia government finances - Cash and Securities in 2021 (per resident):
- Bond Funds - Cash and Securities: $316,829,000 ($202.15)
- Other Funds - Cash and Securities: $3,401,269,000 ($2170.20)
- Sinking Funds - Cash and Securities: $16,042,000 ($10.24)
5.66% of this county's 2021 resident taxpayers lived in other counties in 2020 ($68,192 average adjusted gross income)
| Here: | 5.66% |
| Pennsylvania average: | 5.27% |
0.02% of residents moved from foreign countries ($81 average AGI)
Philadelphia County: 0.02% Pennsylvania average: 0.01%
Top counties from which taxpayers relocated into this county between 2020 and 2021:
| from Montgomery County, PA | |
| from Delaware County, PA | |
| from Bucks County, PA |
7.69% of this county's 2020 resident taxpayers moved to other counties in 2021 ($84,560 average adjusted gross income)
| Here: | 7.69% |
| Pennsylvania average: | 5.44% |
0.03% of residents moved to foreign countries ($178 average AGI)
Philadelphia County: 0.03% Pennsylvania average: 0.01%
Top counties to which taxpayers relocated from this county between 2020 and 2021:
| to Montgomery County, PA | |
| to Delaware County, PA | |
| to Bucks County, PA |
| Businesses in Philadelphia, PA | ||||
| Name | Count | Name | Count | |
|---|---|---|---|---|
| 7-Eleven | 47 | Kohl's | 1 | |
| ALDI | 4 | LA Fitness | 6 | |
| ALDO | 2 | La-Z-Boy | 2 | |
| AMF Bowling | 1 | Lane Bryant | 5 | |
| AT&T | 8 | Lane Furniture | 2 | |
| Ace Hardware | 1 | LensCrafters | 1 | |
| Advance Auto Parts | 9 | Levi Strauss & Co. | 1 | |
| Aeropostale | 1 | Little Caesars Pizza | 9 | |
| Aerosoles | 1 | Loews | 1 | |
| Ann Taylor | 5 | Lowe's | 4 | |
| Apple Store | 1 | Macy's | 2 | |
| Applebee's | 6 | Marriott | 8 | |
| Arby's | 2 | Marshalls | 1 | |
| AutoZone | 17 | MasterBrand Cabinets | 36 | |
| Avenue | 3 | Mazda | 1 | |
| Bally Total Fitness | 5 | McDonald's | 53 | |
| Banana Republic | 2 | Men's Wearhouse | 3 | |
| Barnes & Noble | 1 | Microtel | 1 | |
| Baskin-Robbins | 5 | Motherhood Maternity | 4 | |
| Bath & Body Works | 5 | New Balance | 15 | |
| Bed Bath & Beyond | 1 | New York & Co | 2 | |
| Ben & Jerry's | 2 | Nike | 122 | |
| Best Western | 2 | Nissan | 1 | |
| Blockbuster | 8 | Office Depot | 1 | |
| Brooks Brothers | 3 | OfficeMax | 2 | |
| Brookstone | 3 | Old Country Buffet | 1 | |
| Budget Car Rental | 5 | Old Navy | 4 | |
| Burger King | 21 | Olive Garden | 2 | |
| Burlington Coat Factory | 5 | Panda Express | 1 | |
| CVS | 43 | Papa John's Pizza | 6 | |
| Casual Male XL | 3 | Pathmark | 11 | |
| Catherines | 1 | Payless | 26 | |
| Charlotte Russe | 1 | Penske | 5 | |
| Chevrolet | 2 | PetSmart | 4 | |
| Chick-Fil-A | 8 | Pier 1 Imports | 1 | |
| Chipotle | 3 | Pizza Hut | 11 | |
| Chuck E. Cheese's | 2 | Popeyes | 16 | |
| Church's Chicken | 10 | Qdoba Mexican Grill | 5 | |
| Cinnabon | 2 | Quiznos | 10 | |
| Cold Stone Creamery | 1 | RadioShack | 22 | |
| Comfort Inn | 1 | Ramada | 1 | |
| Cricket Wireless | 87 | Raymour & Flanigan | 3 | |
| Curves | 2 | Red Lobster | 1 | |
| DHL | 17 | Rite Aid | 86 | |
| Dairy Queen | 3 | Rodeway Inn | 1 | |
| Days Inn | 1 | Ruby Tuesday | 3 | |
| Deb | 2 | Rue21 | 1 | |
| Decora Cabinetry | 5 | Ryder Rental & Truck Leasing | 3 | |
| Domino's Pizza | 9 | SAS Shoes | 2 | |
| DressBarn | 4 | SONIC Drive-In | 1 | |
| Dressbarn | 3 | Sam's Club | 1 | |
| Dunkin Donuts | 117 | Sears | 5 | |
| Express | 1 | Sephora | 1 | |
| Extended Stay America | 1 | Sheraton | 4 | |
| Extended Stay Deluxe | 1 | Skechers USA | 1 | |
| Famous Footwear | 2 | Spencer Gifts | 1 | |
| Fashion Bug | 4 | Sprint Nextel | 13 | |
| FedEx | 157 | Staples | 8 | |
| Finish Line | 3 | Starbucks | 33 | |
| Firestone Complete Auto Care | 3 | Subway | 40 | |
| Food Basics | 2 | Superfresh | 5 | |
| Foot Locker | 18 | T-Mobile | 11 | |
| Forever 21 | 1 | T.G.I. Driday's | 2 | |
| GNC | 46 | T.J.Maxx | 1 | |
| GameStop | 28 | Taco Bell | 16 | |
| Gap | 5 | Talbots | 1 | |
| Giant | 1 | Target | 6 | |
| Goodwill | 1 | The Athlete's Foot | 1 | |
| Gymboree | 1 | The Room Place | 3 | |
| H&M | 3 | Toyota | 1 | |
| H&R Block | 37 | Toys"R"Us | 10 | |
| Haworth | 2 | Trader Joe's | 1 | |
| Hilton | 12 | Travelodge | 1 | |
| Holiday Inn | 5 | True Value | 15 | |
| Home Depot | 6 | U-Haul | 39 | |
| Honda | 2 | UPS | 215 | |
| Hyatt | 4 | Urban Outfitters | 2 | |
| Hyundai | 2 | Value City Furniture | 2 | |
| IHOP | 5 | Vans | 5 | |
| IKEA | 1 | Verizon Wireless | 11 | |
| J.Crew | 1 | Victoria's Secret | 3 | |
| JCPenney | 1 | Volkswagen | 1 | |
| Jimmy Jazz | 9 | Walgreens | 18 | |
| JoS. A. Bank | 2 | Walmart | 3 | |
| Johnny Rockets | 1 | Wendy's | 19 | |
| Jones New York | 7 | Westin | 1 | |
| Juicy Couture | 1 | Wet Seal | 1 | |
| Justice | 1 | Whole Foods Market | 2 | |
| KFC | 24 | World Gym | 1 | |
| Kmart | 7 | YMCA | 7 | |
Strongest AM radio stations in Philadelphia:
- WPEN (950 AM; 50 kW; PHILADELPHIA, PA; Owner: GREATER PHILADELPHIA RADIO, INC.)
- WNWR (1540 AM; 50 kW; PHILADELPHIA, PA)
- WPHT (1210 AM; 50 kW; PHILADELPHIA, PA; Owner: INFINITY BROADCASTING OPERATIONS, INC.)
- KYW (1060 AM; 50 kW; PHILADELPHIA, PA; Owner: INFINITY BROADCASTING OPERATIONS, INC.)
- WZZD (990 AM; 50 kW; PHILADELPHIA, PA; Owner: PENNSYLVANIA MEDIA ASSOCIATES, INC.)
- WDAS (1480 AM; 5 kW; PHILADELPHIA, PA; Owner: AMFM RADIO LICENSES, L.L.C.)
- WVCH (740 AM; 50 kW; CHESTER, PA; Owner: WVCH COMMUNICATIONS, INC.)
- WTMR (800 AM; 5 kW; CAMDEN, NJ; Owner: WTMR LICENSE LIMITED PARTNERSHIP)
- WWJZ (640 AM; 50 kW; MOUNT HOLLY, NJ; Owner: ABC, INC.)
- WIP (610 AM; 5 kW; PHILADELPHIA, PA; Owner: INFINITY BROADCASTING CORPORATION OF PHILADELPHIA)
- WFIL (560 AM; 5 kW; PHILADELPHIA, PA; Owner: PENNSYLVANIA MEDIA ASSOCIATES, INC.)
- WEMG (1310 AM; 1 kW; CAMDEN, NJ; Owner: MEGA COMM., OF CAMDEN LIC., L.L.C.)
- WHAT (1340 AM; 1 kW; PHILADELPHIA, PA; Owner: URBAN RADIO OF PENNSYLVANIA, L.L.C.)
Strongest FM radio stations in Philadelphia:
- WMMR (93.3 FM; PHILADELPHIA, PA; Owner: GREATER BOSTON RADIO, INC.)
- WMGK (102.9 FM; PHILADELPHIA, PA; Owner: GREATER PHILADELPHIA RADIO, INC.)
- WOGL (98.1 FM; PHILADELPHIA, PA; Owner: INFINITY BROADCASTING OPERATIONS, INC.)
- WMWX (95.7 FM; PHILADELPHIA, PA; Owner: GREATER PHILADELPHIA RADIO, INC.)
- WBEB (101.1 FM; PHILADELPHIA, PA; Owner: WEAZ-FM RADIO, INC.)
- WRTI (90.1 FM; PHILADELPHIA, PA; Owner: TEMPLE UNIV. OF THE COMMONWEALTH, ET)
- WPHI-FM (103.9 FM; JENKINTOWN, PA; Owner: RADIO ONE LICENSES, LLC)
- WSNI-FM (104.5 FM; PHILADELPHIA, PA; Owner: AMFM RADIO LICENSES, L.L.C.)
- WXTU (92.5 FM; PHILADELPHIA, PA; Owner: WXTU LICENSE LIMITED PARTNERSHIP)
- WHYY-FM (90.9 FM; PHILADELPHIA, PA; Owner: WHYY, INC.)
- WPTP (96.5 FM; PHILADELPHIA, PA; Owner: WDAS LICENSE LIMITED PARTNERSHIP)
- WXPN (88.5 FM; PHILADELPHIA, PA; Owner: TRUSTEES OF THE UNIVERSITY OF PENNA.)
- WDAS-FM (105.3 FM; PHILADELPHIA, PA; Owner: AMFM RADIO LICENSES, L.L.C.)
- WUSL (98.9 FM; PHILADELPHIA, PA; Owner: AMFM RADIO LICENSES, L.L.C.)
- WYSP (94.1 FM; PHILADELPHIA, PA; Owner: INFINITY BROADCASTING OPERATIONS, INC.)
- WJJZ (106.1 FM; PHILADELPHIA, PA; Owner: AMFM RADIO LICENSES, L.L.C.)
- WIOQ (102.1 FM; PHILADELPHIA, PA; Owner: AMFM RADIO LICENSES, L.L.C.)
- W300AD (107.9 FM; PHILADELPHIA, PA; Owner: MERCER COUNTY COMMUNITY COLLEGE)
- WKDN (106.9 FM; CAMDEN, NJ; Owner: FAMILY STATIONS, INC.)
- WPLY (100.3 FM; MEDIA, PA; Owner: RADIO ONE LICENSES, LLC)
TV broadcast stations around Philadelphia:
- WWJT-LP (Channel 7; PHILADELPHIA, PA; Owner: PHILADELPHIA TELEVISION NETWORK, INC)
- KYW-TV (Channel 3; PHILADELPHIA, PA; Owner: CBS BROADCASTING INC.)
- WPSG (Channel 57; PHILADELPHIA, PA; Owner: VIACOM STATIONS GROUP OF PHILADELPHIA INC.)
- WCAU (Channel 10; PHILADELPHIA, PA; Owner: NBC SUBSIDIARY (WCAU-TV), L.P.)
- WPVI-TV (Channel 6; PHILADELPHIA, PA; Owner: ABC, INC.)
- WPHL-TV (Channel 17; PHILADELPHIA, PA; Owner: TRIBUNE TELEVISION COMPANY)
- WYBE (Channel 35; PHILADELPHIA, PA; Owner: INDEPENDENCE PUBLIC MEDIA OF PHILADELPHIA, INC.)
- WPPX (Channel 61; WILMINGTON, DE; Owner: PAXSON PHILADELPHIA LICENSE, INC.)
- WGTW (Channel 48; BURLINGTON, NJ; Owner: BRUNSON COMMUNICATIONS, INC.)
- WHYY-TV (Channel 12; WILMINGTON, DE; Owner: WHYY, INC.)
- WELL-LP (Channel 8; WILLOW GROVE, ETC., PA; Owner: WORD OF GOD FELLOWSHIP, INC.)
- WTXF-TV (Channel 29; PHILADELPHIA, PA; Owner: FOX TV STATIONS OF PHILADELPHIA)
- WFPA-CA (Channel 28; PHILADELPHIA, PA; Owner: WXTV LICENSE PARTNERSHIP, G.P.)
- WPHA-LP (Channel 63; PHILADELPHIA, PA; Owner: COMMERCIAL BROADCASTING CORP.)
- W33BT (Channel 33; CAMDEN, NJ; Owner: MEDIACASTING LLC)
- WUVP (Channel 65; VINELAND, NJ; Owner: UNIVISION PHILADELPHIA LLC)
- WNJS (Channel 23; CAMDEN, NJ; Owner: NEW JERSEY PUBLIC BROADCASTING AUTHORITY)
- WPSJ-LP (Channel 8; HAMMONTON, ETC., NJ; Owner: ENGLE BROADCASTING)
- WMCN-TV (Channel 53; ATLANTIC CITY, NJ; Owner: LENFEST BROADCASTING, LLC)
- WNJT (Channel 52; TRENTON, NJ; Owner: NEW JERSEY PUBLIC BROADCASTING AUTHORITY)
- WTSD-CA (Channel 14; WILMINGTON, DE; Owner: PRIORITY COMMUNICATIONS MINISTRIES, INC.)
- WNJN (Channel 50; MONTCLAIR, NJ; Owner: NEW JERSEY PUBLIC B/CNG AUTHORITY)
- W40AZ (Channel 40; WILMINGTON, DE; Owner: NATIONAL MINORITY T.V., INC.)
- W55BT (Channel 55; TALLEYVILLE, DE; Owner: MEDIACASTING LLC)
Medal of Honor Recipients
Medal of Honor Recipients born in Philadelphia: Andrew J. Weaher, Archibald H., Jr. Rowand, Austin J. Durney, Cecil Clay, Charles H. Clausen, Charles H. Heyl, Charles L. Thomas, Daniel J. Murphy, David M. Buchanan, Edmund Haffee, Edward Barrett, Edward L. Gilligan, Edwin Joseph Hill, Elwood N. Williams, Evan M. Woodward, Forrester L. Taylor, Francis A. Wilson, Francis X. McGraw, Frank Du Moulin, George Deary, George Moore, George N. Galloway, George W. Cutter, George W. Miller, George, Jr. Benjamin, Harry Lewis MacNeal, Henry Brutsche, Henry H. Bingham, Hugh Purvis, Isacc Sapp, J. Henry White, Jacob G. Orth, James A. Stewart, James M. Trout, James S. Casey, John B. Fassett, John Brazell, John C. Hunterson, John E. Clopp, John F. De Swan, John G. Bourke, John Galloway, John H. R. Storey, John H. Shingle, John Hayes, John J. McVelGh, John Johnson, John M. Vanderslice, John W. Comfort, Joseph E. Vantine, Joseph Fisher, Joseph H. Davis, Joseph Mitchell, Lee R. Hartell, Louis Fred Pfeifer, Michael Corcoran, Michael J. Crescenz, Oscar, Jr. Schmidt, Richard Binder, Richard Conner, Richard Hamilton, Richard L. Tea, Robert A. Gray, Robert L. Orr, Robert Smith, Samuel Gross, Thomas Hubbard, Walter Atlee Edwards, William E. Goodman, William G. Taylor, William H. H. Benyaurd, William H. Myers, William H. Paul, William J. Wray, William Jones, William Morris, William R. Fox, William Rees Rush, William Wilson.
- National Bridge Inventory (NBI) Statistics
- 1,227Number of bridges
- 25,561ft / 7,791mTotal length
- $1,156,795,000Total costs
- 32,975,097Total average daily traffic
- 2,105,575Total average daily truck traffic
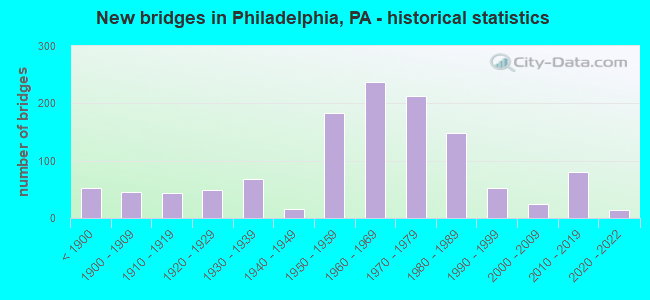
- New bridges - historical statistics
- 53Before 1900
- 451900-1909
- 431910-1919
- 481920-1929
- 681930-1939
- 151940-1949
- 1831950-1959
- 2381960-1969
- 2131970-1979
- 1491980-1989
- 531990-1999
- 252000-2009
- 802010-2019
- 142020-2022
FCC Registered Commercial Land Mobile Towers: 47 (See the full list of FCC Registered Commercial Land Mobile Towers in Philadelphia, PA)
FCC Registered Private Land Mobile Towers: 57 (See the full list of FCC Registered Private Land Mobile Towers)
FCC Registered Broadcast Land Mobile Towers: 688 (See the full list of FCC Registered Broadcast Land Mobile Towers)
FCC Registered Microwave Towers: 781 (See the full list of FCC Registered Microwave Towers in this town)
FCC Registered Paging Towers: 73 (See the full list of FCC Registered Paging Towers)
FCC Registered Maritime Coast & Aviation Ground Towers: 86 (See the full list of FCC Registered Maritime Coast & Aviation Ground Towers)
FCC Registered Amateur Radio Licenses: 1,831 (See the full list of FCC Registered Amateur Radio Licenses in Philadelphia)
FAA Registered Aircraft Manufacturers and Dealers: 2 (See the full list of FAA Registered Manufacturers and Dealers in Philadelphia)
FAA Registered Aircraft: 347 (See the full list of FAA Registered Aircraft)
| Home Mortgage Disclosure Act Aggregated Statistics For Year 2009 (Based on 374 full tracts) | ||||||||||||||
| A) FHA, FSA/RHS & VA Home Purchase Loans | B) Conventional Home Purchase Loans | C) Refinancings | D) Home Improvement Loans | E) Loans on Dwellings For 5+ Families | F) Non-occupant Loans on < 5 Family Dwellings (A B C & D) | G) Loans On Manufactured Home Dwelling (A B C & D) | ||||||||
|---|---|---|---|---|---|---|---|---|---|---|---|---|---|---|
| Number | Average Value | Number | Average Value | Number | Average Value | Number | Average Value | Number | Average Value | Number | Average Value | Number | Average Value | |
| LOANS ORIGINATED | 5,979 | $152,252 | 5,032 | $199,078 | 17,783 | $169,240 | 2,629 | $42,322 | 128 | $1,827,445 | 2,279 | $172,189 | 16 | $98,812 |
| APPLICATIONS APPROVED, NOT ACCEPTED | 292 | $143,723 | 399 | $194,644 | 1,925 | $156,826 | 417 | $34,667 | 11 | $5,206,455 | 220 | $136,109 | 4 | $43,250 |
| APPLICATIONS DENIED | 1,042 | $139,352 | 1,390 | $168,862 | 10,651 | $148,223 | 5,618 | $27,275 | 31 | $4,530,645 | 1,810 | $116,025 | 42 | $65,071 |
| APPLICATIONS WITHDRAWN | 679 | $147,116 | 930 | $200,668 | 6,271 | $155,269 | 486 | $62,126 | 24 | $1,802,542 | 591 | $154,745 | 5 | $128,400 |
| FILES CLOSED FOR INCOMPLETENESS | 187 | $147,171 | 215 | $216,172 | 1,489 | $167,009 | 171 | $70,497 | 0 | $0 | 177 | $159,305 | 1 | $20,000 |
Detailed mortgage data for all 381 tracts in Philadelphia, PA
| Private Mortgage Insurance Companies Aggregated Statistics For Year 2009 (Based on 291 full tracts) | ||||||
| A) Conventional Home Purchase Loans | B) Refinancings | C) Non-occupant Loans on < 5 Family Dwellings (A & B) | ||||
|---|---|---|---|---|---|---|
| Number | Average Value | Number | Average Value | Number | Average Value | |
| LOANS ORIGINATED | 920 | $215,103 | 471 | $223,204 | 8 | $182,375 |
| APPLICATIONS APPROVED, NOT ACCEPTED | 320 | $195,962 | 188 | $212,872 | 28 | $126,500 |
| APPLICATIONS DENIED | 123 | $190,073 | 117 | $232,940 | 2 | $138,000 |
| APPLICATIONS WITHDRAWN | 56 | $219,036 | 57 | $221,684 | 0 | $0 |
| FILES CLOSED FOR INCOMPLETENESS | 34 | $162,882 | 10 | $178,800 | 9 | $111,667 |
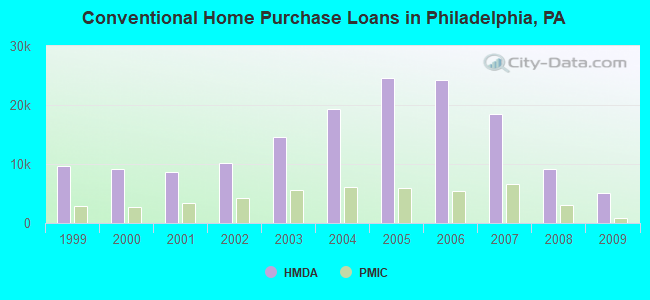
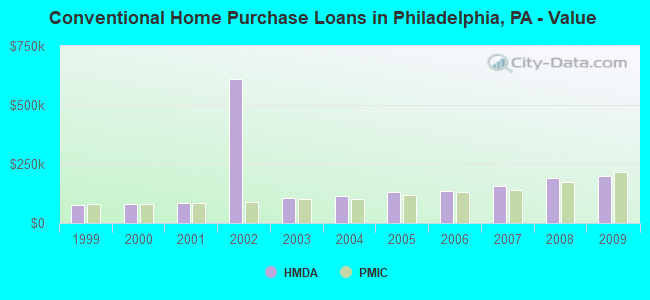
2010 - 2018 National Fire Incident Reporting System (NFIRS) incidents
- Fire incident types reported to NFIRS in Philadelphia, PA
- 23,95945.5%Structure Fires
- 18,53235.2%Outside Fires
- 9,31917.7%Mobile Property/Vehicle Fires
- 8571.6%Other
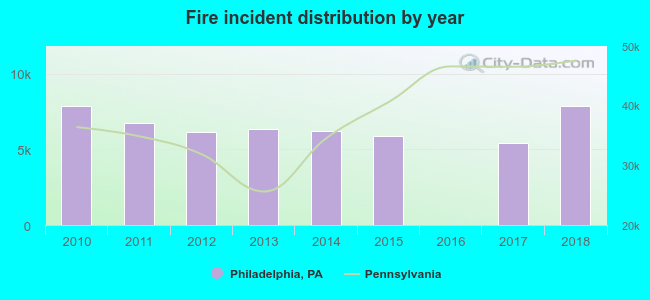 Based on the data from the years 2010 - 2018 the average number of fires per year is 5840. The highest number of reported fires - 7,882 took place in 2010, and the least - 0 in 2016. The data has a declining trend.
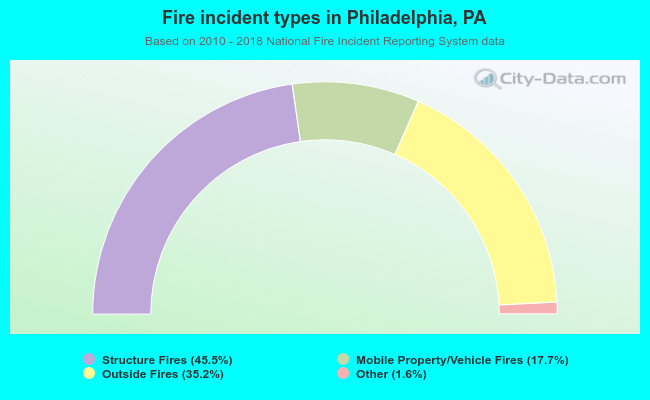 When looking into fire subcategories, the most reports belonged to: Structure Fires (45.5%), and Outside Fires (35.2%).
Fire-safe hotels and motels in Philadelphia, Pennsylvania:
- Renaissance Philadelphia Hotel, 500 Stevens Dr, Philadelphia, Pennsylvania 19113 , Phone: (610) 521-5900, Fax: (610) 521-4362
- Atop The Bellevue, 1415 Chancellor CT, Philadelphia, Pennsylvania 19102 , Phone: (215) 893-1776, Fax: (215) 732-8518
- Holiday Inn Express Philadelphia - Penn's Landing, 100 N Columbus Blvd, Philadelphia, Pennsylvania 19106 , Phone: (215) 627-7900, Fax: (215) 238-0809
- Courtyard By Marriott Philadelphia Airport, 8900 Bartram Ave, Philadelphia, Pennsylvania 19153 , Phone: (215) 365-2200, Fax: (215) 365-6905
- Embassy Suites Philadelphia Airport, 9000 Bartram Ave, Philadelphia, Pennsylvania 19153 , Phone: (215) 365-4500, Fax: (215) 365-3195
- Guest Quarters Suite Hotel, 4101 Is Ave, Philadelphia, Pennsylvania 19153 , Phone: (215) 365-6600, Fax: (215) 365-6035
- Wyndham Philadelphia Historic District Hall, 400 Arch St, Philadelphia, Pennsylvania 19106 , Phone: (215) 923-8660, Fax: (215) 829-1796
- Korman Suites Hotel, 2001 Hamilton St, Philadelphia, Pennsylvania 19130 , Phone: (215) 569-7000
- 54 other hotels and motels
| Most common first names in Philadelphia, PA among deceased individuals | ||
| Name | Count | Lived (average) |
|---|---|---|
| John | 21,330 | 72.5 years |
| Mary | 19,863 | 79.3 years |
| William | 17,142 | 72.8 years |
| Joseph | 15,934 | 72.7 years |
| James | 13,921 | 70.5 years |
| Anna | 11,849 | 80.5 years |
| Charles | 9,817 | 73.0 years |
| George | 8,608 | 73.3 years |
| Margaret | 8,361 | 78.0 years |
| Helen | 7,813 | 78.2 years |
| Most common last names in Philadelphia, PA among deceased individuals | ||
| Last name | Count | Lived (average) |
|---|---|---|
| Smith | 6,005 | 73.1 years |
| Williams | 5,027 | 71.1 years |
| Johnson | 4,865 | 71.6 years |
| Brown | 4,652 | 72.9 years |
| Jones | 4,144 | 71.7 years |
| Miller | 2,825 | 74.7 years |
| Davis | 2,819 | 71.8 years |
| Jackson | 2,438 | 71.8 years |
| Robinson | 2,261 | 72.2 years |
| Wilson | 2,230 | 72.8 years |
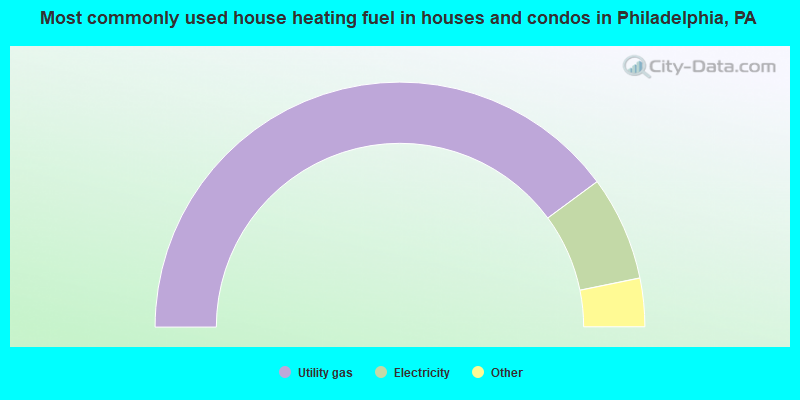
- 79.8%Utility gas
- 13.8%Electricity
- 3.9%Fuel oil, kerosene, etc.
- 1.6%Bottled, tank, or LP gas
- 0.4%Other fuel
- 0.3%No fuel used
- 0.2%Wood
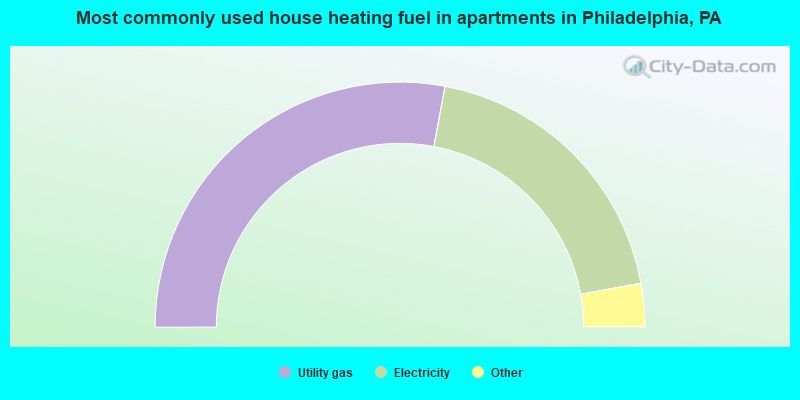
- 55.9%Utility gas
- 38.4%Electricity
- 2.1%Bottled, tank, or LP gas
- 1.6%Fuel oil, kerosene, etc.
- 1.3%No fuel used
- 0.7%Other fuel
Philadelphia compared to Pennsylvania state average:
- Unemployed percentage below state average.
- Black race population percentage significantly above state average.
- Hispanic race population percentage above state average.
- Median age below state average.
- Foreign-born population percentage above state average.
- Renting percentage above state average.
Philadelphia, PA compared to other similar cities:
Philadelphia on our top lists:
- #4 on the list of "Top 101 cities with the highest number of arson incidents per 100,000 residents, excludes tourist destinations and others with a lot of outsiders visiting based on city industries data (population 50,000+)"
- #4 on the list of "Top 101 cities with the highest average snowfall in a year (population 50,000+)"
- #5 on the list of "Top 101 cities with the highest number of police officers per 1000 residents (population 50,000+)"
- #7 on the list of "Top 101 cities with the smallest percentage of one, detached housing units in structures (20,000+ housing units)"
- #8 on the list of "Top 100 biggest cities"
- #8 on the list of "Top 101 biggest cities in 2013"
- #10 on the list of "Top 101 cities with the least cars per house, population 50,000+"
- #21 on the list of "Top 101 cities with the highest number of robberies per 100,000 residents, excludes tourist destinations and others with a lot of outsiders visiting based on city industries data (population 50,000+)"
- #22 on the list of "Top 101 cities with the largest percentage of high school students in private schools (3,000+ students)"
- #22 on the list of "Top 101 larger cities with the highest increase in house/condo value from 2000 (population 50,000+)"
- #23 on the list of "Top 101 cities with the highest number of murders per 100,000 residents, excludes tourist destinations and others with a lot of outsiders visiting based on city industries data (population 50,000+)"
- #23 on the list of "Top 101 cities with the most people taking a bus, a trolley bus, a streetcar, or a trolley car to work (population 5,000+)"
- #25 on the list of "Top 101 cities with largest percentage of males in industries: health care and social assistance (population 50,000+)"
- #28 on the list of "Top 101 cities with the largest percentage of people in military hospitals or wards for chronically ill (population 1,000+)"
- #36 on the list of "Top 101 cities with the largest percentage of elementary and middle school students in private schools (5,000+ students)"
- #36 on the list of "Top 100 cities with oldest houses (pop. 50,000+)"
- #39 on the list of "Top 101 cities with largest percentage of females in industries: health care and social assistance (population 50,000+)"
- #41 on the list of "Top 100 cities with old houses but young residents (pop. 50,000+)"
- #45 on the list of "Top 101 cities with the lowest maximum monthly sunshine amount (population 50,000+)"
- #45 on the list of "Top 101 cities with the most people taking subway or elevated to work (population 5,000+)"
- #3 (19106) on the list of "Top 101 zip codes with the most museums in 2005"
- #3 (19133) on the list of "Top 101 zip codes with the smallest percentage of taxpayers reporting taxable interest in 2012 (pop 5,000+)"
- #5 (19148) on the list of "Top 101 zip codes with the largest percentage of Irish first ancestries (pop 5,000+)"
- #12 (19103) on the list of "Top 101 zip codes with the most big companies in 2005 (at least 1000 employees)"
- #12 (19140) on the list of "Top 101 zip codes with the smallest percentage of taxpayers reporting net capital gain/loss in 2012 (pop 5,000+)"
- #14 (19103) on the list of "Top 101 zip codes with the most medium-big companies in 2005 (at least 100 employees)"
- #15 (19103) on the list of "Top 101 zip codes with the most offices of lawyers in 2005"
- #21 (19116) on the list of "Top 101 zip codes with the largest percentage of Ukrainian first ancestries"
- #24 (19133) on the list of "Top 101 zip codes with the lowest 2012 average Adjusted Gross Income (AGI) for individuals (pop 5,000+)"
- #25 (19103) on the list of "Top 101 zip codes with the most finance and insurance companies in 2005"
- #28 (19142) on the list of "Top 101 zip codes with the largest percentage of Subsaharan African first ancestries"
- #32 (19150) on the list of "Top 101 zip codes with the largest percentage of West Indian first ancestries"
- #40 (19134) on the list of "Top 101 zip codes with the most alcohol drinking places in 2005"
- #46 (19107) on the list of "Top 101 zip codes with the most full service restaurants in 2005"
- #48 (19133) on the list of "Top 101 zip codes with the lowest average reported salary/wage in 2012 (pop 5,000+)"
- #67 (19116) on the list of "Top 101 zip codes with the largest percentage of Russian first ancestries (pop 5,000+)"
- #68 (19133) on the list of "Top 101 zip codes with the lowest 2012 average taxable interest for individuals (pop 5,000+)"
- #69 (19103) on the list of "Top 101 zip codes with the most beauty salons in 2005"
- #74 (19103) on the list of "Top 101 zip codes with the most Internet business establishments in 2005"
- #81 (19137) on the list of "Top 101 zip codes with the largest percentage of Polish first ancestries (pop 5,000+)"
- #2 on the list of "Top 101 counties with the highest lead air pollution readings in 2012 (µg/m3)"
- #4 on the list of "Top 101 counties with the most Mainline Protestant congregations"
- #6 on the list of "Top 101 counties with the most Catholic congregations"
- #8 on the list of "Top 101 counties with highest percentage of residents voting for Obama (Democrat) in the 2012 Presidential Election (pop. 50,000+)"
- #8 on the list of "Top 101 counties with the most Black Protestant congregations (pop. 50,000+)"
State forum archive:
- Pennsylvania Pages: 2 3 4 5 6 7 8 9 10 11 12 13 14 15 16 17 18 19 20 21 22 23 24 25 26 27 28 29 30 31 32 33 34 35
- Harrisburg area Pages: 2 3 4 5 6 7
- Lehigh Valley Pages: 2 3 4 5 6 7 8 9 10 11 12 13 14 15
- Northeastern Pennsylvania Pages: 2 3 4 5 6 7 8 9 10 11 12 13 14 15 16 17 18 19 20 21 22 23 24 25 26 27 28 29 30 31 32 33 34 35 36 37 38 39 40 41 42 43
- Philadelphia Pages: 2 3 4 5 6 7 8 9 10 11 12 13 14 15 16 17 18 19 20 21 22 23 24 25 26 27 28 29 30 31 32 33 34 35 36 37 38 39 40 41 42 43 44 45 46 47 48 49 50 51 52 53 54 55 56 57 58 59 60 61 62
- Pittsburgh Pages: 2 3 4 5 6 7 8 9 10 11 12 13 14 15 16 17 18 19 20 21 22 23 24 25 26 27 28 29 30 31 32 33 34 35 36 37 38 39 40 41 42 43 44 45 46 47 48 49 50 51 52 53 54 55 56 57 58 59 60 61 62 63 64 65 66 67 68 69 70 71 72 73 74 75 76 77 78 79 80 81 82 83 84 85 86 87 88 89 90 91 92

|
|
Total of 5477 patent applications in 2008-2024.


