Estimated zip code population in 2022: 22,901
Zip code population in 2010: 23,378
Zip code population in 2000: 25,274
Houses and condos: 10,686
Renter-occupied apartments: 1,930
% of renters here:
19%State:
31%
March 2022 cost of living index in zip code 19150: 104.1
(near average, U.S. average is 100)
Land area: 1.5
sq. mi.
Water area: 0.0
sq. mi.
Population density: 15,190 people per square mile (very high).
OSM Map
General Map
Google Map
MSN Map
OSM Map
General Map
Google Map
MSN Map
OSM Map
General Map
Google Map
MSN Map
OSM Map
General Map
Google Map
MSN Map
Please wait while loading the map...
Real estate property taxes paid for housing units in 2022:
This zip code:
0.8% ($1,876)Pennsylvania:
1.3% ($3,094)
Median real estate property taxes paid for housing units with mortgages in 2022: $1,931 (0.8%)
Median real estate property taxes paid for housing units with no mortgage in 2022: $1,804 (0.9%)
Business Search - 14 Million verified businesses
Males: 10,606 Females: 12,295
For population 25 years and over in 19150:
High school or higher: 92.4%Bachelor's degree or higher: 31.2%Graduate or professional degree: 15.2%Unemployed: 9.0%Mean travel time to work (commute): 37.8 minutes
For population 15 years and over in 19150:
Never married: 46.5%Now married: 32.0%Separated: 2.0%Widowed: 9.1%Divorced: 10.5%
Zip code 19150 compared to state average:
Unemployed percentage above state average. Black race population percentage significantly above state average. Hispanic race population percentage below state average. Renting percentage below state average. Length of stay since moving in significantly above state average. 20,893 91.2% Black 729 3.2% Hispanic or Latino 605 2.6% White 524 2.3% Two or more races 102 0.4% Some other race 34 0.1% Asian 9 0.04% Native Hawaiian and Other
Data:
Median household income ($)
Median household income (% change since 2000)
Household income diversity
Ratio of average income to average house value (%)
Ratio of average income to average rent
Median household income ($) - White
Median household income ($) - Black or African American
Median household income ($) - Asian
Median household income ($) - Hispanic or Latino
Median household income ($) - American Indian and Alaska Native
Median household income ($) - Multirace
Median household income ($) - Other Race
Median household income for houses/condos with a mortgage ($)
Median household income for apartments without a mortgage ($)
Races - White alone (%)
Races - White alone (% change since 2000)
Races - Black alone (%)
Races - Black alone (% change since 2000)
Races - American Indian alone (%)
Races - American Indian alone (% change since 2000)
Races - Asian alone (%)
Races - Asian alone (% change since 2000)
Races - Hispanic (%)
Races - Hispanic (% change since 2000)
Races - Native Hawaiian and Other Pacific Islander alone (%)
Races - Native Hawaiian and Other Pacific Islander alone (% change since 2000)
Races - Two or more races (%)
Races - Two or more races (% change since 2000)
Races - Other race alone (%)
Races - Other race alone (% change since 2000)
Racial diversity
Unemployment (%)
Unemployment (% change since 2000)
Unemployment (%) - White
Unemployment (%) - Black or African American
Unemployment (%) - Asian
Unemployment (%) - Hispanic or Latino
Unemployment (%) - American Indian and Alaska Native
Unemployment (%) - Multirace
Unemployment (%) - Other Race
Population density (people per square mile)
Population - Males (%)
Population - Females (%)
Population - Males (%) - White
Population - Males (%) - Black or African American
Population - Males (%) - Asian
Population - Males (%) - Hispanic or Latino
Population - Males (%) - American Indian and Alaska Native
Population - Males (%) - Multirace
Population - Males (%) - Other Race
Population - Females (%) - White
Population - Females (%) - Black or African American
Population - Females (%) - Asian
Population - Females (%) - Hispanic or Latino
Population - Females (%) - American Indian and Alaska Native
Population - Females (%) - Multirace
Population - Females (%) - Other Race
Coronavirus confirmed cases (Apr 26, 2024)
Deaths caused by coronavirus (Apr 26, 2024)
Coronavirus confirmed cases (per 100k population) (Apr 26, 2024)
Deaths caused by coronavirus (per 100k population) (Apr 26, 2024)
Daily increase in number of cases (Apr 26, 2024)
Weekly increase in number of cases (Apr 26, 2024)
Cases doubled (in days) (Apr 26, 2024)
Hospitalized patients (Apr 18, 2022)
Negative test results (Apr 18, 2022)
Total test results (Apr 18, 2022)
COVID Vaccine doses distributed (per 100k population) (Sep 19, 2023)
COVID Vaccine doses administered (per 100k population) (Sep 19, 2023)
COVID Vaccine doses distributed (Sep 19, 2023)
COVID Vaccine doses administered (Sep 19, 2023)
Likely homosexual households (%)
Likely homosexual households (% change since 2000)
Likely homosexual households - Lesbian couples (%)
Likely homosexual households - Lesbian couples (% change since 2000)
Likely homosexual households - Gay men (%)
Likely homosexual households - Gay men (% change since 2000)
Cost of living index
Median gross rent ($)
Median contract rent ($)
Median monthly housing costs ($)
Median house or condo value ($)
Median house or condo value ($ change since 2000)
Mean house or condo value by units in structure - 1, detached ($)
Mean house or condo value by units in structure - 1, attached ($)
Mean house or condo value by units in structure - 2 ($)
Mean house or condo value by units in structure by units in structure - 3 or 4 ($)
Mean house or condo value by units in structure - 5 or more ($)
Mean house or condo value by units in structure - Boat, RV, van, etc. ($)
Mean house or condo value by units in structure - Mobile home ($)
Median house or condo value ($) - White
Median house or condo value ($) - Black or African American
Median house or condo value ($) - Asian
Median house or condo value ($) - Hispanic or Latino
Median house or condo value ($) - American Indian and Alaska Native
Median house or condo value ($) - Multirace
Median house or condo value ($) - Other Race
Median resident age
Resident age diversity
Median resident age - Males
Median resident age - Females
Median resident age - White
Median resident age - Black or African American
Median resident age - Asian
Median resident age - Hispanic or Latino
Median resident age - American Indian and Alaska Native
Median resident age - Multirace
Median resident age - Other Race
Median resident age - Males - White
Median resident age - Males - Black or African American
Median resident age - Males - Asian
Median resident age - Males - Hispanic or Latino
Median resident age - Males - American Indian and Alaska Native
Median resident age - Males - Multirace
Median resident age - Males - Other Race
Median resident age - Females - White
Median resident age - Females - Black or African American
Median resident age - Females - Asian
Median resident age - Females - Hispanic or Latino
Median resident age - Females - American Indian and Alaska Native
Median resident age - Females - Multirace
Median resident age - Females - Other Race
Commute - mean travel time to work (minutes)
Travel time to work - Less than 5 minutes (%)
Travel time to work - Less than 5 minutes (% change since 2000)
Travel time to work - 5 to 9 minutes (%)
Travel time to work - 5 to 9 minutes (% change since 2000)
Travel time to work - 10 to 19 minutes (%)
Travel time to work - 10 to 19 minutes (% change since 2000)
Travel time to work - 20 to 29 minutes (%)
Travel time to work - 20 to 29 minutes (% change since 2000)
Travel time to work - 30 to 39 minutes (%)
Travel time to work - 30 to 39 minutes (% change since 2000)
Travel time to work - 40 to 59 minutes (%)
Travel time to work - 40 to 59 minutes (% change since 2000)
Travel time to work - 60 to 89 minutes (%)
Travel time to work - 60 to 89 minutes (% change since 2000)
Travel time to work - 90 or more minutes (%)
Travel time to work - 90 or more minutes (% change since 2000)
Marital status - Never married (%)
Marital status - Now married (%)
Marital status - Separated (%)
Marital status - Widowed (%)
Marital status - Divorced (%)
Median family income ($)
Median family income (% change since 2000)
Median non-family income ($)
Median non-family income (% change since 2000)
Median per capita income ($)
Median per capita income (% change since 2000)
Median family income ($) - White
Median family income ($) - Black or African American
Median family income ($) - Asian
Median family income ($) - Hispanic or Latino
Median family income ($) - American Indian and Alaska Native
Median family income ($) - Multirace
Median family income ($) - Other Race
Median year house/condo built
Median year apartment built
Year house built - Built 2005 or later (%)
Year house built - Built 2000 to 2004 (%)
Year house built - Built 1990 to 1999 (%)
Year house built - Built 1980 to 1989 (%)
Year house built - Built 1970 to 1979 (%)
Year house built - Built 1960 to 1969 (%)
Year house built - Built 1950 to 1959 (%)
Year house built - Built 1940 to 1949 (%)
Year house built - Built 1939 or earlier (%)
Average household size
Household density (households per square mile)
Average household size - White
Average household size - Black or African American
Average household size - Asian
Average household size - Hispanic or Latino
Average household size - American Indian and Alaska Native
Average household size - Multirace
Average household size - Other Race
Occupied housing units (%)
Vacant housing units (%)
Owner occupied housing units (%)
Renter occupied housing units (%)
Vacancy status - For rent (%)
Vacancy status - For sale only (%)
Vacancy status - Rented or sold, not occupied (%)
Vacancy status - For seasonal, recreational, or occasional use (%)
Vacancy status - For migrant workers (%)
Vacancy status - Other vacant (%)
Residents with income below the poverty level (%)
Residents with income below 50% of the poverty level (%)
Children below poverty level (%)
Poor families by family type - Married-couple family (%)
Poor families by family type - Male, no wife present (%)
Poor families by family type - Female, no husband present (%)
Poverty status for native-born residents (%)
Poverty status for foreign-born residents (%)
Poverty among high school graduates not in families (%)
Poverty among people who did not graduate high school not in families (%)
Residents with income below the poverty level (%) - White
Residents with income below the poverty level (%) - Black or African American
Residents with income below the poverty level (%) - Asian
Residents with income below the poverty level (%) - Hispanic or Latino
Residents with income below the poverty level (%) - American Indian and Alaska Native
Residents with income below the poverty level (%) - Multirace
Residents with income below the poverty level (%) - Other Race
Air pollution - Air Quality Index (AQI)
Air pollution - CO
Air pollution - NO2
Air pollution - SO2
Air pollution - Ozone
Air pollution - PM10
Air pollution - PM25
Air pollution - Pb
Crime - Murders per 100,000 population
Crime - Rapes per 100,000 population
Crime - Robberies per 100,000 population
Crime - Assaults per 100,000 population
Crime - Burglaries per 100,000 population
Crime - Thefts per 100,000 population
Crime - Auto thefts per 100,000 population
Crime - Arson per 100,000 population
Crime - City-data.com crime index
Crime - Violent crime index
Crime - Property crime index
Crime - Murders per 100,000 population (5 year average)
Crime - Rapes per 100,000 population (5 year average)
Crime - Robberies per 100,000 population (5 year average)
Crime - Assaults per 100,000 population (5 year average)
Crime - Burglaries per 100,000 population (5 year average)
Crime - Thefts per 100,000 population (5 year average)
Crime - Auto thefts per 100,000 population (5 year average)
Crime - Arson per 100,000 population (5 year average)
Crime - City-data.com crime index (5 year average)
Crime - Violent crime index (5 year average)
Crime - Property crime index (5 year average)
1996 Presidential Elections Results (%) - Democratic Party (Clinton)
1996 Presidential Elections Results (%) - Republican Party (Dole)
1996 Presidential Elections Results (%) - Other
2000 Presidential Elections Results (%) - Democratic Party (Gore)
2000 Presidential Elections Results (%) - Republican Party (Bush)
2000 Presidential Elections Results (%) - Other
2004 Presidential Elections Results (%) - Democratic Party (Kerry)
2004 Presidential Elections Results (%) - Republican Party (Bush)
2004 Presidential Elections Results (%) - Other
2008 Presidential Elections Results (%) - Democratic Party (Obama)
2008 Presidential Elections Results (%) - Republican Party (McCain)
2008 Presidential Elections Results (%) - Other
2012 Presidential Elections Results (%) - Democratic Party (Obama)
2012 Presidential Elections Results (%) - Republican Party (Romney)
2012 Presidential Elections Results (%) - Other
2016 Presidential Elections Results (%) - Democratic Party (Clinton)
2016 Presidential Elections Results (%) - Republican Party (Trump)
2016 Presidential Elections Results (%) - Other
2020 Presidential Elections Results (%) - Democratic Party (Biden)
2020 Presidential Elections Results (%) - Republican Party (Trump)
2020 Presidential Elections Results (%) - Other
Ancestries Reported - Arab (%)
Ancestries Reported - Czech (%)
Ancestries Reported - Danish (%)
Ancestries Reported - Dutch (%)
Ancestries Reported - English (%)
Ancestries Reported - French (%)
Ancestries Reported - French Canadian (%)
Ancestries Reported - German (%)
Ancestries Reported - Greek (%)
Ancestries Reported - Hungarian (%)
Ancestries Reported - Irish (%)
Ancestries Reported - Italian (%)
Ancestries Reported - Lithuanian (%)
Ancestries Reported - Norwegian (%)
Ancestries Reported - Polish (%)
Ancestries Reported - Portuguese (%)
Ancestries Reported - Russian (%)
Ancestries Reported - Scotch-Irish (%)
Ancestries Reported - Scottish (%)
Ancestries Reported - Slovak (%)
Ancestries Reported - Subsaharan African (%)
Ancestries Reported - Swedish (%)
Ancestries Reported - Swiss (%)
Ancestries Reported - Ukrainian (%)
Ancestries Reported - United States (%)
Ancestries Reported - Welsh (%)
Ancestries Reported - West Indian (%)
Ancestries Reported - Other (%)
Educational Attainment - No schooling completed (%)
Educational Attainment - Less than high school (%)
Educational Attainment - High school or equivalent (%)
Educational Attainment - Less than 1 year of college (%)
Educational Attainment - 1 or more years of college (%)
Educational Attainment - Associate degree (%)
Educational Attainment - Bachelor's degree (%)
Educational Attainment - Master's degree (%)
Educational Attainment - Professional school degree (%)
Educational Attainment - Doctorate degree (%)
School Enrollment - Nursery, preschool (%)
School Enrollment - Kindergarten (%)
School Enrollment - Grade 1 to 4 (%)
School Enrollment - Grade 5 to 8 (%)
School Enrollment - Grade 9 to 12 (%)
School Enrollment - College undergrad (%)
School Enrollment - Graduate or professional (%)
School Enrollment - Not enrolled in school (%)
School enrollment - Public schools (%)
School enrollment - Private schools (%)
School enrollment - Not enrolled (%)
Median number of rooms in houses and condos
Median number of rooms in apartments
Housing units lacking complete plumbing facilities (%)
Housing units lacking complete kitchen facilities (%)
Density of houses
Urban houses (%)
Rural houses (%)
Households with people 60 years and over (%)
Households with people 65 years and over (%)
Households with people 75 years and over (%)
Households with one or more nonrelatives (%)
Households with no nonrelatives (%)
Population in households (%)
Family households (%)
Nonfamily households (%)
Population in families (%)
Family households with own children (%)
Median number of bedrooms in owner occupied houses
Mean number of bedrooms in owner occupied houses
Median number of bedrooms in renter occupied houses
Mean number of bedrooms in renter occupied houses
Median number of vehichles in owner occupied houses
Mean number of vehichles in owner occupied houses
Median number of vehichles in renter occupied houses
Mean number of vehichles in renter occupied houses
Mortgage status - with mortgage (%)
Mortgage status - with second mortgage (%)
Mortgage status - with home equity loan (%)
Mortgage status - with both second mortgage and home equity loan (%)
Mortgage status - without a mortgage (%)
Average family size
Average family size - White
Average family size - Black or African American
Average family size - Asian
Average family size - Hispanic or Latino
Average family size - American Indian and Alaska Native
Average family size - Multirace
Average family size - Other Race
Geographical mobility - Same house 1 year ago (%)
Geographical mobility - Moved within same county (%)
Geographical mobility - Moved from different county within same state (%)
Geographical mobility - Moved from different state (%)
Geographical mobility - Moved from abroad (%)
Place of birth - Born in state of residence (%)
Place of birth - Born in other state (%)
Place of birth - Native, outside of US (%)
Place of birth - Foreign born (%)
Housing units in structures - 1, detached (%)
Housing units in structures - 1, attached (%)
Housing units in structures - 2 (%)
Housing units in structures - 3 or 4 (%)
Housing units in structures - 5 to 9 (%)
Housing units in structures - 10 to 19 (%)
Housing units in structures - 20 to 49 (%)
Housing units in structures - 50 or more (%)
Housing units in structures - Mobile home (%)
Housing units in structures - Boat, RV, van, etc. (%)
House/condo owner moved in on average (years ago)
Renter moved in on average (years ago)
Year householder moved into unit - Moved in 1999 to March 2000 (%)
Year householder moved into unit - Moved in 1995 to 1998 (%)
Year householder moved into unit - Moved in 1990 to 1994 (%)
Year householder moved into unit - Moved in 1980 to 1989 (%)
Year householder moved into unit - Moved in 1970 to 1979 (%)
Year householder moved into unit - Moved in 1969 or earlier (%)
Means of transportation to work - Drove car alone (%)
Means of transportation to work - Carpooled (%)
Means of transportation to work - Public transportation (%)
Means of transportation to work - Bus or trolley bus (%)
Means of transportation to work - Streetcar or trolley car (%)
Means of transportation to work - Subway or elevated (%)
Means of transportation to work - Railroad (%)
Means of transportation to work - Ferryboat (%)
Means of transportation to work - Taxicab (%)
Means of transportation to work - Motorcycle (%)
Means of transportation to work - Bicycle (%)
Means of transportation to work - Walked (%)
Means of transportation to work - Other means (%)
Working at home (%)
Industry diversity
Most Common Industries - Agriculture, forestry, fishing and hunting, and mining (%)
Most Common Industries - Agriculture, forestry, fishing and hunting (%)
Most Common Industries - Mining, quarrying, and oil and gas extraction (%)
Most Common Industries - Construction (%)
Most Common Industries - Manufacturing (%)
Most Common Industries - Wholesale trade (%)
Most Common Industries - Retail trade (%)
Most Common Industries - Transportation and warehousing, and utilities (%)
Most Common Industries - Transportation and warehousing (%)
Most Common Industries - Utilities (%)
Most Common Industries - Information (%)
Most Common Industries - Finance and insurance, and real estate and rental and leasing (%)
Most Common Industries - Finance and insurance (%)
Most Common Industries - Real estate and rental and leasing (%)
Most Common Industries - Professional, scientific, and management, and administrative and waste management services (%)
Most Common Industries - Professional, scientific, and technical services (%)
Most Common Industries - Management of companies and enterprises (%)
Most Common Industries - Administrative and support and waste management services (%)
Most Common Industries - Educational services, and health care and social assistance (%)
Most Common Industries - Educational services (%)
Most Common Industries - Health care and social assistance (%)
Most Common Industries - Arts, entertainment, and recreation, and accommodation and food services (%)
Most Common Industries - Arts, entertainment, and recreation (%)
Most Common Industries - Accommodation and food services (%)
Most Common Industries - Other services, except public administration (%)
Most Common Industries - Public administration (%)
Occupation diversity
Most Common Occupations - Management, business, science, and arts occupations (%)
Most Common Occupations - Management, business, and financial occupations (%)
Most Common Occupations - Management occupations (%)
Most Common Occupations - Business and financial operations occupations (%)
Most Common Occupations - Computer, engineering, and science occupations (%)
Most Common Occupations - Computer and mathematical occupations (%)
Most Common Occupations - Architecture and engineering occupations (%)
Most Common Occupations - Life, physical, and social science occupations (%)
Most Common Occupations - Education, legal, community service, arts, and media occupations (%)
Most Common Occupations - Community and social service occupations (%)
Most Common Occupations - Legal occupations (%)
Most Common Occupations - Education, training, and library occupations (%)
Most Common Occupations - Arts, design, entertainment, sports, and media occupations (%)
Most Common Occupations - Healthcare practitioners and technical occupations (%)
Most Common Occupations - Health diagnosing and treating practitioners and other technical occupations (%)
Most Common Occupations - Health technologists and technicians (%)
Most Common Occupations - Service occupations (%)
Most Common Occupations - Healthcare support occupations (%)
Most Common Occupations - Protective service occupations (%)
Most Common Occupations - Fire fighting and prevention, and other protective service workers including supervisors (%)
Most Common Occupations - Law enforcement workers including supervisors (%)
Most Common Occupations - Food preparation and serving related occupations (%)
Most Common Occupations - Building and grounds cleaning and maintenance occupations (%)
Most Common Occupations - Personal care and service occupations (%)
Most Common Occupations - Sales and office occupations (%)
Most Common Occupations - Sales and related occupations (%)
Most Common Occupations - Office and administrative support occupations (%)
Most Common Occupations - Natural resources, construction, and maintenance occupations (%)
Most Common Occupations - Farming, fishing, and forestry occupations (%)
Most Common Occupations - Construction and extraction occupations (%)
Most Common Occupations - Installation, maintenance, and repair occupations (%)
Most Common Occupations - Production, transportation, and material moving occupations (%)
Most Common Occupations - Production occupations (%)
Most Common Occupations - Transportation occupations (%)
Most Common Occupations - Material moving occupations (%)
People in Group quarters - Institutionalized population (%)
People in Group quarters - Correctional institutions (%)
People in Group quarters - Federal prisons and detention centers (%)
People in Group quarters - Halfway houses (%)
People in Group quarters - Local jails and other confinement facilities (including police lockups) (%)
People in Group quarters - Military disciplinary barracks (%)
People in Group quarters - State prisons (%)
People in Group quarters - Other types of correctional institutions (%)
People in Group quarters - Nursing homes (%)
People in Group quarters - Hospitals/wards, hospices, and schools for the handicapped (%)
People in Group quarters - Hospitals/wards and hospices for chronically ill (%)
People in Group quarters - Hospices or homes for chronically ill (%)
People in Group quarters - Military hospitals or wards for chronically ill (%)
People in Group quarters - Other hospitals or wards for chronically ill (%)
People in Group quarters - Hospitals or wards for drug/alcohol abuse (%)
People in Group quarters - Mental (Psychiatric) hospitals or wards (%)
People in Group quarters - Schools, hospitals, or wards for the mentally retarded (%)
People in Group quarters - Schools, hospitals, or wards for the physically handicapped (%)
People in Group quarters - Institutions for the deaf (%)
People in Group quarters - Institutions for the blind (%)
People in Group quarters - Orthopedic wards and institutions for the physically handicapped (%)
People in Group quarters - Wards in general hospitals for patients who have no usual home elsewhere (%)
People in Group quarters - Wards in military hospitals for patients who have no usual home elsewhere (%)
People in Group quarters - Juvenile institutions (%)
People in Group quarters - Long-term care (%)
People in Group quarters - Homes for abused, dependent, and neglected children (%)
People in Group quarters - Residential treatment centers for emotionally disturbed children (%)
People in Group quarters - Training schools for juvenile delinquents (%)
People in Group quarters - Short-term care, detention or diagnostic centers for delinquent children (%)
People in Group quarters - Type of juvenile institution unknown (%)
People in Group quarters - Noninstitutionalized population (%)
People in Group quarters - College dormitories (includes college quarters off campus) (%)
People in Group quarters - Military quarters (%)
People in Group quarters - On base (%)
People in Group quarters - Barracks, unaccompanied personnel housing (UPH), (Enlisted/Officer), ;and similar group living quarters for military personnel (%)
People in Group quarters - Transient quarters for temporary residents (%)
People in Group quarters - Military ships (%)
People in Group quarters - Group homes (%)
People in Group quarters - Homes or halfway houses for drug/alcohol abuse (%)
People in Group quarters - Homes for the mentally ill (%)
People in Group quarters - Homes for the mentally retarded (%)
People in Group quarters - Homes for the physically handicapped (%)
People in Group quarters - Other group homes (%)
People in Group quarters - Religious group quarters (%)
People in Group quarters - Dormitories (%)
People in Group quarters - Agriculture workers' dormitories on farms (%)
People in Group quarters - Job Corps and vocational training facilities (%)
People in Group quarters - Other workers' dormitories (%)
People in Group quarters - Crews of maritime vessels (%)
People in Group quarters - Other nonhousehold living situations (%)
People in Group quarters - Other noninstitutional group quarters (%)
Residents speaking English at home (%)
Residents speaking English at home - Born in the United States (%)
Residents speaking English at home - Native, born elsewhere (%)
Residents speaking English at home - Foreign born (%)
Residents speaking Spanish at home (%)
Residents speaking Spanish at home - Born in the United States (%)
Residents speaking Spanish at home - Native, born elsewhere (%)
Residents speaking Spanish at home - Foreign born (%)
Residents speaking other language at home (%)
Residents speaking other language at home - Born in the United States (%)
Residents speaking other language at home - Native, born elsewhere (%)
Residents speaking other language at home - Foreign born (%)
Class of Workers - Employee of private company (%)
Class of Workers - Self-employed in own incorporated business (%)
Class of Workers - Private not-for-profit wage and salary workers (%)
Class of Workers - Local government workers (%)
Class of Workers - State government workers (%)
Class of Workers - Federal government workers (%)
Class of Workers - Self-employed workers in own not incorporated business and Unpaid family workers (%)
House heating fuel used in houses and condos - Utility gas (%)
House heating fuel used in houses and condos - Bottled, tank, or LP gas (%)
House heating fuel used in houses and condos - Electricity (%)
House heating fuel used in houses and condos - Fuel oil, kerosene, etc. (%)
House heating fuel used in houses and condos - Coal or coke (%)
House heating fuel used in houses and condos - Wood (%)
House heating fuel used in houses and condos - Solar energy (%)
House heating fuel used in houses and condos - Other fuel (%)
House heating fuel used in houses and condos - No fuel used (%)
House heating fuel used in apartments - Utility gas (%)
House heating fuel used in apartments - Bottled, tank, or LP gas (%)
House heating fuel used in apartments - Electricity (%)
House heating fuel used in apartments - Fuel oil, kerosene, etc. (%)
House heating fuel used in apartments - Coal or coke (%)
House heating fuel used in apartments - Wood (%)
House heating fuel used in apartments - Solar energy (%)
House heating fuel used in apartments - Other fuel (%)
House heating fuel used in apartments - No fuel used (%)
Armed forces status - In Armed Forces (%)
Armed forces status - Civilian (%)
Armed forces status - Civilian - Veteran (%)
Armed forces status - Civilian - Nonveteran (%)
Fatal accidents locations in years 2005-2021
Fatal accidents locations in 2005
Fatal accidents locations in 2006
Fatal accidents locations in 2007
Fatal accidents locations in 2008
Fatal accidents locations in 2009
Fatal accidents locations in 2010
Fatal accidents locations in 2011
Fatal accidents locations in 2012
Fatal accidents locations in 2013
Fatal accidents locations in 2014
Fatal accidents locations in 2015
Fatal accidents locations in 2016
Fatal accidents locations in 2017
Fatal accidents locations in 2018
Fatal accidents locations in 2019
Fatal accidents locations in 2020
Fatal accidents locations in 2021
Alcohol use - People drinking some alcohol every month (%)
Alcohol use - People not drinking at all (%)
Alcohol use - Average days/month drinking alcohol
Alcohol use - Average drinks/week
Alcohol use - Average days/year people drink much
Audiometry - Average condition of hearing (%)
Audiometry - People that can hear a whisper from across a quiet room (%)
Audiometry - People that can hear normal voice from across a quiet room (%)
Audiometry - Ears ringing, roaring, buzzing (%)
Audiometry - Had a job exposure to loud noise (%)
Audiometry - Had off-work exposure to loud noise (%)
Blood Pressure & Cholesterol - Has high blood pressure (%)
Blood Pressure & Cholesterol - Checking blood pressure at home (%)
Blood Pressure & Cholesterol - Frequently checking blood cholesterol (%)
Blood Pressure & Cholesterol - Has high cholesterol level (%)
Consumer Behavior - Money monthly spent on food at supermarket/grocery store
Consumer Behavior - Money monthly spent on food at other stores
Consumer Behavior - Money monthly spent on eating out
Consumer Behavior - Money monthly spent on carryout/delivered foods
Consumer Behavior - Income spent on food at supermarket/grocery store (%)
Consumer Behavior - Income spent on food at other stores (%)
Consumer Behavior - Income spent on eating out (%)
Consumer Behavior - Income spent on carryout/delivered foods (%)
Current Health Status - General health condition (%)
Current Health Status - Blood donors (%)
Current Health Status - Has blood ever tested for HIV virus (%)
Current Health Status - Left-handed people (%)
Dermatology - People using sunscreen (%)
Diabetes - Diabetics (%)
Diabetes - Had a blood test for high blood sugar (%)
Diabetes - People taking insulin (%)
Diet Behavior & Nutrition - Diet health (%)
Diet Behavior & Nutrition - Milk product consumption (# of products/month)
Diet Behavior & Nutrition - Meals not home prepared (#/week)
Diet Behavior & Nutrition - Meals from fast food or pizza place (#/week)
Diet Behavior & Nutrition - Ready-to-eat foods (#/month)
Diet Behavior & Nutrition - Frozen meals/pizza (#/month)
Drug Use - People that ever used marijuana or hashish (%)
Drug Use - Ever used hard drugs (%)
Drug Use - Ever used any form of cocaine (%)
Drug Use - Ever used heroin (%)
Drug Use - Ever used methamphetamine (%)
Health Insurance - People covered by health insurance (%)
Kidney Conditions-Urology - Avg. # of times urinating at night
Medical Conditions - People with asthma (%)
Medical Conditions - People with anemia (%)
Medical Conditions - People with psoriasis (%)
Medical Conditions - People with overweight (%)
Medical Conditions - Elderly people having difficulties in thinking or remembering (%)
Medical Conditions - People who ever received blood transfusion (%)
Medical Conditions - People having trouble seeing even with glass/contacts (%)
Medical Conditions - People with arthritis (%)
Medical Conditions - People with gout (%)
Medical Conditions - People with congestive heart failure (%)
Medical Conditions - People with coronary heart disease (%)
Medical Conditions - People with angina pectoris (%)
Medical Conditions - People who ever had heart attack (%)
Medical Conditions - People who ever had stroke (%)
Medical Conditions - People with emphysema (%)
Medical Conditions - People with thyroid problem (%)
Medical Conditions - People with chronic bronchitis (%)
Medical Conditions - People with any liver condition (%)
Medical Conditions - People who ever had cancer or malignancy (%)
Mental Health - People who have little interest in doing things (%)
Mental Health - People feeling down, depressed, or hopeless (%)
Mental Health - People who have trouble sleeping or sleeping too much (%)
Mental Health - People feeling tired or having little energy (%)
Mental Health - People with poor appetite or overeating (%)
Mental Health - People feeling bad about themself (%)
Mental Health - People who have trouble concentrating on things (%)
Mental Health - People moving or speaking slowly or too fast (%)
Mental Health - People having thoughts they would be better off dead (%)
Oral Health - Average years since last visit a dentist
Oral Health - People embarrassed because of mouth (%)
Oral Health - People with gum disease (%)
Oral Health - General health of teeth and gums (%)
Oral Health - Average days a week using dental floss/device
Oral Health - Average days a week using mouthwash for dental problem
Oral Health - Average number of teeth
Pesticide Use - Households using pesticides to control insects (%)
Pesticide Use - Households using pesticides to kill weeds (%)
Physical Activity - People doing vigorous-intensity work activities (%)
Physical Activity - People doing moderate-intensity work activities (%)
Physical Activity - People walking or bicycling (%)
Physical Activity - People doing vigorous-intensity recreational activities (%)
Physical Activity - People doing moderate-intensity recreational activities (%)
Physical Activity - Average hours a day doing sedentary activities
Physical Activity - Average hours a day watching TV or videos
Physical Activity - Average hours a day using computer
Physical Functioning - People having limitations keeping them from working (%)
Physical Functioning - People limited in amount of work they can do (%)
Physical Functioning - People that need special equipment to walk (%)
Physical Functioning - People experiencing confusion/memory problems (%)
Physical Functioning - People requiring special healthcare equipment (%)
Prescription Medications - Average number of prescription medicines taking
Preventive Aspirin Use - Adults 40+ taking low-dose aspirin (%)
Reproductive Health - Vaginal deliveries (%)
Reproductive Health - Cesarean deliveries (%)
Reproductive Health - Deliveries resulted in a live birth (%)
Reproductive Health - Pregnancies resulted in a delivery (%)
Reproductive Health - Women breastfeeding newborns (%)
Reproductive Health - Women that had a hysterectomy (%)
Reproductive Health - Women that had both ovaries removed (%)
Reproductive Health - Women that have ever taken birth control pills (%)
Reproductive Health - Women taking birth control pills (%)
Reproductive Health - Women that have ever used Depo-Provera or injectables (%)
Reproductive Health - Women that have ever used female hormones (%)
Sexual Behavior - People 18+ that ever had sex (vaginal, anal, or oral) (%)
Sexual Behavior - Males 18+ that ever had vaginal sex with a woman (%)
Sexual Behavior - Males 18+ that ever performed oral sex on a woman (%)
Sexual Behavior - Males 18+ that ever had anal sex with a woman (%)
Sexual Behavior - Males 18+ that ever had any sex with a man (%)
Sexual Behavior - Females 18+ that ever had vaginal sex with a man (%)
Sexual Behavior - Females 18+ that ever performed oral sex on a man (%)
Sexual Behavior - Females 18+ that ever had anal sex with a man (%)
Sexual Behavior - Females 18+ that ever had any kind of sex with a woman (%)
Sexual Behavior - Average age people first had sex
Sexual Behavior - Average number of female sex partners in lifetime (males 18+)
Sexual Behavior - Average number of female vaginal sex partners in lifetime (males 18+)
Sexual Behavior - Average age people first performed oral sex on a woman (18+)
Sexual Behavior - Average number of woman performed oral sex on in lifetime (18+)
Sexual Behavior - Average number of male sex partners in lifetime (males 18+)
Sexual Behavior - Average number of male anal sex partners in lifetime (males 18+)
Sexual Behavior - Average age people first performed oral sex on a man (18+)
Sexual Behavior - Average number of male oral sex partners in lifetime (18+)
Sexual Behavior - People using protection when performing oral sex (%)
Sexual Behavior - Average number of times people have vaginal or anal sex a year
Sexual Behavior - People having sex without condom (%)
Sexual Behavior - Average number of male sex partners in lifetime (females 18+)
Sexual Behavior - Average number of male vaginal sex partners in lifetime (females 18+)
Sexual Behavior - Average number of female sex partners in lifetime (females 18+)
Sexual Behavior - Circumcised males 18+ (%)
Sleep Disorders - Average hours sleeping at night
Sleep Disorders - People that has trouble sleeping (%)
Smoking-Cigarette Use - People smoking cigarettes (%)
Taste & Smell - People 40+ having problems with smell (%)
Taste & Smell - People 40+ having problems with taste (%)
Taste & Smell - People 40+ that ever had wisdom teeth removed (%)
Taste & Smell - People 40+ that ever had tonsils teeth removed (%)
Taste & Smell - People 40+ that ever had a loss of consciousness because of a head injury (%)
Taste & Smell - People 40+ that ever had a broken nose or other serious injury to face or skull (%)
Taste & Smell - People 40+ that ever had two or more sinus infections (%)
Weight - Average height (inches)
Weight - Average weight (pounds)
Weight - Average BMI
Weight - People that are obese (%)
Weight - People that ever were obese (%)
Weight - People trying to lose weight (%)
100%
urban population.
Estimated median house/condo value in 2022: $230,848
19150:
$230,848Pennsylvania:
$245,500
According to our research of Pennsylvania and other state lists, there were 38 registered sex offenders living in 19150 zip code as of April 26, 2024 . The ratio of all residents to sex offenders in zip code 19150 is 651 to 1.The ratio of registered sex offenders to all residents in this zip code is near the state average.
Median resident age: This zip code:
41.6 yearsPennsylvania median age:
40.9 years
Average household size: This zip code:
2.3 peoplePennsylvania:
2.4 people
Averages for the 2020 tax year for zip code 19150, filed in 2021:
Average Adjusted Gross Income (AGI) in 2020: $46,890 (Individual Income Tax Returns) Here:
$46,890State:
$75,707
Salary/wage: $43,752 (reported on 77.7% of returns )Here:
$43,752State:
$62,806
(% of AGI for various income ranges: 916.8% for AGIs below $25k , 3298.5% for AGIs $25k-50k , 6179.1% for AGIs $50k-75k , 9240.4% for AGIs $75k-100k , 15922.0% for AGIs $100k-200k , 56000.0% for AGIs over 200k ) Taxable interest for individuals: $411 (reported on 18.5% of returns )This zip code:
$411Pennsylvania:
$1,633
(% of AGI for various income ranges: 4.4% for AGIs below $25k , 4.5% for AGIs $25k-50k , 12.6% for AGIs $50k-75k , 24.6% for AGIs $75k-100k , 39.2% for AGIs $100k-200k , 65.0% for AGIs over 200k ) Ordinary dividends: $1,094 (reported on 6.2% of returns )(% of AGI for various income ranges: 4.9% for AGIs below $25k , 2.1% for AGIs $25k-50k , 11.9% for AGIs $50k-75k , 12.6% for AGIs $75k-100k , 54.4% for AGIs $100k-200k ) Net capital gain/loss in AGI: +$3,538 (reported on 4.4% of returns )Here:
+$3,538State:
+$23,522
(% of AGI for various income ranges: 4.0% for AGIs below $25k , 4.6% for AGIs $25k-50k , 22.8% for AGIs $50k-75k , 35.5% for AGIs $75k-100k , 166.9% for AGIs $100k-200k ) Profit/loss from business: +$2,070 (reported on 11.9% of returns )Here:
+$2,070State:
+$16,274
(% of AGI for various income ranges: 22.1% for AGIs below $25k , 17.1% for AGIs $25k-50k , 22.6% for AGIs $50k-75k , 35.9% for AGIs $75k-100k , 194.2% for AGIs $100k-200k ) Taxable individual retirement arrangement distribution: $9,705 (reported on 5.9% of returns )19150:
$9,705Pennsylvania:
$18,583
(% of AGI for various income ranges: 30.5% for AGIs below $25k , 46.2% for AGIs $25k-50k , 79.5% for AGIs $50k-75k , 162.9% for AGIs $75k-100k , 339.3% for AGIs $100k-200k ) Total itemized deductions: $25,022 (reported on 11.3% of returns )Here:
$25,022State:
$34,850
(% of AGI for various income ranges: 32.9% for AGIs below $25k , 189.9% for AGIs $25k-50k , 583.8% for AGIs $50k-75k , 977.5% for AGIs $75k-100k , 1528.5% for AGIs $100k-200k , 4625.0% for AGIs over 200k ) Charity contributions: $8,614 (reported on 10.1% of returns )(% of AGI for various income ranges: 5.6% for AGIs below $25k , 52.7% for AGIs $25k-50k , 175.2% for AGIs $50k-75k , 297.8% for AGIs $75k-100k , 529.3% for AGIs $100k-200k , 1845.0% for AGIs over 200k ) Taxes paid: $6,899 (reported on 11.1% of returns )(% of AGI for various income ranges: 4.1% for AGIs below $25k , 37.6% for AGIs $25k-50k , 149.6% for AGIs $50k-75k , 312.1% for AGIs $75k-100k , 494.4% for AGIs $100k-200k , 925.0% for AGIs over 200k ) Earned income credit: $1,952 (reported on 16.6% of returns )(% of AGI for various income ranges: 72.9% for AGIs below $25k , 53.1% for AGIs $25k-50k ) Percentage of individuals using paid preparers for their 2020 taxes: 88.9%(% for various income ranges: 90.3% for AGIs below $25k , 89.6% for AGIs $25k-50k , 87.3% for AGIs $50k-75k , 86.6% for AGIs $75k-100k , 85.6% for AGIs $100k-200k , 100.0% for AGIs over 200k )
Averages for the 2012 tax year for zip code 19150, filed in 2013:
Average Adjusted Gross Income (AGI) in 2012: $40,223 (Individual Income Tax Returns) Here:
$40,223State:
$61,346
Salary/wage: $36,635 (reported on 80.6% of returns )Here:
$36,635State:
$51,902
(% of AGI for various income ranges: 66.0% for AGIs below $25k , 76.5% for AGIs $25k-50k , 75.6% for AGIs $50k-75k , 72.1% for AGIs $75k-100k , 74.6% for AGIs $100k-200k , 43.5% for AGIs over 200k ) Taxable interest for individuals: $501 (reported on 19.4% of returns )This zip code:
$501Pennsylvania:
$1,588
(% of AGI for various income ranges: 0.4% for AGIs below $25k , 0.2% for AGIs $25k-50k , 0.3% for AGIs $50k-75k , 0.1% for AGIs $75k-100k , 0.2% for AGIs $100k-200k ) Ordinary dividends: $953 (reported on 6.8% of returns )(% of AGI for various income ranges: 0.4% for AGIs below $25k , 0.1% for AGIs $25k-50k , 0.1% for AGIs $50k-75k , 0.2% for AGIs $75k-100k , 0.1% for AGIs $100k-200k ) Net capital gain/loss in AGI: +$363 (reported on 3.5% of returns )Profit/loss from business: +$5,279 (reported on 9.6% of returns )Here:
+$5,279State:
+$16,268
(% of AGI for various income ranges: 5.6% for AGIs below $25k , 0.6% for AGIs $25k-50k , 0.9% for AGIs $50k-75k , 0.6% for AGIs $75k-100k , 0.4% for AGIs $100k-200k ) Taxable individual retirement arrangement distribution: $12,756 (reported on 7.4% of returns )19150:
$12,756Pennsylvania:
$14,550
(% of AGI for various income ranges: 1.9% for AGIs below $25k , 1.5% for AGIs $25k-50k , 2.1% for AGIs $50k-75k , 2.0% for AGIs $75k-100k , 5.2% for AGIs $100k-200k ) Total itemized deductions: $16,709 (27% of AGI, reported on 36.9% of returns )Here:
$16,709State:
$23,538
Here:
26.9% of AGIState:
18.4% of AGI
(% of AGI for various income ranges: 9.4% for AGIs below $25k , 13.3% for AGIs $25k-50k , 18.7% for AGIs $50k-75k , 17.2% for AGIs $75k-100k , 16.7% for AGIs $100k-200k , 10.4% for AGIs over 200k ) Charity contributions: $3,981 (reported on 31.5% of returns )(% of AGI for various income ranges: 1.3% for AGIs below $25k , 2.6% for AGIs $25k-50k , 3.7% for AGIs $50k-75k , 3.9% for AGIs $75k-100k , 3.8% for AGIs $100k-200k , 3.0% for AGIs over 200k ) Taxes paid: $5,632 (reported on 36.6% of returns )(% of AGI for various income ranges: 2.3% for AGIs below $25k , 4.0% for AGIs $25k-50k , 6.1% for AGIs $50k-75k , 6.3% for AGIs $75k-100k , 6.8% for AGIs $100k-200k , 4.1% for AGIs over 200k ) Earned income credit: $2,092 (reported on 22.2% of returns )(% of AGI for various income ranges: 7.1% for AGIs below $25k , 0.9% for AGIs $25k-50k ) Percentage of individuals using paid preparers for their 2012 taxes: 44.1%(% for various income ranges: 41.8% for AGIs below $25k , 40.9% for AGIs $25k-50k , 48.5% for AGIs $50k-75k , 51.7% for AGIs $75k-100k , 54.8% for AGIs $100k-200k , 66.7% for AGIs over 200k )
Averages for the 2004 tax year for zip code 19150, filed in 2005:
Average Adjusted Gross Income (AGI) in 2004: $35,827 (Individual Income Tax Returns) Here:
$35,827State:
$48,049
Salary/wage: $33,890 (reported on 87.4% of returns )Here:
$33,890State:
$42,646
(% of AGI for various income ranges: 83.1% for AGIs below $10k , 76.0% for AGIs $10k-25k , 84.9% for AGIs $25k-50k , 84.3% for AGIs $50k-75k , 82.0% for AGIs $75k-100k , 79.9% for AGIs over 100k ) Taxable interest for individuals: $621 (reported on 27.9% of returns )This zip code:
$621Pennsylvania:
$1,657
(% of AGI for various income ranges: 1.5% for AGIs below $10k , 0.6% for AGIs $10k-25k , 0.4% for AGIs $25k-50k , 0.6% for AGIs $50k-75k , 0.5% for AGIs $75k-100k , 0.3% for AGIs over 100k ) Taxable dividends: $638 (reported on 8.9% of returns )(% of AGI for various income ranges: 0.6% for AGIs below $10k , 0.2% for AGIs $10k-25k , 0.1% for AGIs $25k-50k , 0.1% for AGIs $50k-75k , 0.1% for AGIs $75k-100k , 0.2% for AGIs over 100k ) Net capital gain/loss: +$1,173 (reported on 5.0% of returns )Here:
+$1,173State:
+$9,716
(% of AGI for various income ranges: -0.0% for AGIs below $10k , -0.0% for AGIs $10k-25k , 0.2% for AGIs $25k-50k , 0.1% for AGIs $50k-75k , 0.5% for AGIs $75k-100k , 0.2% for AGIs over 100k ) Profit/loss from business: +$3,193 (reported on 7.4% of returns )Here:
+$3,193State:
+$14,267
(% of AGI for various income ranges: 4.4% for AGIs below $10k , 1.9% for AGIs $10k-25k , 0.4% for AGIs $25k-50k , 0.6% for AGIs $50k-75k , 0.4% for AGIs $75k-100k , 0.1% for AGIs over 100k ) IRA payment deduction: $1,791 (reported on 1.7% of returns )19150:
$1,791Pennsylvania:
$2,903
Total itemized deductions: $14,993 (28% of AGI, reported on 42.5% of returns )Here:
$14,993State:
$18,804
Here:
27.9% of AGIState:
19.5% of AGI
(% of AGI for various income ranges: 8.1% for AGIs below $10k , 11.7% for AGIs $10k-25k , 17.4% for AGIs $25k-50k , 20.9% for AGIs $50k-75k , 19.8% for AGIs $75k-100k , 17.9% for AGIs over 100k ) Charity contributions deductions: $3,826 (7% of AGI, reported on 39.5% of returns )Here:
7.0% of AGIState:
3.3% of AGI
(% of AGI for various income ranges: 1.0% for AGIs below $10k , 2.3% for AGIs $10k-25k , 3.9% for AGIs $25k-50k , 5.0% for AGIs $50k-75k , 5.3% for AGIs $75k-100k , 4.7% for AGIs over 100k ) Total tax: $4,048 (reported on 72.2% of returns )(% of AGI for various income ranges: 1.7% for AGIs below $10k , 3.1% for AGIs $10k-25k , 6.3% for AGIs $25k-50k , 9.4% for AGIs $50k-75k , 10.7% for AGIs $75k-100k , 14.6% for AGIs over 100k ) Earned income credit: $1,658 (reported on 20.4% of returns )Percentage of individuals using paid preparers for their 2004 taxes: 51.7%(% for various income ranges: 46.9% for AGIs below $10k , 55.4% for AGIs $10k-25k , 50.3% for AGIs $25k-50k , 52.8% for AGIs $50k-75k , 54.1% for AGIs $75k-100k , 54.2% for AGIs over 100k )
Estimated median household income in 2022: This zip code:
$58,427Pennsylvania:
$71,798
Nearest zip codes: 19138 ,
19095 ,
19119 ,
19038 ,
19126 ,
19144 .
Wyndmoor Zip Code Map
Percentage of family households: This zip code:
34.1%Pennsylvania:
42.6%
Percentage of households with unmarried partners: This zip code:
2.0%Pennsylvania:
46.5%
Likely homosexual households (counted as self-reported same-sex unmarried-partner households)
Lesbian couples: 0.1% of all households Gay men: 0.0% of all households
Household received Food Stamps/SNAP in the past 12 months: 1,670Household did not receive Food Stamps/SNAP in the past 12 months: 8,386
Women who had a birth in the past 12 months: 83 (7 now married , 65 unmarried) Women who did not have a birth in the past 12 months: 4,948 (1,181 now married , 3,795 unmarried)
Housing units in zip code 19150 with a mortgage: 5,099 (519
second mortgage , 67
home equity loan , 347
both second mortgage and home equity loan )
Houses without a mortgage: 280
Median monthly owner costs for units with a mortgage: $1,401
Median monthly owner costs for units without a mortgage: $537
Residents with income below the poverty level in 2022:
This zip code:
12.8%Whole state:
11.8%
Residents with income below 50% of the poverty level in 2022:
This zip code:
4.6%Whole state:
6.1%
Median number of rooms in houses and condos: Median number of rooms in apartments:
Year house built (houses)
0 2020 or later40 2010 to 2019228 2000 to 2009165 1990 to 1999228 1980 to 1989548 1970 to 19791,068 1960 to 19695,285 1950 to 19591,813 1940 to 19491,131 1939 or earlier
Zip code 19150 household income distribution in 2022 795 Less than $10,000412 $10,000 to $14,999461 $15,000 to $19,999357 $20,000 to $24,999432 $25,000 to $29,999530 $30,000 to $34,999391 $35,000 to $39,999434 $40,000 to $44,999228 $45,000 to $49,9991,091 $50,000 to $59,9991,341 $60,000 to $74,9991,156 $75,000 to $99,9991,348 $100,000 to $124,999431 $125,000 to $149,999278 $150,000 to $199,999428 $200,000 or moreEstimate of home value of owner-occupied houses/condos in 2022 in zip code 19150 43 Less than $10,00067 $10,000 to $14,99984 $15,000 to $19,99981 $20,000 to $24,99910 $25,000 to $29,99910 $30,000 to $34,9991 $35,000 to $39,99948 $50,000 to $59,99962 $70,000 to $79,99975 $80,000 to $89,99943 $90,000 to $99,999410 $100,000 to $124,999379 $125,000 to $149,999539 $150,000 to $174,9991,148 $175,000 to $199,9992,549 $200,000 to $249,999920 $250,000 to $299,9991,068 $300,000 to $399,99971 $400,000 to $499,99987 $500,000 to $749,9993 $750,000 to $999,9998 $1,000,000 to $1,499,99915 $2,000,000 or moreRent paid by renters in 2022 in zip code 19150 7 Less than $10014 $400 to $44983 $600 to $6494 $650 to $69940 $750 to $799142 $800 to $899345 $900 to $999939 $1,000 to $1,249165 $1,250 to $1,499101 $1,500 to $1,99960 No cash rent
Median gross rent in 2022: $1,285.
Median price asked for vacant for-sale houses and condos in 2022: $298,684.
Estimated median house (or condo) value in 2022 for: White Non-Hispanic householders: $201,080Black or African American householders: $230,544American Indian or Alaska Native householders: $167,061Asian householders: $569,526Some other race householders: $83,530Two or more races householders: $210,800Hispanic or Latino householders: $183,463Estimated median house or condo value in 2022: $230,848
19150:
$230,848Pennsylvania:
$245,500
Lower value quartile - upper value quartile: $191,500 - $267,406
Mean price in 2022: Detached houses: $382,521Here:
$382,521State:
$317,202
Townhouses or other attached units: $260,733Here:
$260,733State:
$254,369
In 2-unit structures: $270,436Here:
$270,436State:
$249,182
In 3-to-4-unit structures: $324,453Here:
$324,453State:
$297,446
In 5-or-more-unit structures: $444,254Here:
$444,254State:
$320,068
Mobile homes: $57,703Here:
$57,703State:
$92,414
Occupied boats, RVs, vans, etc.: $424,146Here:
$424,146State:
$563,750
Housing units in structures:
One, detached: 1,324One, attached: 7,446Two: 1,2293 or 4: 2525 to 9: 910 to 19: 4720 to 49: 10550 or more: 148Mobile homes: 21Boats, RVs, vans, etc.: 18Unemployment : 9.0%
Means of transportation to work in zip code 19150 54.8% 5,633 Drove a car alone9.2% 947 Carpooled7.6% 783 Bus or trolley bus2.9% 301 Streetcar or trolley car2.8% 286 Subway or elevated1.0% 104 Railroad0.6% 58 Taxi0.7% 73 Walked1.3% 131 Other means16.8% 1,727 Worked at homeTravel time to work (commute) in zip code 19150 23 Less than 5 minutes80 5 to 9 minutes363 10 to 14 minutes722 15 to 19 minutes920 20 to 24 minutes575 25 to 29 minutes2,265 30 to 34 minutes353 35 to 39 minutes682 40 to 44 minutes1,250 45 to 59 minutes932 60 to 89 minutes426 90 or more minutes
Neighborhoods in zip code 19150: Percentage of zip code residents living and working in this county: 70.5%
Household type by relationship:
Households: 22,901
Male householders: 3,510 (1,436 living alone ), Female householders: 6,569 (2,663 living alone )2,701 spouses (2,657 opposite-sex spouses ), 402 unmarried partners , (402 opposite-sex unmarried partners ), 6,391 children (6,108 natural , 0 adopted , 287 stepchildren ), 1,895 grandchildren , 220 brothers or sisters , 317 parents , 30 foster children , 439 other relatives , 380 non-relatives In group quarters: 30 (-1 institutionalized population )
Size of family households: 2,925 2-persons , 1,297 3-persons , 791 4-persons , 493 5-persons , 111 6-persons , 127 7-or-more-persons
Size of nonfamily households: 4,098 1-person , 178 2-persons , 15 4-persons
1,237 married couples with children. single-parent households (266 men , 1,126 women ).
92.3% of residents of 19150 zip code speak English at home. of residents speak Spanish at home (38% very well, 42% well, 15% not well, 5% not at all ).of residents speak other Indo-European language at home (89% very well, 8% well, 3% not well ).of residents speak Asian or Pacific Island language at home (22% very well, 78% not well ).of residents speak other language at home (74% very well, 26% well ).
Foreign born population: 1,640 (7.2%)
(43.4%
of them are naturalized citizens )
This zip code:
7.2%Whole state:
7.5%
26% Haiti 25% Grenada 6% St. Vincent and the Grenadines 4% Dominica 4% Bahamas 3% West Indies 3% Ecuador 3% Haitian 2% Portuguese 1% Jamaican 1% American 1% African 1% West Indian 0% Irish
Year of entry for the foreign-born population
1,009 2010 or later 385 2000 to 2009 159 1990 to 1999 409 Before 1990
There are
58 Medical Specialists in Zip Code 19150 .
Facilities with environmental interests located in this zip code:
BILMORE ONE HR CLNR (1519 E WADSWORTH AVE in PHILADELPHIA, PA)
STATE MASTER (Pennsylvania database) - RCRIS-PAD101428019, HAZARDOUS WASTE PROGRAM Small Quantity Generators, between 100 kg and 1000 kg of hazardous waste/month (Resource Conservation and Recovery Act (tracking hazardous waste)) - notification Business SIC classification: DRYCLEANING PLANTS, EXCEPT RUG CLEANINGOrganizations: OPERNAME (CONTACT/OPERATOR)
, OWNERNAME (CONTACT/OWNER)
Alternative names: BILMORE ONE HOUR CLEANERS INC
ALMAR FRENCH CLEANERS (7621 OGONTZ AVENUE in PHILADELPHIA, PA)
AIR MINOR (AIRS/AFS) Small Quantity Generators, between 100 kg and 1000 kg of hazardous waste/month (Resource Conservation and Recovery Act (tracking hazardous waste)) - notification Business SIC classification: COIN-OPERATED LAUNDRIES AND DRYCLEANING; DRYCLEANING PLANTS, EXCEPT RUG CLEANINGOrganizations: OPERNAME (CONTACT/OPERATOR)
, EUNICE MOON (CONTACT/OWNER)
Alternative names: ALMAR FRENCH CLNR SVC
ALMO PRINTERS (801 IVY HILL RD in PHILADELPHIA, PA)
Small Quantity Generators, between 100 kg and 1000 kg of hazardous waste/month (Resource Conservation and Recovery Act (tracking hazardous waste)) - notification Business NAICS classification: COMMERCIAL LITHOGRAPHIC PRINTING.Organizations: ALMO PRINTERS INC (CONTACT/OWNER)
Housing units lacking complete plumbing facilities: 0.9%
Housing units lacking complete kitchen facilities: 0.4%
88.2% Utility gas 6.6% Electricity 2.3% Bottled, tank, or LP gas 2.2% Fuel oil, kerosene, etc.
Population in 1990: 27,609.
Place of birth for U.S.-born residents:
This state: 17,301Northeast: 1,026Midwest: 271South: 2,165West: 176
78% of the 19150 zip code residents lived in the same house 5 years ago.
Out of people who lived in different houses, 78% lived in this county.
Out of people who lived in different counties, 50% lived in Pennsylvania.
95% of the 19150 zip code residents lived in the same house 1 year ago.
Out of people who lived in different houses, 72% moved from this county.
Out of people who lived in different houses, 2% moved from different county within same state.
Out of people who lived in different houses, 22% moved from different state.
Out of people who lived in different houses, 8% moved from abroad.
Private vs. public school enrollment:
Students in private schools in grades 1 to 8 (elementary and middle school): 504
Here:
25.5%Pennsylvania:
15.7%
Students in private schools in grades 9 to 12 (high school): 179
Here:
19.7%Pennsylvania:
13.4%
Students in private undergraduate colleges: 240
Here:
37.6%Pennsylvania:
39.8%
Occupation by median earnings in the past 12 months ($)
101,535 Management occupations 84,929 Legal occupations 80,282 Computer and mathematical occupations 78,966 Law enforcement workers including supervisors 62,271 Construction and extraction occupations 62,129 Installation, maintenance, and repair occupations
Companies with federal contracts located in this zip code:
JOHNS LOCK SHOP INC (1546 E WADSWORTH AVE in PHILADELPHIA, PA) in 4 contracts in 2005
$7,318 with U.S. Army Corps of Engineers - civil program financing only for Technical Representation Services -- Service and Trade Equipment. Signed on 2005-07-01. Completion date: 2005-06-22.
with Army for Technical Representation Services -- Service and Trade Equipment. Signed on 2005-07-01. Completion date: 2005-06-22.
with U.S. Army Corps of Engineers - civil program financing only for Technical Representation Services -- Service and Trade Equipment. Signed on 2005-06-06. Completion date: 2005-05-06.
with Army for Technical Representation Services -- Service and Trade Equipment. Signed on 2005-06-06. Completion date: 2005-05-06.
Top industries in this zip code by the number of employees in 2005:
Health Care and Social Assistance: Nursing Care Facilities (100-249 employees: 1 establishment)Accommodation and Food Services: Limited-Service Restaurants (50-99: 1, 10-19: 2, 5-9: 1, 1-4: 14)Other Services (except Public Administration): Religious Organizations (20-49: 3, 5-9: 2, 1-4: 4)Educational Services: Elementary and Secondary Schools (50-99: 1)
People in group quarters in 2010:
6 people in residential treatment centers for adults
3 people in group homes intended for adults
2 people in other noninstitutional facilities
People in group quarters in 2000:
30 people in other group homes
6 people in homes for the mentally retarded
3 people in schools, hospitals, or wards for the intellectually disabled
3 people in other nonhousehold living situations
Fatal accident statistics in 2013:
Fatal accident count: 2Vehicles involved in fatal accidents: 2Fatal accidents caused by drunken drivers: 0Fatalities: 2Persons involved in fatal accidents: 4Pedestrians involved in fatal accidents: 2
Home Mortgage Disclosure Act Aggregated Statistics For Year 2009(Based on 8 full and 4 partial tracts) A) FHA, FSA/RHS & VA B) Conventional C) Refinancings D) Home Improvement Loans F) Non-occupant Loans on G) Loans On Manufactured Number Average Value Number Average Value Number Average Value Number Average Value Number Average Value Number Average Value
LOANS ORIGINATED 191 $145,057 56 $108,133 475 $114,144 83 $27,433 29 $96,296 1 $89,000 APPLICATIONS APPROVED, NOT ACCEPTED 10 $124,852 12 $138,347 65 $121,736 14 $34,816 8 $115,915 0 $0 APPLICATIONS DENIED 39 $137,048 30 $128,151 413 $119,486 194 $24,841 34 $112,779 1 $10,000 APPLICATIONS WITHDRAWN 21 $134,286 17 $110,012 181 $115,508 14 $51,511 15 $87,093 0 $0 FILES CLOSED FOR INCOMPLETENESS 5 $137,898 2 $149,280 42 $145,989 5 $54,192 2 $86,615 0 $0
Aggregated Statistics For Year 2008(Based on 8 full and 4 partial tracts) A) FHA, FSA/RHS & VA B) Conventional C) Refinancings D) Home Improvement Loans E) Loans on Dwellings For 5+ Families F) Non-occupant Loans on G) Loans On Manufactured Number Average Value Number Average Value Number Average Value Number Average Value Number Average Value Number Average Value Number Average Value
LOANS ORIGINATED 137 $148,195 122 $129,737 626 $109,083 200 $41,260 5 $1,523,782 53 $137,786 0 $0 APPLICATIONS APPROVED, NOT ACCEPTED 12 $131,642 25 $126,883 142 $107,766 34 $35,998 0 $0 22 $95,805 0 $0 APPLICATIONS DENIED 25 $138,547 45 $116,872 732 $119,987 355 $36,066 0 $0 74 $89,571 3 $43,357 APPLICATIONS WITHDRAWN 18 $148,452 20 $128,754 250 $118,037 21 $57,893 0 $0 11 $121,001 0 $0 FILES CLOSED FOR INCOMPLETENESS 4 $182,672 8 $114,852 63 $117,406 4 $55,090 0 $0 7 $94,200 0 $0
Aggregated Statistics For Year 2007(Based on 8 full and 4 partial tracts) A) FHA, FSA/RHS & VA B) Conventional C) Refinancings D) Home Improvement Loans E) Loans on Dwellings For 5+ Families F) Non-occupant Loans on G) Loans On Manufactured Number Average Value Number Average Value Number Average Value Number Average Value Number Average Value Number Average Value Number Average Value
LOANS ORIGINATED 60 $145,141 301 $129,083 920 $102,531 259 $39,308 8 $2,912,009 110 $109,020 3 $29,790 APPLICATIONS APPROVED, NOT ACCEPTED 4 $135,690 51 $112,870 216 $95,189 44 $36,858 0 $0 24 $102,913 0 $0 APPLICATIONS DENIED 13 $152,549 127 $108,726 1,036 $114,983 369 $34,524 2 $83,205 121 $100,722 1 $44,090 APPLICATIONS WITHDRAWN 9 $167,458 64 $126,483 457 $112,304 56 $79,926 1 $5,730 32 $104,161 0 $0 FILES CLOSED FOR INCOMPLETENESS 2 $135,590 23 $113,410 119 $126,164 4 $61,725 0 $0 14 $146,044 0 $0
Aggregated Statistics For Year 2006(Based on 8 full and 4 partial tracts) A) FHA, FSA/RHS & VA B) Conventional C) Refinancings D) Home Improvement Loans E) Loans on Dwellings For 5+ Families F) Non-occupant Loans on G) Loans On Manufactured Number Average Value Number Average Value Number Average Value Number Average Value Number Average Value Number Average Value Number Average Value
LOANS ORIGINATED 47 $139,034 522 $110,808 1,246 $96,685 333 $43,255 5 $578,238 186 $103,920 0 $0 APPLICATIONS APPROVED, NOT ACCEPTED 3 $114,000 97 $103,232 281 $97,713 49 $38,426 0 $0 58 $86,568 0 $0 APPLICATIONS DENIED 6 $138,103 190 $96,542 1,071 $98,540 475 $36,630 1 $18,270 116 $95,501 7 $59,913 APPLICATIONS WITHDRAWN 9 $136,741 86 $108,441 546 $100,011 57 $59,150 0 $0 49 $103,195 0 $0 FILES CLOSED FOR INCOMPLETENESS 1 $97,000 27 $102,556 183 $108,304 6 $96,875 0 $0 9 $101,959 1 $28,630
Aggregated Statistics For Year 2005(Based on 8 full and 4 partial tracts) A) FHA, FSA/RHS & VA B) Conventional C) Refinancings D) Home Improvement Loans E) Loans on Dwellings For 5+ Families F) Non-occupant Loans on G) Loans On Manufactured Number Average Value Number Average Value Number Average Value Number Average Value Number Average Value Number Average Value Number Average Value
LOANS ORIGINATED 44 $115,227 462 $99,339 1,124 $86,006 285 $39,086 2 $375,000 162 $92,142 3 $49,953 APPLICATIONS APPROVED, NOT ACCEPTED 6 $110,785 70 $88,011 275 $76,858 50 $31,521 0 $0 31 $92,314 1 $2,860 APPLICATIONS DENIED 6 $119,613 169 $88,370 1,247 $88,781 406 $28,689 0 $0 135 $64,723 8 $49,575 APPLICATIONS WITHDRAWN 0 $0 134 $107,347 615 $89,974 81 $86,875 2 $80,040 49 $100,371 2 $92,000 FILES CLOSED FOR INCOMPLETENESS 0 $0 18 $80,812 264 $95,771 4 $27,945 0 $0 19 $92,819 0 $0
Aggregated Statistics For Year 2004(Based on 8 full and 4 partial tracts) A) FHA, FSA/RHS & VA B) Conventional C) Refinancings D) Home Improvement Loans E) Loans on Dwellings For 5+ Families F) Non-occupant Loans on G) Loans On Manufactured Number Average Value Number Average Value Number Average Value Number Average Value Number Average Value Number Average Value Number Average Value
LOANS ORIGINATED 50 $105,374 356 $90,427 1,135 $77,989 230 $36,202 8 $251,370 146 $80,628 2 $57,000 APPLICATIONS APPROVED, NOT ACCEPTED 10 $104,123 74 $98,336 326 $73,035 63 $36,284 0 $0 33 $81,143 0 $0 APPLICATIONS DENIED 8 $92,186 104 $83,699 1,276 $77,045 428 $28,393 0 $0 127 $50,667 2 $2,985 APPLICATIONS WITHDRAWN 8 $92,585 53 $107,808 558 $77,190 58 $43,403 0 $0 37 $79,427 1 $15,000 FILES CLOSED FOR INCOMPLETENESS 2 $72,360 21 $103,078 300 $85,970 14 $40,549 0 $0 13 $99,236 0 $0
Aggregated Statistics For Year 2003(Based on 8 full and 4 partial tracts) A) FHA, FSA/RHS & VA B) Conventional C) Refinancings D) Home Improvement Loans E) Loans on Dwellings For 5+ Families F) Non-occupant Loans on Number Average Value Number Average Value Number Average Value Number Average Value Number Average Value Number Average Value
LOANS ORIGINATED 108 $90,112 228 $79,009 1,143 $71,359 172 $33,795 1 $676,810 116 $83,900 APPLICATIONS APPROVED, NOT ACCEPTED 11 $89,778 45 $72,142 338 $66,711 83 $26,781 0 $0 32 $60,339 APPLICATIONS DENIED 17 $82,955 94 $80,180 1,400 $73,715 316 $26,674 0 $0 104 $51,393 APPLICATIONS WITHDRAWN 10 $83,796 48 $78,148 495 $72,322 33 $34,018 0 $0 36 $70,121 FILES CLOSED FOR INCOMPLETENESS 1 $84,000 13 $79,962 95 $67,227 7 $26,551 0 $0 12 $71,683
Aggregated Statistics For Year 2002(Based on 7 full and 2 partial tracts) A) FHA, FSA/RHS & VA B) Conventional C) Refinancings D) Home Improvement Loans E) Loans on Dwellings For 5+ Families F) Non-occupant Loans on Number Average Value Number Average Value Number Average Value Number Average Value Number Average Value Number Average Value
LOANS ORIGINATED 82 $89,127 141 $225,222 558 $483,532 92 $28,214 5 $1,389,822 63 $54,276 APPLICATIONS APPROVED, NOT ACCEPTED 3 $45,097 32 $79,368 217 $66,195 23 $31,922 0 $0 8 $67,585 APPLICATIONS DENIED 7 $97,760 51 $66,805 779 $69,438 133 $28,948 0 $0 26 $59,188 APPLICATIONS WITHDRAWN 8 $90,315 24 $616,042 270 $71,349 15 $24,906 2 $1,741,600 13 $61,278 FILES CLOSED FOR INCOMPLETENESS 1 $33,780 15 $71,378 146 $72,022 0 $0 0 $0 2 $44,820
Aggregated Statistics For Year 2001(Based on 7 full and 2 partial tracts) A) FHA, FSA/RHS & VA B) Conventional C) Refinancings D) Home Improvement Loans E) Loans on Dwellings For 5+ Families F) Non-occupant Loans on Number Average Value Number Average Value Number Average Value Number Average Value Number Average Value Number Average Value
LOANS ORIGINATED 126 $80,690 91 $77,606 436 $62,233 87 $22,203 0 $0 34 $60,467 APPLICATIONS APPROVED, NOT ACCEPTED 6 $80,115 36 $64,535 189 $57,663 23 $28,504 1 $75,000 7 $71,809 APPLICATIONS DENIED 7 $97,133 35 $67,879 709 $226,865 168 $20,169 0 $0 27 $72,978 APPLICATIONS WITHDRAWN 15 $78,859 16 $72,093 260 $59,863 36 $28,452 0 $0 6 $92,690 FILES CLOSED FOR INCOMPLETENESS 8 $61,968 5 $68,160 104 $72,545 10 $40,970 0 $0 4 $48,960
Aggregated Statistics For Year 2000(Based on 7 full and 2 partial tracts) A) FHA, FSA/RHS & VA B) Conventional C) Refinancings D) Home Improvement Loans E) Loans on Dwellings For 5+ Families F) Non-occupant Loans on Number Average Value Number Average Value Number Average Value Number Average Value Number Average Value Number Average Value
LOANS ORIGINATED 117 $78,127 123 $66,418 370 $51,899 130 $18,248 0 $0 30 $64,333 APPLICATIONS APPROVED, NOT ACCEPTED 5 $67,558 28 $64,712 154 $59,347 56 $27,306 1 $99,000 9 $70,833 APPLICATIONS DENIED 8 $76,982 56 $64,478 531 $53,706 221 $19,512 0 $0 28 $41,577 APPLICATIONS WITHDRAWN 12 $69,853 20 $69,844 327 $51,672 34 $34,851 0 $0 19 $46,841 FILES CLOSED FOR INCOMPLETENESS 1 $35,500 5 $67,468 53 $60,425 4 $23,725 0 $0 0 $0
Aggregated Statistics For Year 1999(Based on 4 full and 3 partial tracts) A) FHA, FSA/RHS & VA B) Conventional C) Refinancings D) Home Improvement Loans F) Non-occupant Loans on Number Average Value Number Average Value Number Average Value Number Average Value Number Average Value
LOANS ORIGINATED 107 $75,336 96 $62,997 443 $51,258 178 $19,839 23 $50,380 APPLICATIONS APPROVED, NOT ACCEPTED 6 $84,308 28 $64,665 291 $54,607 68 $16,118 11 $54,233 APPLICATIONS DENIED 11 $70,458 81 $63,449 612 $54,008 262 $15,585 33 $58,174 APPLICATIONS WITHDRAWN 10 $80,545 32 $59,958 335 $53,768 44 $32,849 10 $45,880 FILES CLOSED FOR INCOMPLETENESS 1 $44,700 15 $69,753 92 $57,421 2 $9,200 3 $57,767
Private Mortgage Insurance Companies Aggregated Statistics For Year 2009(Based on 8 full and 4 partial tracts) A) Conventional B) Refinancings C) Non-occupant Loans on Number Average Value Number Average Value Number Average Value
LOANS ORIGINATED 22 $144,273 7 $163,660 0 $0 APPLICATIONS APPROVED, NOT ACCEPTED 7 $128,563 4 $155,845 0 $0 APPLICATIONS DENIED 3 $98,713 1 $248,180 0 $0 APPLICATIONS WITHDRAWN 0 $0 0 $0 0 $0 FILES CLOSED FOR INCOMPLETENESS 0 $0 2 $175,155 2 $175,155
Aggregated Statistics For Year 2008(Based on 8 full and 4 partial tracts) A) Conventional B) Refinancings C) Non-occupant Loans on Number Average Value Number Average Value Number Average Value
LOANS ORIGINATED 80 $144,715 26 $143,515 11 $133,212 APPLICATIONS APPROVED, NOT ACCEPTED 28 $122,111 30 $154,649 6 $106,670 APPLICATIONS DENIED 5 $129,508 7 $125,113 1 $123,000 APPLICATIONS WITHDRAWN 1 $170,000 2 $135,500 0 $0 FILES CLOSED FOR INCOMPLETENESS 2 $150,500 0 $0 1 $176,000
Aggregated Statistics For Year 2007(Based on 8 full and 4 partial tracts) A) Conventional B) Refinancings C) Non-occupant Loans on Number Average Value Number Average Value Number Average Value
LOANS ORIGINATED 168 $145,828 62 $139,490 14 $141,539 APPLICATIONS APPROVED, NOT ACCEPTED 30 $149,170 16 $146,498 2 $166,065 APPLICATIONS DENIED 0 $0 1 $149,800 0 $0 APPLICATIONS WITHDRAWN 9 $132,691 7 $133,901 4 $130,898 FILES CLOSED FOR INCOMPLETENESS 1 $143,500 0 $0 1 $70,430
Aggregated Statistics For Year 2006(Based on 8 full and 4 partial tracts) A) Conventional B) Refinancings C) Non-occupant Loans on Number Average Value Number Average Value Number Average Value
LOANS ORIGINATED 136 $138,615 34 $129,810 16 $100,957 APPLICATIONS APPROVED, NOT ACCEPTED 26 $135,985 13 $113,868 3 $123,237 APPLICATIONS DENIED 0 $0 0 $0 0 $0 APPLICATIONS WITHDRAWN 9 $144,123 2 $130,500 0 $0 FILES CLOSED FOR INCOMPLETENESS 0 $0 0 $0 0 $0
Aggregated Statistics For Year 2005(Based on 8 full and 4 partial tracts) A) Conventional B) Refinancings C) Non-occupant Loans on Number Average Value Number Average Value Number Average Value
LOANS ORIGINATED 162 $117,273 37 $110,571 16 $109,258 APPLICATIONS APPROVED, NOT ACCEPTED 23 $129,978 14 $92,912 4 $69,680 APPLICATIONS DENIED 1 $135,880 0 $0 1 $135,880 APPLICATIONS WITHDRAWN 10 $108,551 3 $111,897 1 $119,000 FILES CLOSED FOR INCOMPLETENESS 2 $113,710 0 $0 1 $80,160
Aggregated Statistics For Year 2004(Based on 8 full and 4 partial tracts) A) Conventional B) Refinancings C) Non-occupant Loans on Number Average Value Number Average Value Number Average Value
LOANS ORIGINATED 144 $102,745 58 $89,116 14 $95,176 APPLICATIONS APPROVED, NOT ACCEPTED 28 $103,829 15 $75,805 4 $53,485 APPLICATIONS DENIED 1 $117,750 1 $33,780 0 $0 APPLICATIONS WITHDRAWN 11 $91,748 11 $86,347 2 $61,195 FILES CLOSED FOR INCOMPLETENESS 3 $82,097 1 $90,000 2 $73,645
Aggregated Statistics For Year 2003(Based on 8 full and 4 partial tracts) A) Conventional B) Refinancings C) Non-occupant Loans on Number Average Value Number Average Value Number Average Value
LOANS ORIGINATED 115 $84,052 70 $86,586 13 $79,567 APPLICATIONS APPROVED, NOT ACCEPTED 12 $87,226 10 $68,969 0 $0 APPLICATIONS DENIED 3 $93,663 3 $70,220 3 $70,887 APPLICATIONS WITHDRAWN 2 $74,810 3 $89,960 0 $0 FILES CLOSED FOR INCOMPLETENESS 0 $0 1 $73,000 0 $0
Aggregated Statistics For Year 2002(Based on 7 full and 2 partial tracts) A) Conventional B) Refinancings C) Non-occupant Loans on Number Average Value Number Average Value Number Average Value
LOANS ORIGINATED 73 $91,331 28 $82,168 7 $81,753 APPLICATIONS APPROVED, NOT ACCEPTED 12 $103,996 11 $88,969 1 $90,000 APPLICATIONS DENIED 1 $79,000 5 $104,784 0 $0 APPLICATIONS WITHDRAWN 6 $92,773 4 $71,655 1 $92,000 FILES CLOSED FOR INCOMPLETENESS 1 $103,070 0 $0 0 $0
Aggregated Statistics For Year 2001(Based on 7 full and 2 partial tracts) A) Conventional B) Refinancings C) Non-occupant Loans on Number Average Value Number Average Value Number Average Value
LOANS ORIGINATED 48 $85,773 24 $81,430 6 $58,862 APPLICATIONS APPROVED, NOT ACCEPTED 5 $97,888 8 $95,814 0 $0 APPLICATIONS DENIED 2 $61,700 1 $153,000 0 $0 APPLICATIONS WITHDRAWN 0 $0 2 $66,680 0 $0 FILES CLOSED FOR INCOMPLETENESS 0 $0 1 $41,230 0 $0
Aggregated Statistics For Year 2000(Based on 7 full and 2 partial tracts) A) Conventional B) Refinancings C) Non-occupant Loans on Number Average Value Number Average Value Number Average Value
LOANS ORIGINATED 37 $78,254 18 $73,961 3 $66,000 APPLICATIONS APPROVED, NOT ACCEPTED 10 $74,498 8 $65,451 0 $0 APPLICATIONS DENIED 1 $158,040 1 $170,000 0 $0 APPLICATIONS WITHDRAWN 4 $86,078 0 $0 0 $0 FILES CLOSED FOR INCOMPLETENESS 0 $0 0 $0 0 $0
Aggregated Statistics For Year 1999(Based on 4 full and 3 partial tracts) A) Conventional B) Refinancings C) Non-occupant Loans on Number Average Value Number Average Value Number Average Value
LOANS ORIGINATED 33 $68,712 45 $61,625 4 $46,758 APPLICATIONS APPROVED, NOT ACCEPTED 2 $66,585 12 $81,028 0 $0 APPLICATIONS DENIED 4 $69,632 6 $86,328 1 $77,000 APPLICATIONS WITHDRAWN 1 $143,980 0 $0 0 $0 FILES CLOSED FOR INCOMPLETENESS 3 $70,317 1 $66,830 1 $54,040
2010 - 2018 National Fire Incident Reporting System (NFIRS) incidents See full 2006 National Fire Incident Reporting System statistics for zip code 19150, Pennsylvania
Most common first names in zip code 19150 among deceased individuals Name Count Lived (average)
John 184 70.7 years William 180 72.7 years Mary 177 77.8 years James 172 69.0 years Joseph 131 73.8 years Charles 108 70.2 years Robert 104 70.3 years Anna 93 81.3 years Helen 85 77.1 years George 84 73.5 years
Most common last names in zip code 19150 among deceased individuals Last name Count Lived (average)
Williams 94 73.1 years Smith 72 70.8 years Johnson 68 72.1 years Brown 68 71.6 years Jones 58 68.2 years Davis 56 72.2 years Wilson 49 72.9 years Robinson 39 71.6 years Jackson 38 78.1 years Thomas 33 70.0 years
Businesses in zip code 19150
Name Count Name Count
7-Eleven 1 McDonald's 1 Baskin-Robbins 1 Nike 6 Bath & Body Works 1 Payless 1 CVS 1 Popeyes 1 Chick-Fil-A 1 RadioShack 1 Church's Chicken 1 Rite Aid 1 Cricket Wireless 2 Sprint Nextel 1 Dunkin Donuts 2 Target 1 FedEx 1 The Room Place 1 Foot Locker 1 Toys"R"Us 1 GNC 1 U-Haul 1 GameStop 1 Value City Furniture 1 Home Depot 1 Wendy's 1 Lane Bryant 1

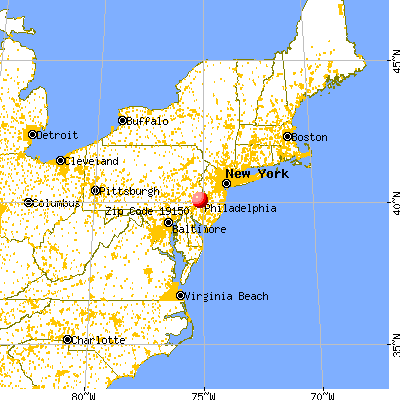

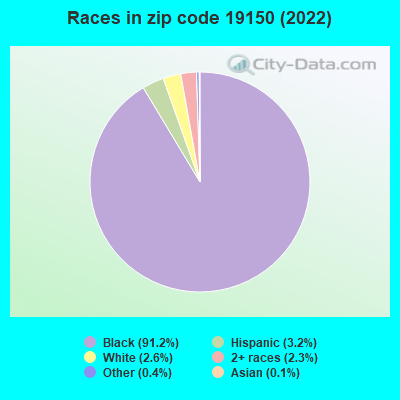


 Nearest zip codes: 19138, 19095, 19119, 19038, 19126, 19144.
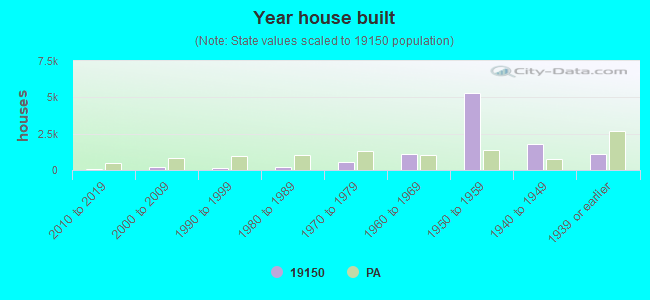

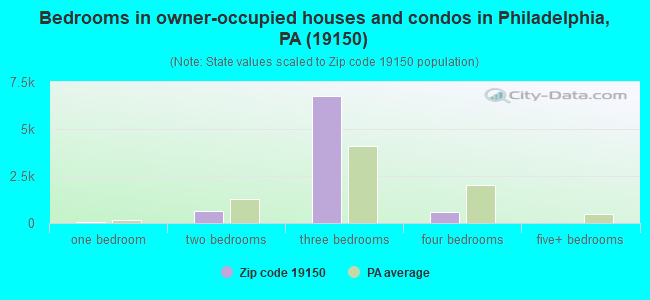


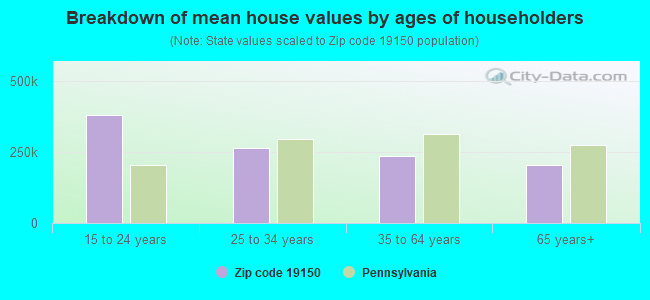


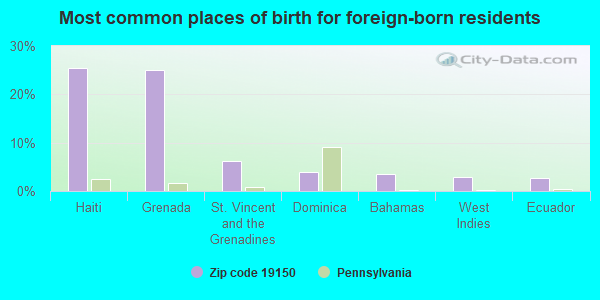
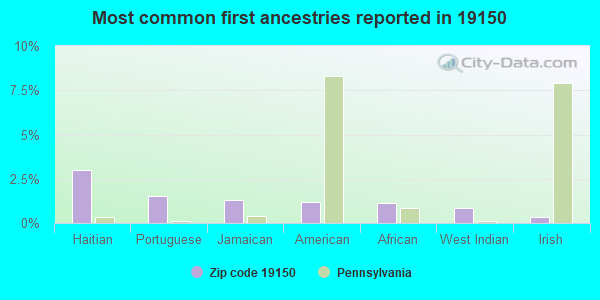
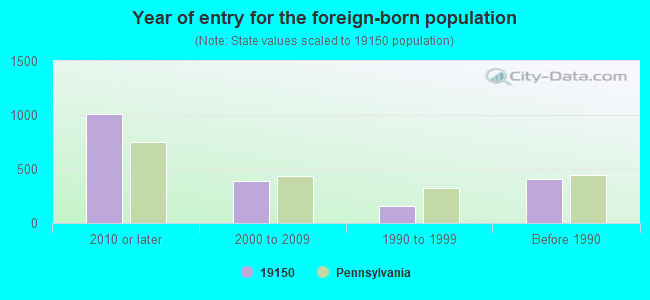


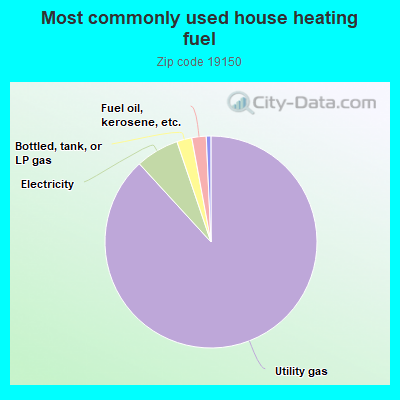
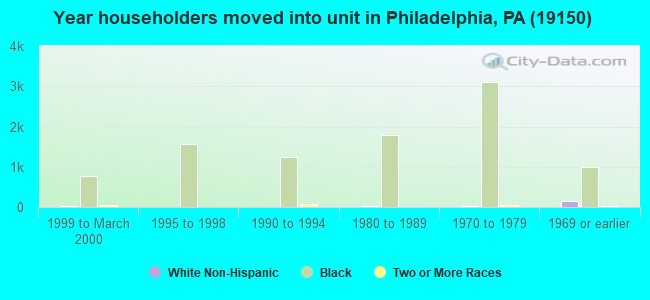
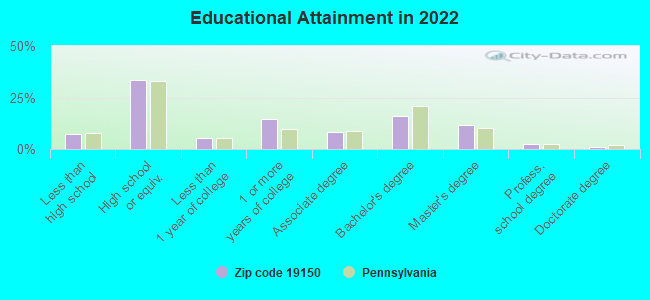
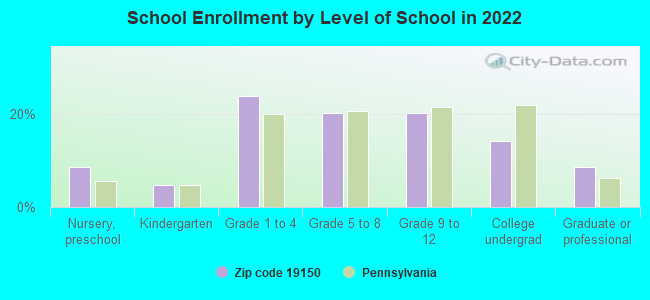
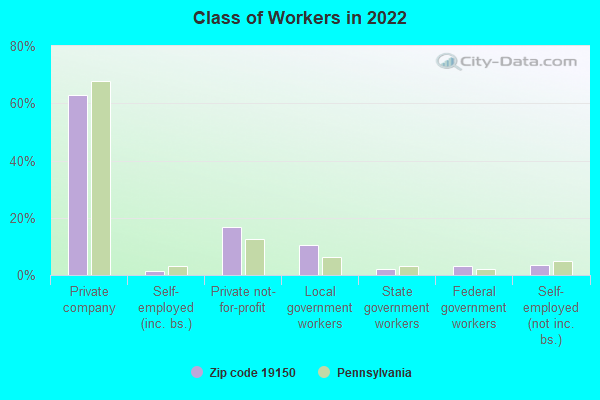
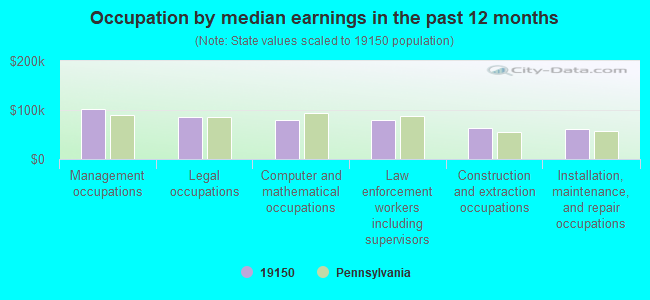
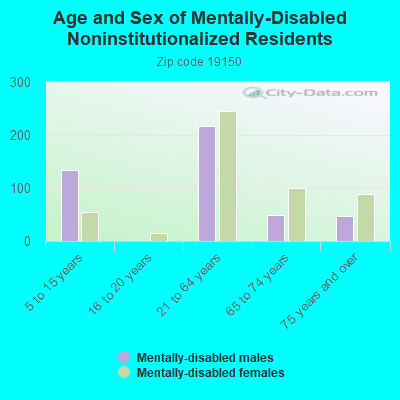
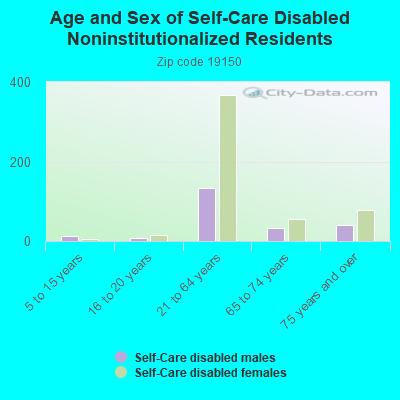
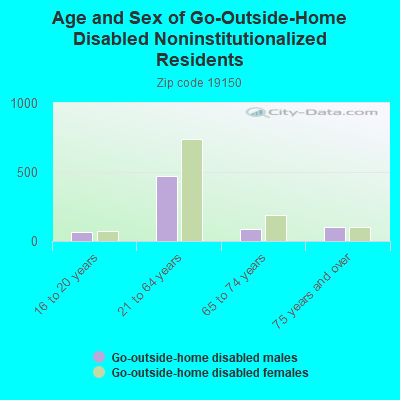
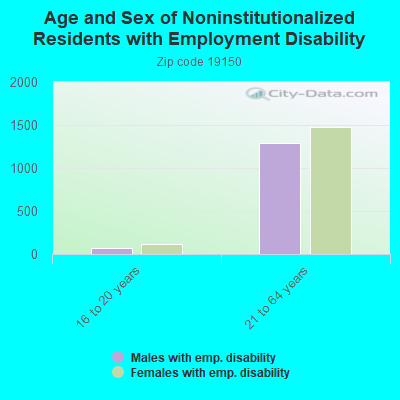
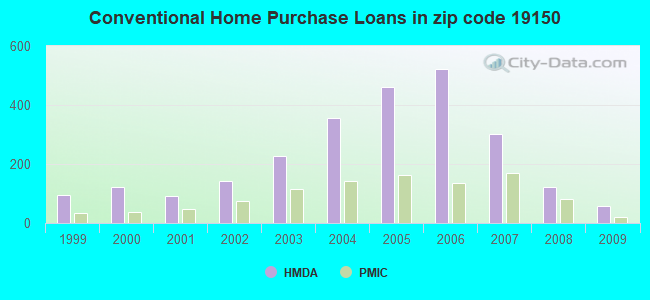
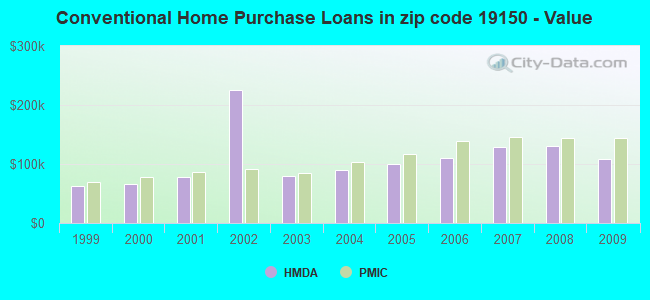
 According to the data from the years 2010 - 2018 the average number of fire incidents per year is 46. The highest number of reported fire incidents - 83 took place in 2018, and the least - 0 in 2016. The data has an increasing trend.
 When looking into fire subcategories, the most reports belonged to: Structure Fires (58.1%), and Outside Fires (22.4%).